

Introduction
Glacier movement is commonly divided into internal deformation and basal motion, the latter comprising basal sliding and bed deformation. These components, however, are not mutually exclusive because stresses within an ice mass continuously adjust to, and feed back into, temporal and spatial variations in basal motion. This dynamic pattern, in turn, directly influences the forces driving basal moi ion. For these reasons, a clear insight into the processes governing a glacier’s internal rheology plays an essential role in the understanding of its associated dynamics. As the stress and strain pattern within a glacier is difficult to measure, particularly at the bed, ice-flow models have been developed to attempt to simulate these patterns.
This study aims to evaluate the applicability and potential of a first-order solution of the equations of ice motion, developed by Reference MullerMuller (1991) and extended to three dimensions by Reference BlatterBlatter (1995), for the computation of the three dimensional stress and strain fields within grounded ice masses. In contrast to previous finite-difference solutions, this model successfully incorporates terms for the computation of longitudinal deviatoric stresses. These stresses become increasingly important at the high resolutions involved in valley-glacier modelling, where tensile and compressive stresses are induced by gradients at the glacier surface, bed and in the basal motion pattern (Reference Kamb and EchelmeyerKamb and Echelmeyer, 1986). Despite these merits, the computational efficiency, performance and ability of Hatter’s (1995) model at simulating glacier flow have yet to be tested against field data. Here, we apply the model in three dimensions to Haul Glacier d’Arolla, Switzerland, both to perform such a test and to provide a basic insight into the processes of glacier dynamics. Specifically, we:
(i) Test the computational performance and stability of the three-dimensional first-order model at horizontal resolutions down to 70 m.
(ii) Compare modelled ice-surface velocities with no basal motion against velocities measured at the glacier over lour periods to test general model applicability and the contention that the winter-flow regime is predominantly composed of internal deformation with a negligible basal motion component.
(iii) Determine the rate factor, A, used in the flow law for ice (Reference GlenGlen, 1958) which best reproduces the observed patterns.
(iv) Compare the magnitude and orientation of modelled principal surface stresses with crevasse patterns on the glacier.
(v) Compare the magnitude and orientation of modelled principal surface stresses with strain patterns derived from repeat surveys of surface-strain diamonds.
(vi) Attempt 10 model an observed distribution of annual velocity within a cross-section of the glacier longue by treating the annual flow regime as a time-weighted composite of three contrasting basal motion scenarios: no sliding, “normal summer” sliding and enhanced “spring-event”. sliding along an elongated decoupled zone.
It should be noted that we do not specifically attempt to model real patterns of basal motion. In the absence of sufficient high-resolution information on basal conditions, the simulation of actual sliding patterns is considered beyond the scope of the present study. However, long-term field investigations do enable us to make some tentative assumptions regarding basal sliding patterns, which we do explore. First, observations at predominantly temperate-based valley glaciers indicate that basal sliding velocities decrease significantly during the winter season (Reference HookeHooke and others, 1989, Reference Hooke and Pohjola1992; Reference GudmundssonGudmundsson, 1994; Reference WillisWillis, 1995). Large decreases in measured mid-winter surface velocities at Haul Glacier d’Arolla suggest major basal sliding suppression relative to other periods. We investigate this observation through comparing velocities measured over four different periods with surface velocities modelled with no associated basal motion.
Secondly, repeat inclinometry of a transect of boreholes provides us with site-specific information on local strain and sliding patterns at Haul Glacier d’Arolla. The distinctive feature of the annual velocity distribution in cross-section is the low internal strain experienced within an 80 m wide zone dominated by enhanced basal motion, whereas internal strain contributes significantly to total movement elsewhere (Reference HarborHarbor and others, 1997). This feature is observed in fast-flowing ice streams, where much of the high velocity is attributed to basal motion, but it is also confirmed for small valley glaciers, where sliding patterns vary over spatial scales that are comparable with the local ice thickness. We attempt to reproduce the observed cross-sectional velocity distribution by applying the model under contrasting basal boundary configurations. We do not consider these configurations as precise simulations of the velocity field but rather as a gauge that the observed strain pattern could potentially result from basal decoupling along a longitudinally linear zone within a field of lower background sliding.
Field Site and Methods
Haul Glacier d’Arolla is located in the western Pennine Alps at the head of the Val d’Hérons, Valais, Switzerland (Fig. 1). The glacier is approximately 4 km long and has an elevation range of 2560–3500 m a.s.l. It has an area of 6.3 km2, comprising two fini basins that combine to feed a main glacier tongue. The glacier is currently retreating at approximately 25 m a−1 and has receded by more than 720 m since 1967. It has a maximum depth of approximately 180 m (Reference SharpSharp and others, 1993) and a maximum surface velocity of about 15 m a−1. The glacier therefore has a relatively simple geometrical configuration, a small areal extent and a relatively large ice flux, all of which make it well suited as a field test site for high-resolution flow modelling.
Field data
A 5 m resolution digital elevation model of the glacier surface in September 1994 was generated by aerial photogrammetry conducted in collaboration with Grande Dixence, S.A. (Reference Willis, Chandler and RichardsWillis and others, 1996), and a 20m resolution digital elevation model of the glacier bed was generated from radio echo-sounding data (Reference SharpSharp and others, 1993). Crevasse fields were mapped from the original aerial photographs and layered on lo the digital elevation model (Fig. 1).
Ice-velocity data were obtained by standard ground surveying, using a Geodimeter 410 Total Station, of an extensive network of velocity markers drilled into the glacier surface in 1994 and 1995. In June 1994. two independent marker arrays were installed: a glacier-wide set of four transects consisting of seven or eight markers each was established to provide data on overall dynamics, and a further four staggered transects consisting of five markers were established within the ablation zone of the glacier lo provide high-resolution strain data (Fig. 1). Each marker housed a permanent reflector prism and, weather permitting, was surveyed twice daily from each of two survey stations. The position of each marker was thus based on four individual coordinate readings. During each survey, regular checks were made to three stable ground references to provide control data and permit correction for changing atmospheric conditions. Surveys of the stake network were carried out between 13 June and 3 September, summer 1994, between 3 and 8 February, winter 1995, and between 22 June and 27 August, summer 1995. The February visit enabled the glacier-surface displacement to be divided into the finir periods which we used in constrain the flow mode: summer 1994 (13 June–3 September 1994), autumn/winter 1994–95 (3 September 1994–3 February 1995), winter 1995 (3–8 February 1995) and summer 1995 (22 June–27 August). Each period is assumed to be characterized by a different motion regime reflecting some change in the balance between internal ice deformation and basal sliding and/or bed deformation as the subglacial drainage system evokes.
The magnitude and orientation of principal surface strains were derived, following Ramsay (1967), from the motion of multiple suites of surface-strain triangles. The annual, cross-sectional velocity distribution was determined through repeat inclinometry profiling of a transect of boreholes drilled lo the glacier bed between August 1995 and August 1996. Repeal surveys of the tops of these boreholes enabled calculation of annual surface velocities at each point, permitting isolation of the net annual basal motion pattern across the transect (Reference HarborHarbor and others, 1997).
Model Boundary Conditions
A detailed description of the derivation and numerical solution of the first-order algorithm in three dimensions has been given by Blatter (1995). However, to understand the limitations imposed through the convergence criterion of the model, a synopsis of the main procedures and iteration scheme are given here.
The numerical model solves the equations of force balance and the stress–strain relations that are bounded by a prescribed velocity distribution at the glacier bed and a vanishing shear traction at the surface. A second-order Runge–Kutta integration scheme shoots vertically from the glacier bed for zero shear traction at the ice surface. The unknown basal shear traction is modified through a fixed-point iteration scheme based on the computed shear traction at the surface:
where τ b and τ s denote the basal and surface shear tractions respectively and β(0 < β < 1) is an iteration parameter. The convergence radius of this iteration is defined by the aspect ratio of the ice mass and the chosen horizontal grid resolution. Higher resolution (decreasing grid size) requires smaller values of β, which reduces the progress of the iteration step within the scheme and thus increases the overall number of iterations required to satisfy convergence (τ s < 0.001 kPa). This ultimately places limits on the horizontal resolution that can be obtained for a given glacier geometry.

For application of the numerical model in three dimensions, six inputs must he specified: bed and surface slopes, ice thickness, the basal motion field and Glen’s flow-law rate factor and exponent. Ice thickness at each grid node was generated by subtracting the bed- from the surface-elevation models which were spline interpolated (Reference KecklerKeckler, 1995) to the required resolution. The local bed and surface gradients were generated at each node through central second-order differencing and single-sided, second-order differencing at the margins.
We apply the model under three contrasting basal motion configurations. In the first experiment, the basal velocity distribution is set to zero for comparison with measured surface velocities. The second experiment attempts to simulate the annual velocity distribution within the glacier cross-section, which we treat as a composite of three different basal motion configurations reflecting seasonal changes: non-sliding conditions during “winter” normal sliding conditions during “normal summer” melt season and locally enhanced sliding within a background of normal sliding during a proposed “spring event” (Reference HarborHarbor and others, 1997). The weights of each scenario on the overall modelled annual velocity distribution should be defined by the contribution of each scenario over the year.
Defining the “normal summer” and the enhanced “spring event” basal mot ion distributions are extremely problematic since information on internal velocity and sliding is only available across a small transect of the glacier tongue and is averaged over a year. This precludes any attempt at isolating actual basal motion distributions since within sliding areas the surface velocity may be defined almost totally by sliding, whereas in zones of no or small sliding velocities the surface velocity may be increased by faster sliding in adjacent zones. Hence, at any time, local basal velocity may actually lie anywhere between zero and the surface velocity. Although differences between seasonal velocities cannot be directly attributed to variations in sliding, in the absence of any more rigorous method we derive the normal melt-season basal motion distribution from the residual of the observed summer minus the observed winter surface velocities at each survey marker and, with the glacier margins defined at zero, use a three-dimensional kriging algorithm (Reference KecklerKeckler, 1995) to interpolate the resulting velocity field glacier wide.
The enhanced “spring-event” sliding distribution is based on the “normal summer” distribution but with a narrow zone down the eastern margin of the glacier tongue defined by a sliding value equal to the peak local ice-surface velocity. This elongated zone of artificially enhanced sliding, one grid cell wide by 15 cells long, coincides with the location of a subglacial channel or variable-pressure axis (VPA), characterized by significant melt-season diurnal water-pressure variations, peak values of which often exceed ice-overburden pressure (Reference SharpSharp and others, 1993; Reference Hubbard, Sharp, Willis, Nielsen and SmartHubbard and others, 1995). The justification for an enhanced sliding scenario lies in the fact that maximum surface velocities recorded during a “spring event” in early July 1995 were substantially greater than both annually averaged and summer-averaged velocities and were centred over the proposed channel (Reference Hubbard, Sharp, Willis, Nielsen and SmartHubbard and others, 1995). Furthermore, repeal borehole inclinometry reveals considerably larger sliding rates within this narrow c. 80 m zone relative to the remainder of the glacier cross-section (Reference HarborHarbor and others, 1997).
The rate factor, A, in Glen’s flow law for ice is strongly dependent on ice temperature and water content. The model incorporates the flexibility to define A at each node, therefore permitting the approximation of cold, wet and polythermal glaciers. However, since Haut Glacier d’Arolla is a predominantly temperate glacier, the rate factor is held constant and a value of 3 is used for the flow-law exponent, n.
Results
The model with zero basal motion was successfully applied to the geometry of Haut Glacier d’Arolla at resolutions of 250, 150, l00, 75 and 70 m. All runs provided consistent results, characterized by smooth surface-velocity distributions displaying classic transverse parabolic profiles characterized by high velocities close to the glacier centre line and rapidly decreasing to zero at the margins (e.g. Fig. 2). Computed basal traction varies to a maximum value of c. 160 kPa and at all resolutions the longitudinal deviatoric stress component was significant and on the same order of magnitude as the computed basal traction. Model runs at resolutions below 70 m were attempted but failed to converge, even with values of β < 0.0002 which was the cut-off limit before machine precision round-off errors dominated the numerical scheme. The maximum resolution of 70 m used an optimum value of β = 0.001 and required c. 12 000 iterative steps to achieve convergence. The geometry of Haut Glacier d’Arolla at 70 m resolution corresponds to an array of 40 × 52 horizontal cells and required 40 levels to provide the vertical stability necessary for convergence. Since this represents the maximum practicable resolution, all calculations and comparisons reported in the remainder of this paper refer to this 70 m geometry.
Comparison of modelled and measured surface velocities
The predicted surface-velocity pattern is characterized by a high level of spatial consistency, with smooth transitions from areas of maximum velocity into areas of lower velocity (Fig. 2). To assess the success of the first-order model in simulating flow at Haut Glacier d’Arolla, the computed surface velocities are interpolated on to the coordinate positions of the surface survey markers using a linear algorithm (Reference KecklerKeckler, 1995). These modelled velocities are plotted against observed surface velocities for the four periods defined above, revealing a good relationship with velocities measured over the winter 1995 period (R 2 = 0.75), but a poor relationship with summer 1994 (R 2 = 0.37), autumn/winter 1994–95 (R 2 = 0.38) and summer 1995 (R 2 = 0.27) data (Fig. 3). A poor correspondence for the latter three periods is expected, since zero motion is specified at the basal boundary in the model while these three periods all span at least part of the summer melt season when extensive basal lubrication, and therefore motion, is expected. We interpret this result as an indication that the winter motion of Haut Glacier d’Arolla is achieved primarily through internal deformation and that Matter’s (1995) first-order model is capable of predicting reasonably well valley-glacier flow by internal deformation.
Derivation of the rate factor
For a uniform rate factor, A, in Glen’s flow law for ice, the magnitude of modelled strains is proportional to A and the pattern of those strains is independent of A. Hence, using a subsequent multiplier, A ′, of the form:
it is possible to fine tune the model to empirical data by calculating an optimum rate factor, A optimum, without recomputing the stress field. Linear regression (constrained through the origin) of modelled surface velocities against those measured during the winter 1995 flow period results in a value for A optimum of 0.082 a−1 bar−3. The best fit between these data, however, is achieved when the regression line intercepts the measured velocity axis at 1.63 m a−1, yielding a value for A optimum of 0.063 a−1 bar−3 (R 2 = 0.75) (Fig. 4). While this value of A is about half that of the traditionally accepted value (e.g. Reference PatersonPaterson, 1994), it is in general agreement with recent estimates of the flow-law parameters based on finite-element models of glacier flow. For example, Reference GudmundssonGudmundsson (1994) achieved a best fit with A = 0.075 a−1 bar−3 (n = 3) between surface velocities calculated using a three-dimensional finite-element model and those measured at Unteraargletscher, Switzerland. It may be worth noting that the “full stress” models predict a value for the rate factor that is somewhat less than the values traditionally presented for temperate ice (Reference PatersonPaterson, 1994). One possible explanation could be the failure of previous, shallow-ice models to account for the full stress field, leading to an underestimate of the effective stress in the flow law, resulting in a requirement for correspondingly “softer ice”. However, without precise information on the internal flow regime and ice character (e.g. debris, gas and moisture content and crystal orientation), we can only conclude that the above value of A at Haut Glacier d’Arolla represents a best-fit, glacier-wide generalization of what is likely to be variable on spatial and temporal scales.

Occurrence of crevasses
Areas of potential ice-surface crevassing may be predicted on a glacier by application of the von Mises criterion, which is based on the premise that ice can support only a limited octahedral stress before failure (Reference VaughanVaughan, 1993). This criterion is most readily expressed as a limiting value on the second invariant, I s, of the deviatoric stress tensor, derived from the components of the principal stresses, σ s:
where ![]() is the tensile strength of the ice (Reference VaughanVaughan, 1993). Reference VaughanVaughan (1993) successfully matched this criterion, derived from measured strain rates, with crevassing on a number of ice masses. Significantly, application of Blatter’s model permits generation of both the magnitude of I s and the orientation of the principal stresses directly from the computed surface-stress Held. Comparison of these data with observed crevassing may thereby serve as a check on the accuracy of the model as applied to Haul Glacier d’Arolla. If the model calculates the three-dimensional stress held accurately and at a sufficiently fine resolution, then regions of the glacier surface corresponding to maximum values of I s will correspond with areas of glacier crevassing and the orientations of those crevasses will correspond with the principal tensile stress directions.
is the tensile strength of the ice (Reference VaughanVaughan, 1993). Reference VaughanVaughan (1993) successfully matched this criterion, derived from measured strain rates, with crevassing on a number of ice masses. Significantly, application of Blatter’s model permits generation of both the magnitude of I s and the orientation of the principal stresses directly from the computed surface-stress Held. Comparison of these data with observed crevassing may thereby serve as a check on the accuracy of the model as applied to Haul Glacier d’Arolla. If the model calculates the three-dimensional stress held accurately and at a sufficiently fine resolution, then regions of the glacier surface corresponding to maximum values of I s will correspond with areas of glacier crevassing and the orientations of those crevasses will correspond with the principal tensile stress directions.


Comparison of areas of maximum I s determined from the first-order model with no basal sliding (Fig. 5) with the actual distribution of crevassing across Haut Glacier d’Arolla (Fig. 1) reveals a high level of correspondence. The directions of the principal tensile stresses in these zones also generally match the orientations of observed crevasses. The most extensive zone of crevassing occurs at the confluence of the southwest tributary and the main glacier, and corresponds with a zone of maximum I s. The directions of the modelled principal stresses in this region indicate flow-parallel extension, which is consistent with the transverse orientation of the observed crevasses. The occurrence and direction of longitudinally orientated crevasses at the top of the southwest tributary along with a zone of transverse crevasses on the lower eastern margin of the glacier tongue are also successfully predicted, providing validation both of the model and of the application of the von Mises criterion to crevasse prediction.

Comparison of modelled principal stresses and measured principal strains
As the relative patterns of the modelled stress and strain fields are independent of the rate factor A, a direct comparison of modelled principal stresses with measured principal strains is also permitted. The principal strains were derived from the displacement of a dense strain network established across a small area of the glacier tongue between 3 September 1994 and 27 August 1995 (Fig. 1). In this limited study area, the modelled stress field with no basal motion successfully reproduces the general pattern of measured principal strains (fig. 6a and b) showing relatively low vector magnitudes along the glacier centre line, with steadily increasing magnitudes towards the eastern glacier margin. There is also strong agreement between the orientation of the modelled principal stresses and derived principal strains. This is particularly evident from the centre line to the eastern side of the study area. At the glacier centre line within the comparison area, compressive and tensile vectors are aligned perpendicular and parallel to the direction of glacier flow, respectively. Towards the eastern margin, vectors progressively turn through 45° such that the compressive vector is orientated so as to oppose transverse drag and intercepts the margin obliquely. Towards the west of the area, there is greater discrepancy between the orientations of measured and modelled vectors. A possible explanation here may be that much of the western area of the glacier consists of almost stagnant, ice-cored moraine which may be significantly less dynamic in reality than the model is capable of predicting with a spatially uniform rate factor. It should also be noted that the principal stresses are calculated from the model run with no basal motion component, whereas the period over which the surface strains were observed covers much of the summer melt season when a substantial component of basal sliding would be expected. For the most part, however, strong correspondence is apparent between these modelled and measured quantities, providing further validation of the model.
Simulation of the annual velocity distribution in cross-section
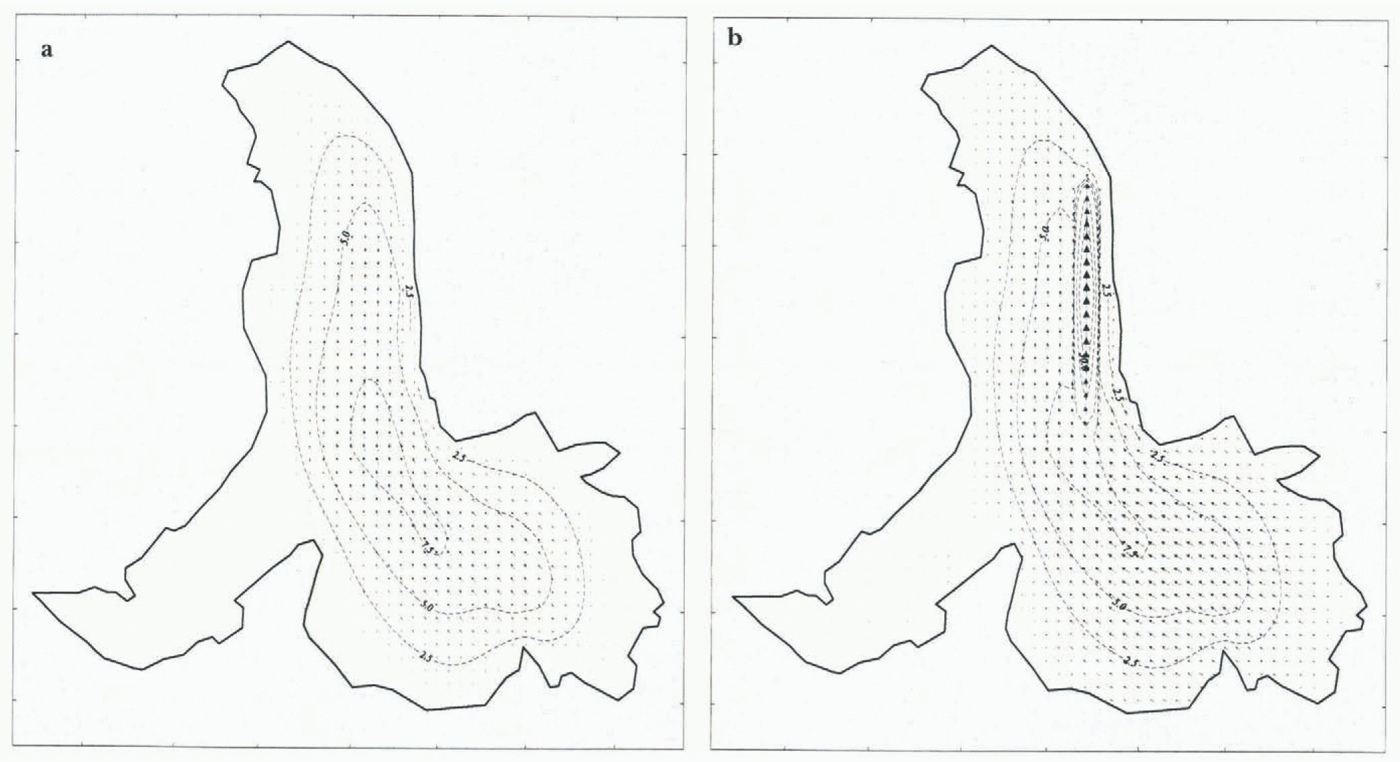
Two further model runs were initiated at 70 m resolution to obtain stress and velocity fields under the two basal motion scenarios described above (fig. 7a and b). The resulting cross-section distributions of modelled velocity and basal traction, along with the no sliding results, reveal several interesting features. Given the asymmetric geometry of the glacier cross-section, the “winter’” and “normal summer” sliding scenarios display a notable symmetry in their flow and stress regimes (fig. 8a and b). For the “winter” no-sliding configuration, computed basal traction varies little around 120 kPa over much of the cross-section and the resulting vertical velocity distribution displays the classic vertical profile with peak surface velocities of 7.5 m a−1 coinciding with the zone of maximum ice thickness at easting 606580, somewhat to the east (true right) of the glacier centre line (fig. 8a).
As expected, introducing the ‘‘normal summer” sliding distribution (fig. 7a) results in generally increased surface velocities relative to “winter” velocities (fig. 8b). However, this summer velocity increase is also accompanied by a small decrease in net internal deformation rates. This decrease may be understood in terms of the role of reduced basal drag in relieving basal shear traction. For instance, where the bed at easting 606600 experiences the maximum imposed sliding of c. 7 m a−1, the computed basal traction declines by 20 kPa. A similar reduction in basal traction occurs across the central 400 m zone of the glacier and is compensated for by increased values of modelled basal traction (up to 70kPa at easting 606870) towards the margins (fig. 8b). Thus, under conditions of reduced basal drag, transverse stresses come into play, transferring the component of basal shear traction required to stabilize the glacier away from the decoupled zone.
Under conditions of enhanced sliding along the inferred subglacial channel (fig. 7b), the transverse stress-strain field effects become considerably more pronounced. Within the decoupled zone at the proposed subglacial channel, computed values of basal traction become negligible. Here, slip is essentially providing the whole component to surface movement effectively enabling the overlying ice to move as a vertical column over its bed. The basal velocity perturbation diffuses laterally across and upward through the transect and its effects, increased velocity at the glacier surface, are evident up to 300 m to the west. Strong associated transverse coupling effects are also observed, consequently enhancing basal drag across the bed with maximum basal traction of 160 kPa apparent immediately west of the decoupled zone.
Various configurations of the three modelled scenarios were time-weight averaged and combined on a systematic basis in an attempt to reproduce the observed annual velocity distribution within the cross-section at the glacier tongue (fig. 9a), Weights of 20/52 “winter” no sliding, 20/52 “normal summer” sliding and 12/52 enhanced “spring event” sliding results in a composite velocity distribution in cross-section (fig. 9b) which represents a compromise between a realistic weighting and a best fit to the observed data. Given the limits imposed by the operating resolution, the modelled and observed surface and basal velocity patterns across the transect show a good likeness (fig. 9a and b). Peak surface velocities in both modelled and observed distributions rise to nearly 10 m a−1 directly above the decoupled zone and remain high to within 100 m of the eastern margin. Throughout the transect, modelled velocities do not deviate more than 0.5 m a−1 from measured velocities. The composite modelled velocity pattern across the glacier bed is also similar to the pattern interred from observations, varying between 5 and 6 m a−1 over most of the transect and rising to 8 m a−1 at the location of the proposed subglacial channel. Both the observed and the composite modelled distributions also correspond in the area of maximum down-glacier velocity at 9.5 m a−1, which occurs over the inferred subglacial channel as “plug flow”. However, despite the many similarities, the two cross-section velocity patterns differ significantly in the lateral diffusion of the basal velocity perturbation. In contrast to the modelled composite, the observed velocity pattern displays a well-defined boundary between the decoupled column and the adjacent ice over the whole glacier thickness. However, the failure of the model to delimit such a boundary may well be a shortcoming of its limited 70 m operating resolution.


Discussion and Conclusions
Blatter’s (1995) model (based on a finite-difference solution in three dimensions of the first-order approximation of the flow equations for ice) has been applied successfully to a valley glacier at high spatial resolution. Comparison of model predictions with field data from Haul Glacier d’Arolla, Switzerland, reveals that the model is flexible and accurate, and does not compromise the quality of results, as have previous finite-difference solutions.
Least-squares linear regression of modelled surface velocities with no basal motion component against measured surface velocities for various time periods indicates a good match for winter (1995) flow. For this period, the optimum value for the flow parameter, A, in Glen’s flow law for ice (with n = 3) is 0.063 a−1 bar. This best-fit relationship, however, docs not pass through the origin but intercepts the observed velocity axis at 1.63 m a−1, suggesting that there may be a basal motion component of this magnitude in the winter-flow regime. Comparison of modelled and measured velocities for other periods indicates a poorer correspondence characterized by basal motion patterns that are non-uniform in space and time.
The computed three-dimensional stress field at 70 m resolution successfully predicts, through the application of the von Mises criterion for failure, observed zones of crevassing across the glacier surface. The direction of the tensile component of the computed principal stress field within these zones also correctly matches the orientation of the observed crevasses. Comparison of the direction and relative magnitude of the computed principal stresses with principal strains derived from annual survey of a network of strain diamonds over part of the glacier surface shows a high level of coincidence and provides further validation for the model and the survey techniques employed at Haut Glacier d’Arolla.
Inclusion of generalized basal motion approximations into the first-order model of Haut Glacier d’Arolla provides a first step towards realistic modelling of melt-season dynamics and enables us to reproduce the key features of the annual down-glacier velocity distribution within a cross-section of the glacier tongue. Applying a hypothetical basal motion distribution based on subtracting mean winter from mean summer surface velocities results in moderate amendment of the modelled internal stress and strain fields as transverse-stress gradients come into operation. Prescribing enhanced basal velocities along an elongated zone down the eastern margin results in total decoupling of the glacier from its bed. Negligible shear–strain rates are experienced in the immediately overlying column of ice, and strong transverse coupling gives rise to an increase in computed basal drag in adjacent zones and associated enhanced strain rates as the basal perturbation is dissipated upwards and across the section. Time-weight averaging the internal velocity field modelled using the three basal motion scenarios of “winter” no sliding, “normal summer” and enhanced “spring event” sliding gives a cross-sectional velocity distribution that reproduces well the main features of the observed annual velocity profile. This experiment confirms that the site of the inferred subglacial channel is probably characterized by strong decoupling for some period of time. That the required weighting of enhanced “spring event” sliding in the overall modelled distribution is somewhat longer (12 weeks) than that observed suggests that there may be enhanced basal motion taking place within this zone over an extended part of the year and that it is not only associated with “spring event” basal conditions. That the modelled distribution shows considerable dissipation of the basal motion perturbation throughout the glacier cross-section, whilst the observed distribution shows remarkably sharp flow-regime boundaries may be a product of the relatively coarse operating resolution of the model. We cannot, however, discount an inconsistency in the composite approach used to simulate the inclinometry profile nor errors associated with the derivation of the observed distribution (Reference HarborHarbor and others, 1997). Despite this, and given the limitations imposed by the maximum operating resolution of the model, the observed and simulated annual cross-section velocity distributions compare well and illustrate that the first-order model is capable of successfully solving the internal stress and strain fields associated with complex configurations of basal motion.
Acknowledgements
We gratefully acknowledge financial support from ESF (EISMINT travel awards) that enabled this collaboration to take place. The first author wishes extend thanks to Λ. Ohmura and all at the Institute of Geography, ETH, Zürich, for their hospitality and support whilst the modelling was being carried out. We also wish to thank D. Sugden and M. Sharp for invaluable comments and amendments to the manuscript. The critical reviews of R. Hooke, B. Hanson and N. Humphrey helped to improve the paper substantially. A. Hubbard is in receipt of a Leverhulme Fellowship, D. Mair a U.K. NERC studentship and P. Nienow a U.K. NERC fellowship No. GT5/93/AAPS/1.


