


Introduction
Disasters are significant disturbances to communities that exceed their ability to manage with existing resources. They can arise from natural, human-induced, or technological hazards. This paper focuses on natural hazards-induced disasters like droughts, earthquakes, floods, tsunamis, landslides, volcanic eruptions, storms, cold waves, heat waves, and hailstorms. 1,2 These disasters cause economic loss, infrastructure collapse, food and logistic chain disruptions, population displacement, and deaths. Over the last 5 decades, disasters have resulted in 4.7 million deaths and a global economic loss of USD 5 trillion. Reference Ritchie, Rosado and Roser3,4
Floods and wind-related hazards, including storms and cyclones, are the most frequent and economically damaging. 5 While fatalities and affected populations have decreased in high-middle and middle-income countries, they have increased in low-income countries, leading to a global rise in mortality and affected people.Reference Jonkman, Curran and Bouwer 6 For instance, tropical cyclones caused 97,430 excess deaths from 1980 to 2019 and were involved in 1,945 separate disasters including extreme winds, flooding, heavy rainfall, and massive lightning. Reference Huang, Li and Vogt7,8 Earthquakes, equally frequent, have caused nearly 750,000 deaths from 1998 to 2017, affecting over 125 million people. 9
The frequency and magnitude of natural hazard-induced disasters are increasing, with 436 recorded in 2021 compared to 376 recorded 30 years ago. 5 Asia is the most disaster-prone region, with countries like the Philippines, Indonesia, and India having the highest disaster risk scores. 10 Climate change has exacerbated the frequency and severity of disasters, tripling climate-induced events like floods, storms, and droughts over the last 3 decades. 11 – 13 Disasters also have significant short and long-term mental health impacts, including depression, PTSD, anxiety, and suicidal ideation. Reference Keya, Leela and Habib14,Reference Novia, Hariyanti and Yuliatun15
The use of mobile phone technologies can significantly enhance disaster management strategies, offering valuable opportunities for Disaster Risk Reduction (DRR) by promoting inclusivity and ensuring that local knowledge and risk information can become more relevant and accessible as well as enhancing preparedness. 16,Reference Paul, Bee and Budimir17 These technologies hold considerable promise in improving access to communication, fostering equitable resilience by engaging marginalized and vulnerable communities, such as individuals with disabilities, who are often overlooked by traditional knowledge generation methods. Reference Budimir, Bee and Paul18,Reference Singh19
Current examples of mobile technologies used for disaster risk management include the use of mobile applications, photos and videos, sensing technology, global positioning system (GPS), short-message services (SMS), voice calls, and social media.Reference Budimir, Bee and Paul 18 Technology offers numerous advantages for disaster management, especially in low- and middle-income countries. For instance, mobile applications can provide real-time alerts and updates about impending disasters, helping communities prepare and respond more effectively.Reference Budimir, Bee and Paul 18 Features such as GPS and mapping services enable location tracking and coordination of rescue operations, which is crucial in densely populated or remote areas. Reference Budimir, Bee and Paul18,Reference Singh19 Additionally, SMS and social media platforms can disseminate critical information quickly and widely, ensuring that even those without internet access receive timely warnings and instructions. Reference Budimir, Bee and Paul18,Reference Fauzi20 These technologies not only enhance immediate response efforts but also contribute to long-term resilience by facilitating better planning and resource allocation. 21
Although it remains difficult to measure the number of mobile applications developed and their features for disaster management at a global level, this systematic review seeks to describe the global evolution of mobile phone technologies in the context of natural hazard-induced disaster management, including disaster prevention, preparedness, response, and recovery. Through the careful analysis of existing knowledge and similar local initiatives, this information could be transformed into quantitative data to support the development of innovative applications that support future DRR.Reference Paul, Bee and Budimir 17
Material and methods
Search Strategy
This review was carried out in accordance with PRISMA guidelines.Reference Page, McKenzie and Bossuyt 22 A comprehensive search was performed using Embase (1974-2024) and MEDLINE (1946-2024) on March 26, 2024, via Ovid. The query used for the search strategy through Web of Science was “disaster” AND “mobile phone” or “smartphone” or “cell phone” or “phone app” or “mobile app” AND “2000-2024.” The search query used for PubMed was “disaster” AND “mobile phone” or “smartphone” or “cell phone” or “phone app” or “mobile app” with filters from “2000-2024.”
Several inclusion criteria were applied to determine the eligibility of studies for this review. The criteria included; (1) mobile applications used for disaster preparedness, response, and management; (2) studies published between January 2000 and March 26th 2024; (3) studies that include cross-sectional, cohort studies, case–control studies, case series, case reports, and meta-analysis; (4) studies written in English, and (5) studies reporting primary or secondary outcomes related to disaster mobile applications.
Exclusion criteria included dissertations, theses, conference abstracts, randomized controlled trials, background reviews, expert opinions, modelling studies; studies focusing on non-disaster mobile applications; studies addressing disaster technology but not mobile applications; and studies written in languages other than English.
Selection Process
To ensure that quality studies were included for review, all papers went through a screening process, and duplicate papers were removed. To reduce bias during the screening process, two authors were tasked to independently review the selected studies. Title and abstract screening, as well as full-text screening, were independently completed by two authors using a combination of Excel and Google Sheets. Inclusion and exclusion criteria were implemented during the title and abstract screening. During the full-text screening, a thorough review was conducted to ensure the studies provided sufficient information, and only those meeting the inclusion criteria were incorporated into the final review and data extraction phase. Studies identified by both authors for exclusion were removed from the final screening phase. When discrepancies emerged between the first and second reviewers, a third author participated to determine the final decision for study inclusion.
Data Collection and Analysis
Data collection was carried out by the first reviewer by conducting a comprehensive review of 26 studies that passed the screening process. In order to harmonize the information needed to be extracted from the studies, a template was developed using Google Sheets. The aforementioned template was used to further examine each study by incorporating several categories, such as (1) mobile app name; (2) location; (3) year of release; (4) ownership; (5) operating system; (6) intended use; (7) targeted user; (8) number of downloads; (9) application rating; (10) available features; (11) type of hazard covered; (12) specific technology; and (13) other information. During data collection, not all information was reported in each category, and unavailable or missing data was reported as not available.
To assess the current availability and ongoing relevance of the reviewed applications, a manual search was conducted in June 2025 on the official Apple App Store and Google Play Store. To ensure an accurate assessment of inactivity, each of the 77 applications was first categorized based on its original operating system (“iOS”, “Android”, or “Android & iOS”) as detailed in the study’s appendix.
An application’s status was then defined according to its availability on its intended platforms. Single-platform applications (i.e., “iOS only” or “Android only”) were classified as inactive if they were no longer available on their single designated app store. Dual-platform applications (i.e., “Android & iOS”) were classified as inactive only if they were missing from both the Google Play Store and the Apple App Store. If an app remained available on at least one of these platforms, it was considered active.
Results
Study Selection
The search across two databases, Medline and Embase, produced a total of 948 results, which were imported into EndNote20. Out of these results, 470 duplicates were identified and removed by EndNote20 and manual verification, leaving 478 records for eligibility screening. During the initial screening phase, based on title and abstract, 419 records were excluded for either meeting exclusion criteria or failing to meet inclusion requirements. In the second phase, the full text of the remaining studies was assessed, and an additional 33 studies were excluded for one of 6 reasons: disaster technology but not mobile apps, study not in English, mobile application not related to disaster, not digital technology, not related to disaster, or unsuitable study design. An additional study was excluded because the full text was inaccessible. The resulting number of studies passing eligibility screenings and available for extraction was 26.Reference Aedo, Yu and Díaz 23 –Reference Case, Morrison and Vuylsteke 48 From 26 studies, 3 were cross-sectional studies, 2 were cohort studies, 2 were case control studies, 12 were case series/case reports, and 7 were systematic review studies. Figure 1 shows a PRISMA flow chart of the selection process during each stage.
PRISMA flowchart with result for screening process.

Disaster Preparedness and Mitigation Mobile Application Characteristics
From the 26 studies included, a total of 110 disaster mobile apps were identified. Following the selection based on specific application purpose (natural hazard-induced disaster or other types of crises) and usage status (released or prototype only), 77 mobile apps were deemed eligible for review. Among these 77 apps, 37 originated from North America (48.05%), 34 from Asia (44.16%), 3 from Europe (3.90%), 2 originated from Africa (2.60%), and 1 from Australia/Oceania (1.30%). Figure 2 illustrates the global distribution of disaster mobile apps by indicating the number of apps originating from each country.
Number of mobile apps developed and used per country.

This map reveals that the majority of disaster-related mobile applications were developed in countries such as the USA (36; 46.75%), India (24; 31.17%), and Indonesia (4; 5.19%). These are followed by China (2; 2.60%) and Japan (2; 2.60%). Additionally, countries like Bangladesh, Canada, Denmark, Italy, Kenya, South Africa, South Korea, Spain, and the Philippines each have only one application. A summary of key application characteristics is provided in Table 1. A complete breakdown of all 77 applications is available in Appendices A1-A3.
Characteristics of disaster mobile applications

Notes.
a Includes apps targeting health workers/providers, mixed users (e.g., general public and volunteers), and other specific populations (e.g., mining personnel, university students).
b Categories are not mutually exclusive; apps may cover multiple hazards or use multiple technologies.
c Includes GIS, QR codes, smartphone movement sensor, wireless ad hoc network, Bluetooth, augmented reality, and OCR.
Among the 77 mobile applications reviewed, only 54 provide information on the year of release. The majority were released in 2016 (11; 20.37%). The following years of 2017 and 2018 each saw the release of 6 applications (6; 11.11%). Only one application was released in 2023, which is Relief Central from the USA. Following the platform-specific verification process, 43 of the 77 reviewed applications (55.8%) were found to be inactive as of June 2025. This indicates a significant rate of attrition among disaster-related mobile applications since their initial release. Upon examining the ownership of these applications, it was found that 36 (78.26%) were privately owned by IT companies, 24 (52.17%) were developed by government entities such as local government, 6 (13.04%) resulted from public-private collaboration, and 4 (8.70%) were owned by NGOs including the NFPA, OXFAM, and the American Red Cross.
In terms of operating system compatibility, the majority of applications were developed for Android only (35; 46.67%), followed by those compatible with both Android and iOS (28; 37.33%) and iOS only (12; 16.00%). The primary target users for these applications were the general public (49; 63.64%). Additionally, 11 (14.29%) applications targeted emergency responders, and 1 (1.30%) was designed for health workers. Several applications were intended for multiple user groups, such as medical personnel and emergency responders, general public and disaster volunteers, or general public and emergency responders, accounting for around 7 (9.09%) applications. Other specific target populations included mining personnel, university students and staff, civic administrators, individuals with special medical conditions, wildfire survivors, and children, comprising 7 (9.09%) applications. Two applications (2.60%) had unspecified target users.
The intended time of use for these applications was also examined. The majority (32; 41.56%) were designed for multiple disaster management stages, such as before and during, or before and after disaster. A total of 24 (31.17%) applications were designed solely for pre-disaster purposes, focusing on disaster preparedness and education. Additionally, 13 (16.88%) applications were intended for use during disasters, primarily for disaster alerts and evacuation, while 8 (10.39%) were designed for post-disaster use, including disaster reporting and teleconsultation. The types of hazards and disasters addressed by the applications were also reviewed. Earthquakes were the most frequently featured disaster, represented in 25 (32.47%) of the applications. This was followed by hurricanes/typhoons/tornadoes (24; 31.17%), fires (18; 23.38%), floods (17; 22.08%), tsunamis (13; 16.88%), volcanic eruptions (13; 16.88%), and landslides (10; 12.99%). Notably, approximately 28 (36.36%) applications did not specify a particular hazard or disaster focus.
Regarding the types of technology utilized and supported within the applications, GPS was predominant, featuring in 12 (15.58%) applications. This was followed by GIS, QR codes, smartphone movement sensors, and wireless ad-hoc networks, each present in 2 (2.60%) applications. Additionally, there were applications supporting Bluetooth (1; 1.30%), augmented reality (1; 1.30%), and OCR (1; 1.30%). However, 52 (67.53%) applications did not specify the types of technology they supported. The usage of each application was also assessed. The majority of the applications (18; 33.96%) had fewer than 1,000 downloads. Only 11 applications exceeded 100,000 downloads, and just 1 application, HERE WeGo, achieved 10 million downloads (1.89%).
A deep dive into existing features within each application was conducted. Educational features were present in 50 (64.94%) applications, primarily including content such as guidebooks and preparedness checklists. Approximately 30 (38.96%) applications featured alert or early warning systems, typically delivered through in-app and pop-up notifications. Disaster-related information, such as news, articles, or summaries of recent events, was available in 23 (29.87%) applications. Chat services or call centers providing crucial contact points for firefighters, nearby police stations, and ambulances were developed in 21 (27.27%) applications. Fourteen (18.18%) applications included a disaster reporting feature, allowing users to report disaster impacts. Only 12 (15.59%) applications provided information on evacuation routes during disasters. Additionally, 7 (9.09%) applications incorporated features such as offline functionality and search and rescue capabilities. Teleconsultation was available in 5 (6.49%) applications, and a panic button feature was found in 3 (3.90%) applications. Figure 3 summarizes the distribution of each feature across all examined applications.
Feature provided in disaster mobile applications.

An analysis of download numbers and their representation by continent was conducted. As shown in Figure 4, data were available for 4 continents: Africa, Asia, North America, and Oceania. In Africa, the reported number of downloads was around 10,000. In Oceania, this number reached approximately 1,000,000. Conversely, in continents such as Asia and North America, the download numbers were wider and more varied. Applications originating from Asia reported download numbers ranging from 100 to 10,000, while those from North America had a broader range, from fewer than 100 to 10,000,000. For this analysis, data from Europe was not available.
Number of downloads or uses by continent.

The focus of applications varies by continent as presented in Figure 5. Data indicate that applications from Europe concentrate on hazards such as earthquakes, fires, and floods. Applications from Asia and Oceania address all examined hazards but in varying numbers. For instance, in Asia, there are 12 applications focused on earthquakes, whereas Oceania has just one. North America also developed applications covering all hazards, with the majority (13 applications) concentrating on hurricanes, typhoons, and tornadoes. For this analysis, data for Africa was not available.
Hazard coverage on mobile applications by continent.

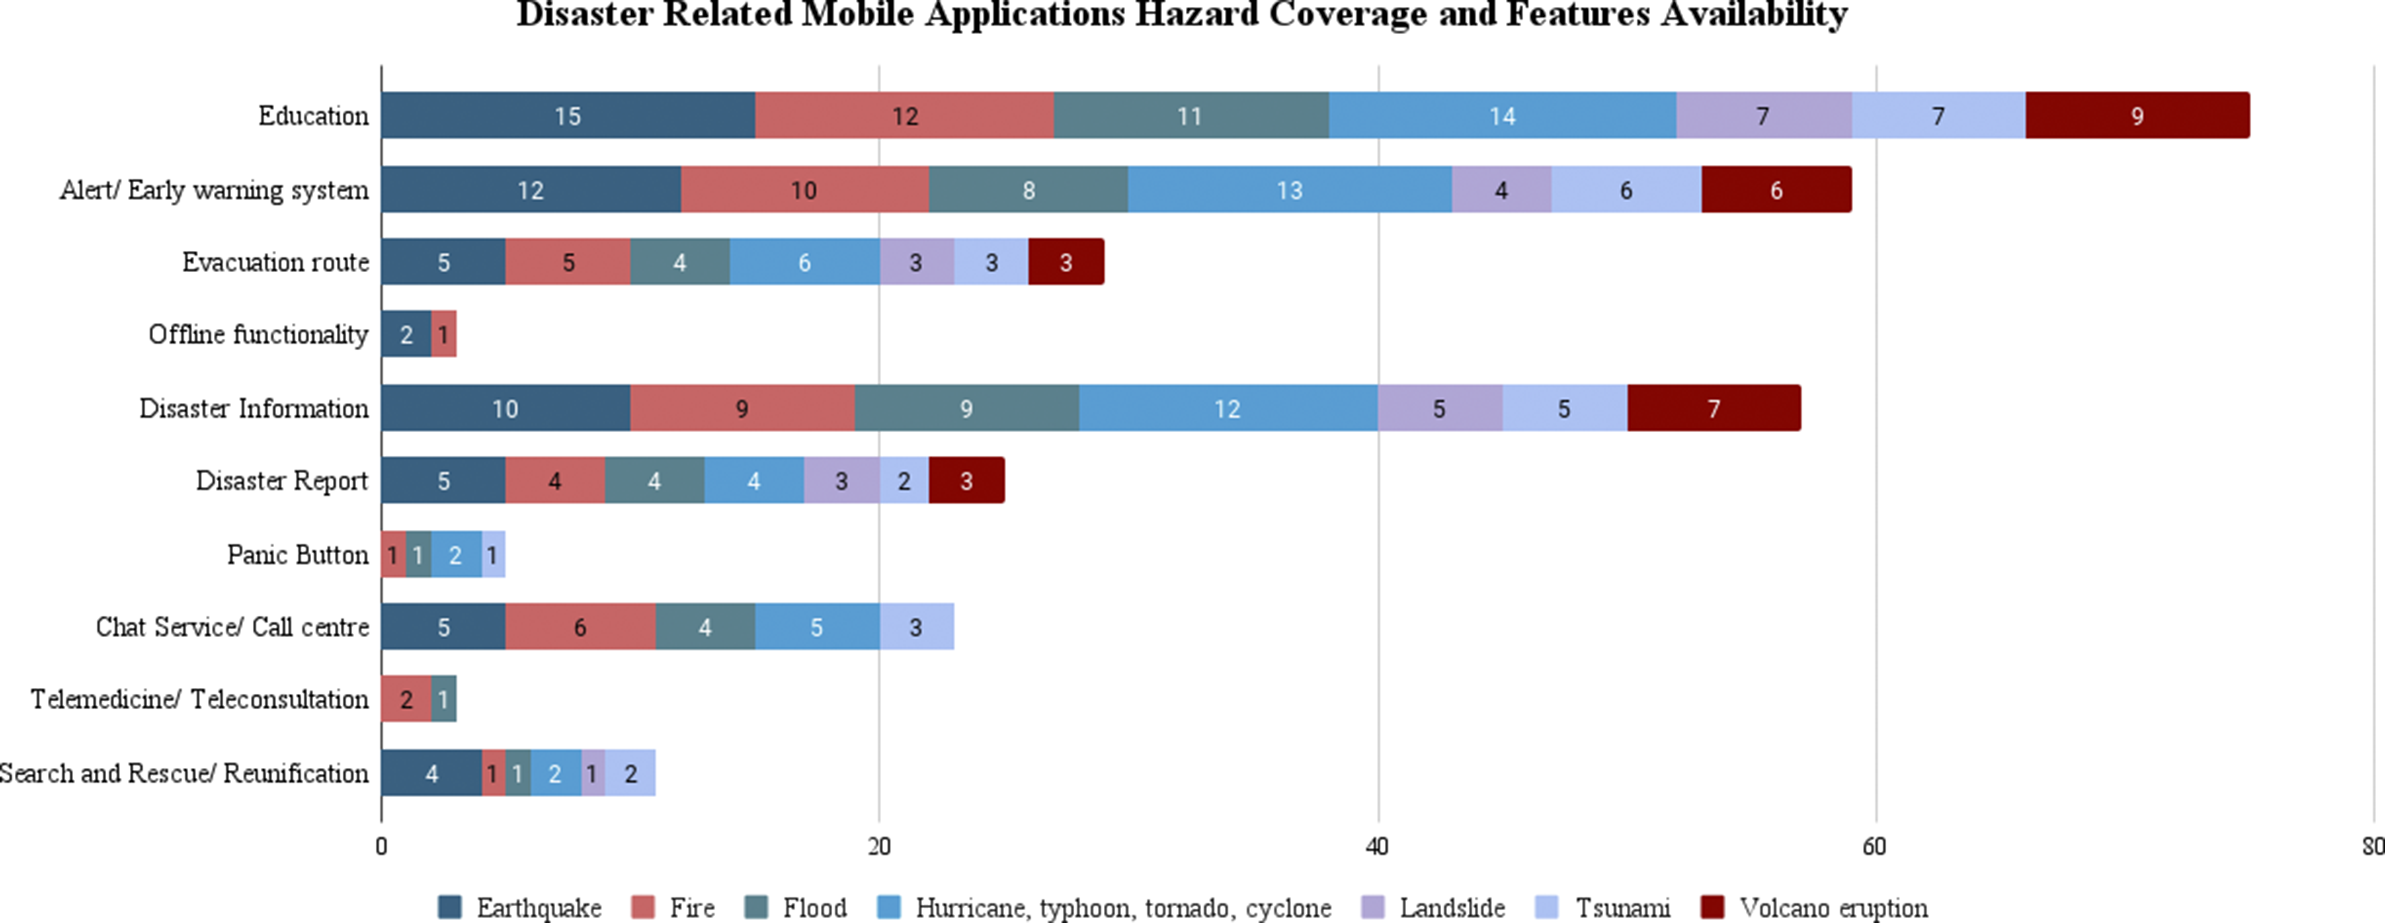
In addition to application focus, the availability of features related to specific hazards was also assessed as presented in Figure 6. Educational features, prevalent across all hazards, were most common in applications focusing on earthquakes (15) and hurricanes (14). Similarly, alert/early warning features were prominent in applications targeting earthquakes (12) and hurricanes (13). While evacuation routes were available for all hazards, the highest frequency was observed in applications focusing on hurricanes, with 6 instances. Offline functionality was present in applications addressing earthquakes (2) and fires (1). Disaster information features were widespread, particularly in applications related to hurricanes (12) and earthquakes (10). The disaster report feature was also available across all hazards, with the highest occurrence in applications focusing on earthquakes (5). Search and rescue features were included in applications targeting almost all hazards, except for volcanic eruptions. Chat services or call center features were incorporated in applications addressing nearly all hazards, except for landslides and volcanic eruptions. Telemedicine features were found in applications focusing on fires (2) and floods (1). Additionally, the panic button feature was limited, appearing only in applications addressing fires (1), floods (1), hurricanes (2), and tsunamis (1).
Disaster-related mobile applications hazard coverage and features availability.

Discussion
The review assessed 26 studies, identifying 110 disaster-related mobile applications, with 77 deemed eligible based on specific criteria. Geographically, these applications originated from Africa (2.60%), Asia (44.16%), Europe (3.90%), North America (48.05%), and Australia/Oceania (1.30%). The distribution highlighted that the USA, India, and Indonesia were leading developers. Out of 7 hazards, the most frequently addressed hazards were earthquakes (32.47%), hurricanes/typhoons/tornadoes (31.17%), fires (23.38%), and floods (22.08%). Feature analysis indicated that educational content was the most prevalent (64.94%), followed by alert/early warning systems (38.96%), disaster information (29.87%), and chat services/call centers (27.27%). Additionally, the majority of the applications were released in 2016 (20.37%).
The distribution of disaster mobile applications varied significantly by country. In this study, we found that the USA, India, and Indonesia led in the number of applications developed for disaster management. Applications from North America, particularly the US, dominate due to its well-developed technological infrastructure and frequent disaster events. 49,Reference Dyvik50 In the past 5 years, between 2020 and 2024, there have been 17 tropical cyclones, 69 severe storms, 5 wildfires, 5 winter storms, 7 flooding, and 4 drought billion-dollar disaster events affecting the USA. 51 This number is also reflected in our findings, in which the most prominent features developed within mobile applications originated from the USA are related to hurricane/tornado, amounting to 13 mobile applications out of 36 mobile applications. The limited number of mobile applications developed in Oceania and Europe could be linked to the lower number of studies focusing on mobile apps in these regions. This may be due to different disaster management strategies and capacities, as well as varying levels of technological infrastructure and research priorities.Reference Lee 52
Countries with rich and diverse technological options, like Japan, may place less importance on mobile solutions due to differing disaster management strategies. For example, due to a high number of earthquakes experienced per year, Japan’s approach to disaster risk reduction emphasizes better regional planning, constructing earthquake-resistant buildings, and increasing public awareness through campaigns and education. Reference Lee52,Reference Muhammad Afif Al, Syamsul and Syamsunasir53 While Japan has its own Early Warning System (EWS) called J-ALERT for nationwide emergency warnings and L-ALERT as the common platform by which local municipalities send critical information to local residents through various media. The dissemination of information to the public does not depend heavily on mobile apps. Instead, it utilizes a combination of radio station broadcasts, media, and cell broadcast mobile phone notifications, thus residents will receive the notifications even though they do not install a dedicated mobile app and as long as they are located in the areas within the hazard’s threshold. 54 This difference among countries could be linked to the type of disaster experienced and different disaster management strategies and capacities.
The most prevalent features among the reviewed applications were educational content and alert/early warning systems. Educational features play a critical role in raising public awareness and preparedness. Reference Aliperti and Cruz55,Reference Bachri, Rahman Hakiki and Wibowo56 Effective disaster learning helps individuals and communities respond accurately to disasters, reducing vulnerabilities and minimizing casualties, particularly in disaster-prone regions. Reference Putera57,Reference Majd, Torani and Maroufi58 One study found that users were more satisfied with disaster learning delivered through mobile applications.Reference Sari, Komalasari and Kanegae 59 Additionally, another study emphasized that mobile applications offer personalized learning experiences, making disaster education more engaging and enjoyable.Reference Sukmawati, Prima and Eliyawati 60
Another key feature is the alert system, which plays a vital role in early warning systems. Alerts communicate hazard monitoring or impact-based information in the form of actionable messages that can be easily understood by those at risk, enabling individuals, communities, and organizations to prepare and respond appropriately in time to minimize harm or loss.Reference Kovalevski 61 An effective early warning can save lives and reduce damage by up to 30% if activated 24 hours before a disaster occurs. 62 Advancements in technology, such as Geographic Information Systems (GIS), allow for incident prediction, which can generate alerts for monitoring floodgates, detecting land fires, or tracking extreme weather conditions. Reference Jayawardene, Huggins and Prasanna63,64 Additionally, the establishment of the Sendai Framework for DRR 2015-2030 has encouraged many countries to develop their own early warning systems. 65,Reference Li, Zhao and Murray66 The high frequency of these features in the mobile applications reflects their importance in effective disaster management and response. However, it is also important to ensure that this application and features are inclusive for vulnerable groups.Reference Apostolidou and Fokaides 67 Study also highlights the importance of designing user-friendly applications that follow user-centric principles.Reference Bhishitcharoentat, Saengtabtim and Leelawat 68
The majority of disaster mobile applications are designed for the general public. This is in line with a finding that disaster-focused mobile applications can facilitate disaster management-related actions such as sharing important information and images to assess post-disaster damage and/or pre-disaster risk and to notify others about personal status after disasters.Reference Tan, Prasanna and Stock 69 For example, applications such as MyShake can harness smartphone sensors to collect earthquake data, and the recorded data can be used for further purposes, such as studying earthquake impacts on buildings, which makes it important to target as many users as possible.Reference Seligman, Felder and Robinson 31 Applications targeted at government agencies and emergency responders are fewer. However, applications targeted at emergency responders are vital for coordinating response efforts and managing resources, such as applications like the FEMA (Federal Emergency Management Agency) app, which can be used to plan emergency meeting locations, or “911 Toolkit for Emergency Responders,” which is useful for firefighter preparedness. Reference Craig, Craig and Calgaro70,71 The design of these applications for specific user groups highlights their role in supporting various aspects of disaster management. Furthermore, we observed that there is a low number of telemedicine and panic button features, even though they are important for the general public. This may be due to several factors, such as not all countries have established partnerships with telemedicine providers or the necessary resources to support telemedicine infrastructure.Reference Wu, Zhang and Luan 72 Additionally, panic button features are typically designed for specific groups, such as individuals with disabilities or those in high-risk situations, which may limit their widespread implementation.Reference Nezamdoust, Abdekhoda and Rahmani 73
The reviewed mobile apps were found to be predominantly Android-compatible applications (46.67%), and this can be attributed to several reasons. First, Androids have a larger market share, in which in 2024 Android reached 70.71% global market share, while iOS followed at 28.54%.Reference Sherif 74 Furthermore, development tools and the costs associated with developing apps for iOS, which often require more specialized hardware, software, as well as knowledge, can also deter developers from choosing iOS. Reference Götz, Stieger and Reips75,Reference Kovács and Johanyák76 Although the iOS environment offers better security and results in larger per-app income, developers tend to choose Android due to its versatility and open-source origin.Reference Gajulapally, Kumar Boddapati and Vijayargi 77
The variation in download numbers was analyzed and indicates different levels of adoption and utility. Applications with the highest number of downloads, such as HERE WeGo—City Navigation and My Earthquake Alerts, stand out with 10 million and 5 million downloads, respectively. Studies have shown that familiarity and perceived social usefulness can influence a user’s intention to install a mobile application. Reference Harris, Brookshire and Chin78,Reference Normalini, Lurudusamy and Arokiasamy79 HERE WeGo has an interface that is familiar with everyday use maps, and its broad functionality, combined with breakthrough location mapping technology, also allows it to have widespread recognition. 80, 81 However, the overall number of downloads is much less than one would anticipate, especially in areas that are frequently affected by natural hazard-induced disasters. As such, a significant gap is highlighted between the intended and actual audience reached by these apps.
A critical theme emerging from our analysis is the distinction between app adoption and user engagement. While download numbers offer a surface-level metric of an app’s reach, they do not serve as a proxy for its utility or impact during a crisis. An app with millions of downloads is ineffective if it is opened only once, if its features are too complex for a panicked user, or if its alerts are ignored. The significant gap between the number of available apps and the low download counts for many (33.95% with fewer than 1,000 downloads) hints at a deeper problem of engagement. This challenge is likely linked to our finding that over half of the reviewed apps are now inactive. Apps that fail to engage users are less likely to receive the long-term support and maintenance required to remain viable. Perhaps alternative approaches for the dissemination of such apps should be considered for effective dissemination and adoption, e.g., pre-uploaded by mobile operators in disaster-prone areas.
The issue of limited impact, evidenced by low download numbers for many apps, is critically compounded by our finding that 55.8% of the reviewed applications are now inactive. This conclusion, derived from a rigorous, platform-specific verification, underscores a fundamental challenge in the field: sustainability. The high rate of inactive applications suggests that many are developed as short-term projects or by entities that lack a long-term maintenance model. This severely limits their potential for ongoing contribution to disaster preparedness, revealing a gap between the initial development of technological solutions and their long-term integration into disaster management strategies.
Strengths and Limitations
The study provides a comprehensive overview of disaster-related mobile applications globally, detailing their distribution, features, and the hazards they cover. By examining a substantial number of applications across diverse continents, the study offers valuable insights into the global landscape of disaster management tools. It highlights significant trends such as the prevalence of educational features, alert systems, and the varied focus on different types of hazards. This analysis aids in understanding how mobile applications contribute to disaster preparedness and response, revealing patterns in functionality and geographical distribution.
Despite its extensive coverage, the study has notable limitations. First, our reliance on academic databases means that many applications, especially those developed and used locally without a research component, might not be included, leading to potential publication bias. This gap may skew our findings toward applications developed in academic settings, potentially missing government-sponsored or locally funded apps. Second, the study predominantly includes applications documented in English, which may result in underreporting of apps from non-English speaking countries and introduce a geographical bias. Third, the completeness of our analysis was constrained by the inconsistent reporting of data within the primary studies we reviewed. For instance, key information such as the year of release for over a quarter of the apps and download statistics for nearly a third were unavailable, which impacted the comprehensiveness of our trend and adoption analysis.
There is also a near-total absence of user engagement metrics in the literature. While we could analyze metrics like download numbers, other crucial metrics such as active user statistics or user retention rates were not reported in the included studies. This prevents a deeper analysis of which applications are not only downloaded but are actively and effectively used by the public. Finally, the absence of a subgroup analysis means we could not explore potential differences in app characteristics between, for example, high-income and low-income countries. Such analysis could have revealed different priorities in app design. Apps from lower-income countries might prioritize offline functionality or SMS integration due to inconsistent internet connectivity, which we currently could not capture. We encourage future research focusing on these gaps.
Future Directions
Future research should move beyond describing app features to evaluating their real-world effectiveness and usefulness during a disaster event. Usability studies and impact assessments are crucial and should capture not just download counts but also active user statistics, user retention rate, in-app analysis, and qualitative analysis of user ratings and reviews from app stores to understand user needs and frustration. Additionally, given that a large proportion of apps have few downloads and over half are inactive, a critical area for study is the barrier to long-term adoption and maintenance; research should investigate the entire app lifecycle, from public awareness campaigns and user trust to the business and maintenance models that determine why so many apps become outdated or unavailable. Building on the example of Japan’s J-ALERT system, comparative research is needed as well. Future work could evaluate the effectiveness, reach, and public trust in dedicated, downloadable mobile apps versus integrated, multi-channel government alert systems that do not require an opt-in from users. This will help policymakers decide where to invest resources for the most resilient communication strategies.
Conclusions
In conclusion, disaster-related mobile apps play a critical role in public education, early warning systems, and overall disaster management. The rise in app development corresponds to the increasing need for technological tools in disaster preparedness, response, and recovery. However, the variation in download numbers may reflect a number of underlying factors, such as the applications’ utility and user familiarity, emphasizing their growing importance in disaster management efforts globally.
To enhance the effectiveness of disaster mobile applications, future efforts should focus on increasing accessibility, expanding feature integration, and fostering stakeholder collaboration. Ensuring that these applications are accessible to vulnerable populations by incorporating accessibility features such as voice interaction, text-to-speech, speech-to-text, or haptic feedback; developing clear and simple interfaces such as using high-contrast color schemes and large, readable fonts to accommodate users with visual impairments. This is especially crucial for low-income regions where disaster impacts are most severe. Integrating advanced technologies like predictive analytics, real-time data sharing, and offline functionality can further improve preparedness and response. Additionally, fostering international harmonization to standardize application features and promote knowledge sharing across borders can lead to more comprehensive and universally effective tools for disaster management.
Supplementary material
The supplementary material for this article can be found at http://doi.org/10.1017/dmp.2025.10252.
Data availability statement
The data sets generated during and/or analyzed during this study are available from the corresponding author on reasonable request.
Acknowledgments
We would like to thank the Indonesian National Agency of Disaster Management (BNPB) and the World Bank for their immense support in this project.
Author contribution
Dewi Nur Aisyah led the study design, conducted the search strategy, performed paper screening for abstract and full-text review, and carried out data analysis. Dewi Nur Aisyah built the paper concept and supported the development of the methodology. Fauziah Mauly Rahman and Haniena Diva performed paper screening for abstract and full-text review, as well as built the first draft of the paper. Bambang Surya Putra, Muhammad Halik Rizki, and Mizan Bustanul Fuady Bisri validated the study and critically revised the manuscript content. Dewi Nur Aisyah had primary responsibility for the final content. All authors read and contributed to reviewing the study data, the manuscript design, and the approval of the final manuscript.
Funding statement
This research was carried out as part of the Indonesia Disaster Resilience Initiatives Project (IDRIP) under the Indonesian National Agency of Disaster Management (BNPB), supported by the World Bank.
Competing interests
While one of the authors is affiliated with Aceso Global Health Consultants Pte Limited, which is a private company, we declare that this research project does not receive funding from Aceso Global Health Consultants. The company does not have a role in the study design, data collection and analysis, decision to publish, or preparation of the manuscript.


 Open access