


I. INTRODUCTION
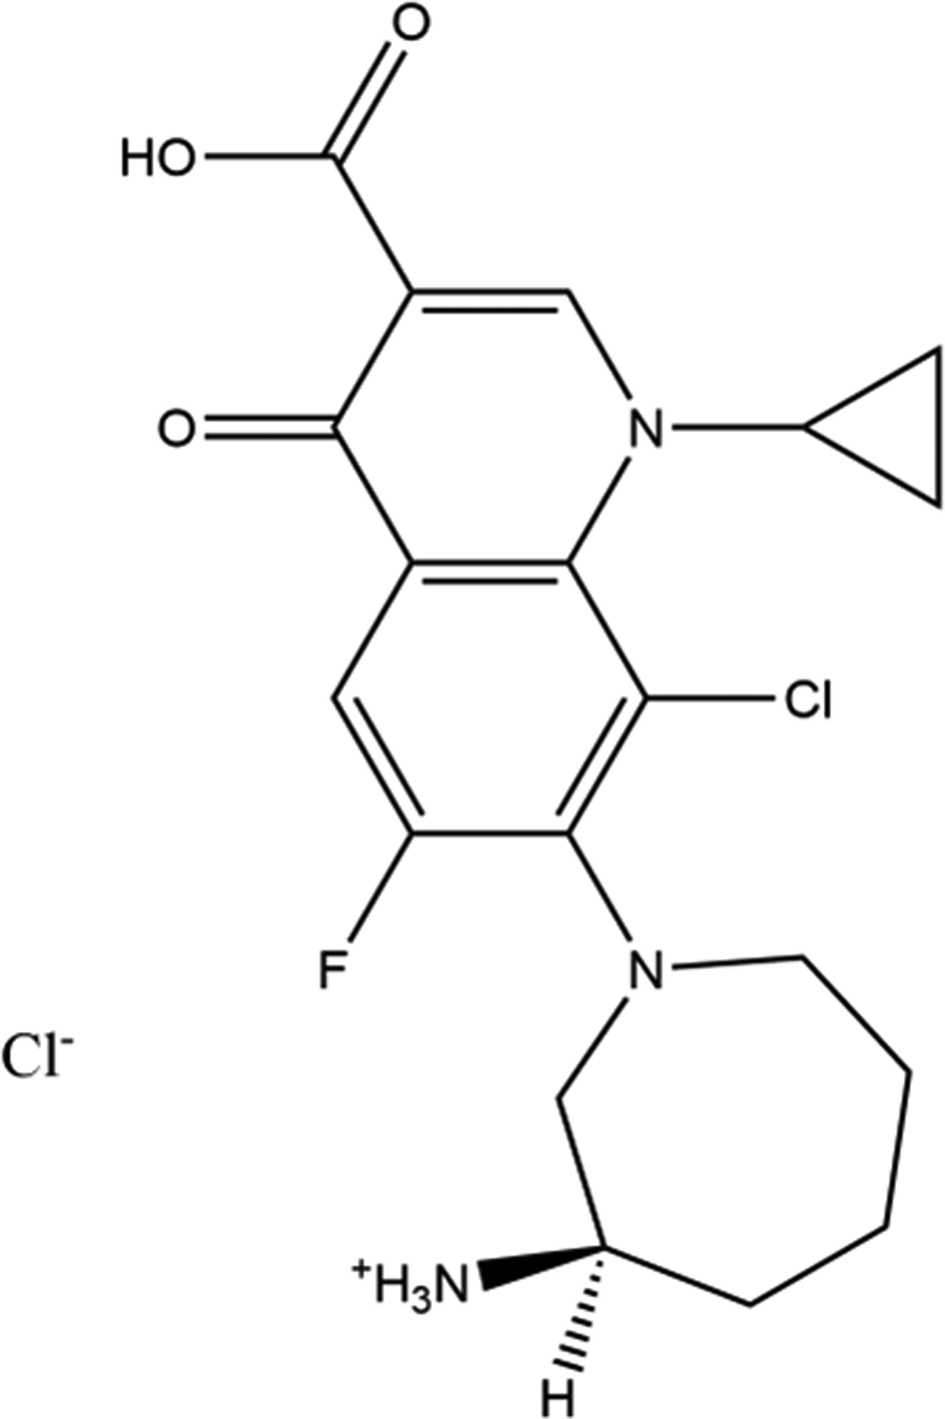
Besifloxacin hydrochloride (sold under the brand name Besivance) is a fourth-generation fluoroquinolone-type ophthalmic antibiotic for the treatment of bacterial conjunctivitis. It was approved by the FDA on May 28, 2009. The systematic name (CAS Registry Number 405165-61-9) is 7-[(3R)-3-aminoazepan-1-yl]-8-chloro-1-cyclopropyl-6-fluoro-4-oxoquinoline-3-carboxylic acid hydrochloride. A two-dimensional (2D) molecular diagram is shown in Figure 1.
The 2D molecular structure of besifloxacin hydrochloride.
Besifloxacin free base is claimed as a treatment for ophthalmic infections in US Patent 8,415,342 (Tyle et al., Reference Tyle, Gupta, Norton, Brunner and Blondeau2013; Bausch & Lomb), but no X-ray powder diffraction data are provided. US Patent 8,481,526 (King, Reference King2013a; Bausch & Lomb) claims a molecular crystal form of (R)-(+)-besifloxacin with X-ray powder diffraction peaks at 10.6, 15, 19.7, 21.1, and 22 ± 0.2° 2θ (Cu radiation), and powder patterns for both the free base and hydrochloride salt are provided. Similar diffraction patterns are also contained in US Patent 8,604,020 (King, Reference King2013b; Bausch & Lomb). An Australian Department of Health report (2013) notes that besifloxacin hydrochloride may exist as a racemic mixture of the R-(+) and S-(−) enantiomers; although both enantiomers exhibit antibacterial activity, the active limit for a proposed ophthalmic product is the R-enantiomer with a limit on the S-enantiomer of 0.5 wt%.
This work was carried out as part of a project (Kaduk et al., Reference Kaduk, Crowder, Zhong, Fawcett and Suchomel2014) to determine the crystal structures of large-volume commercial pharmaceuticals, and include high-quality powder diffraction data for them in the Powder Diffraction File (Gates-Rector and Blanton, Reference Gates-Rector and Blanton2019).
II. EXPERIMENTAL
Besifloxacin hydrochloride was a commercial reagent, purchased from TargetMol (Lot #119778), and was used as-received. The taupe powder was packed into a 1.5-mm diameter Kapton capillary, and rotated during the measurement at ~50 Hz. The powder pattern was measured at 295 K at beamline 11-BM (Antao et al., Reference Antao, Hassan, Wang, Lee and Toby2008; Lee et al., Reference Lee, Shu, Ramanathan, Preissner, Wang, Beno, Von Dreele, Ribaud, Kurtz, Antao, Jiao and Toby2008; Wang et al., Reference Wang, Toby, Lee, Ribaud, Antao, Kurtz, Ramanathan, Von Dreele and Beno2008) of the Advanced Photon Source at Argonne National Laboratory using a wavelength of 0.458968(2) Å from 0.5 to 50° 2θ with a step size of 0.001° and a counting time of 0.1 s/step. The high-resolution powder diffraction data were collected using twelve silicon crystal analyzers that allow for high angular resolution, high precision, and accurate peak positions. A silicon (NIST SRM 640c) and alumina (SRM 676a) standard (ratio Al2O3:Si = 2:1 by weight) was used to calibrate the instrument and refine the monochromatic wavelength used in the experiment.
The pattern was indexed using JADE Pro (MDI, 2022) on a primitive triclinic unit cell with a = 5.35777, b = 10.31251, c = 17.93803 Å, α = 98.12, β = 92.95, γ = 96.14°, V = 973.31 Å3, and Z = 2. A reduced cell search in the Cambridge Structural Database (Groom et al., Reference Groom, Bruno, Lightfoot and Ward2016) yielded no hits.
A besifloxacin molecule was downloaded from PubChem (Kim et al., Reference Kim, Chen, Cheng, Gindulyte, He, He, Li, Shoemaker, Thiessen, Yu, Zaslavsky, Zhang and Bolton2019) as Conformer3D_CID_10178705.sdf. It was converted to a *.mol2 file using Mercury (Macrae et al., Reference Macrae, Sovago, Cottrell, Galek, McCabe, Pidcock, Platings, Shields, Stevens, Towler and Wood2020). Since at this point it was unclear whether the space group was P1 or P-1, structure solution was attempted in both space groups using Monte Carlo simulated annealing techniques as implemented in EXPO2014 (Altomare et al., Reference Altomare2013). In space group P-1, one besifloxacin and one Cl atom were used as fragments, while in space group P1, two of each were required. Space group P-1 yielded solutions with much lower residuals and reasonable hydrogen bonding patterns, so the racemic model seemed to be a better explanation for this powder pattern. Analysis of potential hydrogen bonding made it clear that N8 was protonated, so H50 was added to that nitrogen atom. In the initial solution, the carboxylic acid proton H48 pointed away from the rest of the molecule. This carboxylic acid group is adjacent to the carbonyl group O3, in position to form an intramolecular hydrogen bond. Preliminary DFT calculations suggested that this structure with the intramolecular hydrogen bond was much lower in energy (18.0 kcal/mol), so it was adopted for the refinement.
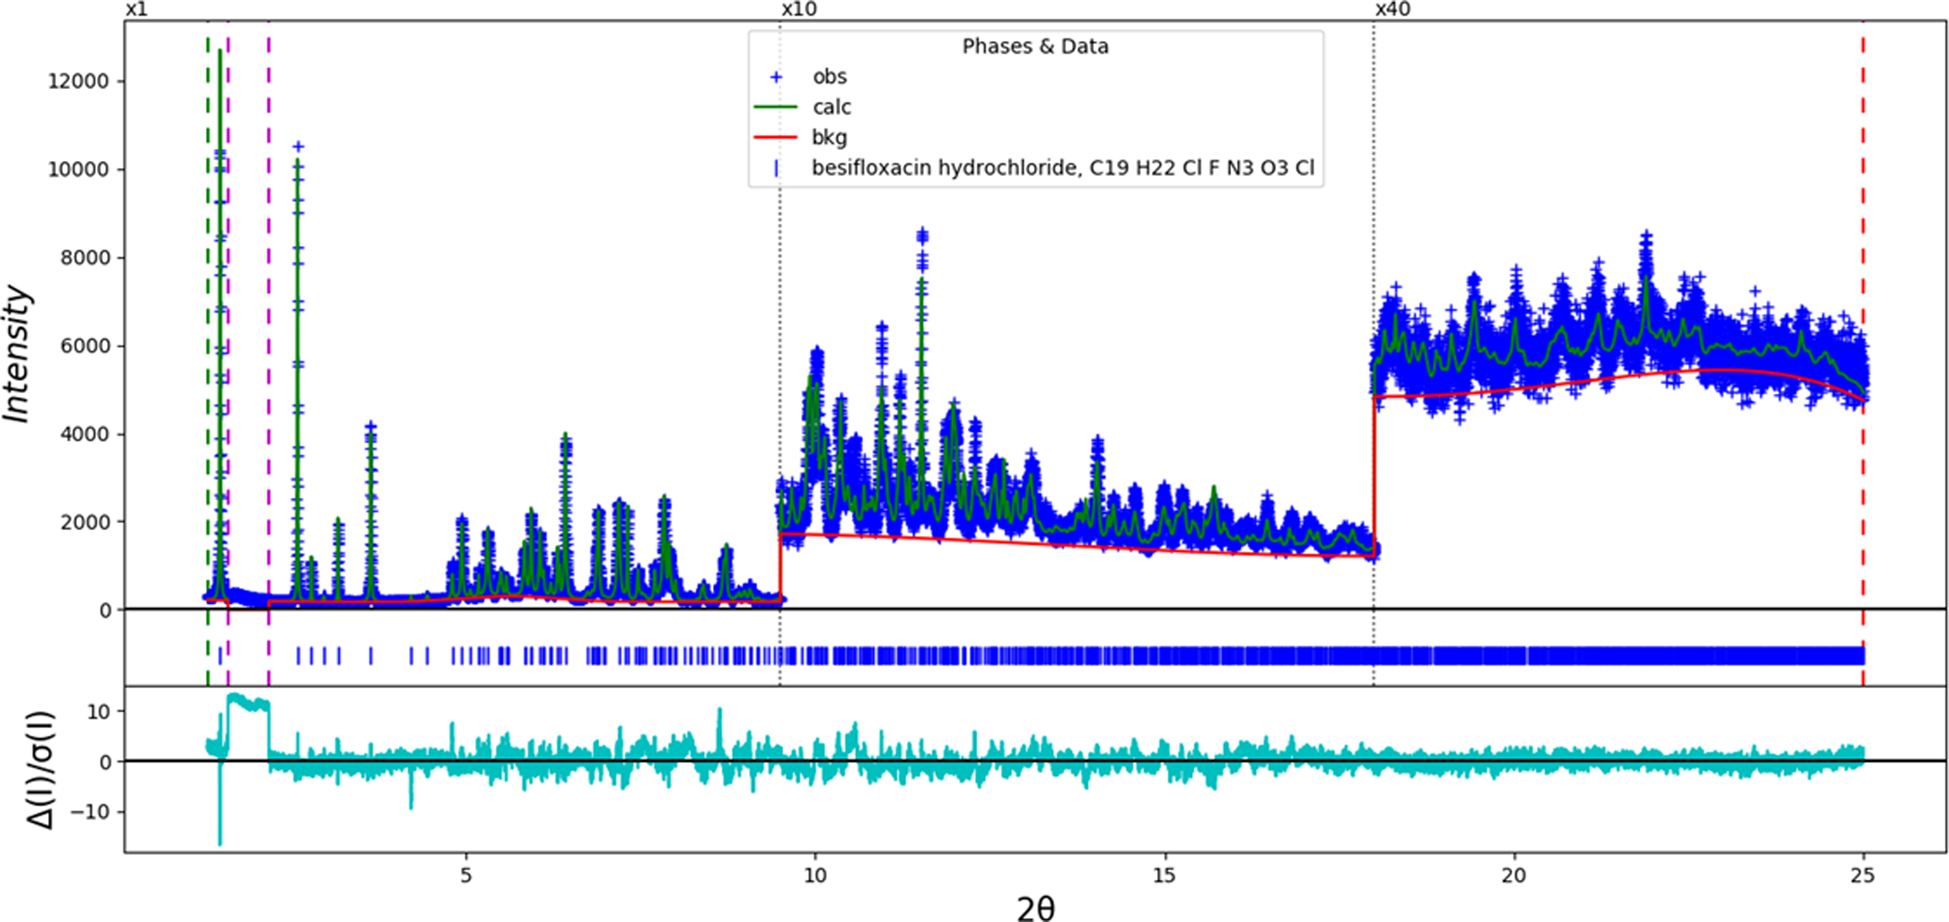
A refinement of 111 variables using 23,150 observations and 75 restraints yielded the residuals R wp = 0.0972 and GOF = 1.66 (Figure 2). The root-mean-square (rms) Cartesian displacement between the Rietveld-refined and DFT-optimized structures was 0.286 Å (near the upper limit of the normal range for correct powder structures), and the maximum difference was 0.619 Å, at N8. The displacement coefficient of the atoms in the azepane ring was larger than those in the other parts of the molecule, suggesting that further examination of the structure was warranted.
The Rietveld plot for the (incorrect) refinement of besifloxacin hydrochloride in space group P-1. The blue crosses represent the observed data points, and the green line is the calculated pattern. The cyan curve is the normalized error plot, and the red curve indicates the background. The vertical scale has been multiplied by a factor of 10× for 2θ > 9.5° and by 40× for 2θ > 18.0°. The row of blue tick marks indicates the calculated reflection positions. R wp = 0.0972 and GOF = 1.66.
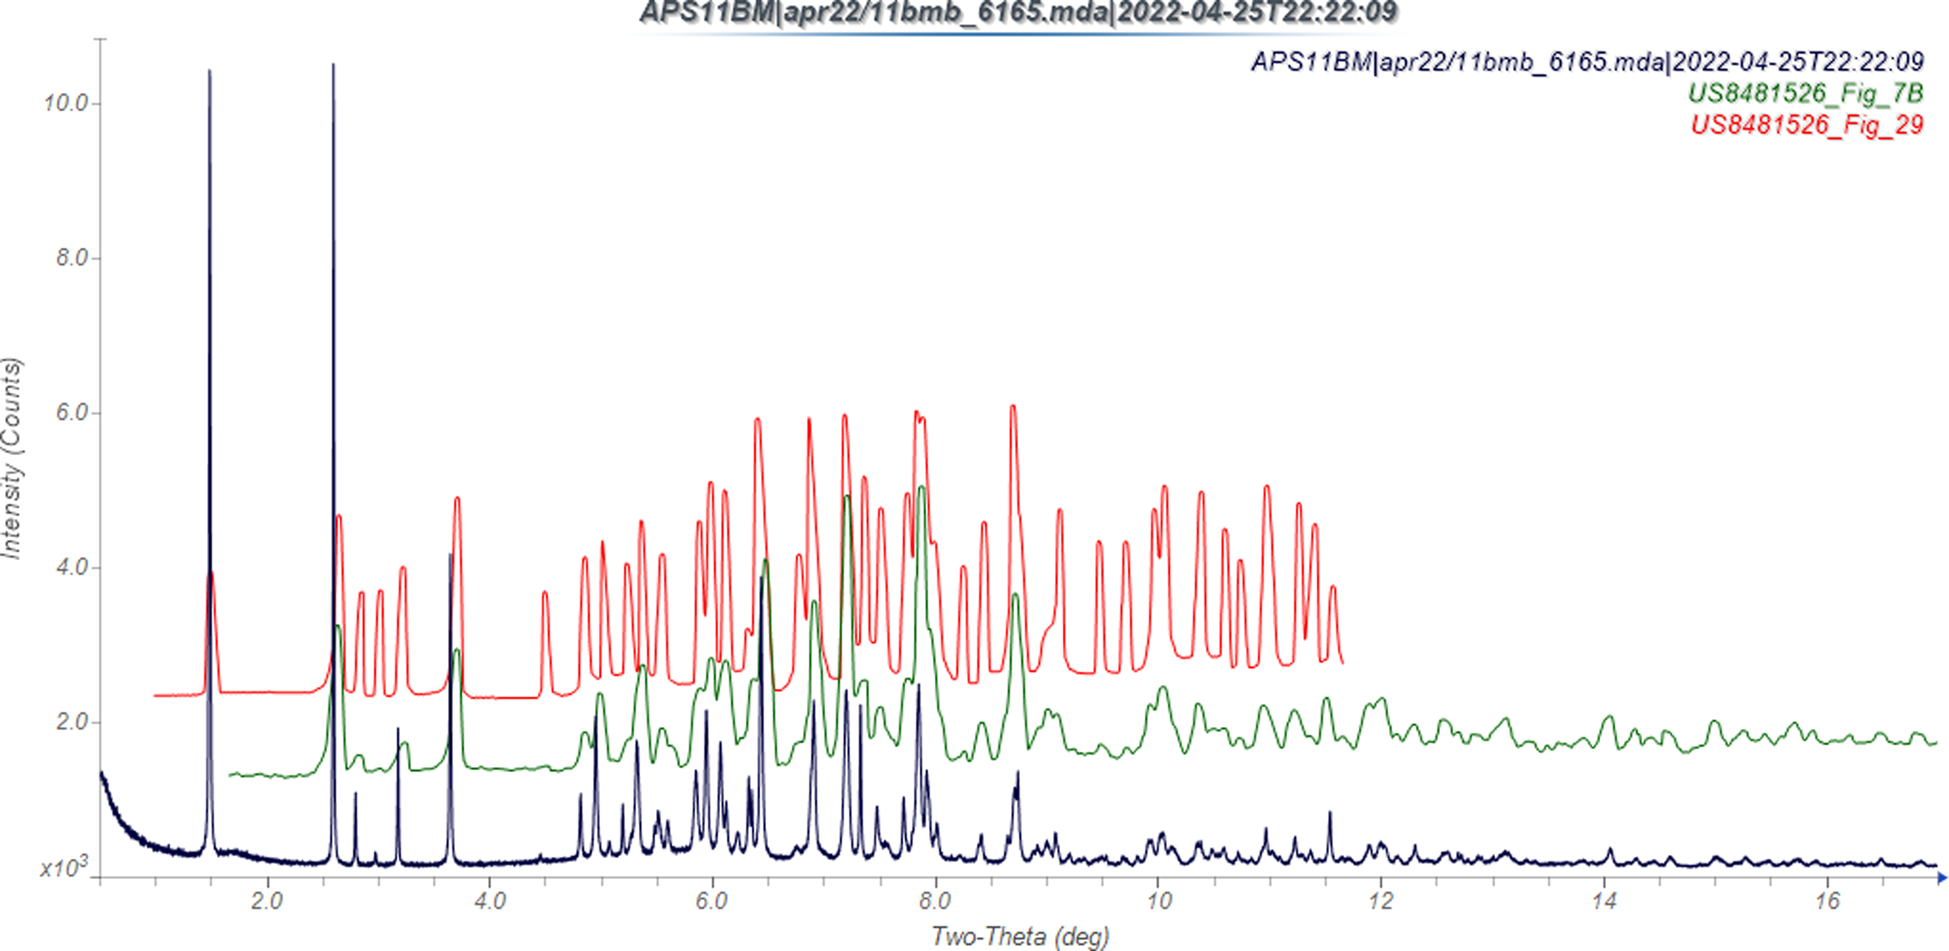
The synchrotron powder pattern of this study matches the patterns for lot 051157469 of besifloxacin hydrochloride and for micronized besifloxacin hydrochloride reported by King (Reference King2013b) well enough to conclude that they represent the same material (Figure 3). This lot was considered to be representative of material used to formulate pharmaceutical compositions, but the patent refers only to the R-(+) enantiomer of besifloxacin. It seems unlikely that racemic and enantiopure besifloxacin hydrochloride would crystallize in the same lattice, so we are forced to conclude that our material is the R-(+) enantiomer, and that space group P-1 is incorrect.
Comparison of the synchrotron pattern of besifloxacin hydrochloride (black) to those reported by King (Reference King2013b); the pattern for “normal” besifloxacin hydrochoride is in green, and that of micronized material is in red. The literature patterns, measured using CuKα radiation, were digitized using UN-SCAN-IT (Silk Scientific, 2013), and converted to the synchrotron wavelength of 0.458968 Å using JADE Pro (MDI, 2022). Image generated using JADE Pro (MDI, 2022).
Since (as noted above) direct solutions in P1 did not yield chemically reasonable models, the P-1 structure was converted to space group P1 using Material Studio (Dassault, 2021). The atoms were renumbered, so that the previous S-(−) molecule became molecule 2 (with higher atom numbers). The chirality of C63–H83 was changed manually, and the resulting structure was optimized using the Forcite module. This model was used to begin a new Rietveld refinement.
Rietveld refinement was carried out using GSAS-II (Toby and Von Dreele, Reference Toby and Von Dreele2013). Only the 1.3–25.0° portion of the pattern was included in the refinement (d min = 1.060 Å). The region from 1.59 to 2.18° 2θ, which contained a broad peak from the Kapton capillary, was excluded. The coordinates of Cl1 were fixed to define the origin. All non-H bond distances and angles were subjected to restraints, based on a Mercury/Mogul Geometry Check (Bruno et al., Reference Bruno, Cole, Kessler, Luo, Motherwell, Purkis, Smith, Taylor, Cooper, Harris and Orpen2004; Sykes et al., Reference Sykes, McCabe, Allen, Battle, Bruno and Wood2011). The Mogul average and standard deviation for each quantity were used as the restraint parameters. Since initial refinement tended to invert the chirality of C63, additional non-bonded distance restraints of C63⋯N57 = 2.57(3) and C63⋯C70 = 2.58(3) Å were applied. The restraints contributed 14.6% to the final χ 2. The hydrogen atoms were included in calculated positions, which were recalculated during the refinement using Materials Studio (Dassault, 2021). The U iso of the heavy atoms were grouped by chemical similarity. The U iso for the H atoms were fixed at 1.2× the U iso of the heavy atoms to which they are attached. The peak profiles were described using the generalized microstrain model. The background was modeled using a 6-term shifted Chebyshev polynomial, and a peak at 5.61° 2θ to model the scattering from the Kapton capillary and any amorphous component.
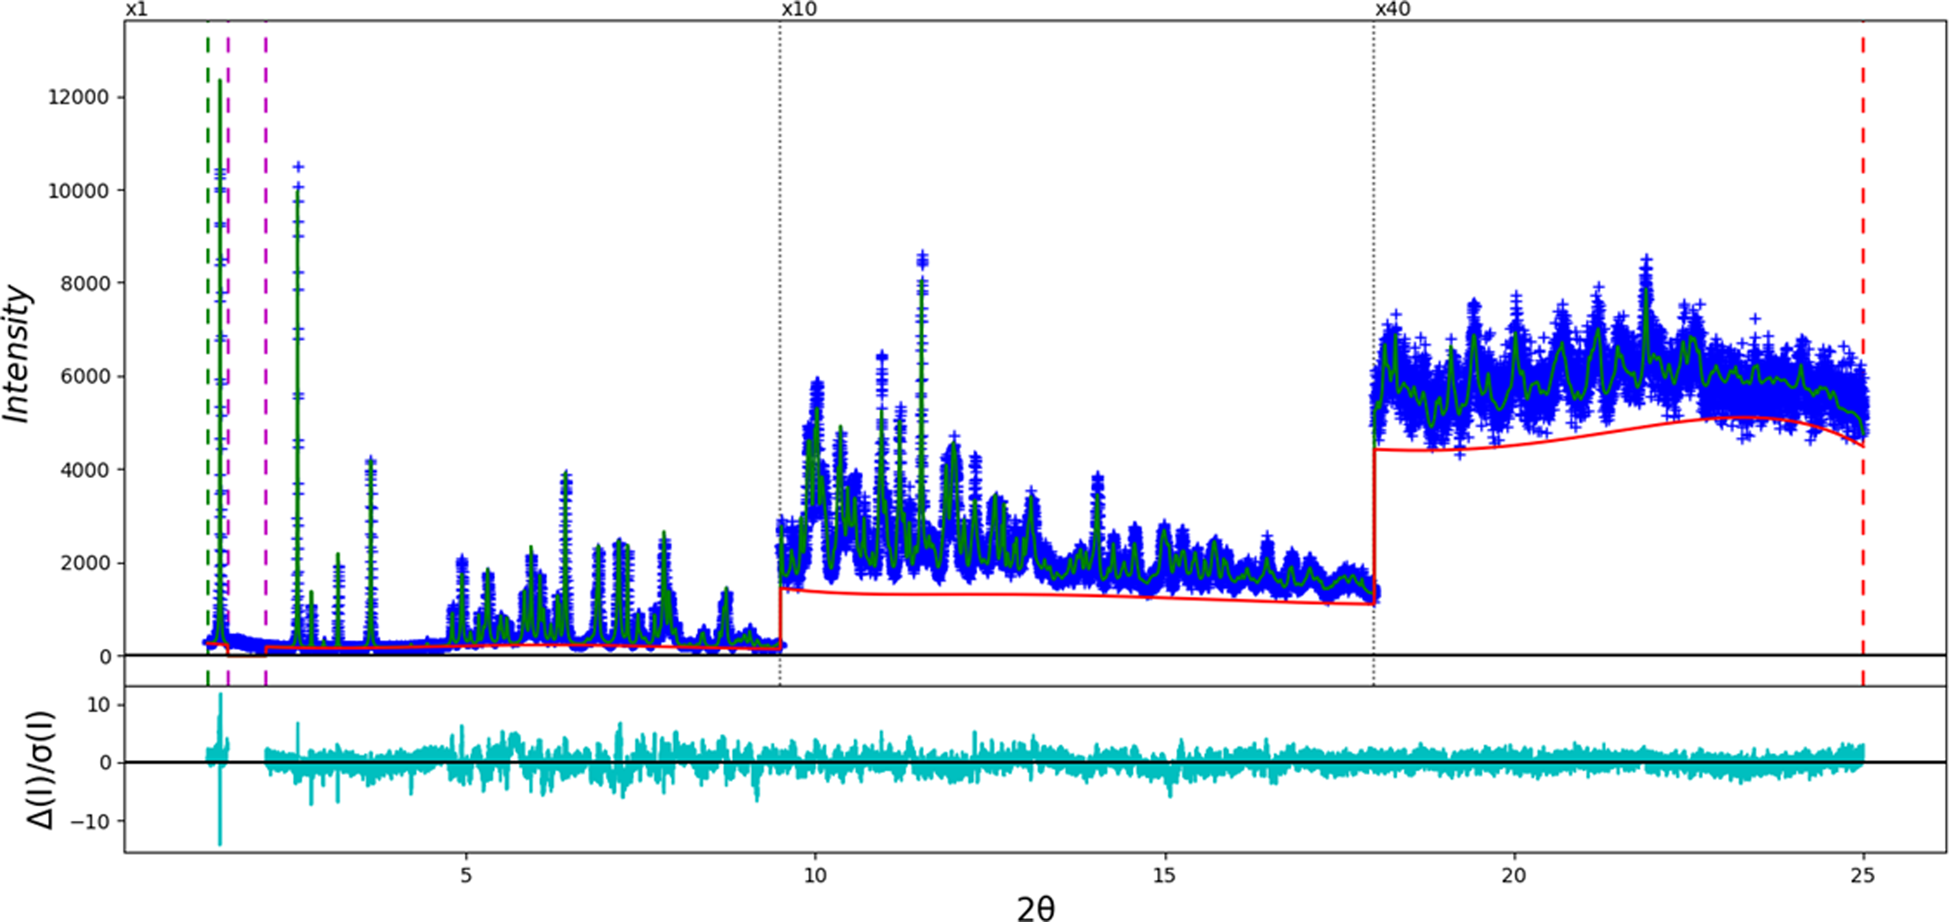
The final refinement (begun from the result of the DFT calculation) of 206 variables using 23,187 observations and 153 restraints yielded the residuals R wp = 0.0869 and GOF = 1.48. The largest peak (0.36 Å from Cl51) and hole (2.19 Å from Cl1) in the difference Fourier map were 0.32(7) and −0.27(7) eÅ−3, respectively. The largest errors in the difference plot (Figure 4) are in the shape of the lowest-angle (001) peak. The P1 refinement yielded improved residuals, at the cost of more parameters.
The Rietveld plot for the (correct) refinement of besifloxacin hydrochloride in space group P1. The blue crosses represent the observed data points, and the green line is the calculated pattern. The cyan curve is the normalized error plot, and the red curve indicates the background. The vertical scale has been multiplied by a factor of 10× for 2θ > 9.5°, and by 40× for 2θ > 18.0°. The row of blue tick marks indicates the calculated reflection positions. R wp = 0.0869 and GOF = 1.48.
The crystal structure was optimized using VASP (Kresse and Furthmüller, Reference Kresse and Furthmüller1996) (fixed experimental unit cell) through the MedeA graphical interface (Materials Design, 2016). The calculation was carried out on 16 2.4 GHz processors (each with 4 GB RAM) of a 64-processor HP Proliant DL580 Generation 7 Linux cluster at North Central College. The calculation used the GGA-PBE functional, a plane wave cutoff energy of 400.0 eV, and a k-point spacing of 0.5 Å−1 leading to a 3 × 2 × 1 mesh, and took ~11.2 h. A single-point density functional theory calculation (fixed experimental cell) and population analysis were carried out using CRYSTAL17 (Dovesi et al., Reference Dovesi, Erba, Orlando, Zicovich-Wilson, Civalleri, Maschio, Rerat, Casassa, Baima, Salustro and Kirtman2018). The basis sets for the H, C, N, and O atoms in the calculation were those of Gatti et al. (Reference Gatti, Saunders and Roetti1994), and those for F and Cl were those of Peintinger et al. (Reference Peintinger, Vilela Oliveira and Bredow2013). The calculations were run on a 3.5 GHz PC using 8 k-points and the B3LYP functional, and took ~50 h.
III. RESULTS AND DISCUSSION
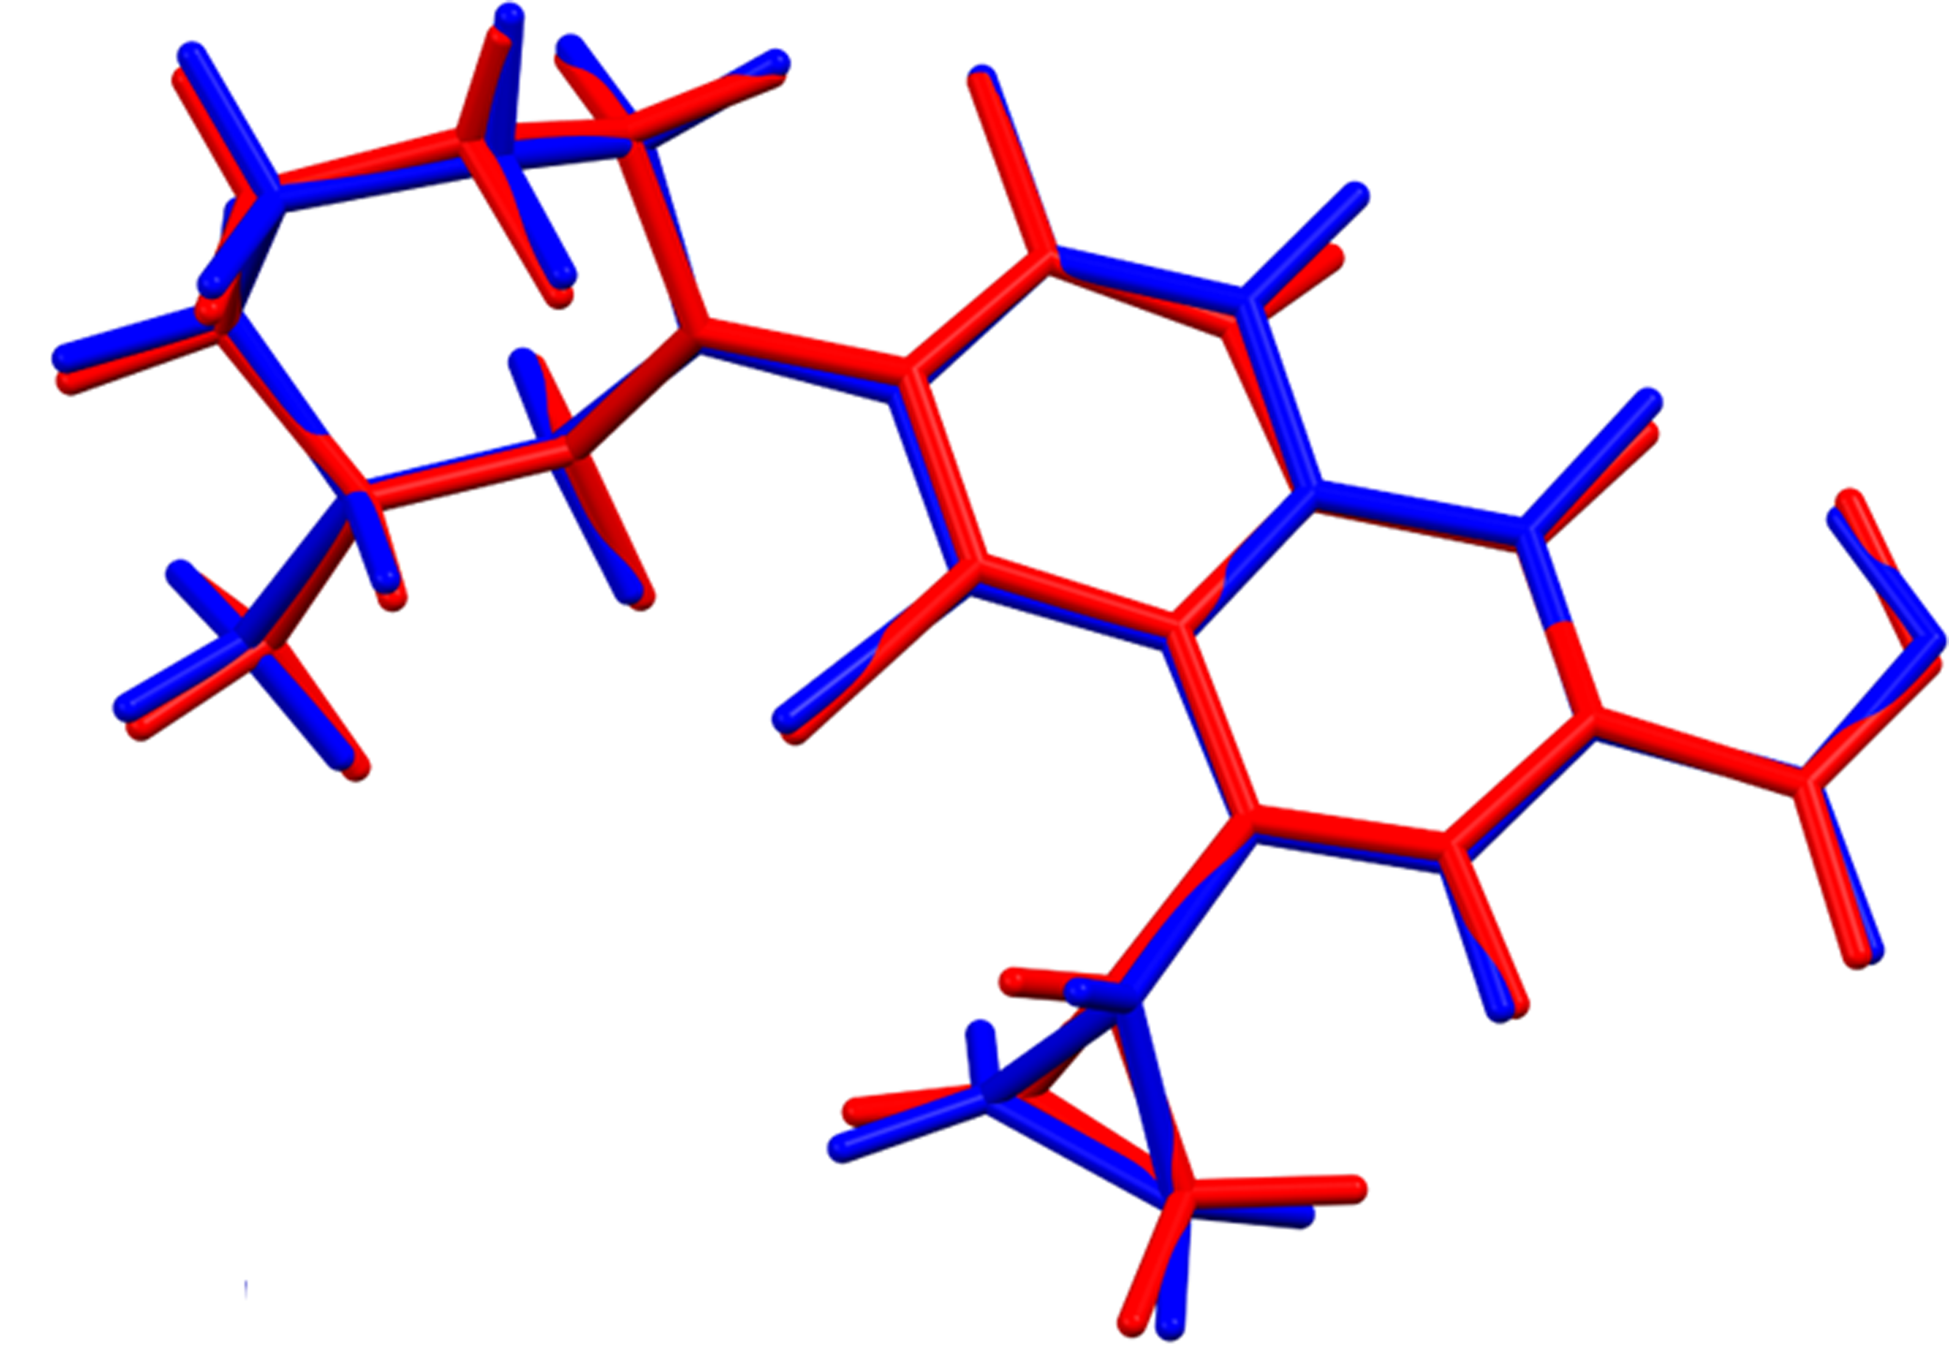
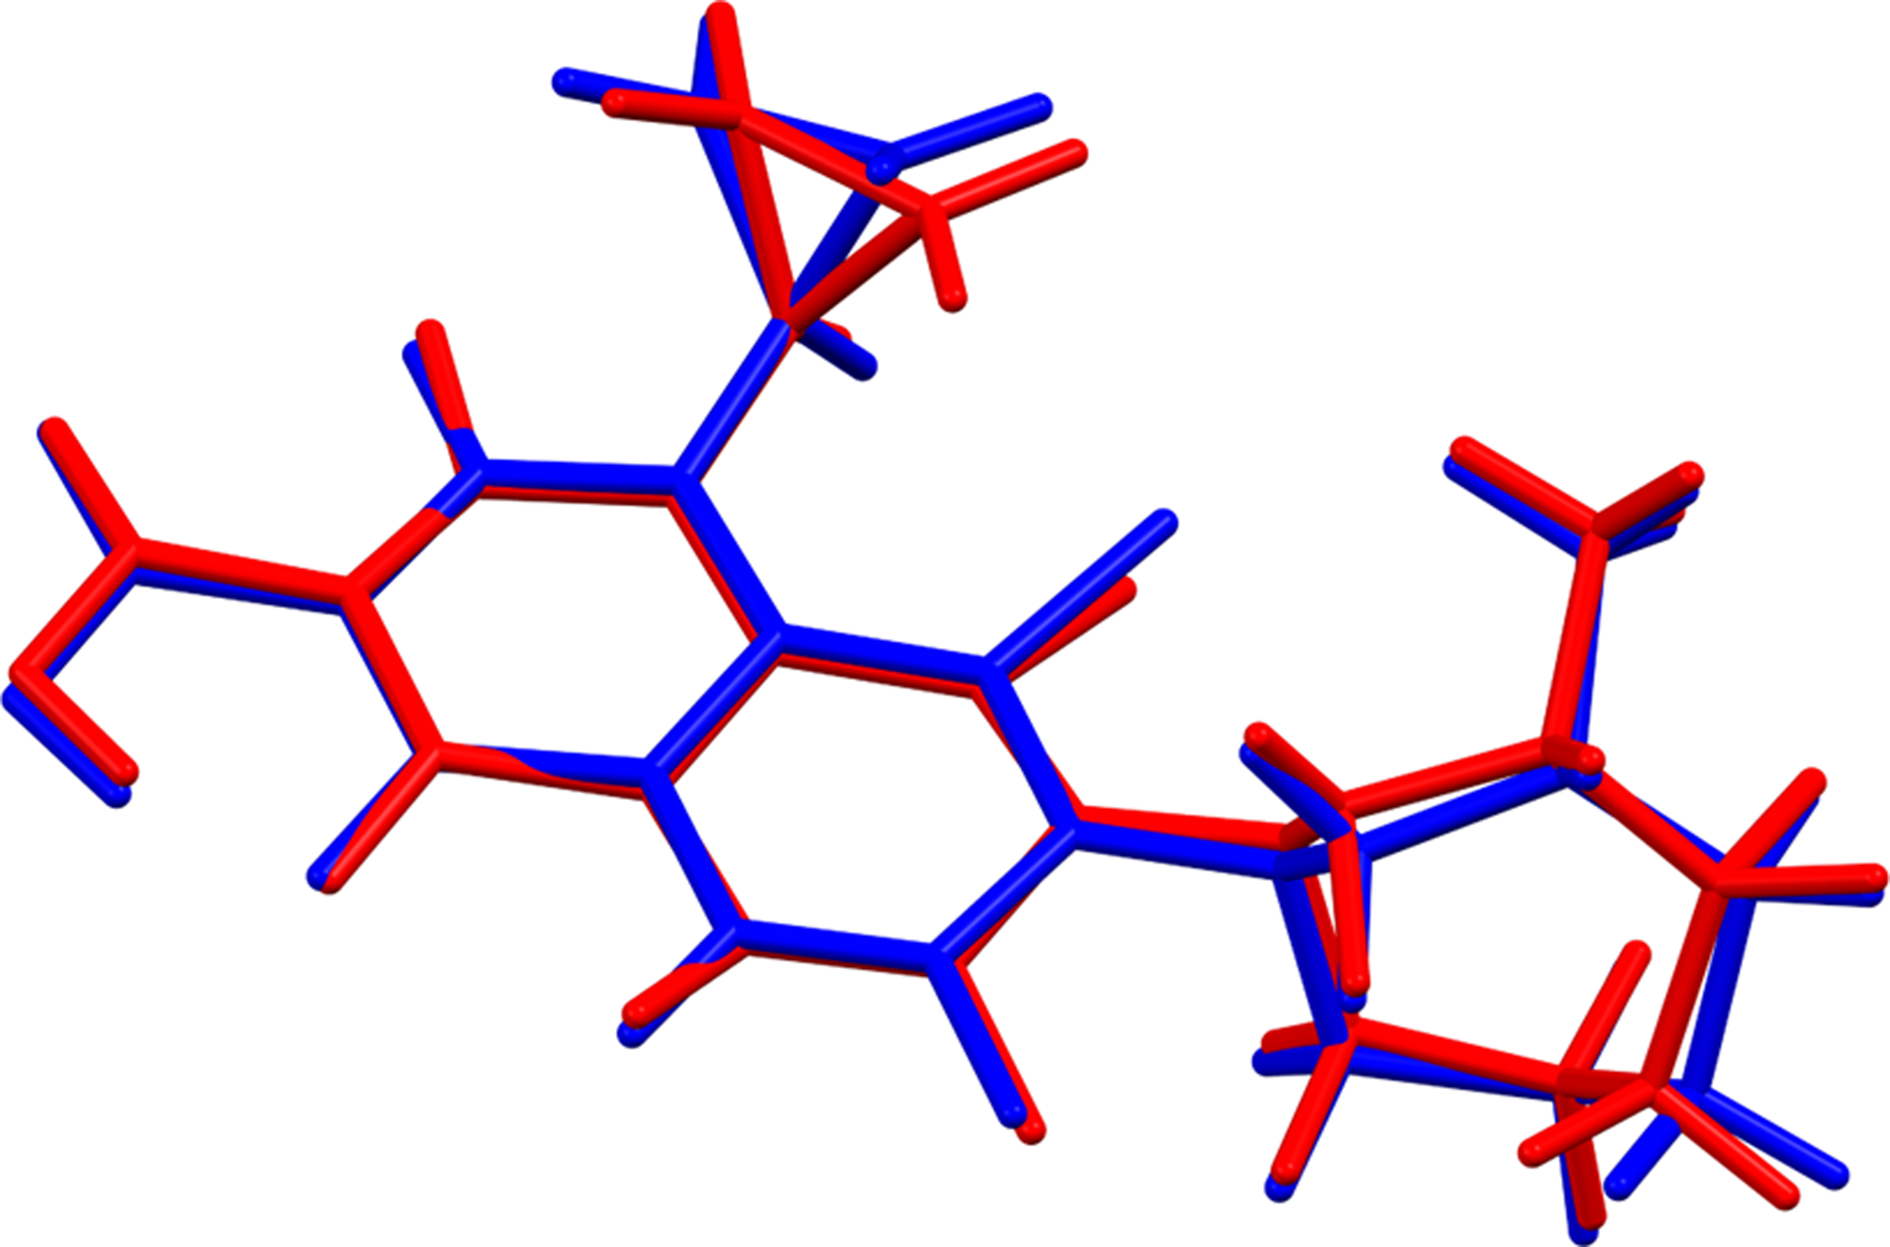
The rms Cartesian displacements between the Rietveld-refined and DFT-optimized structures of cation 1 and cation 2 are 0.195 and 0.304 Å (Figures 5 and 6), respectively. The absolute positions of Cl51 differ by 1.059 Å in the refined and optimized structures, possibly indicating some disorder. These values are within the normal range for correct powder structures (van de Streek and Neumann, Reference van de Streek and Neumann2014). This discussion concentrates on the DFT-optimized structure. The incorrect P-1 structure (purple in Figure 7) differs from the correct P1 structure (green) mainly in the conformation of the azepane ring of molecule 2 (the S-enantiomer in the P-1 structure). The rms Cartesian displacement between these two molecules is 0.434 Å, and the maximum difference is 1.064 Å. The comparable quantities for molecule 1 are 0.299 and 0.598 Å. The asymmetric unit (with atom numbering) is illustrated in Figure 8. The displacement coefficients of the atoms in the cyclopropane ring of molecule 1 and the azepane ring of molecule 2 are larger than for other parts, and suggest that there may be some conformational disorder.
Comparison of the Rietveld-refined (red) and VASP-optimized (blue) structures of cation 1 of besifloxacin hydrochloride. The rms Cartesian displacement is 0.195 Å. Image generated using Mercury (Macrae et al., Reference Macrae, Sovago, Cottrell, Galek, McCabe, Pidcock, Platings, Shields, Stevens, Towler and Wood2020).
Comparison of the Rietveld-refined (red) and VASP-optimized (blue) structures of cation 2 of besifloxacin hydrochloride. The rms Cartesian displacement is 0.304 Å. Image generated using Mercury (Macrae et al., Reference Macrae, Sovago, Cottrell, Galek, McCabe, Pidcock, Platings, Shields, Stevens, Towler and Wood2020).
Comparison of the correct P1 structure (green) to the incorrect P-1 structure (purple) of besifloxacin hydrochloride. Image generated using Mercury (Macrae et al., Reference Macrae, Sovago, Cottrell, Galek, McCabe, Pidcock, Platings, Shields, Stevens, Towler and Wood2020).
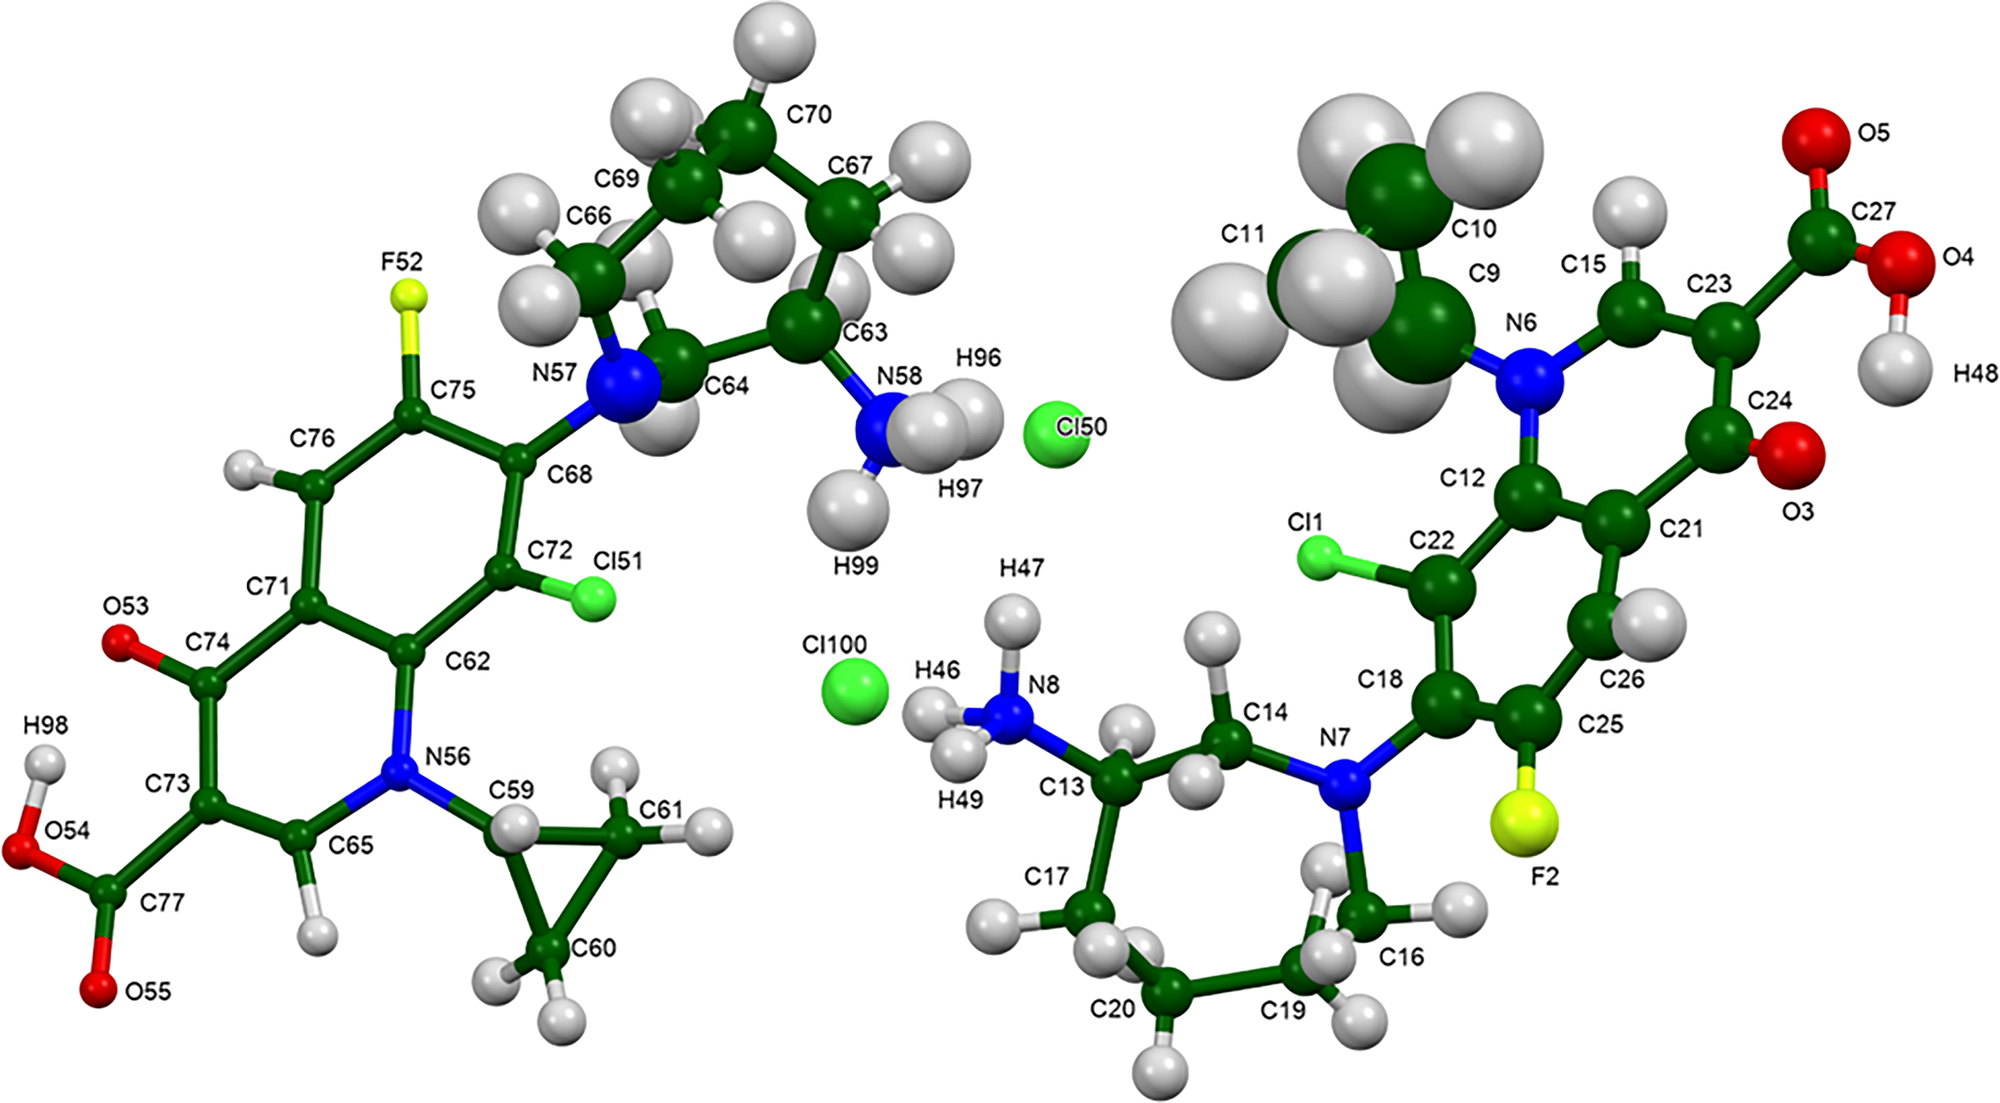
The asymmetric unit of besifloxacin hydrochloride, with the atom numbering. The atoms are represented by 50% probability spheroids. Image generated using Mercury (Macrae et al., Reference Macrae, Sovago, Cottrell, Galek, McCabe, Pidcock, Platings, Shields, Stevens, Towler and Wood2020).
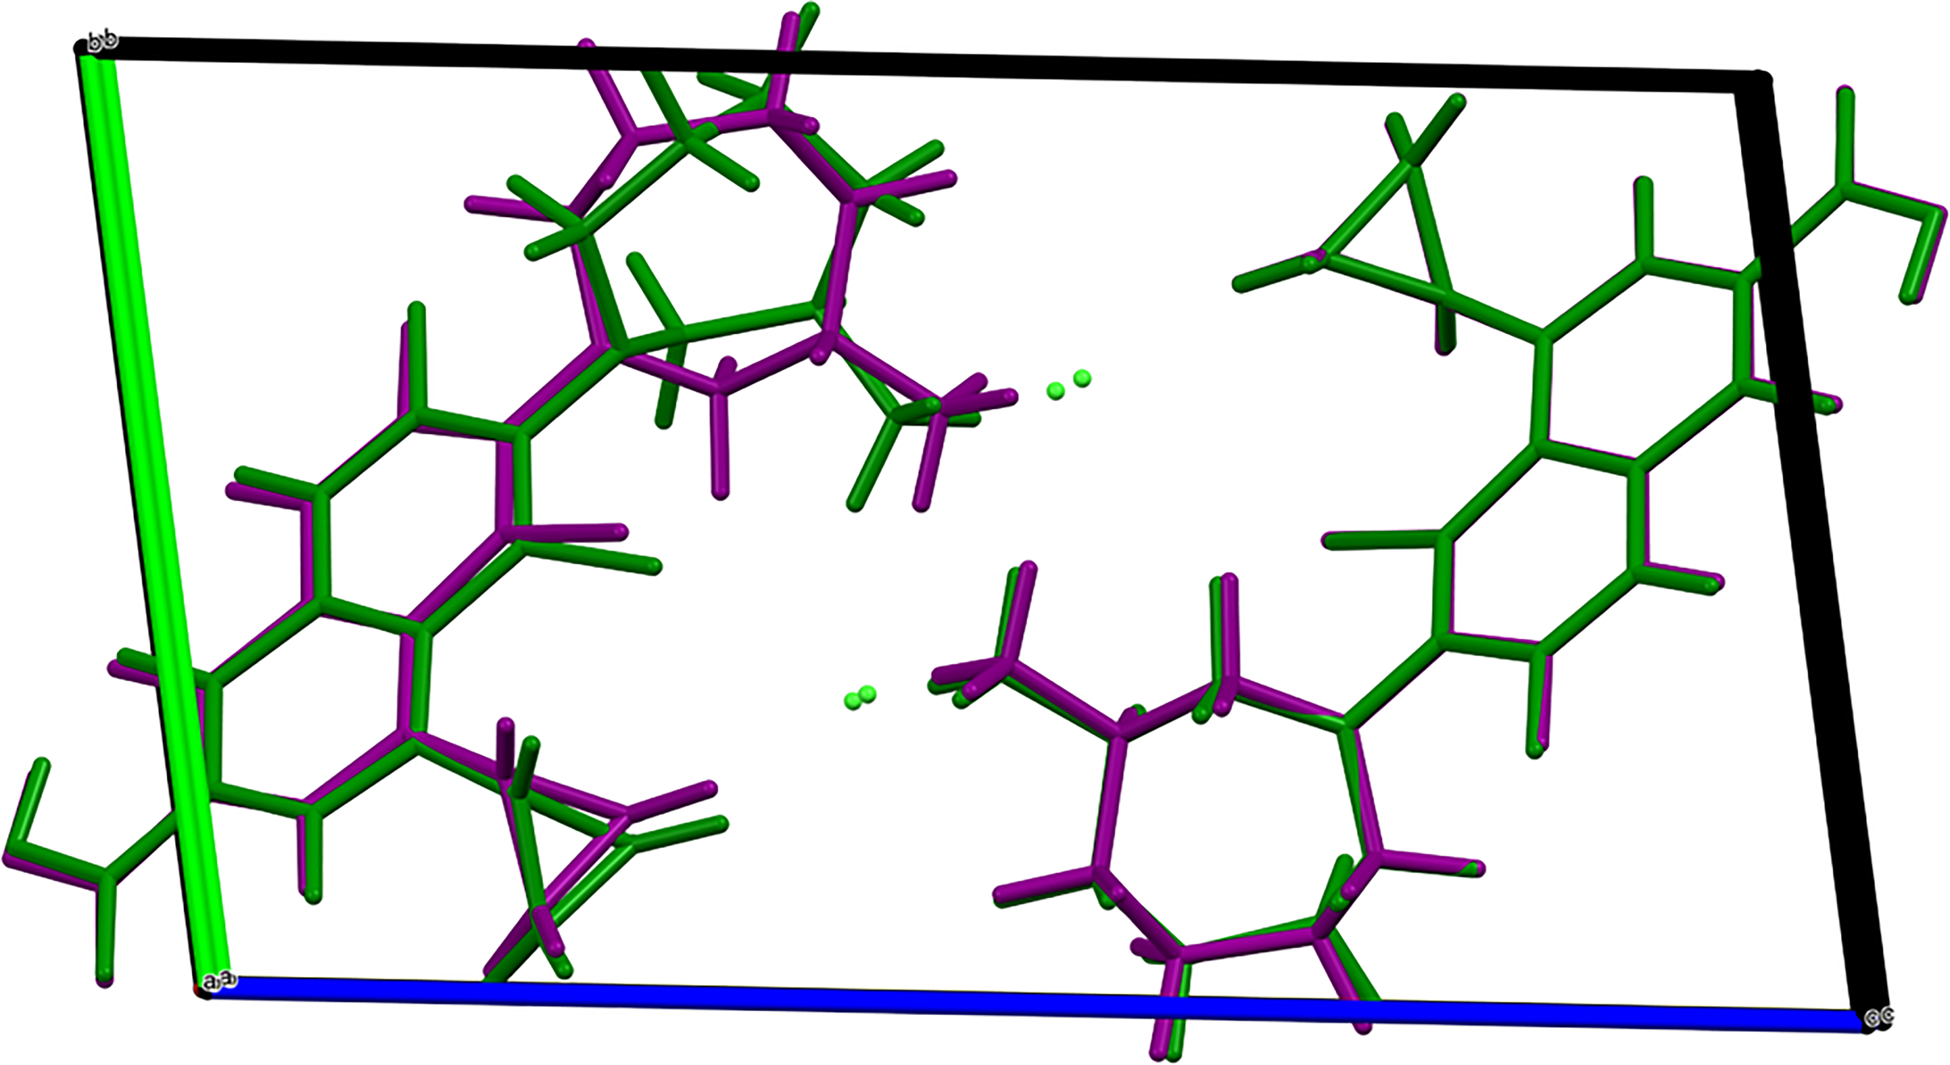
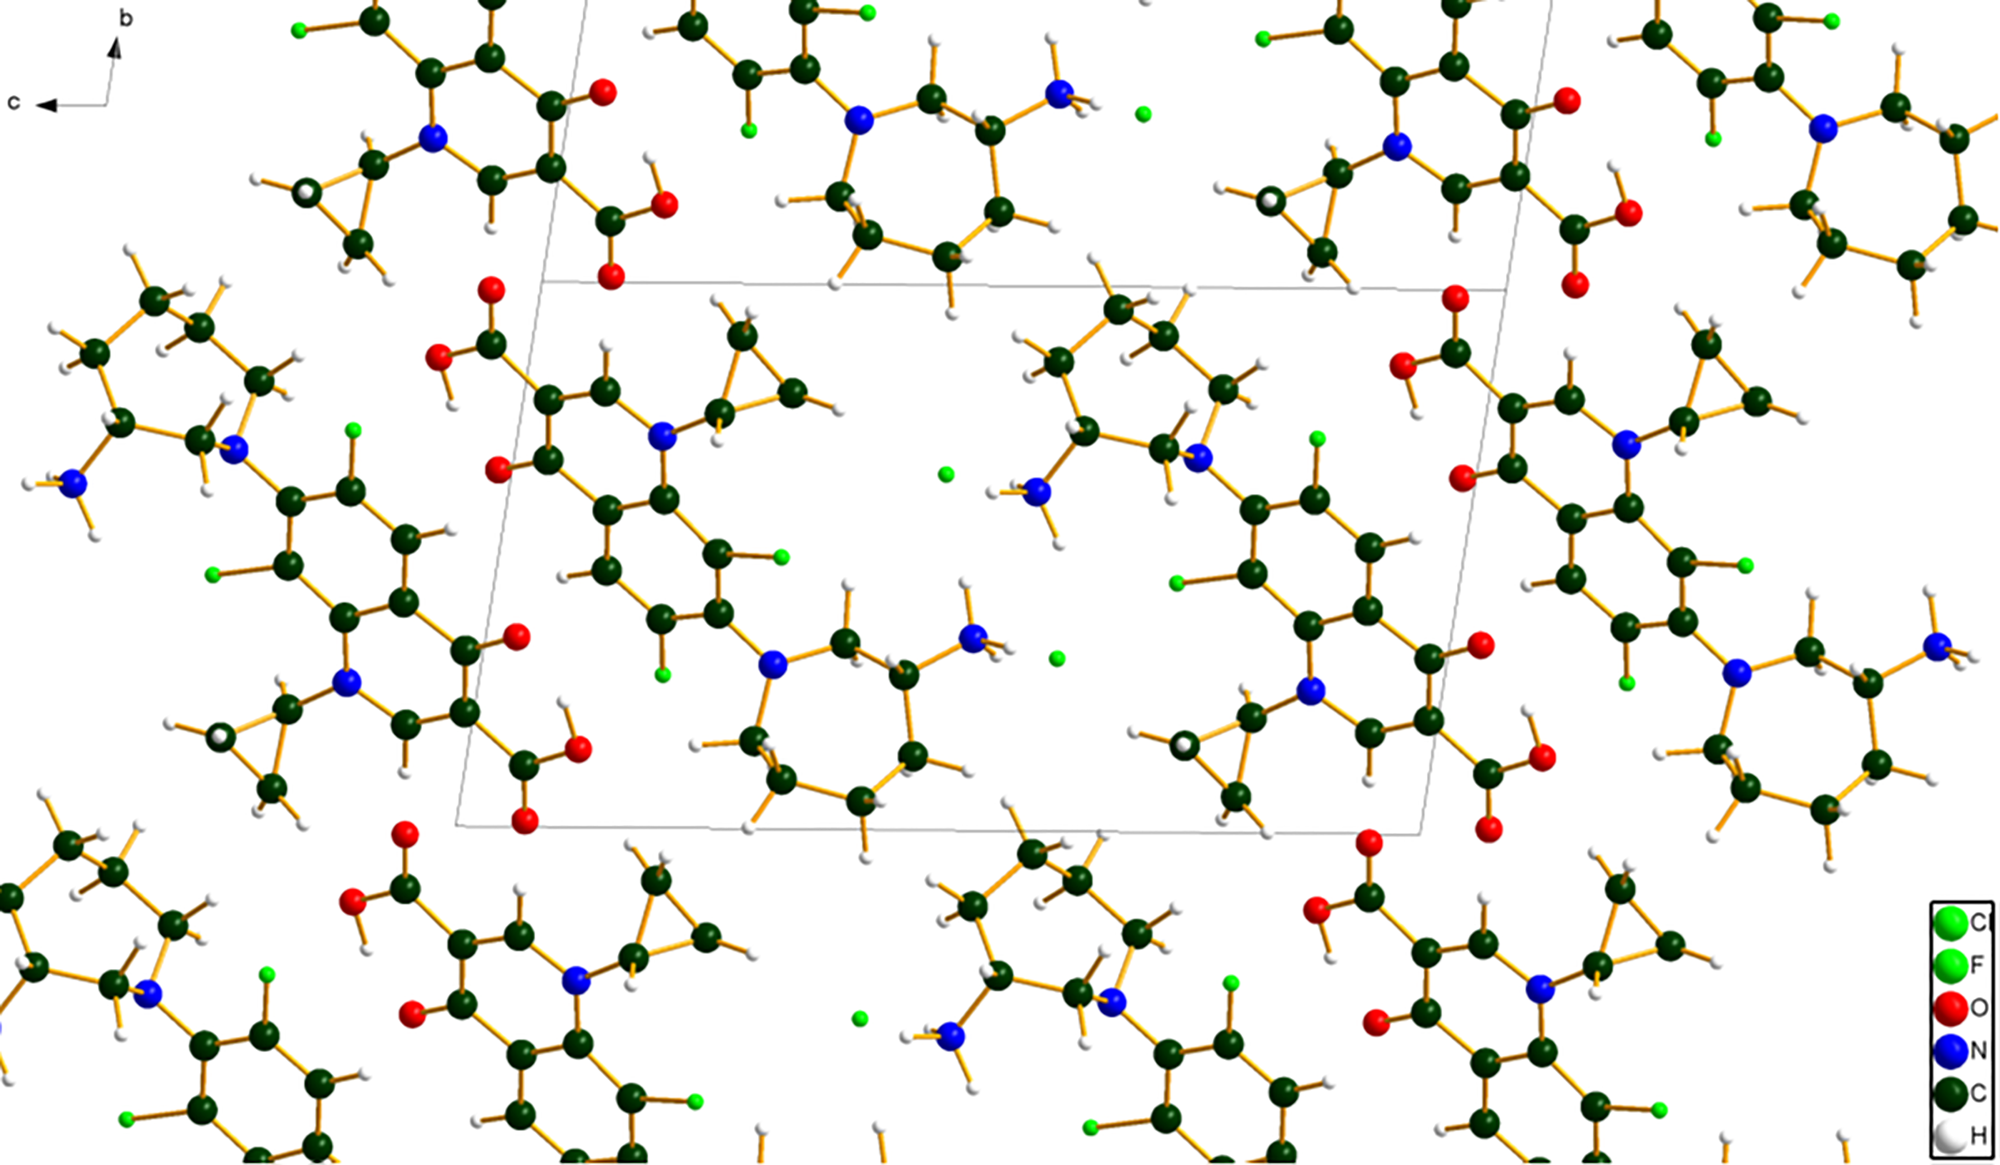
The best view of the crystal structure is down the short a-axis (Figure 9). The crystal structure consists of stacks of cations and anions along the a-axis, with chains of N–H⋯Cl hydrogen bonds (discussed below) along this axis.
The crystal structure of besifloxacin hydrochloride, viewed down the a-axis. Image generated using Diamond (Crystal Impact, 2022).
All of the bond distances and bond angles fall within the normal ranges indicated by a Mercury/Mogul Geometry check (Macrae et al., Reference Macrae, Sovago, Cottrell, Galek, McCabe, Pidcock, Platings, Shields, Stevens, Towler and Wood2020). The torsion angles C22–C18–N7–C16 (132.6°) and C25–C18–N7–C16 (−46.4°) are flagged as unusual. These are well outside the normal range for such torsion angles; the distribution peaks at 90°. These angles represent the orientation of the oxoquinoline and azepane rings in cation 1, and indicate that the molecular conformation is unusual.
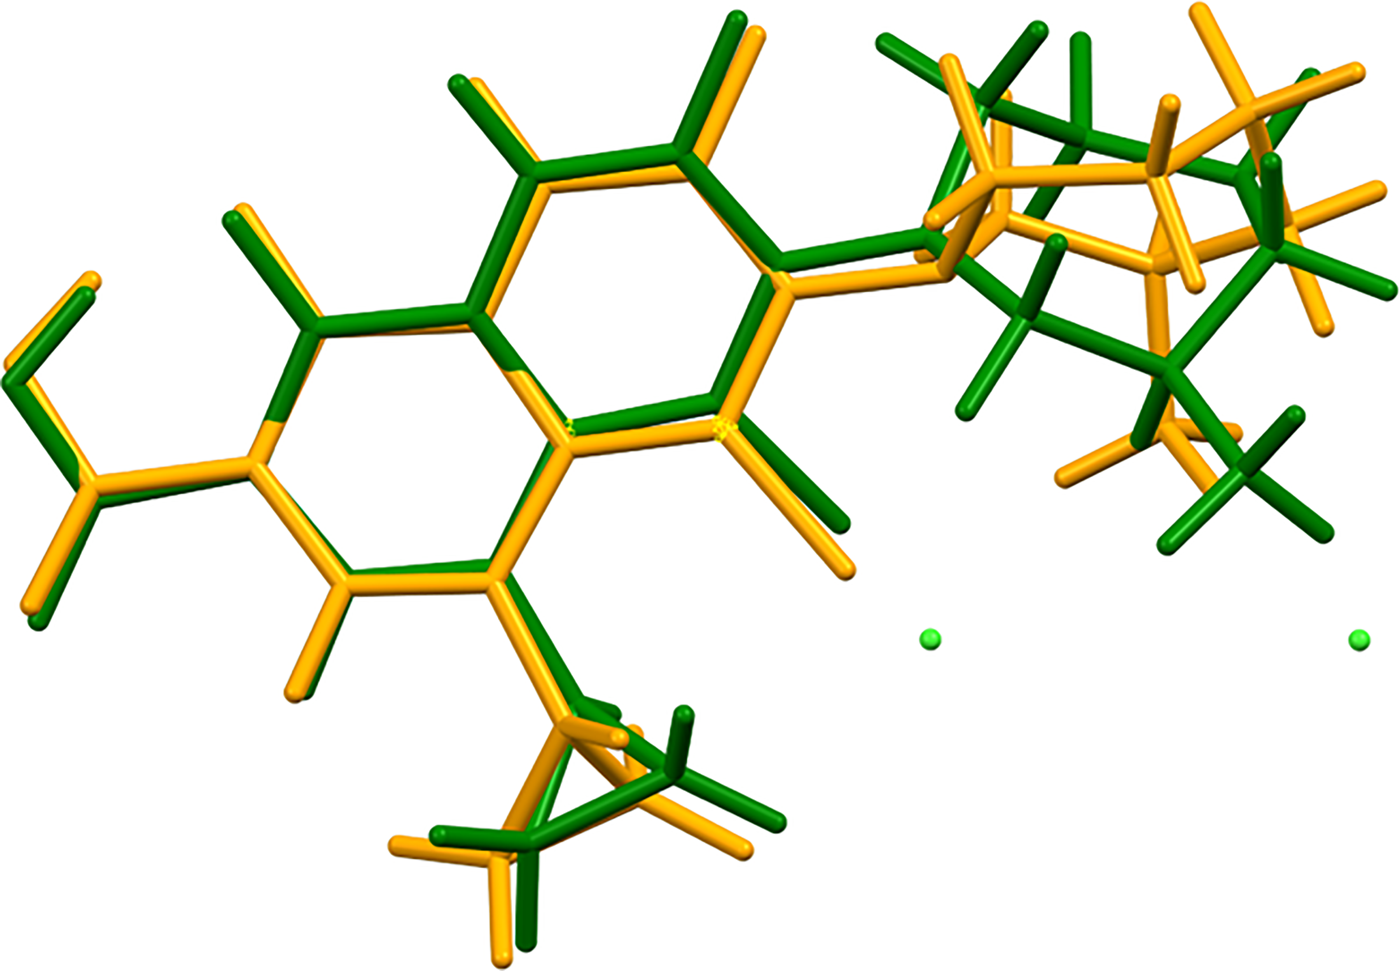
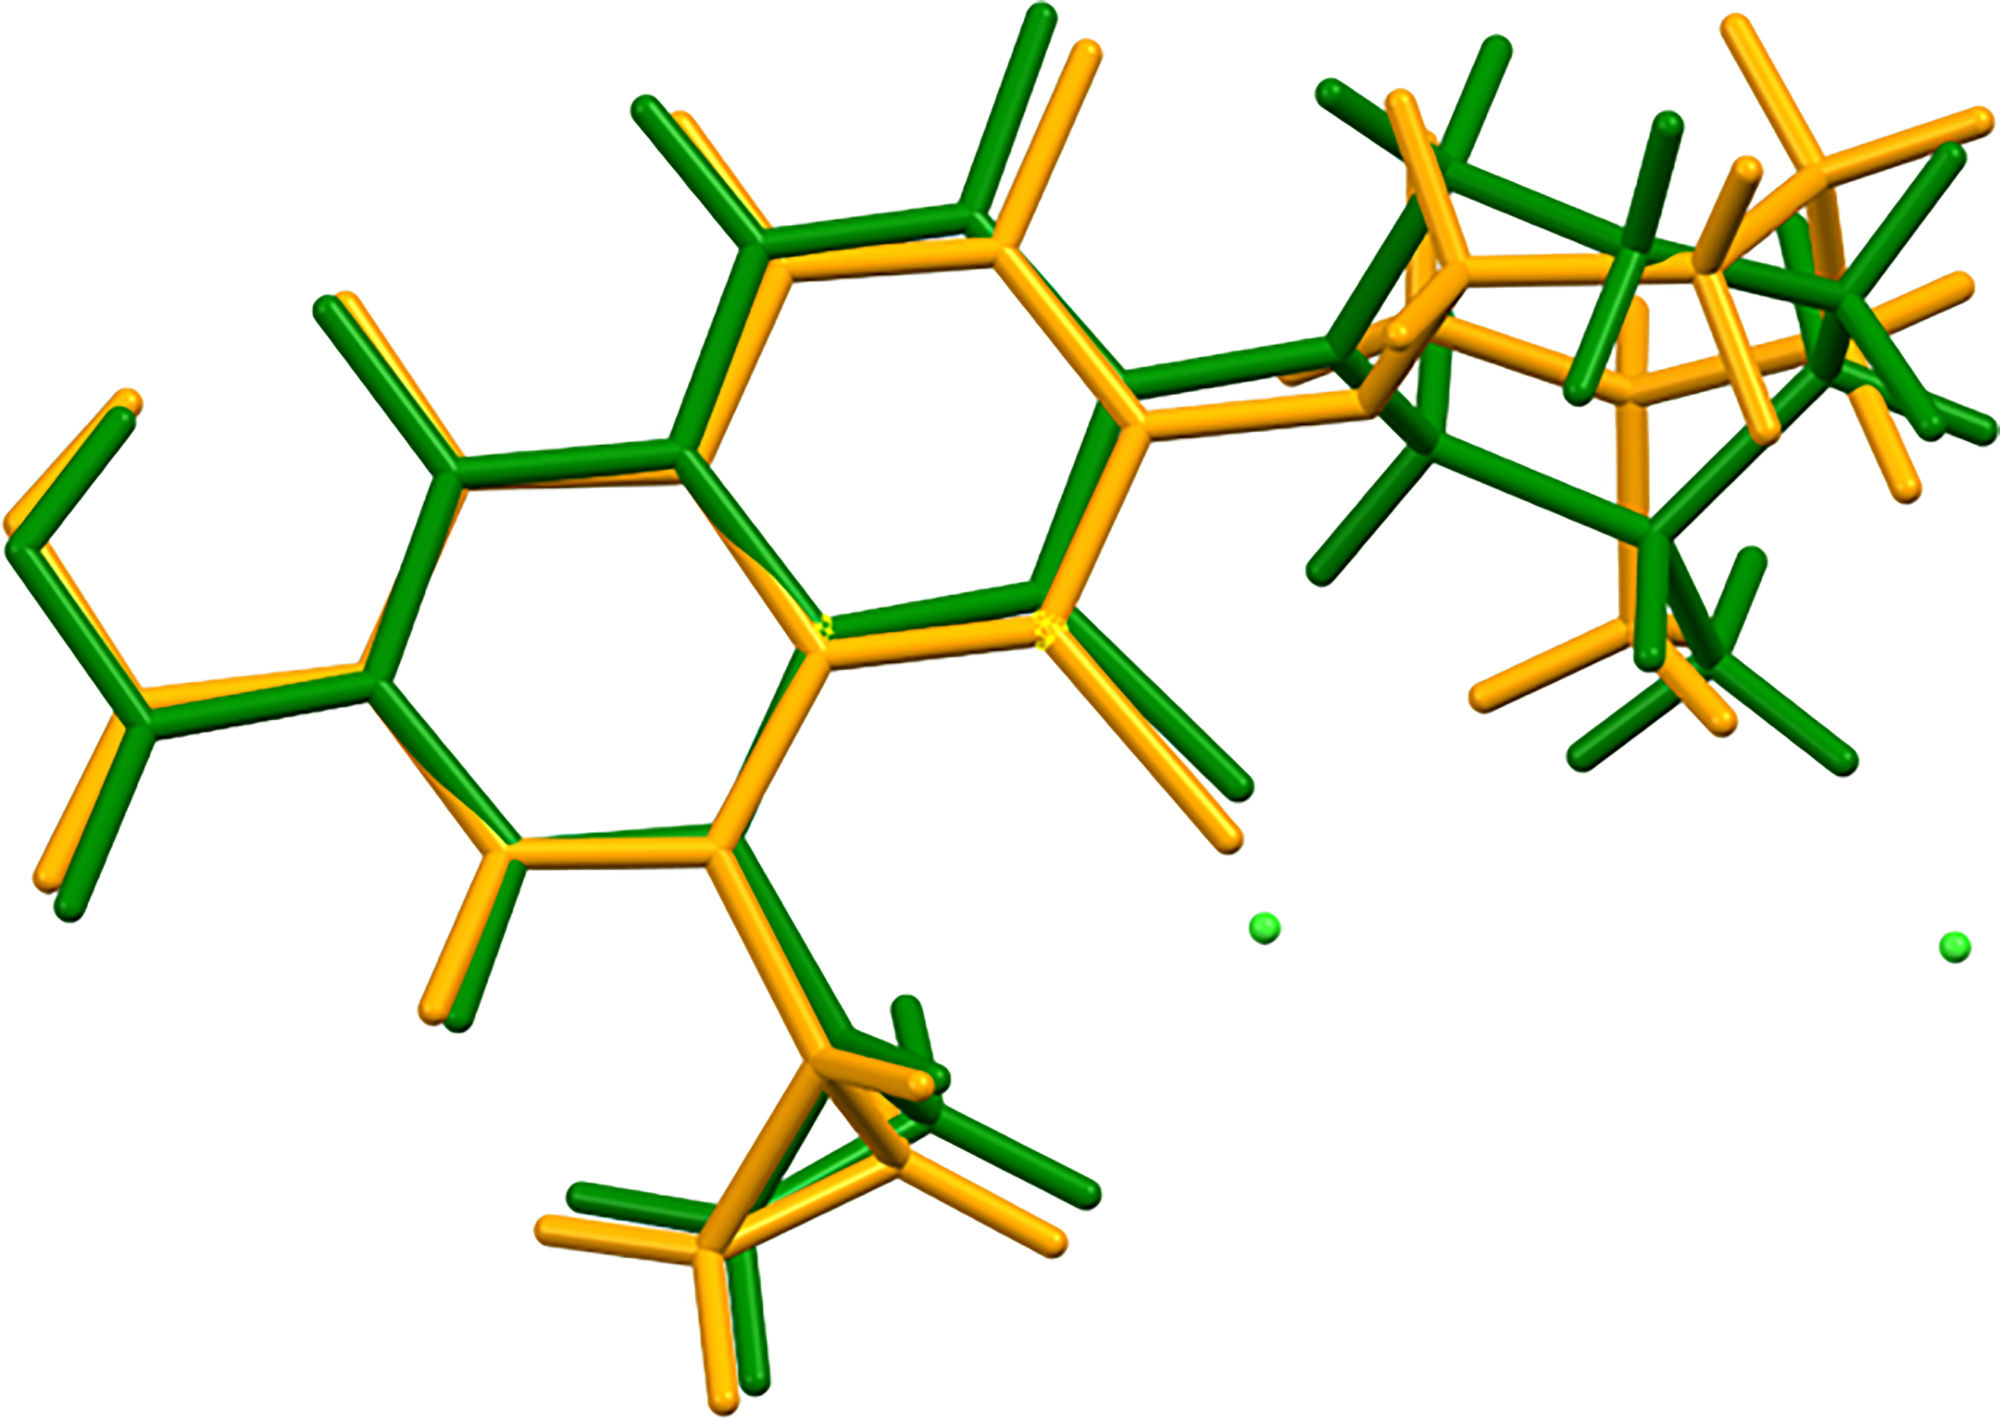
The rms Cartesian displacement between cations 1 and 2 is 1.395 Å (Figure 10; green/orange). The difference decreases to 0.478 Å when the Inversion option is used in Mercury/Molecule overlap (Figure 11). The major differences are in the conformations of the azepane rings, and the cations are approximately related by a center of symmetry. Quantum chemical geometry optimization of the two independent besifloxacin cations (DFT/B3LYP/6-31G*/water) using Spartan ‘18 (Wavefunction, 2020) indicated that the two cations are within 2 kcal/mol of each other in energy. A conformational analysis (MMFF force field) indicates that cation 1 has a different orientation of the ammonium group than the global minimum-energy conformation, and that cation 2 has a different orientation of the cyclopropyl group. Intermolecular interactions seem to be important in determining the solid-state conformation.
Comparison of cation 1 (green) and cation 2 (orange) in besifloxacin hydrochloride. The rms Cartesian displacement is 1.395 Å. Image generated using Mercury (Macrae et al., Reference Macrae, Sovago, Cottrell, Galek, McCabe, Pidcock, Platings, Shields, Stevens, Towler and Wood2020).
Comparison of cation 1 (green) and cation 2 (orange) in besifloxacin hydrochloride, after the Inversion option is used in Mercury/Molecule overlap. The rms Cartesian displacement is 0.478 Å. Image generated using Mercury (Macrae et al., Reference Macrae, Sovago, Cottrell, Galek, McCabe, Pidcock, Platings, Shields, Stevens, Towler and Wood2020).
Analysis of the contributions to the total crystal energy of the structure using the Forcite module of Materials Studio (Dassault, 2021) suggests that the intramolecular deformation energy is dominated by angle distortion terms. The intermolecular energy is dominated by electrostatic attractions, which in this force field analysis include hydrogen bonds. The hydrogen bonds are better analyzed using the results of the DFT calculation.
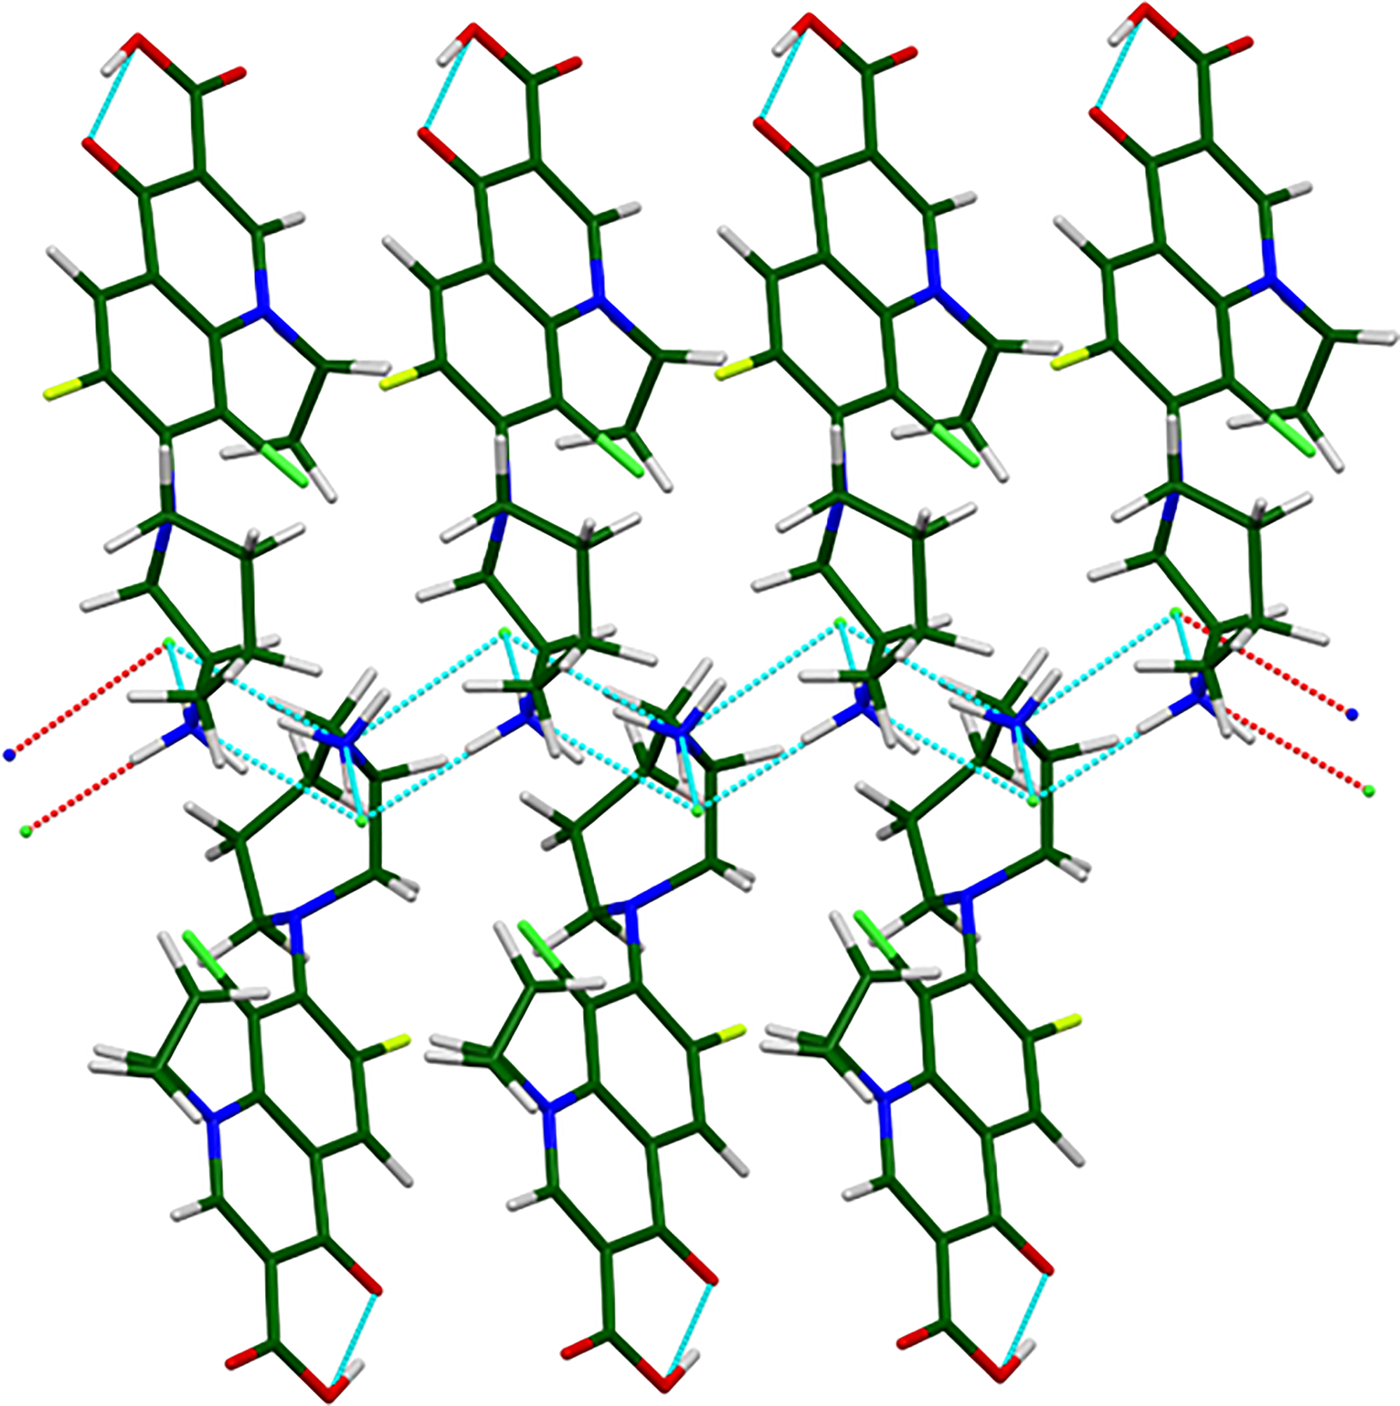
As expected, each hydrogen atom of the ammonium groups acts as a donor in a strong N–H⋯Cl hydrogen bond to a chloride anion, and each chloride anion acts as an acceptor in three of these hydrogen bonds (Table I). The result of these N–H⋯Cl hydrogen bonds is a corrugated ladder-like chain along the a-axis (Figure 12). The carboxylic acid group in each cation acts as the donor in a strong intramolecular O–H⋯O hydrogen bond to an adjacent carbonyl group. The energies of these O–H⋯O bonds are 16.8 and 16.5 kcal/mol, respectively, calculated using the correlation of Rammohan and Kaduk (Reference Rammohan and Kaduk2018). Both hydrogen atoms of the oxoquinoline ring in each cation act as donors in intra- and intermolecular C–H⋯O hydrogen bonds to carbonyl groups. Both cyclopropyl groups also participate in C–H⋯O hydrogen bonds, and a methylene group in the azepane ring of cation 1 also forms a C–H⋯O hydrogen bond. Six C–H⋯Cl hydrogen bonds (two from cation 1 and four from cation 2) to chloride anions and one C–H⋯Cl bond to a coordinated Cl atom also contribute to the lattice energy.
The corrugated double ladder chains of N–H⋯Cl hydrogen bonds along the a-axis in besifloxacin hydrochloride. Image generated using Mercury (Macrae et al., Reference Macrae, Sovago, Cottrell, Galek, McCabe, Pidcock, Platings, Shields, Stevens, Towler and Wood2020).
Hydrogen bonds (CRYSTAL17) in besifloxacin hydrochloride.
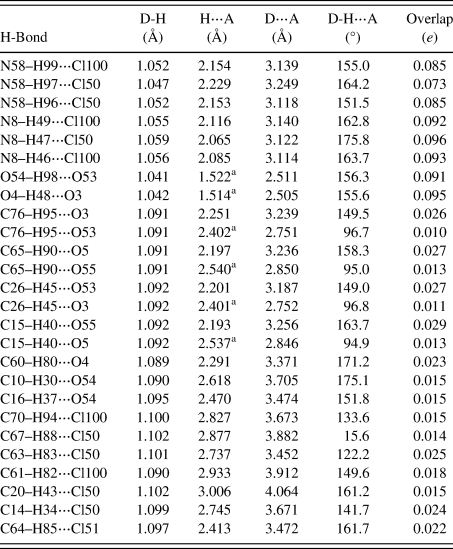
a Intramolecular.
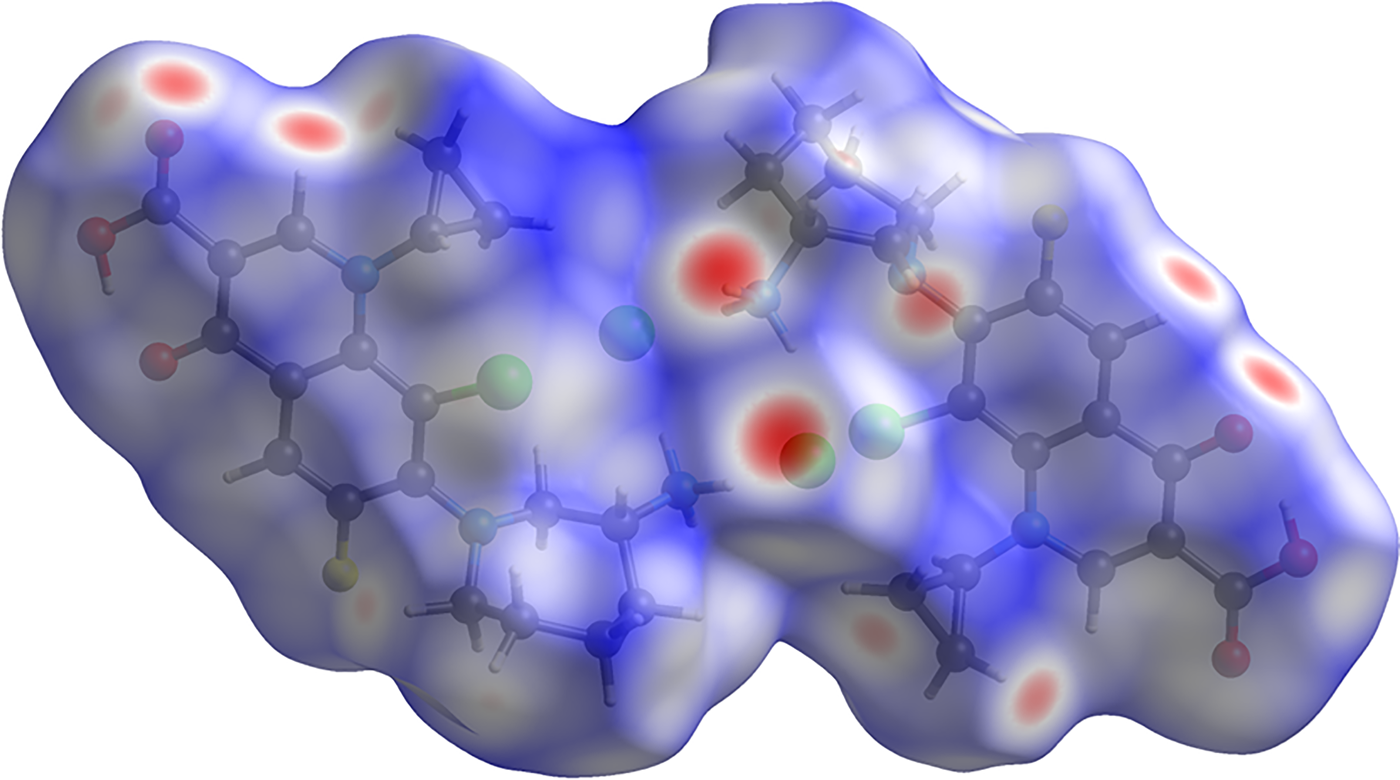
The volume enclosed by the Hirshfeld surface of besifloxacin hydrochloride (Figure 13, Hirshfeld, Reference Hirshfeld1977; Turner et al., Reference Turner, McKinnon, Wolff, Grimwood, Spackman, Jayatilaka and Spackman2017) is 967.20 Å3, 98.95% of the unit cell volume. The packing density is thus fairly typical. The only significant close contacts (red in Figure 13) involve the hydrogen bonds. The volume/non-hydrogen atom is larger than normal at 18.4 Å3, reflecting the presence of the two Cl atoms.
The Hirshfeld surface of besifloxacin hydrochloride. Intermolecular contacts longer than the sums of the van der Waals radii are colored blue, and contacts shorter than the sums of the radii are colored red. Contacts equal to the sums of radii are white. Image generated using CrystalExplorer (Turner et al., Reference Turner, McKinnon, Wolff, Grimwood, Spackman, Jayatilaka and Spackman2017).
The Bravais–Friedel–Donnay–Harker (Bravais, Reference Bravais1866; Friedel, Reference Friedel1907; Donnay and Harker, Reference Donnay and Harker1937) morphology suggests that we might expect platy morphology for besifloxacin hydrochloride, with {001} as principal faces. A second-order spherical harmonic preferred orientation model was included in the refinement. The texture index was 1.008(0), indicating that preferred orientation was not significant for this rotated capillary specimen. The powder pattern of besifloxacin hydrochloride from this synchrotron data set has been submitted to ICDD for inclusion in the Powder Diffraction File.
IV. DEPOSITED DATA
The Crystallographic Information Framework (CIF) files containing the results of the Rietveld refinement (including the raw data) and the DFT geometry optimization were deposited with the ICDD. The data can be requested at info@icdd.com.
ACKNOWLEDGMENTS
The use of the Advanced Photon Source at Argonne National Laboratory was supported by the U.S. Department of Energy, Office of Science, Office of Basic Energy Sciences, under Contract No. DE-AC02-06CH11357. This work was partially supported by the International Centre for Diffraction Data. We thank Lynn Ribaud and Saul Lapidus for their assistance in the data collection.
CONFLICTS OF INTEREST
The authors have no conflicts of interest to declare.


 Open access