

1. Introduction
As countries around the world aspire to conclude bilateral trade deals and renegotiate their existing relationships, it is often overlooked that these new arrangements can sometimes impact on countries that are not a direct party to the agreement. One such example is the exit of the United Kingdom from the EU's customs union and the subsequent negotiations of another trade deal with the EU-27 member countries. The announcement of the Brexit referendum outcome on 23 June 2016 caused a wave of uncertainty in many third country exporters that used to send a substantial fraction of their exports to these markets (OACPS, 2016). Among others, such concerns included potential disruptions of triangular supply chains (EPA Monitoring, 2021a), divergence of sanitary and phytosanitary standards between the EU and the UK, a separate set of border-related paperwork for these markets, and logistic challenges (Goodison, Reference Goodison2022). In addition, there were discussions about the fate of African goods, which were exported to the UK through European ports, as these exports were likely to face more tariffs than goods manufactured in the EU (Gopalakrishnan et al., Reference Gopalakrishnan, Bharathi and Chakravarthy2021). This paper examines how African countries' UK-bound exports have been affected since the Brexit announcement.
The existing literature on this topic mostly provides information regarding Brexit effects on the UK and the EU27 countries (Clegg, Reference Clegg2016; Dhingra et al., Reference Dhingra, Ottaviano, Sampson and Reenen2016; Bisciari, Reference Bisciari2019), and the direct and indirect impacts on third parties, such as the UK's African trade partners, have not received much attention. While this decoupling of an established customs union between the UK and the EU clearly affected both these economies, the associated literature on this topic has shown that other trading partners, especially those located in Africa, have not been immune to Brexit related changes in the UK's trade policy. A few studies provide qualitative evidence on the impacts on Africa (Murray-Evans, Reference Murray-Evans2016; Mold, Reference Mold2018; Kohnert, Reference Kohnert2019; Ansorg and Haastrup Reference Ansorg and Haastrup2016), but none of them quantify the magnitude of the actual impacts on these countries' trade flows following the announcement of Brexit referendum results in 2016. This paper bridges this important gap in the literature using available trade flow data and employing regression techniques to estimate the actual impacts on African exports.
The main purpose of this paper is to investigate the trade effects of the Brexit referendum on the African economies UK-bound exports relative to the EU. While the challenges caused by Brexit and the post-Brexit trade deal is evolving over time, the quantification of the effects on the African region's exports since the announcement of the referendum results is the focus of this study. This paper assembles a large panel dataset for African exports to the UK and the EU for the period 2002–2021 and uses a difference-in-difference estimation technique. Following the initial regressions and the robustness checks, it also examines the heterogeneity of the effect of Brexit across products as well as around export origins and destination markets.
The study finds strong evidence on the deterioration in African exports to the UK since 2016. The descriptive evaluation shows that the UK's share of African exports dropped from 4.15% to 3.14% between 2016 and 2020, and this share has been potentially reallocated to other regions (see Section 3.2 for details). The empirical estimations suggest that the magnitude of this reduction is quite large, ranging from somewhere between 20% and 30%, depending upon the estimation approach, the nature of control variables, and the choice of counterfactuals (EU, US, or rest of the world). The analysis further shows that Africa's UK-bound exports also declined relative to those of the US as well as to those of the rest of world (excluding the EU). The drop started immediately after the announcement of the referendum decision in 2015 but the main effect was triggered following the referendum outcome in 2016. The COVID-19 pandemic three years later further compounded this drop in exports by increasing supply chain related disruptions.
Ever since the UK voted to leave the EU, economists and trade policy analysts have been trying to examine the immediate and long-term impacts this decoupling of markets would have on these and other markets. The consequences of Brexit for third country exporters have largely remained under-researched. This paper adds to this stream of literature by empirically investigating the implications of Brexit for African countries' exports. These findings extend the works of Douch and Edwards (Reference Douch and Edwards2022), which looks at shocks ‘associated with the 2016 Brexit vote’ between the UK and its 14 EU and 14 non-EU trading partners. While Douch and Edwards (Reference Douch and Edwards2022) looks specifically at UK's exports, we focus on UK's imports from Africa. Douch and Edwards briefly examine the imports side also, stating that there were ‘even larger shocks’ compared with exports in the UK and that ‘Imports from the EU and non-EU countries also declined a little’ (Douch and Edwards, Reference Douch and Edwards2021, 2022). In another vein of the literature, Douch and Edwards (Reference Douch and Edwards2021) looks at the effect of the Brexit shock on UK services exports, whereas this paper is specifically focused on goods trade and not services. In terms of methodology, Douch and Edwards (Reference Douch and Edwards2022) construct a control group, ‘synthetic Britain’, whereas we also use the exports of the same set of African countries as a comparator group. Similarly, Graziano et al. (Reference Graziano, Handley and Limão2021), estimate the effect of this shock on trade flows between the UK and the EU, whereas we focus mainly on the third countries (African region).
These findings imply the need for policy intervention to arrest this decline in exports for this highly vulnerable and relatively poor region. Due to geographical proximity, historical linkages as well as a set of trade preferences in the shape of Economic Partnership Agreements (EPAs), a large fraction of African exports are absorbed into the EU and UK markets. Nineteen of the 55 countries in the African continent were part of the former British Empire, with strong historical and cultural connections. Similarly, the EU has always been a development friendly regime for African countries in the shape of EPAs and Duty-Free Quota Scheme (DFQF) access to the least developed countries. As both the EU and the UK have long-standing commitments to help reduce poverty, create better jobs, and promote sustainable development in this region through trade, providing trade policy support to these countries can help check the drop in exports and achieve the salutary objectives.
The structure of the paper is as follows. Section 2 reviews the existing literature in this area. Section 3 discusses the data and presents preliminary analysis. Section 4 illustrates estimation methodology. Section 5 presents the estimation results and Section 6 contains robustness checks and performs heterogeneity analysis, and the final section sets out the conclusions and policy implications of the study.
2. Literature Review
The existing literature on the implications of Brexit for African countries exports has developed along two main streams. Some studies argue for the potential drop in African countries exports due to uncertainty caused by the referendum outcome, deterioration of confidence, and potential slowdown in UK's productivity and economic growth, while others consider it as an opportunity for many African exporters with diversified production structure and strong trade linkages with the UK. There is extensive literature on third country effects of trade agreements, which is also quite relevant in this case.
2.1 Adverse Effects through Policy Uncertainty and Deterioration of Confidence
This stream of the literature highlights how the UK is no longer involved in EU trade agreements, which creates significant issues for third countries who could lose any preferential access to the UK market that those agreements currently allow. Douch and Edwards (Reference Douch and Edwards2022) analyse the effects of uncertainty and anticipation shocks associated with the 2016 Brexit vote between the UK and its 14 EU and 14 non-EU trading partners. The study finds that UK's exports to both groups of countries fell below those of the ‘synthetic Britain’, with much of the shortfall developing over the year prior to the referendum, following the 2015 Conservative general election win. This paper confirms that policy uncertainty has a major effect upon trade and that uncertainty about supply chain costs is a potential explanation for at least some of the shortfall. Even before actual policy changes have been finalized, uncertainty and anticipation have sizeable and measurable effects upon trade.
In the same vein as the literature, Graziano et al. (Reference Graziano, Handley and Limão2021) estimate the probable affect on bilateral export investments and trade flows between the UK and the EU. Their estimates are based on the monthly variation in exports as the political process unfolded prior to the June 2016 referendum. The study finds that shocks, as a result of the probability of Brexit, reduced trade flows and trade participation. The effects were largest in products where the reversion to MFN tariffs under the WTO was the highest. Brexit uncertainty did induce a net exit of traded products and a reduction in UK–EU bilateral trade flows. These effects varied by country, industry characteristics, and trade margins as predicted: larger in industries with high sunk costs at the entry margin and for exporters potentially facing higher risk.
Douch and Edwards (Reference Douch and Edwards2021) analyse the impact of the Brexit announcement shock on UK exports of commercial services using a synthetic control method (SCM) and show that the policy uncertainty following the Brexit referendum significantly dented British commercial services exports. They find significant evidence of a treatment shock based upon the referendum date of 23 June 2016. Exports after this date were approximately 7% below the synthetic counterfactual. The underperformance began before the referendum, specifically; services export series suggest an effect from the beginning of 2015. This is potentially worrying given that performance in goods exports (Douch and Edward, Reference Douch and Edwards2021) was even worse.
Douch et al. (Reference Douch, Du and Vanino2022) explore the heterogeneous effect of uncertainty on firms' behaviours. They compare UK trade flows to the EU and non-EU countries, and the variations in product-specific tariff threats using firm size. This study finds strong and robust evidence of the significant impact on UK firms' exports of trade policy uncertainty induced by Brexit. It shows an overall reduction in UK–EU trade flows with respect with non-EU markets, as uncertainty regarding future trade policies increased during post-Brexit referendum negotiations. In particular, using a natural experiment, this paper provides new insights into the type of firms that are more exposed to these uncertainties.
Douch (Reference Douch2020) investigates the effect of the Brexit referendum results on South African exporters and importers' participation in the global market. He provides evidence of how the potential increase in trade barriers – through an increase in tariffs – has had a negative impact on the trade activity from uncertain markets. This paper highlights that these effects, however, are not homogeneous across businesses, but rather that small firms are more exposed to macroeconomic shocks in the case of a developing economy. In other words, small firms are most affected by increasing uncertainties, and this has led to a decline in the growth of their trade margins, leading to a fall in international penetration.
Clegg (Reference Clegg2016) argues that even though trade with the UK accounts for a smaller share of Africa's exports, any decrease in the preferential market access would result in a substantial impact on certain countries and industries. The UK could be looking to pursue existing EU trade agreements with African countries to preserve the existing state of affairs (Murray-Evans, Reference Murray-Evans2016). Dhingra et al. (Reference Dhingra, Ottaviano, Sampson and Reenen2016) demonstrate that those African countries may not be eager to sign new deals with the UK on the same terms as previously, since the UK has now a much smaller market compared with that of the remaining EU-27 and still has a lot of uncertainty around its post-Brexit relationship with the EU. Moreover, establishing a new trade connection with countries in Africa will not be as straightforward as suggested by leave campaigners (Murray-Evans, Reference Murray-Evans2016).
Mold (Reference Mold2018) also highlights that possible Brexit consequences may include the deterioration of confidence in African regional integration because of the decision made by the UK. Similar to Dhingra et al. (Reference Dhingra, Ottaviano, Sampson and Reenen2016), Mold (Reference Mold2018) asserts that the overall effect of Brexit would still be negative regardless of any possible positives, hence reinforcing that the correct response at such a time is not to waver but to intensify efforts towards regional integration.
Another strand of this literature highlights that the departure of the UK from the decision-making process in the European committee can have a significant impact on trade policy direction of the EU as a whole (Langan, Reference Langan2016). Ansorg and Hasstrup (Reference Ansorg and Haastrup2016) also argue that those African states will lose a crucial advocate within the EU, resulting in a sense of uncertainty about economic relations. In the same frame of mind, Gopalakrishnan et al. (Reference Gopalakrishnan, Bharathi and Chakravarthy2021) discuss challenges in the transshipments of African exports to the UK through EU ports.
2.2 Adverse Impact through Slow Growth and Recession Post Brexit
Dhingra et al. (Reference Dhingra, Ottaviano, Rappoport, Sampson and Thomas2017) contend that while leaving the EU may allow the UK to reclaim some autonomy in terms of their policy design, it will come at significant economic cost (Bisciari, Reference Bisciari2019). Dhingra et al. (Reference Dhingra, Ottaviano, Sampson and Reenen2016) provide in-depth analysis into just how significant these consequences are. It analyses the ‘static’ effects of Brexit on trade in either an ‘optimistic’ or a ‘pessimistic’ scenario and provides an estimated range of how bad things may possibly get. Broadbent et al. (Reference Broadbent, Di Pace, Drechsel, Harrison and Tenreyro2019) look at macroeconomic data following the 2016 referendum and review how the news shock of an upcoming decline in growth could impact the trade and productivity in the UK.
Dhingra and Sampson (Reference Dhingra and Sampson2022) examine the economic impacts of uncertainty shocks and the Brexit vote. They explore the change in expectations after the referendum and the negative effects on the UK economy post 2016. Freeman et al. (Reference Freeman, Manova, Prayer and Sampson2022) study the uncertainty and anticipation effects and state that there is no evidence indicating a decline in UK trade with the EU due to those effects. However, they also state that the UK's trade relationship with the EU could deteriorate. The increasing number of issues with the EU may cause British firms to look towards markets situated outside the EU (Stevens, Reference Stevens2021). This research suggests that aggregate growth would decline in the short term, while UK interest rates fell, and investment growth lost pace. However, if the UK remains in a single market or a customs union, the GDP and welfare losses induced by Brexit could be mitigated to some extent (Bisciari, Reference Bisciari2019).
2. Brexit as an Opportunity for Strengthening Trade Relations
In this vein of the literature, Kohnert (Reference Kohnert2019) considers Brexit as an opportunity for a possible stimulus to Africa's economic growth. Other than some negative effects on ‘West African cocoa farmers, Brexit could offer new and innovative openings in the long run for African countries, such as Ivory Coast. This would be possible through restructuring and improving trade agreements, resulting in better trading relationships with the UK (Kohnert, Reference Kohnert2019). Kohnert's paper also shows that several African countries, which already have trade deals with the UK and an have diversified production structure, are likely to be better off in terms of their exports to the UK: for instance, South Africa could expect an increase of 39% in their exports to the UK, while Ghana could experience a loss of 39%, which amounts to $91 million of exports in value terms. Kohnert (Reference Kohnert2019) concludes that there will be opportunities for new trade deals, but more likely in the medium to long term since negotiations are likely to linger on for some time.
In contrast to the above, Ansorg (2021) questions the above findings and asserts that the African countries that rely most on trade with the UK are really the ones most likely to feel the adverse effects in the event of a UK recession post Brexit. This consists of countries such as South Africa, Nigeria, and Kenya who are the UK's most essential trading partners in the African region, with imports from these countries accumulating to a total of £7.4 billion in just 2014. These countries will also face the uncertainty that comes with renegotiating trade deals, which can take years.
Brexit, however, will not affect all African countries in the same manner (Ansorg, 2021). Mold (Reference Mold2018) states that while immediate impacts through ‘investment, trade and remittances are likely to be relatively negative’, African countries may in fact benefit from the creation of these new export openings. The ‘trade diversion’ that comes with the reimposition of trade tariffs between the UK and the EU could unexpectedly benefit some African countries.
2.4 Literature on Third Country Effects of Trade Agreements
Apart from the impacts of Brexit, there is also substantial literature on the effect of FTAs on trade in third countries, in a more general manner. Freund (Reference Freund2010) looks at regional trade agreements within other European countries and Latin America, and finds through looking at preference margins and most-favored nation (MFN) tariffs that the margins do not reduce imports from third countries. This paper overall suggests that that regionalism does not substantially harm non-member countries. Estevadeordal et al. (Reference Estevadeordal, Freund and Ornelas2008) further support that fears about a harmful effect of favored liberalization on third countries are groundless.
In contrast to the above, Bagwell and Staiger (Reference Bagwell and Staiger2004) suggest that free trade agreements between two partner countries can reduce the value of concessions to a third country due to changes in the third party's terms of trade. Bandele and Banga (Reference Bandele and Banga2017) examine diversion of Jamaica's trade from the EU, by looking at the impacts and challenges. They reinforce the possibility of trade diverting away for third parties and suggest the need to attempt to actively negotiate trade deals directly with the UK or even look towards regional integration as a source of long-term development (Gopalakrishnan et al., Reference Gopalakrishnan, Bharathi and Chakravarthy2021). Some of these effects could apply to Brexit also.
2.5 Contribution of this paper
In brief, the message from the above literature is quite mixed: some studies argue it as an opportunity for African countries while others highlight the associated challenges. The above literature mostly provides possibilities and suggestions for African countries’ post-Brexit trade situation. A few studies analyse the direct effects of Brexit (because of changes in the UK's trade policy) and indirect effects (due to the weakening of their voice in the EU after the departure of the UK from the club). However, none of them assess the actual impacts on African countries’ trade flows in detail. To add to these several streams of literature, this paper estimates the actual impacts through DID regression techniques and bridges this important gap in the current literature.
3. Data Description and Preliminary Analysis
This section describes the data used in analysis and presents the descriptive statistics. This paper consists of data from World Integrated Trade Solution (WITS), World Bank National Accounts Data, and Financial Times ltd. WITS, including its UNCOMTRADE database, is a suitable source for individual and aggregate export data consisting of both the 53 African, and 27 EU countries.
3.1 Data
The ‘value of exports’ using nominal data (millions of US dollars) is obtained from the UN COMTRADE. Nominal data are appropriate here because the study is focusing on relative trade volumes between the UK and the EU rather than the amount of trade. All of the export data are in terms of ‘total trade of all goods’ with the reporting country being African/EU-27 members and the partner country being the United Kingdom.
The data on control variables are extracted from multiple sources. The first control variable is Gross Domestic Product (GDP), for both the exporter and the partner countries. The GDPFootnote 1 data (in Billion US dollars) are mostly from the World Development Indicators database at the World Bank National Accounts and OECD data files. The only exception being the year 2021, which is the year the data were obtained from the International Monetary Fund via the 2021 World Economic Outlook database as the World Bank dataset does not contain the information for 2021.
The second control variable is FDI; its data are sourced from the fdi market data set.Footnote 2 These data include information on partner countries FDI (UK and EU 27) in African countries. The statistics for both groups were acquired from the ‘fDi Markets’ of The Financial Times ltd. These data consist of companies from the UK and the EU 27 investing in these African countries between January 2003 and December 2021. I introduce this variable in robustness checks to control for the supply chain linkages of African countries with the EU and UK markets.
Since Africa is a very large continent and there is a lack of data in some areas, we chose to focus on the top 10 countries for both regions. Therefore, the export statistics used for the DID regression were solely focused on data from the UK's top 10 importers from both the EU and Africa. The total country level exports to the UK from each region in 2015 were calculated. The year ‘2015’ was chosen as the estimation sample because it was the last year preceding the announcement of Brexit. Similarly, the study uses export data for the top 10 EU countries. As shown in Table 1, these 10 countries roughly account for more than 80% of exports to the EU market, of which about 90% of exports are to the UK. These countries therefore constitute a good representation of the African region.
Top 10 African Exporters to the UK and EU-27 in 2015 (US$ Billion)
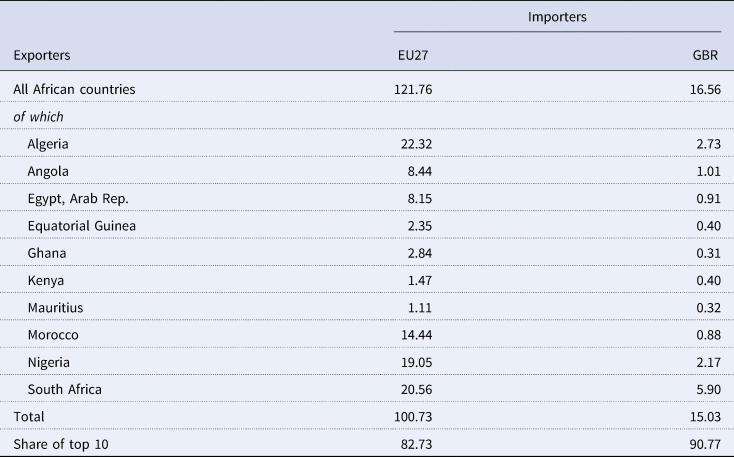
Source: Author's construction using WITS dataset.
Note: These data for the year of 2015 (the last year prior to the announcement of Brexit).
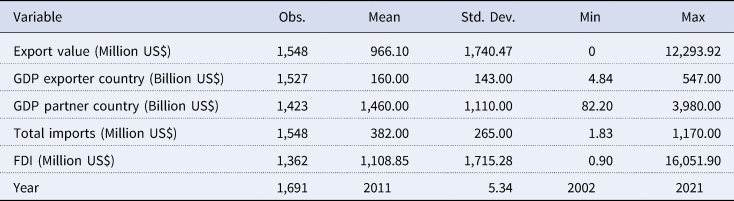
The summary statistics for the final country level data are shown in Table 2, with the research based on information ranging from 2002 to 2021.
Summary statistics
3.2 Descriptive Statistics and Preliminary Evidence
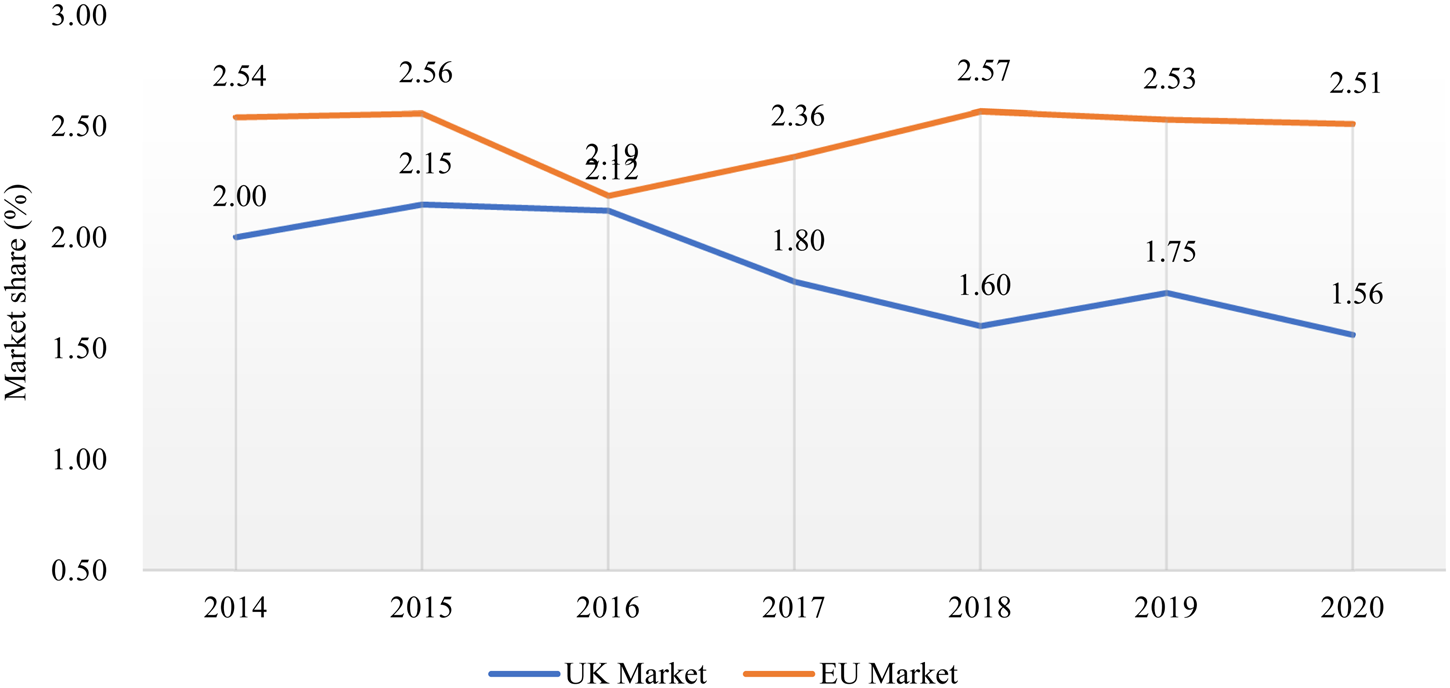
Figure 1 shows the trend of the African region's exports to the UK and EU-27 markets. It shows that African exports to the UK gradually declined from 2016 to 2020, with a large dip in 2018. By contrast, the share of African exports to the EU market remained largely flat, with a rise in 2018 and 2019. In 2020, the share of African exports to the EU is almost the same in 2016 and 2020 whereas it dropped for the UK market from 2% to 1.56% in this period.
African Countries Export Share in the UK and EU-27 Markets (2016–2021)
Source: Author's construction with WITS dataset. Note: Share is computed as a fraction of UK/EU-27's total imports from the world.
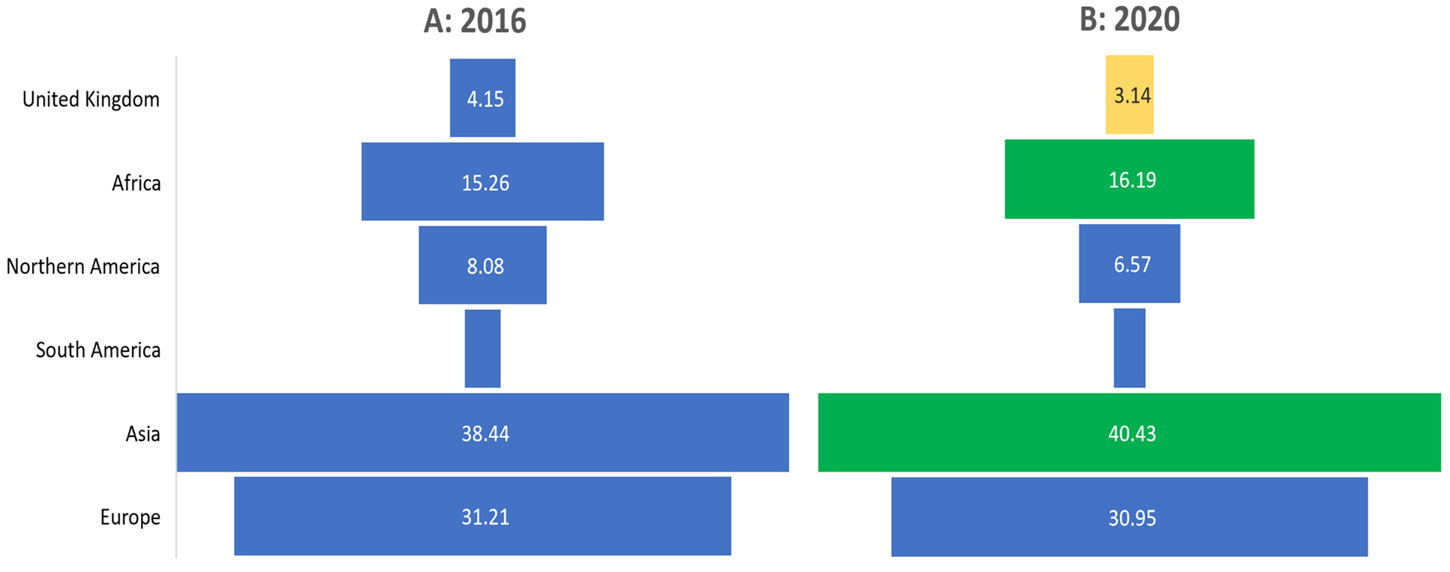
The evidence presented in Figure 2, provides a clear display of how African countries exports varied regionally, both in 2016 and 2020. Looking at the UK's share of African exports in 2016 (the year of the Brexit referendum), it is at 4.15%. Moving on from this, four years post the announcement of Brexit, the UK's share of African exports has dropped by a whole 1%, being 3.14% in 2020. When examining the share of intra-continental exports and the African exports to Asia, it is evident from Figure 2 that both segments have increased. Hence, it is possible that the drop in the share of African countries exports to the UK led to trade diverting to Asian or other African countries.
A Regional Distribution of African countries’ exports in 2016 and 2020
Source: Author's construction with WITS dataset.
3.3 Empirical Set Up
For two reasons, the treatment group used in this study is the ‘African countries exports to the UK’. Firstly, prior to Brexit, the UK was part of the EU's Customs Union, and African exporters were treating it as one single market. While they were previously facing the same set of rules regarding trade documentation, and sanitary and phytosanitary checks, the announcement of Brexit in 2016 created uncertainty for such African exporters as they now might have to face two sets of regulations, one for the EU and another for the UK. The leave vote in 2016 made it more likely that barriers to trade would exist and uncertainty would increase in the near future (Dhingra and Sampson, Reference Dhingra and Sampson2022).
Secondly, many African exports to the UK are shipped through EU ports such as Antwerp and Rotterdam. For instance, cut flowers that are air freighted from East Africa must transit through ports in the Netherlands, where they are auctioned, and then Belgium before they finally arrive in the UK. As the debate around the impact of Brexit evolved, it became evident the African goods that were to be shipped to the UK would have to face two border checks instead of one, first whilst entering the EU and then again on arrival to the UK. These various factors would have cost-raising effects for African exporters that shipped to the UK market. Such costs to third parties are discussed in policy literature, which maintains that many countries such as Kenya and South Africa have a large proportion of their exports arrive in the EU before they are shipped to the UK (EPA Monitoring, 2021b). Approximately 80% of Kenya's exports to the EU were known to be consumed in UK markets and therefore such economies, ones that were extremely reliant on UK markets, were likely to suffer from UK's departure from the European customs union (Gopalakrishnan et al., Reference Gopalakrishnan, Bharathi and Chakravarthy2021).
These apprehensions were later substantiated in the Trade and Cooperation Agreement (TCA) that was signed after Brexit. The TCA allows the goods manufactured in the EU and the UK to be traded tariff and quota free but those from other countries must face MFN tariffs. Moreover, the TCA introduced rules of origin when the UK exited the customs union.
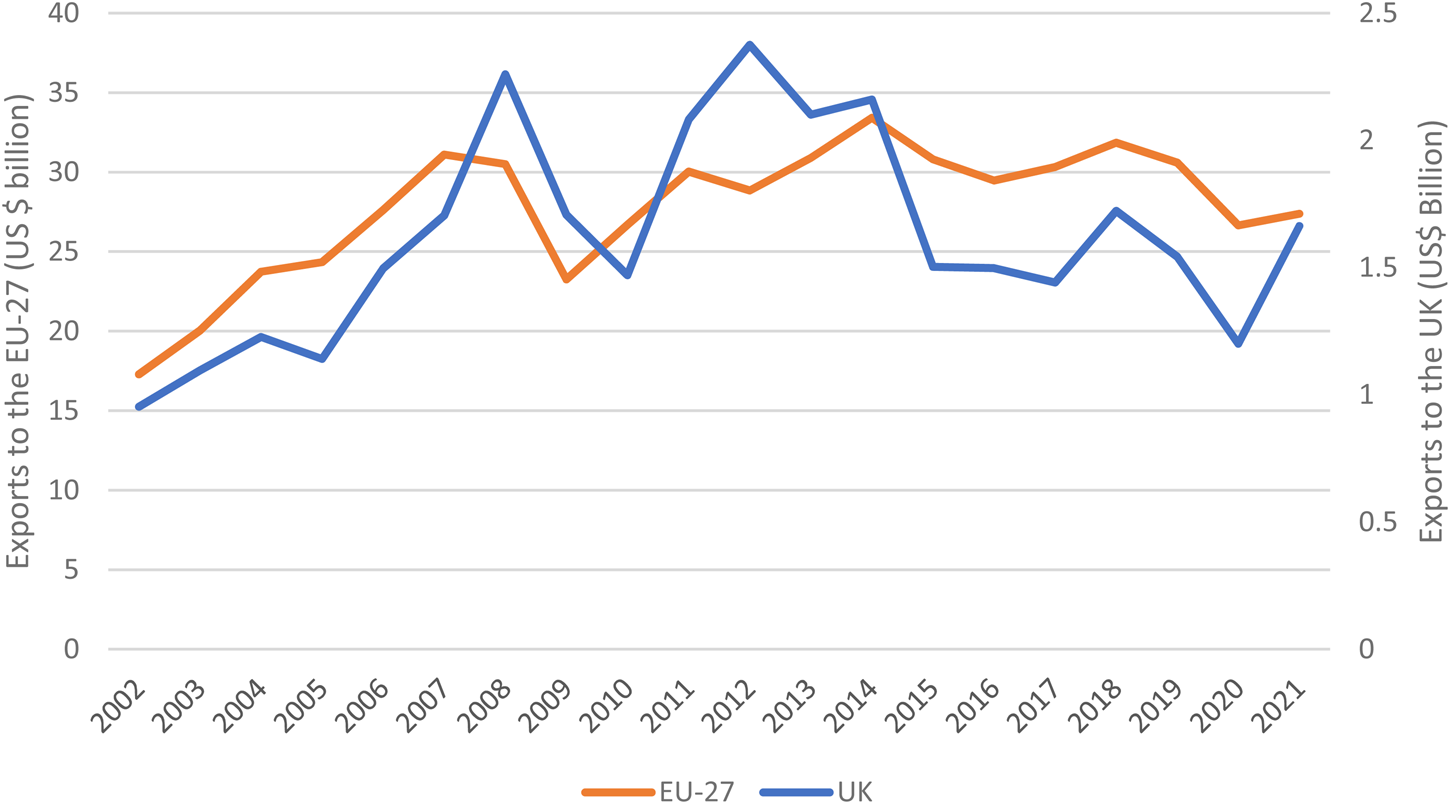
The initial announcement of Brexit meant that there would be a surge of uncertainty within the two main affected economies, UK and the EU-27 member countries, as well as all the third-party countries that are directly and indirectly involved in trade deals with those two economies. This is visible in Figure 3, which displays the export trends for the control (EU-27) and treatment groups (the UK). From 2002 onwards, African exports to both the UK and EU-27 countries seemed to have similar trends prior to the announcement of Brexit in 2016. However, there seems to be a marked change in the post 2016 period. This graphical evidence is consistent with an interpretation of deterioration in African exports to the UK relative to those to the EU due to the Brexit announcement.
Export trends of African Countries to the UK and the EU-27, 2002–2021
Source: Author's construction using WITS dataset.
The structure of Africa's exports to these markets was very similar (Table 3). African exporters shipped all types of goods to the UK and the EU, ranging from food products to finished goods. In 2016, the sectoral share of various product groups was largely similar with the exception of stone and glass, which was slightly higher for the UK. The same pattern holds for 2019, although the value of exports increased in 2019 with a relatively larger increase for the EU than the UK. This similarity in trade structure of merchandise shipped to these markets reflects that EU is a good comparator group for the UK.
Compositions of African countries exports to the UK and the EU (2019)
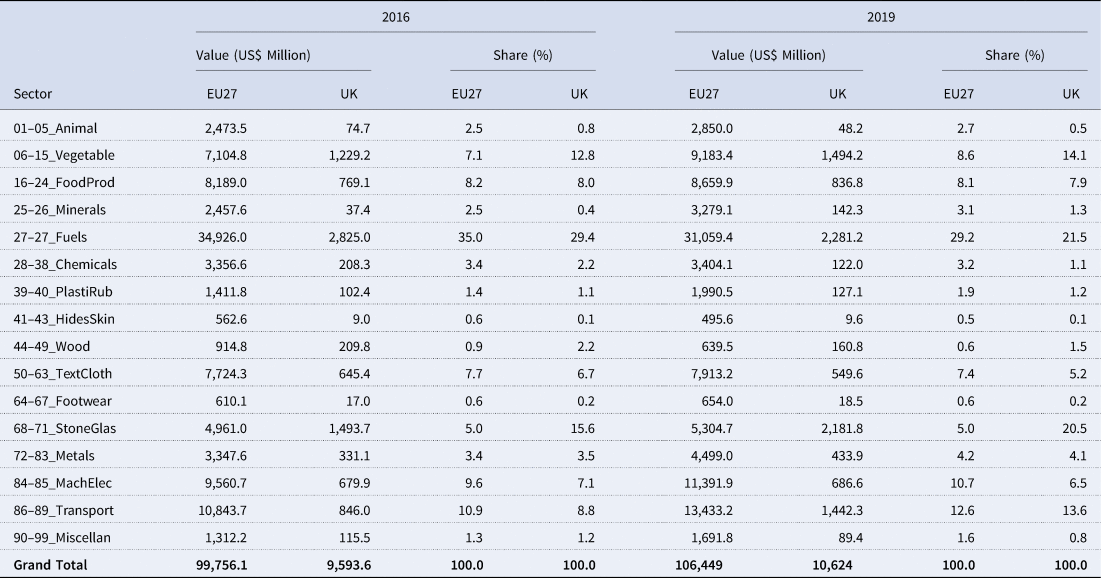
Source: Author's construction using WITS dataset.
Besides the similarity in trade structure, there are several other reasons to use the EU member countries as a counterfactual. The EU market closely resembles the UK market in terms of demand structure and trade linkages. While Africa's trading relationship with the EU was expected to largely remain unaltered after Brexit, the UK's trade regime was expected to undergo a radical change after the 2016-referendum results, creating uncertainty for African firms serving the UK market (Bank of England, 2021).
4. Estimation Methodology
To quantify the extent of the trade effect on African countries of Brexit's announcement, the analysis uses the standard difference-in-difference regression framework, which in its most basic form can be expressed as follows:
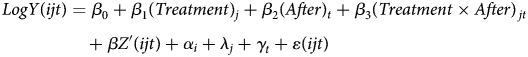 $$\eqalign{LogY( {ijt} ) & = \beta _0 + \beta _1( {Treatment} ) _j + \beta _2( {After} ) _t + \beta _3( {Treatment \times After} ) _{\,jt} \cr & \quad + \beta Z^{\prime}( {ijt} ) + \alpha _i + \lambda _j + \gamma _t + \varepsilon ( {ijt} ) } $$
where
Y(ijt) denotes the dependent variable, which is the value of African exports to the UK or EU (in logs). The subscript i denotes the export origin countries (Africa) while j denotes destination markets in the control (EU 27) and treatment groups (UK), while t indicates the time frame in years. These export values are measured in USD millions.
After is a dummy variable (1,0), which is equal to 0 before 2016 and 1 for 2016 onwards. The year 2016 is the cut off time when the referendum for Brexit took place. We follow the approach of Douch and Edwards (Reference Douch and Edwards2021, Reference Douch and Edwards2022) who use June 2016 as a cut-off point for the treatment. However, as suggested in Graziano et al. (Reference Graziano, Handley and Limão2021), we test the robustness of results using a 2015 cut-off date, which is when the referendum was announced.
Treatment is also a dummy variable (1,0), which is equal to 1 for exports to the UK and 0 for exports to the EU-27 countries.
The regressor of interest here is the term Treatment × After. This represents the interaction of both the Treatment and After variables. A negative and statistically significant coefficient for this regressor, β 3, would imply that African exports to the treatment group (UK) have fallen in the post-Brexit referendum period relative to the control group (EU) countries.
Z is a set of covariates. These control variables are the GDP of exporting and importing countries and their bilateral FDI.
αi , λj, and γt are a set of fixed effects for the exporting country, importing country, and time, respectively. These fixed effect account for any omitted variables along country and time dimensions.
ɛ(ij t) is an idiosyncratic error term.
The estimation method is Ordinary Least Squares (OLS). This is followed by robustness checks through the testing of African exports to the UK relative to the rest of the world. To account for heteroskedasticity in trade data and the presence of zero trade flows, the Poisson Pseudo Maximum Likelihood (PPML) estimator, as suggested in Silva and Tenreyro (Reference Silva and Tenreyro2006), is also used as a robustness check.
4.1 Exogeneity and Omitted Variables
The OLS regression estimation requires that treatment is exogenous and there is no omitted variables bias. Exogeneity requires that intervention is unrelated to the outcome at baseline. This means that the allocation of the intervention was not determined by the outcome. This is valid for this experimental set up as the event of Brexit is exogenous for African exporters. The decision to leave the EU in 2016 was the UK's internal decision and had nothing to do with African countries and their exporting firms.
The second issue of no omitted variable bias means that in 2016 and onwards there were no other events that happened which could have affected African exports to the UK differently than those destined to the EU. If something else had happened other than Brexit, any findings could have been falsely attributed to Brexit. This assumption is hard to test formally, but there are no obvious UK/EU/world events in 2016 which could confound the results. The only major event is the COVID pandemic that affected African exports in 2020. To rule out its potential effect on exports to the UK, in the robustness checks we dropped observations pertaining to 2020.
4.2 Parallel Trends Assumption
One main assumption for the use of difference-in-difference estimation approach is that both control and treatment groups should depict similar trajectories before treatment. Figure 3 plots total exports from Africa to the UK and EU. A visual check of the African exports’ trajectory to both markets (EU27 and the UK) in this period, shows that it does look like the exports (Y variable) have the same trend for the treatment and control group pre-2016. The chart shows that two lines are roughly parallel pre-2016, with exports rising and falling together in various years, suggesting that this key assumption is valid. The formal testing of this assumption is however excluded due to space limitations.
4.3 Limitations of Study
The following limitation of the study needs to be kept in view when interpreting the results.
Firstly, The COVID-19 pandemic affected these regions during the later period of the analysis, for 2020 and 2021. Such affects could partly be driven by the disruptions in supply chains caused by the pandemic, which are hard to separate out and isolate. The pandemic caused a drop of about 12% in African countries exports in 2020, a much larger drop than in other economies.Footnote 3 The pandemic affected African countries mainly in 2020. The robustness of results by dropping observations for 2020, the period of global trade collapse, does not affect estimation results.
Second, the paper uses aggregate level export data and not sector level data. The aggregate level export data provides a deeper understanding of macro-level effects but does not inform on of how the various industries were affected domestically.
Third, the study only analyses the effect on African countries exports (the goods coming into the UK and the EU from African countries). Also, it does not explore the impacts on imports into Africa from these markets and thus provides a partial impact of the Brexit announcement.
Fourth, the sample is restricted to the African region, other third-party countries that are affected by the Brexit announcement are not included.
Fifth, instead of dummies, we could have used continuous variables of uncertaintiesFootnote 4, which would have highlighted firms’ reaction to increasing uncertainty, but the unavailability of annual data of the uncertainty index for all export destinations in the EU market prevented the use of this approach.
Finally, although the trade and GDP data of most countries, including the African region, is widely tracked, it is not always the most accurate for all economies due to the presence of large informality in those developing countries. Their statistical offices face severe limitations in the resources, time, training, and budgets required to produce reliable and comprehensive series of national accounts.Footnote 5
Hence, the analysis may not provide a full picture of the impacts of Brexit on African exports. Due to these limitations, the generalization of the results to other regions and trade flows requires caution.
5. Estimation Results
This section presents evidence on the effects of the Brexit announcement on African exports to the UK using the difference-in-difference model set out in section 4 above. Following the baseline estimations, it also presents tests to check the robustness of these results through the testing of African exports to the UK relative to the rest of the world, dropping observations pertaining to 2020 (the year of the extreme pandemic) and using an alternative estimator, the PPML.
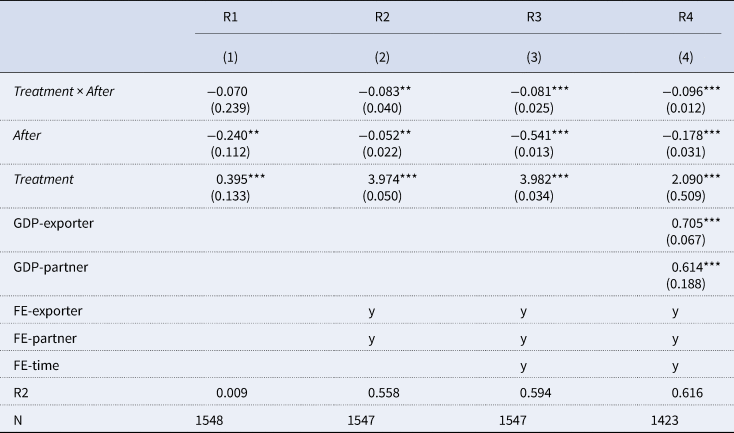
Regression 1 (R1) in Table 4 contains the estimation results for the simplest form of the difference-in-difference model. This regression is run without the inclusion of any fixed effects and control variables. The result of this regression implies that there was a decrease in African exports to the UK relative to the EU. In terms of magnitude, this regression coefficient of −0.233 means that there was approximately a 23% fall in exports to the UK. The estimated coefficient is significant at the 5% level. The R2 value, which is a measure of how well the linear model fits the set of observations, lies at 0.042. This means that this model does not have much explanatory power.
OLS estimation results of the effect of Brexit on African exports to the UK
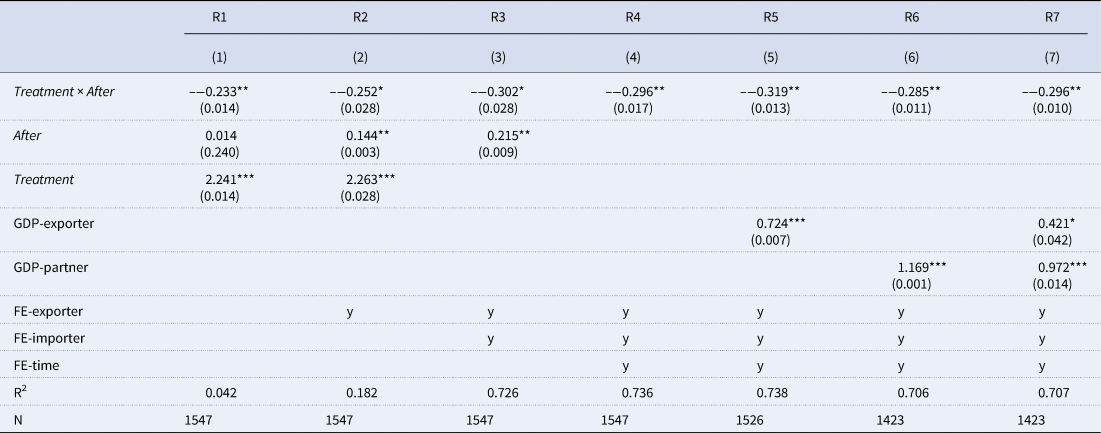
Dependent variable is exports in logs.
Note: Robust standard errors are in the parenthesis. These coefficients were obtained using Stata 15MP, *p < 0.10, **p < 0.05, ***p < 0.01.
Regression 2 was then run with the addition of country exporter fixed effects, which led to a similar result as in column (1). The coefficient of interest here is −0.252 and is significant at the 10% level. This suggests that African exports to the UK did decrease after the Brexit announcement by 25.2%. For this regression, the R2 value increases to 0.182.
The regression 3 adds importer country fixed effects to the estimation, which led to a slightly larger result than column (2), with the new coefficient of interest at −0.302. The R2 value shoots up from 0.182 in regression 2 to 0.726 in regression 3, suggesting that the model is more appropriate and better suited for the set of observations. This indicates that there are many unobservable factors that affect these results, and controlling for these within the regression framework improves the fit of the model.
Regression 4 adds time fixed effects to account for any unobservable factors that affect all countries over this period of time along with country exporter and importer fixed effects within the estimation. The coefficient of interest is at −0.296, and the significance level has now improved from 10% to 5%.
Regression 5 now adds the control variable for the GDP exporter. This results in a slight increased reduction of exports to the UK, with the coefficient of interest going from −0.296 to −0.319 and still being significant. The coefficient on GDP is positive as expected. This indicates that trade flow between these countries is directly related to the size of the exporters GDP, which supports the earlier findings of various gravity model estimations (Head and Mayer, Reference Head and Mayer2014).
In regression 6, it is now accounting for the GDP of the partner country. The magnitude of the GDP partner's coefficient is positive and significant at the 1% level. The comparison of coefficients on GDP in column 5 and 6 indicates that the GDP of the partner (importing country) has a larger effect than the GDP of the exporter. This reflects that richer markets attract more exports.
Regression 7 includes both of the control variables within the estimation, the GDP of the exporters and the importers, as well as all of the fixed effects. This leads to a significant result showing that there is a decrease in African exports to the UK relative to the EU by approximately 30%.
Throughout the regressions, the R2 value is on the rise. This is from 0.042 at R1, gradually ending up at 0.707 at R7. This reflects that as the regression's controls increase, the model becomes more appropriate and has larger explanatory power.
Overall, from regression 2 to the final regression, the magnitude of the coefficient is relatively stable, and the result is consistently negative and statistically significant. The coefficient magnitude fluctuates marginally depending on the control variables, ranging from a low of 23% to a high of 32% between the regressions, and the level of significance varies from 10% to 5% depending upon the nature of the controls. These results demonstrate that the African exports to the UK declined relative to the EU following the Brexit referendum results in 2016.
5.1 What Drives this Decline in Trade?
Several factors seem to underpin this relative decline in African countries exports to the UK market. The potential disruption through supply chains on the UK's exit from the EU was an important trade-impeding factor as the nature of UK's trading relationship with the EU and rest of the world in the post-Brexit period was not entirely evident.
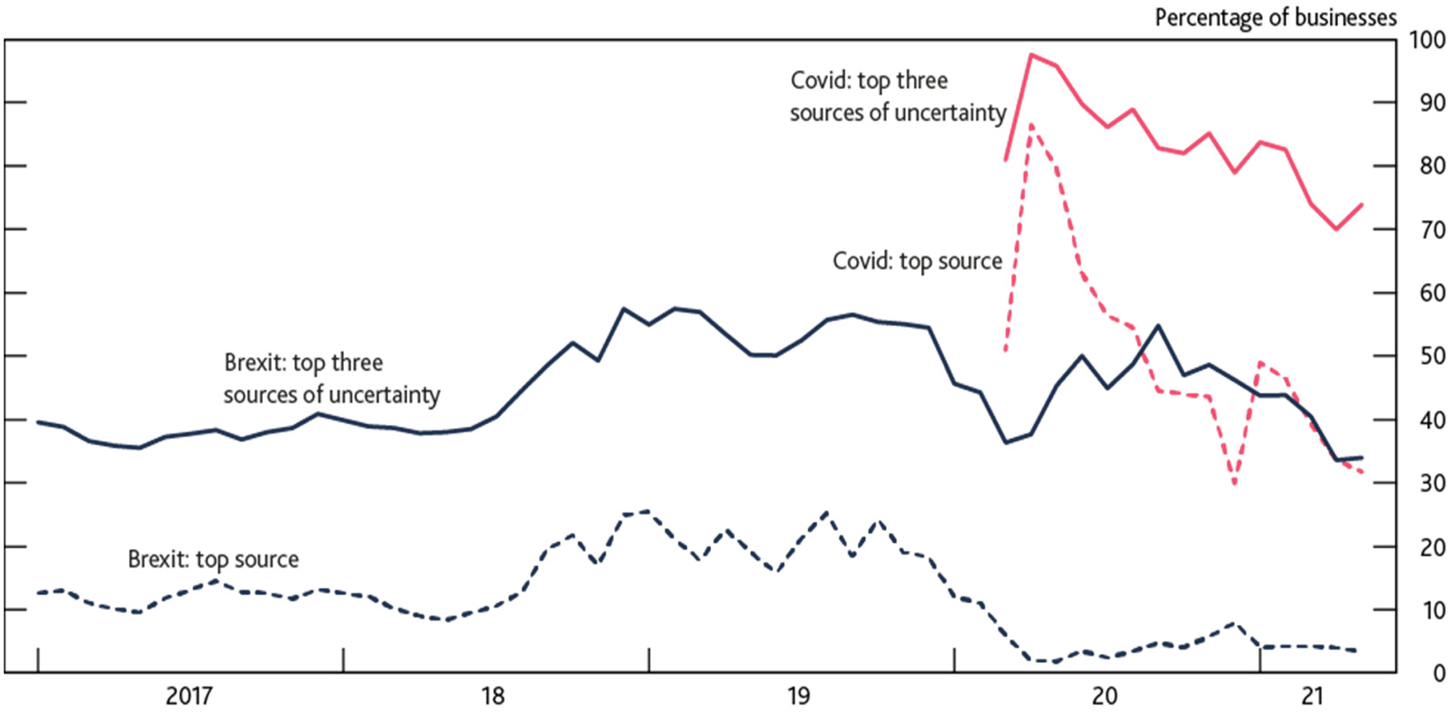
Bank of England (2021) reports that the trade and economic policy uncertainty were key headwinds for international business in this period (Figure 4). It finds that the effect of UK's decision to leave the EU increased uncertainty and lowered the level of investment by almost 25% in 2020–2021, with the effect having built up gradually since the 2016 Brexit referendum. Douch and Edwards (Reference Douch and Edwards2022) reinforce that the ambiguity surrounding supply chain costs is a possible reason for ‘at least some of the shortfall’. Further adding that even before such policy changes, the uncertainty and awaiting related to it can result in impactful effects on trade. They also argue that uncertainty regarding future trade policies seemed to increase during the post-Brexit referendum negotiations and hence proved to have a ‘forceful impact’ (Douch et al., Reference Douch, Du and Vanino2022).
Brexit referendum as an important source of uncertainty for businesses
Source: Bank of England (2021).
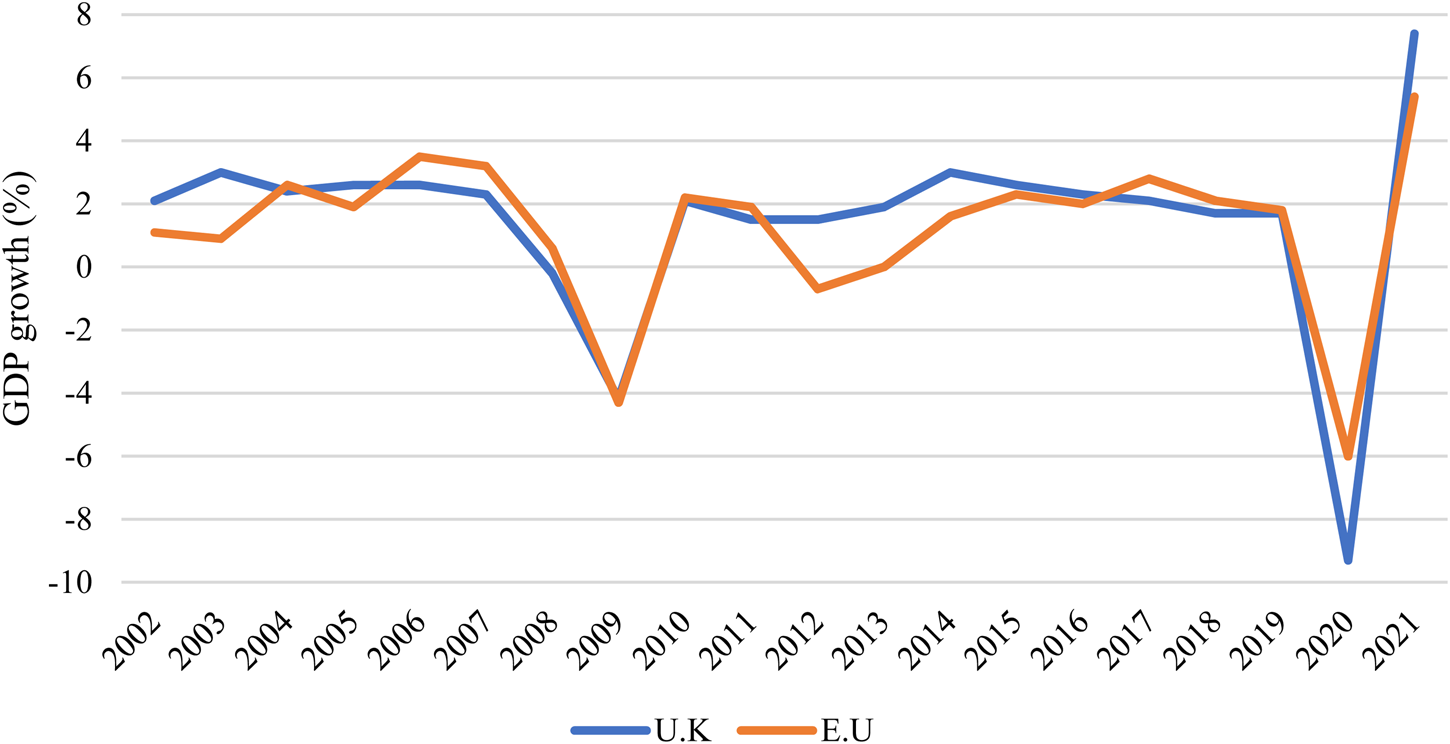
In terms of macroeconomic shocks, it is visible that the UK and the EU's GDP growth rate followed a similar pattern in this period (Figure 2). This emphasizes that the macro-economic shocks impacted both economies in a similar way, and hence uncertainty seems to play a bigger role in this instance. Macroeconomic shock became more salient during the pandemic and in the post-Brexit period since January 2021, when both Brexit and Covid had reduced growth potential because of lower labour supply, weak investment, and reduced trade openness (Figure 5).
Annual GDP growth rate, UK vs. EU
Source: Authors’ construction using WDI, the World Bank.
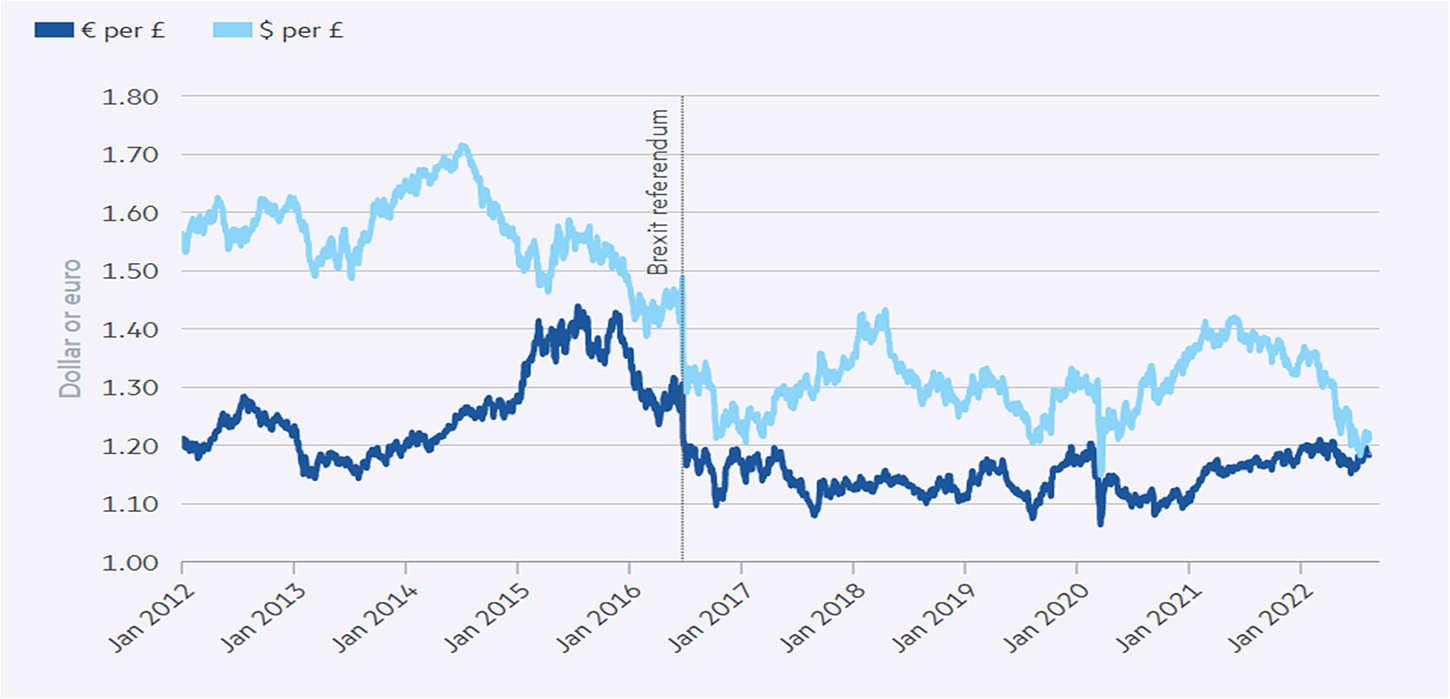
The macroeconomic shock could have also transmitted through the channel of reduced investment in the UK. Bank of England (2021) shows that both the UK's decision to leave the EU and Covid-19 have weighed heavily on investment and impacted demand. Finally, another potential channel of transmission of the macroeconomic shock could be weaker UK currency. The British pound has struggled to recover since the Brexit referendum (Figure 6). The fact that the pound has never been able to regain the levels traded against the euro before the Brexit referendum corresponds to the weakness of investment in this period. As the trade theory suggests, the weaker pound incentivizes exports but raises the cost of imports.
Depreciation of Pound since Brexit referendum
Source: Financial times (ft.com).
6. Robustness Tests and Heterogeneity Analysis
This sub-section considers some further issues around the robustness of the above results.
6.1 Using Alternative Estimator
First, we replicate the same set of regressions with the PPML estimator as suggested in Silva and Tenreyro (Reference Silva and Tenreyro2006) and several other studies. Table 5 contains these results, showing that in all these slightly variant estimations, the coefficient of interest is negative and statistically significant. The magnitude of the coefficient obtained in this approach is almost one-third that of the OLS estimations. This could suggest that the results of the OLS estimator might by biased upward.
PPML estimation results
Dependent variable is exports.
Note: Robust standard errors are in the parenthesis. These coefficients were obtained using Stata 15MP, *p < 0.10, **p < 0.05, ***p < 0.01.
6.2 Controls for Supply Chain Linkages and Demand in the UK and EU Market
Estimation results in Table 6 account for additional controls as well as disruptions related to the COVID-19 pandemic. It also presents a comparison of Africa's exports to the UK relative to the rest of the world (excluding the EU).
Robustness checks
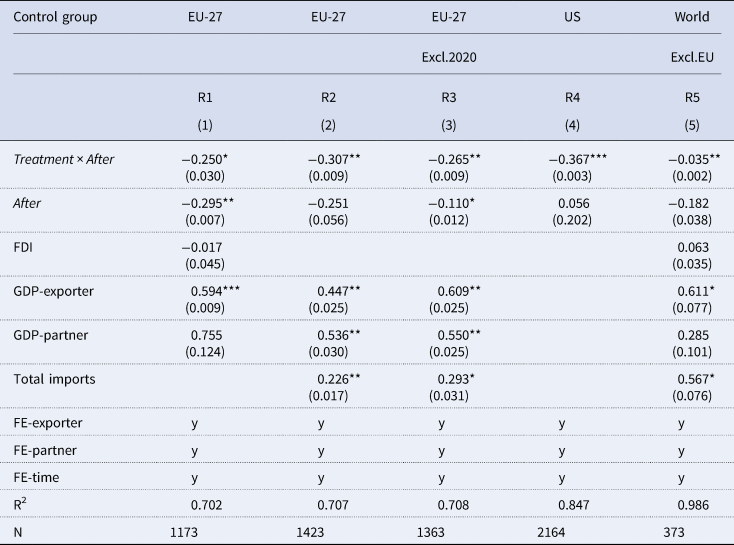
Dependent variable is a log of exports.
Note: Robust standard errors are in the parenthesis. These coefficients were obtained using Stata 15MP, *p < 0.10, **p < 0.05, ***p < 0.01.Regression (1) adds, both GDP of the exporter and the partner, and FDI, as control variables. There is also the inclusion of ‘time’ and country fixed effects. There is a significant result showing a 25% reduction in African exports to the UK following the Brexit announcement in 2016.
Regression (2) adds a control variable of UK's total imports from the rest of the world. This is used as a control because at this time the UK's economy was also slowing down and hence so was demand for imports from the rest of the world. UK's GDP growth rate gradually reduced from 2.6% in 2016 to 1.7% in 2019 (ONS, 2019). This effect could partially be picked up by the inclusion of a control for GDP, but the inclusion of total imports provides an additional assurance as the coefficient of interest remains negative and statistically significant at the 5% significance level.
6.3 Effect of the Pandemic-Related Disruptions to Supply Chains
The pandemic hit these economies very hard, through demand, supply, as well as logistic disruptions. In 2020, African regions global exports declined by about 12%, a much larger drop than for the rest of the world. UK GDP also collapsed by around 10% in 2020; this could have affected the demand for imports. Regression (3) accounts for the pandemic-related disruptions to the supply chains by excluding the observations for 2020 (Table 6). As the results show, limiting the sample to the pre-pandemic period reduces the magnitude of the effect but it still remains negative and statistically significant at 5% (column 3). This also suggests that the pandemic accentuated this decline in the UK-bound exports, but these were already on the decline before the pandemic.
6.4 Alternative Control Groups (USA, and the World)
The model compares African exports to the UK with EU exports. It can be argued that both sets of exports are treated by Brexit. To address this, we replicate the results with unrelated control groups by looking at the major export market of African countries.
Apart from the EU, Africa's other major export markets that can be used as counterfactuals are China, India, and the USA (Table 7). China and India largely import commodities from African countries, whereas the UK has larger import share of industrial goods. Due to this large difference in the composition of trade, none of them constitutes a valid control group. Africa's fourth largest export market, the US, has similar shares of industrial supplies and food products in their imports from Africa as the UK. Hence, the second-best alternative counterfactual to tease out the confounding influence of Brexit on the EU could be the US.
Sectoral shares of African exports in major export markets (2016)
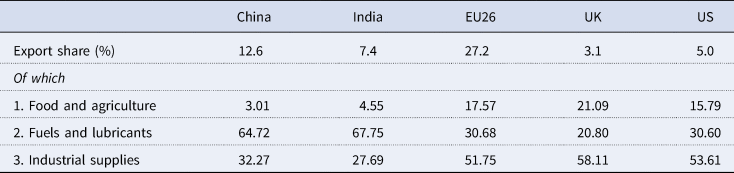
Source: WITS.
The replication of the estimate with this alternative counterfactual also yields similar results (Table 6, column 4). The coefficient of interest on the interaction terms (Treatment × After) is negative and statistically significant, enhancing confidence in the robustness of the baseline results. The magnitude of the effect is relatively higher than that estimated by using the EU as a counterfactual, indicating that some of the Brexit-related disruptions might be common to both the UK and EU markets, which are teased out by using the US as a control group.
Finally, we run regressions on the data to see African exports to the UK relative to the rest of the World. The reasoning for this being that the effect of Brexit is only on Africa's trade with the UK and the EU; their trade with the rest of the world would remain unaffected. It can also be argued that the EU's trade was also affected due to Brexit, but the African exports to the rest of the world were unaffected. Hence, the EU data are replaced with the exports to the world in this regression. This also provides additional insights on how African exports to the UK performed relative to that estimated for the rest of the world.
This trend can be seen on the graph in Figure 4, which suggests that African exports to the UK and African exports to the world, both follow a somewhat similar pattern up until 2016. However, they rebounded in 2016 but the African exports to the UK rebounded less, compared to African exports to the world. This can be attributed to the announcement of the Brexit trade deal in 2016 Figure 7.
Trends for African exports to the UK and the World, 2002–2021. Source: Author's construction using WITS dataset
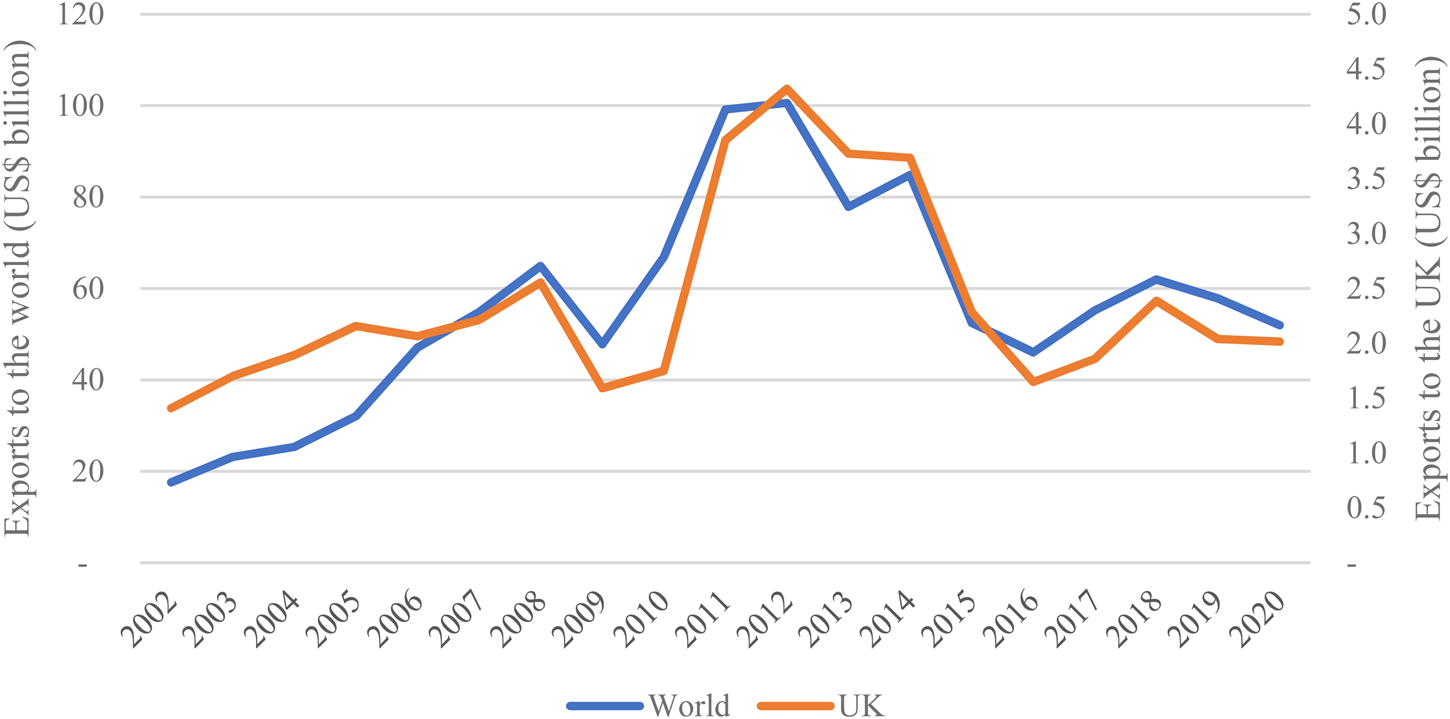
This estimation relative to the rest of the world shown in column (5), has a regression coefficient of –0.035, implying that there was a decrease in African exports to the UK by 3.5% relative to the rest of the world. This is lower in comparison to the African exports to the UK relative to the EU, as shown above, which also drops although by not as much. The estimated coefficient on the treatment × after for R3 indicates that this result was significant at the 5% level. A possible reason for this lower magnitude of coefficient could be that Brexit affected African exports to the UK relative to the EU, but not as much relative to the rest of the world. Perhaps Brexit caused African exports to divert from the UK to the EU, which would make the difference between the UK and EU widen more than the difference between UK and the rest of the world.
6.5 Alternative Cut-Off Date (2015)
Our main estimates follow the approach of Graziano et al. (Reference Graziano, Handley and Limão2021) and Douch and Edwards (Reference Douch and Edwards2021) and use 2016 as the cut-off. However, we replicate the baseline regression by changing the cut off to 2015 (Table 8) and find that the results remain largely unchanged, as the coefficient of interest on the interaction term (row 1) remains negative and statistically significant. The magnitude of the effect is almost half that of the baseline results, and the level of significance drops to a 10% significance level in some estimations (columns 1–4).
Estimation results with 2015 Cut-Off
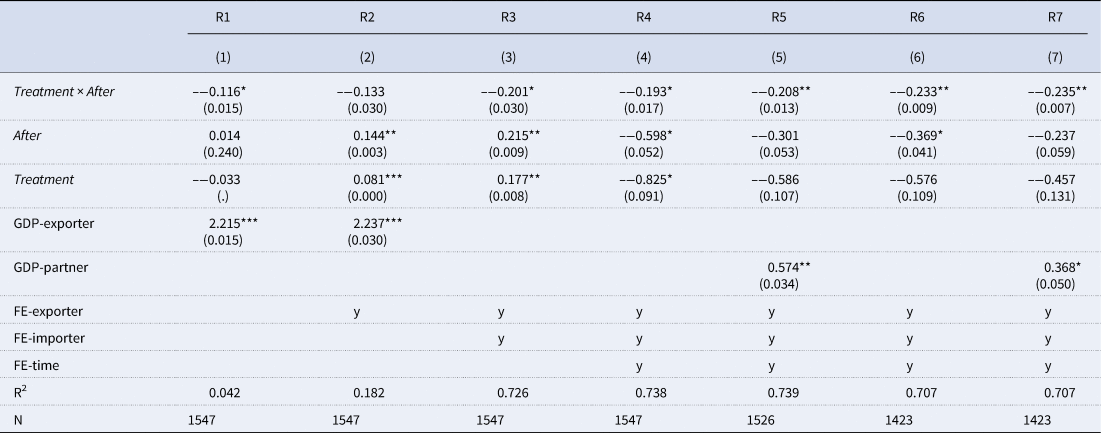
Dependent variable is exports in logs.
Note: Robust standard errors are in the parenthesis. These coefficients were obtained using Stata 15MP, *p < 0.10, **p < 0.05, ***p < 0.01.
This difference in estimate compared with the baseline results (reported in Table 5 of the paper) narrows down as we control for the GDP of trading partners along with a robust set of fixed effects. This also increases the significance level of the coefficient of interest from 10% to 5% (columns 5–7).
This lesser magnitude of the effect with 2015 cut-off suggests that trade flows started to drop immediately after the announcement of the Brexit referendum in 2015, but the main drop in exports were triggered when theresults of the Brexit referendum became evident. In contrast, Douch and Edwards (Reference Douch and Edwards2022) found that UK exports to both groups of countries fell below those of the ‘synthetic Britain’, with much of the shortfall developing over the year prior to the referendum, following the 2015 Conservative general election win.
6.6 Heterogeneity Analysis and Additional Robustness Checks
This section examines the heterogeneity of the results across products as well as across exporting countries in African and import destinations in the EU.
6.6.1 Heterogeneity Across Product Groups
As shown in Table 3 above ‘fuels’ form a very substantial part of Africa's exports to both the UK and the EU. One can argue that it is the fall in fuel exports to the UK that drives the overall fall in trade, particularly since the UK is itself a large fuels producer. To address this potential concern, we repeat the analysis by excluding fuels and also by splitting the estimated coefficient on the interaction term into three broader economic categories of exports: agriculture, fuels, and industry (Table 9).
Estimation results: sectoral decomposition
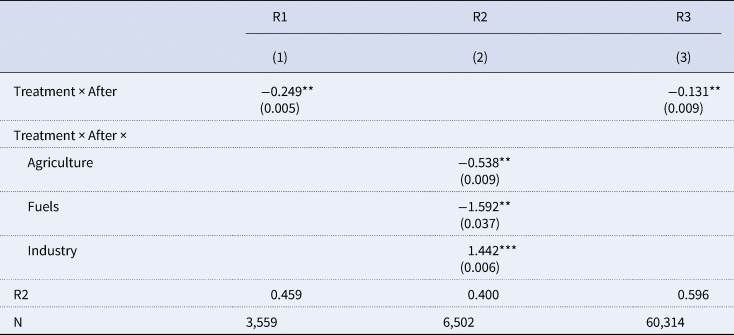
Dependent variable is log of exports.
Note: These coefficients were obtained using stata 15MP, *p < 0.10, **p < 0.05, ***p < 0.01.
Excluding fuels from the estimation sample reduces the magnitude of the effect but does not affect its sign and statistical significance (column 1). Similarly, splitting the effect across sectors shows that Africa's fuels exports underwent the largest decline in this period, followed by agricultural products (column 2). By contrast, the exports of industrial goods remained resilient and experienced an increase.
To further investigate the drop in agricultural exports as reflected in column (2), we replicate the same estimation for agricultural products only. This estimation uses disaggregated data at the HS6 level for all agricultural products classified under HS1 to HS24. We include product–year fixed effects to account for any seasonal shocks to agricultural production and exports from African countries resulting from variation in climatic conditions. These estimates for within-product variation confirm a drop in UK-bound agricultural exports relative to the EU by 13% in the post Brexit referendum period.
6.6.2 Heterogeneity across Export Origins: Commonwealth Members vs. Others
Historical colonial linkages play an important role in the gravity analysis of international trade (Head et al., Reference Head, Mayer and Ries2010). Douch and Edwards (Reference Douch and Edwards2022) make a distinction between non-Commonwealth and Commonwealth countries; Commonwealth sales to the UK have risen. They attribute this as tentative evidence of the UK turning towards the Commonwealth, and argue that this may be consistent with the Brexit campaign reinforcing pro-Commonwealth sentiment among the Leave voters, whose consumer confidence also rose following the result.
To check the influence of these ties, we split the sample into exports originating from African Commonwealth (CW) countries and non-Commonwealth countries (NCW). The estimation sample has four CW members (Ghana, Kenya, Nigeria, and South Africa,) and six NCW members (Algeria, Angola, Egypt, Equatorial Guinea, Mauritius, and Morocco). These CW countries account for 46% of observations and 58% of UK-bound exports. Estimation results (Table 10) show that the effect is very similar for both these groups. The magnitude of the effect and significance level is slightly higher for CW countries (Column 1) than for NCW (column 2) but as the comparison of the results (column 3) show, the difference is not statistically significant.Footnote 6 This similar effect for both groups of countries is in line with the findings of Head et al. (Reference Head, Mayer and Ries2010), which suggest the weakening of colonial linkages after independence.
Estimation results: heterogeneity across exporting and importing countries
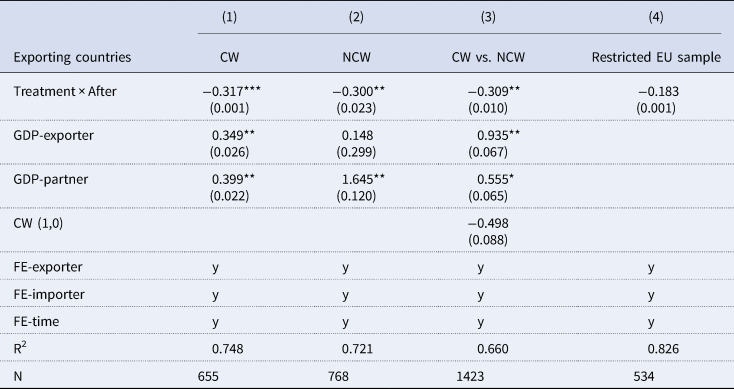
Dependent variable is exports in logs.
Note: Robust standard errors are in the parenthesis. These coefficients were obtained using Stata 15MP, *p < 0.10, **p < 0.05, ***p < 0.01.
6.6.3 Heterogeneity across Export Destinations
Our baseline analysis assumes that all EU countries are similar in terms of market type. But Eastern and Northern European countries are very different from the others. The three most similar EU countries to the UK in terms of culture, demography and other economic characteristics are Ireland, Germany, and Netherlands.Footnote 7 We replicate the estimates by restricting the counterfactual to these three EU countries only (column 4, Table 10). The main findings hold to this change in sample size, although the magnitude of the effect is somewhat smaller.
This relatively modest effect for a similar EU market could indicate the resilience on the part of firms serving both UK and the EU member countries. These firms might be benefiting from the economy of scale for exporting similar goods to both control and treatment groups markets.
7. Conclusions, Policy Implications and Further Research
This empirical analysis finds that the Brexit announcement negatively affected Africa's exports to the UK relative to the EU. The descriptive analysis shows a fall in UK's share of African exports since the Brexit referendum in 2016, and the empirical estimations find a large and statistically significant drop in UK bound exports relative to the EU-27. The African region's exports to the UK also dropped relative to the rest of world (excluding the EU-27) but this decline is relatively modest, suggesting a much larger role of the Brexit-related potential increase in trade costs and other uncertainties in this decline. These effects are not specific to the COVID-19 pandemic and hold for the pre-pandemic period also; however, it seems that the pandemic compounded this decline in 2020. A series of robustness checks support this drop in exports, although the magnitude of the effect varies with the estimation approach and the control variables.
Africa is home to the largest number of least developed countries in the world and out of the 700 million people living below the poverty line globally, 500 million reside solely within this continent. Since international trade, especially exports are the engine of growth and development, this large drop in African exports could increase the poverty level in this already impoverished region of the world. It seems that the potential uncertainties about the tariffs, customs checks, border delays, and extra paperwork for exporting to the UK might have put off several firms. The drop in exports may become more severe in the coming years as SPS regimes of the UK and EU are diverging gradually.
Given the large unintended effects of Brexit on African countries exports, it is important to support these economies to increase their engagement in international trade and thus to regain their lost market share. One policy option could be regular policy dialogues with the EU and the UK to better understand the challenges faced by African exporters. Additionally, Aid-for-Trade could help strengthen the competitiveness of African exporters to navigate these new trade realities.
This paper has examined the effect of Brexit on African countries exports at an aggregate level. Further research could look into these effects at a disaggregated level, to help identify the specific countries, sectors, and products that were affected adversely. This sector level analysis could shed light on unfavourably affected industries helping policy makers to tailor the support mechanism accordingly.
Acknowledgements
Throughout the writing of this paper, we have received a great deal of support and assistance from several individuals. We would first like to thank Dr. Alexander Clymo whose advice and guidance was invaluable during the course of this paper. We would also like to thank Professor Melvyn Coles for his encouragement and mentorship.


 Open access