

Traditional direct questioning methods face limitations when socially sensitive topics are studied. Usually, respondents may refuse to answer, may conceal their true preferences, opinions or behaviors if the attribute in question is illegal, or may temper their responses to appear to be more socially acceptable (social desirability bias), especially if their responses can be observed by the third parties. These make data collection using surveys with sensitive questions challenging, as refusal to answer will result in nonresponse bias and offering untruthful answers will lead to response bias. Both sources of bias can negatively influence data quality and produce severely biased prevalence estimates (i.e., over- or under-estimation of the behavior under study) and inflated standard error estimates (i.e., probably wrong conclusion), which in turn jeopardize the usefulness of the data for both research and policy making (Chaudhuri & Mukerjee, Reference Chaudhuri and Mukerjee1988; Rasinski et al., Reference Rasinski, Willis, Baldwin, Yeh and Lee1999; Tourangeau & Yan, Reference Tourangeau and Yan2007).
Randomized response techniques (RRTs), originally proposed by Warner (Reference Warner1965), aim to eliminate or at least minimize both response and nonresponse biases from survey respondents. By introducing random noise via employing a randomizing device, the RRT conceals individual responses and thus protects respondents’ privacy. Therefore, respondents may be more willing to answer truthfully. In Warner’s model, a respondent is presented with two mutually exclusive statements about the sensitive attributes, for example, (A): Have you ever made promises without an intention to deliver in a negotiation? and (
\documentclass[12pt]{minimal}\usepackage{amsmath}\usepackage{wasysym}\usepackage{amsfonts}\usepackage{amssymb}\usepackage{amsbsy}\usepackage{mathrsfs}\usepackage{upgreek}\setlength{\oddsidemargin}{-69pt}\begin{document}$$A^c$$\end{document}
 ): Have you never made promises without an intention to deliver in a negotiation? The respondent is then instructed to provide an answer to statement A or
\documentclass[12pt]{minimal}\usepackage{amsmath}\usepackage{wasysym}\usepackage{amsfonts}\usepackage{amssymb}\usepackage{amsbsy}\usepackage{mathrsfs}\usepackage{upgreek}\setlength{\oddsidemargin}{-69pt}\begin{document}$$A^c$$\end{document}
): Have you never made promises without an intention to deliver in a negotiation? The respondent is then instructed to provide an answer to statement A or
\documentclass[12pt]{minimal}\usepackage{amsmath}\usepackage{wasysym}\usepackage{amsfonts}\usepackage{amssymb}\usepackage{amsbsy}\usepackage{mathrsfs}\usepackage{upgreek}\setlength{\oddsidemargin}{-69pt}\begin{document}$$A^c$$\end{document}
 , depending on the outcome from a randomizing device provided by the interviewer (e.g., spinning arrow, dice or coin), with the probability p of being assigned to answer A and
\documentclass[12pt]{minimal}\usepackage{amsmath}\usepackage{wasysym}\usepackage{amsfonts}\usepackage{amssymb}\usepackage{amsbsy}\usepackage{mathrsfs}\usepackage{upgreek}\setlength{\oddsidemargin}{-69pt}\begin{document}$$1-p$$\end{document}
, depending on the outcome from a randomizing device provided by the interviewer (e.g., spinning arrow, dice or coin), with the probability p of being assigned to answer A and
\documentclass[12pt]{minimal}\usepackage{amsmath}\usepackage{wasysym}\usepackage{amsfonts}\usepackage{amssymb}\usepackage{amsbsy}\usepackage{mathrsfs}\usepackage{upgreek}\setlength{\oddsidemargin}{-69pt}\begin{document}$$1-p$$\end{document}
 of being assigned to answer
\documentclass[12pt]{minimal}\usepackage{amsmath}\usepackage{wasysym}\usepackage{amsfonts}\usepackage{amssymb}\usepackage{amsbsy}\usepackage{mathrsfs}\usepackage{upgreek}\setlength{\oddsidemargin}{-69pt}\begin{document}$$A^c$$\end{document}
of being assigned to answer
\documentclass[12pt]{minimal}\usepackage{amsmath}\usepackage{wasysym}\usepackage{amsfonts}\usepackage{amssymb}\usepackage{amsbsy}\usepackage{mathrsfs}\usepackage{upgreek}\setlength{\oddsidemargin}{-69pt}\begin{document}$$A^c$$\end{document}
 (with
\documentclass[12pt]{minimal}\usepackage{amsmath}\usepackage{wasysym}\usepackage{amsfonts}\usepackage{amssymb}\usepackage{amsbsy}\usepackage{mathrsfs}\usepackage{upgreek}\setlength{\oddsidemargin}{-69pt}\begin{document}$$p \ne 0.5$$\end{document}
(with
\documentclass[12pt]{minimal}\usepackage{amsmath}\usepackage{wasysym}\usepackage{amsfonts}\usepackage{amssymb}\usepackage{amsbsy}\usepackage{mathrsfs}\usepackage{upgreek}\setlength{\oddsidemargin}{-69pt}\begin{document}$$p \ne 0.5$$\end{document}
 ). It should be noted that the interviewer does not know which question to be answered by the respondent, but he or she knows only the probability p. As a result, the privacy of the interviewee is protected (for details, see Fox & Tracy, Reference Fox and Tracy1986; Horvitz, Greenberg, & Abernathy, Reference Horvitz, Greenberg and Abernathy1976). It is noteworthy that statements A and A
\documentclass[12pt]{minimal}\usepackage{amsmath}\usepackage{wasysym}\usepackage{amsfonts}\usepackage{amssymb}\usepackage{amsbsy}\usepackage{mathrsfs}\usepackage{upgreek}\setlength{\oddsidemargin}{-69pt}\begin{document}$$^c$$\end{document}
). It should be noted that the interviewer does not know which question to be answered by the respondent, but he or she knows only the probability p. As a result, the privacy of the interviewee is protected (for details, see Fox & Tracy, Reference Fox and Tracy1986; Horvitz, Greenberg, & Abernathy, Reference Horvitz, Greenberg and Abernathy1976). It is noteworthy that statements A and A
\documentclass[12pt]{minimal}\usepackage{amsmath}\usepackage{wasysym}\usepackage{amsfonts}\usepackage{amssymb}\usepackage{amsbsy}\usepackage{mathrsfs}\usepackage{upgreek}\setlength{\oddsidemargin}{-69pt}\begin{document}$$^c$$\end{document}
 are two related but mutually exclusive and complimentary questions. Most importantly, both questions are related to the sensitive attribute. Several revisions and modifications of Warner’s model have been proposed over the years (e.g., Greenberg et al., Reference Greenberg, Abul-Ela, Simmons and Horvitz1969; Mangat, Reference Mangat1994). One of these is the well-established unrelated question model (UQM) proposed by Greenberg et al. (Reference Greenberg, Abul-Ela, Simmons and Horvitz1969). Briefly, UQM simply replaces statement
\documentclass[12pt]{minimal}\usepackage{amsmath}\usepackage{wasysym}\usepackage{amsfonts}\usepackage{amssymb}\usepackage{amsbsy}\usepackage{mathrsfs}\usepackage{upgreek}\setlength{\oddsidemargin}{-69pt}\begin{document}$$A^c$$\end{document}
are two related but mutually exclusive and complimentary questions. Most importantly, both questions are related to the sensitive attribute. Several revisions and modifications of Warner’s model have been proposed over the years (e.g., Greenberg et al., Reference Greenberg, Abul-Ela, Simmons and Horvitz1969; Mangat, Reference Mangat1994). One of these is the well-established unrelated question model (UQM) proposed by Greenberg et al. (Reference Greenberg, Abul-Ela, Simmons and Horvitz1969). Briefly, UQM simply replaces statement
\documentclass[12pt]{minimal}\usepackage{amsmath}\usepackage{wasysym}\usepackage{amsfonts}\usepackage{amssymb}\usepackage{amsbsy}\usepackage{mathrsfs}\usepackage{upgreek}\setlength{\oddsidemargin}{-69pt}\begin{document}$$A^c$$\end{document}
 in Warner’s model by a neutral question, for example, "Were you born in the first quarter of a year?". Dowling and Shachtman (Reference Dowling and Shachtman1975) proved that UQM usually yields a more reliable sensitive prevalence estimate than Warner’s estimate. Even though an unrelated question is introduced in the UQM, some respondents ("cheaters") will choose to answer a self-protective "No" to either of the two alternative questions in the survey. To take this behavior into consideration, another modification of the RRT known as cheater detection model (CDM) was proposed by Clark and Desharnais (Reference Clark and Desharnais1998). CDM is considered as an improvement over the forced-response procedure, which modifies Warner’s model by replacing the neutral question in the UQM by the forced instruction to say "yes" for the inverted sensitive question. In particular, it considers not only those carriers of the sensitive attribute who answer honestly and noncarriers who answer honestly but also a third class of respondents, namely cheaters who respond "No" regardless of the outcome of the randomization procedure. Clark and Desharnais (Reference Clark and Desharnais1998) referred to the latter class as cheaters. To provide a greater degree of privacy to respondents, Miller (Reference Miller1984) developed another indirect questioning technique, namely the item count technique (ICT), in which the respondents are randomly assigned to either the experiment group or control group. Respondents in the control group are presented with a list of k neutral questions with answers "Yes" or "No", those in the experiment group are given the same k neutral questions together with the sensitive item. In both groups, all respondents are asked to report only their total number of "Yes" answers but not the replies to the individual items. Note that the response to each question is a binary variable. The difference between the observed means in the experiment and control groups provides an estimate of the proportion of the sensitive attribute. The privacy of respondents is protected to a greater extent, because this approach allows respondents to mask their answers to the sensitive question. Therefore, a potentially less biased prevalence estimate of the sensitive attribute may be obtained using the item count procedure.
Sample size determination becomes a crucial step in every study design, since studies with an inadequate number of respondents may not yield significant conclusions, while those with an excess of respondents become a waste of investigators’ resources. Ulrich et al. (Reference Ulrich, Schröter, Striegel and Simon2012) derived the statistical powers for the aforementioned models (i.e., Warner’s RRT model, UQM, ICT and CDM) based on the Wald test statistic. As a result, their corresponding sample size requirements that can achieve a desired power for the Wald test with a predetermined Type I error rate can be readily obtained. However, it is well documented that confidence intervals are more informative than simple hypothesis tests (which simply yield a direct accept-or-reject conclusion) in terms of description of location and precision of the statistic, and confidence intervals should be the best reporting strategy, based on the recommendations of Wilkinson and the American Psychological Association Task Force on Statistical Inference (Reference Wilkinson1999) and the Publication Manual of the American Psychological Association (2009). Indeed, several prominent educational and psychological journals stressed in their editorial guidelines and methodological recommendations that it is necessary to include some measures of effect size and confidence intervals for all primary outcomes (see, Alhija and Levy, Reference Alhija and Levy2009; Dunst and Hamby, Reference Dunst and Hamby2012; Fritz, Morris and Richler, Reference Fritz, Morris and Richler2012; Odgaard and Fowler, Reference Odgaard and Fowler2010; and Sun, Pan and Wang, Reference Sun, Pan and Wang2010). In this paper, we thus consider the sample size formulas that can control the width of a confidence interval for the prevalence of sensitive attributes with a pre-specified confidence level. Most importantly, our formulas explicitly incorporate an assurance probability of achieving pre-specified precision.
This article is organized as follows. Sample size formulas that control the width of a confidence interval with a pre-specified confidence level for the prevalence of a sensitive attribute for the aforementioned models (i.e., Warner’s RRT model, UQM, ICT and CDM) are derived in Sect. 1. Most importantly, our formulas explicitly incorporate a pre-specified probability of achieving the pre-specified width. We evaluate their performance in Sect. 2. In Sect. 3, a real example of how Kern and Chugh (Reference Kern and Chugh2009) examined negotiators’ unethical behavior is used to illustrate the accuracy of the estimated sample size formulas. In this example, the sensitive question is: Have you ever made promises without an intention to deliver in a negotiation? In one of Kern and Chugh’s (Reference Kern and Chugh2009) experiments,
\documentclass[12pt]{minimal}\usepackage{amsmath}\usepackage{wasysym}\usepackage{amsfonts}\usepackage{amssymb}\usepackage{amsbsy}\usepackage{mathrsfs}\usepackage{upgreek}\setlength{\oddsidemargin}{-69pt}\begin{document}$$16.5\%$$\end{document}
 of participants, on average, made false promises to their advantage. Suppose that an applied psychologist collects survey data and examines whether negotiators use this unethical tactic in order to increase the likelihood of reaching an agreement. We calculate the required sample size for a new study that can control the width of a confidence interval at a specified confidence level, with the assurance probability of achieving the pre-specified precision, for the various RRT models considered in this article. A brief conclusion and discussion will be given in Sect. 4.
1. Sample Size Determination
1.1. Sample Size Estimation Under Warner’s RRT Model
1.1.1. Confidence Intervals Under Warner’s RRT Model
Under Warner’s model, a randomizing device is used to determine if a respondent will answer the sensitive question A with probability p or the complement question A
\documentclass[12pt]{minimal}\usepackage{amsmath}\usepackage{wasysym}\usepackage{amsfonts}\usepackage{amssymb}\usepackage{amsbsy}\usepackage{mathrsfs}\usepackage{upgreek}\setlength{\oddsidemargin}{-69pt}\begin{document}$$^c$$\end{document}
 with probability
\documentclass[12pt]{minimal}\usepackage{amsmath}\usepackage{wasysym}\usepackage{amsfonts}\usepackage{amssymb}\usepackage{amsbsy}\usepackage{mathrsfs}\usepackage{upgreek}\setlength{\oddsidemargin}{-69pt}\begin{document}$$1-p$$\end{document}
with probability
\documentclass[12pt]{minimal}\usepackage{amsmath}\usepackage{wasysym}\usepackage{amsfonts}\usepackage{amssymb}\usepackage{amsbsy}\usepackage{mathrsfs}\usepackage{upgreek}\setlength{\oddsidemargin}{-69pt}\begin{document}$$1-p$$\end{document}
 with p
\documentclass[12pt]{minimal}\usepackage{amsmath}\usepackage{wasysym}\usepackage{amsfonts}\usepackage{amssymb}\usepackage{amsbsy}\usepackage{mathrsfs}\usepackage{upgreek}\setlength{\oddsidemargin}{-69pt}\begin{document}$$\ne $$\end{document}
with p
\documentclass[12pt]{minimal}\usepackage{amsmath}\usepackage{wasysym}\usepackage{amsfonts}\usepackage{amssymb}\usepackage{amsbsy}\usepackage{mathrsfs}\usepackage{upgreek}\setlength{\oddsidemargin}{-69pt}\begin{document}$$\ne $$\end{document}
 0.5. The parameter of interest is the proportion of subjects in the population who possess the sensitive attribute and is denoted by
\documentclass[12pt]{minimal}\usepackage{amsmath}\usepackage{wasysym}\usepackage{amsfonts}\usepackage{amssymb}\usepackage{amsbsy}\usepackage{mathrsfs}\usepackage{upgreek}\setlength{\oddsidemargin}{-69pt}\begin{document}$$\pi _s$$\end{document}
0.5. The parameter of interest is the proportion of subjects in the population who possess the sensitive attribute and is denoted by
\documentclass[12pt]{minimal}\usepackage{amsmath}\usepackage{wasysym}\usepackage{amsfonts}\usepackage{amssymb}\usepackage{amsbsy}\usepackage{mathrsfs}\usepackage{upgreek}\setlength{\oddsidemargin}{-69pt}\begin{document}$$\pi _s$$\end{document}
 . Let
\documentclass[12pt]{minimal}\usepackage{amsmath}\usepackage{wasysym}\usepackage{amsfonts}\usepackage{amssymb}\usepackage{amsbsy}\usepackage{mathrsfs}\usepackage{upgreek}\setlength{\oddsidemargin}{-69pt}\begin{document}$$\lambda $$\end{document}
. Let
\documentclass[12pt]{minimal}\usepackage{amsmath}\usepackage{wasysym}\usepackage{amsfonts}\usepackage{amssymb}\usepackage{amsbsy}\usepackage{mathrsfs}\usepackage{upgreek}\setlength{\oddsidemargin}{-69pt}\begin{document}$$\lambda $$\end{document}
 \documentclass[12pt]{minimal}\usepackage{amsmath}\usepackage{wasysym}\usepackage{amsfonts}\usepackage{amssymb}\usepackage{amsbsy}\usepackage{mathrsfs}\usepackage{upgreek}\setlength{\oddsidemargin}{-69pt}\begin{document}$$=$$\end{document}
 \documentclass[12pt]{minimal}\usepackage{amsmath}\usepackage{wasysym}\usepackage{amsfonts}\usepackage{amssymb}\usepackage{amsbsy}\usepackage{mathrsfs}\usepackage{upgreek}\setlength{\oddsidemargin}{-69pt}\begin{document}$$\pi _s p+(1-\pi _s)(1-p)$$\end{document}
 (i.e., the probability of a respondent answering "Yes"), n the number of respondents participating in the survey and x the number of respondents answering "Yes." Obviously, x follows the binomial distribution
\documentclass[12pt]{minimal}\usepackage{amsmath}\usepackage{wasysym}\usepackage{amsfonts}\usepackage{amssymb}\usepackage{amsbsy}\usepackage{mathrsfs}\usepackage{upgreek}\setlength{\oddsidemargin}{-69pt}\begin{document}$$B(n,\lambda )$$\end{document}
(i.e., the probability of a respondent answering "Yes"), n the number of respondents participating in the survey and x the number of respondents answering "Yes." Obviously, x follows the binomial distribution
\documentclass[12pt]{minimal}\usepackage{amsmath}\usepackage{wasysym}\usepackage{amsfonts}\usepackage{amssymb}\usepackage{amsbsy}\usepackage{mathrsfs}\usepackage{upgreek}\setlength{\oddsidemargin}{-69pt}\begin{document}$$B(n,\lambda )$$\end{document}
 and the maximum likelihood estimate (MLE) of
\documentclass[12pt]{minimal}\usepackage{amsmath}\usepackage{wasysym}\usepackage{amsfonts}\usepackage{amssymb}\usepackage{amsbsy}\usepackage{mathrsfs}\usepackage{upgreek}\setlength{\oddsidemargin}{-69pt}\begin{document}$$\lambda $$\end{document}
and the maximum likelihood estimate (MLE) of
\documentclass[12pt]{minimal}\usepackage{amsmath}\usepackage{wasysym}\usepackage{amsfonts}\usepackage{amssymb}\usepackage{amsbsy}\usepackage{mathrsfs}\usepackage{upgreek}\setlength{\oddsidemargin}{-69pt}\begin{document}$$\lambda $$\end{document}
 is given by
\documentclass[12pt]{minimal}\usepackage{amsmath}\usepackage{wasysym}\usepackage{amsfonts}\usepackage{amssymb}\usepackage{amsbsy}\usepackage{mathrsfs}\usepackage{upgreek}\setlength{\oddsidemargin}{-69pt}\begin{document}$$\hat{\lambda }$$\end{document}
is given by
\documentclass[12pt]{minimal}\usepackage{amsmath}\usepackage{wasysym}\usepackage{amsfonts}\usepackage{amssymb}\usepackage{amsbsy}\usepackage{mathrsfs}\usepackage{upgreek}\setlength{\oddsidemargin}{-69pt}\begin{document}$$\hat{\lambda }$$\end{document}
 \documentclass[12pt]{minimal}\usepackage{amsmath}\usepackage{wasysym}\usepackage{amsfonts}\usepackage{amssymb}\usepackage{amsbsy}\usepackage{mathrsfs}\usepackage{upgreek}\setlength{\oddsidemargin}{-69pt}\begin{document}$$=$$\end{document}
 x/n with expectation being
\documentclass[12pt]{minimal}\usepackage{amsmath}\usepackage{wasysym}\usepackage{amsfonts}\usepackage{amssymb}\usepackage{amsbsy}\usepackage{mathrsfs}\usepackage{upgreek}\setlength{\oddsidemargin}{-69pt}\begin{document}$$\text{ E }(\hat{\lambda })$$\end{document}
x/n with expectation being
\documentclass[12pt]{minimal}\usepackage{amsmath}\usepackage{wasysym}\usepackage{amsfonts}\usepackage{amssymb}\usepackage{amsbsy}\usepackage{mathrsfs}\usepackage{upgreek}\setlength{\oddsidemargin}{-69pt}\begin{document}$$\text{ E }(\hat{\lambda })$$\end{document}
 \documentclass[12pt]{minimal}\usepackage{amsmath}\usepackage{wasysym}\usepackage{amsfonts}\usepackage{amssymb}\usepackage{amsbsy}\usepackage{mathrsfs}\usepackage{upgreek}\setlength{\oddsidemargin}{-69pt}\begin{document}$$=$$\end{document}
 \documentclass[12pt]{minimal}\usepackage{amsmath}\usepackage{wasysym}\usepackage{amsfonts}\usepackage{amssymb}\usepackage{amsbsy}\usepackage{mathrsfs}\usepackage{upgreek}\setlength{\oddsidemargin}{-69pt}\begin{document}$$\lambda $$\end{document}
 and variance being
\documentclass[12pt]{minimal}\usepackage{amsmath}\usepackage{wasysym}\usepackage{amsfonts}\usepackage{amssymb}\usepackage{amsbsy}\usepackage{mathrsfs}\usepackage{upgreek}\setlength{\oddsidemargin}{-69pt}\begin{document}$$\text{ Var }(\hat{\lambda })$$\end{document}
and variance being
\documentclass[12pt]{minimal}\usepackage{amsmath}\usepackage{wasysym}\usepackage{amsfonts}\usepackage{amssymb}\usepackage{amsbsy}\usepackage{mathrsfs}\usepackage{upgreek}\setlength{\oddsidemargin}{-69pt}\begin{document}$$\text{ Var }(\hat{\lambda })$$\end{document}
 \documentclass[12pt]{minimal}\usepackage{amsmath}\usepackage{wasysym}\usepackage{amsfonts}\usepackage{amssymb}\usepackage{amsbsy}\usepackage{mathrsfs}\usepackage{upgreek}\setlength{\oddsidemargin}{-69pt}\begin{document}$$=$$\end{document}
 \documentclass[12pt]{minimal}\usepackage{amsmath}\usepackage{wasysym}\usepackage{amsfonts}\usepackage{amssymb}\usepackage{amsbsy}\usepackage{mathrsfs}\usepackage{upgreek}\setlength{\oddsidemargin}{-69pt}\begin{document}$$\lambda (1-\lambda )/n$$\end{document}
 . Since
\documentclass[12pt]{minimal}\usepackage{amsmath}\usepackage{wasysym}\usepackage{amsfonts}\usepackage{amssymb}\usepackage{amsbsy}\usepackage{mathrsfs}\usepackage{upgreek}\setlength{\oddsidemargin}{-69pt}\begin{document}$$\pi _s$$\end{document}
. Since
\documentclass[12pt]{minimal}\usepackage{amsmath}\usepackage{wasysym}\usepackage{amsfonts}\usepackage{amssymb}\usepackage{amsbsy}\usepackage{mathrsfs}\usepackage{upgreek}\setlength{\oddsidemargin}{-69pt}\begin{document}$$\pi _s$$\end{document}
 \documentclass[12pt]{minimal}\usepackage{amsmath}\usepackage{wasysym}\usepackage{amsfonts}\usepackage{amssymb}\usepackage{amsbsy}\usepackage{mathrsfs}\usepackage{upgreek}\setlength{\oddsidemargin}{-69pt}\begin{document}$$=$$\end{document}
 \documentclass[12pt]{minimal}\usepackage{amsmath}\usepackage{wasysym}\usepackage{amsfonts}\usepackage{amssymb}\usepackage{amsbsy}\usepackage{mathrsfs}\usepackage{upgreek}\setlength{\oddsidemargin}{-69pt}\begin{document}$$(\lambda +p-1)/(2p-1)$$\end{document}
 (p
\documentclass[12pt]{minimal}\usepackage{amsmath}\usepackage{wasysym}\usepackage{amsfonts}\usepackage{amssymb}\usepackage{amsbsy}\usepackage{mathrsfs}\usepackage{upgreek}\setlength{\oddsidemargin}{-69pt}\begin{document}$$\ne $$\end{document}
(p
\documentclass[12pt]{minimal}\usepackage{amsmath}\usepackage{wasysym}\usepackage{amsfonts}\usepackage{amssymb}\usepackage{amsbsy}\usepackage{mathrsfs}\usepackage{upgreek}\setlength{\oddsidemargin}{-69pt}\begin{document}$$\ne $$\end{document}
 0.5), the MLE of
\documentclass[12pt]{minimal}\usepackage{amsmath}\usepackage{wasysym}\usepackage{amsfonts}\usepackage{amssymb}\usepackage{amsbsy}\usepackage{mathrsfs}\usepackage{upgreek}\setlength{\oddsidemargin}{-69pt}\begin{document}$$\pi _s$$\end{document}
0.5), the MLE of
\documentclass[12pt]{minimal}\usepackage{amsmath}\usepackage{wasysym}\usepackage{amsfonts}\usepackage{amssymb}\usepackage{amsbsy}\usepackage{mathrsfs}\usepackage{upgreek}\setlength{\oddsidemargin}{-69pt}\begin{document}$$\pi _s$$\end{document}
 is given by
\documentclass[12pt]{minimal}\usepackage{amsmath}\usepackage{wasysym}\usepackage{amsfonts}\usepackage{amssymb}\usepackage{amsbsy}\usepackage{mathrsfs}\usepackage{upgreek}\setlength{\oddsidemargin}{-69pt}\begin{document}$$\hat{\pi }_{s, WM}$$\end{document}
is given by
\documentclass[12pt]{minimal}\usepackage{amsmath}\usepackage{wasysym}\usepackage{amsfonts}\usepackage{amssymb}\usepackage{amsbsy}\usepackage{mathrsfs}\usepackage{upgreek}\setlength{\oddsidemargin}{-69pt}\begin{document}$$\hat{\pi }_{s, WM}$$\end{document}
 \documentclass[12pt]{minimal}\usepackage{amsmath}\usepackage{wasysym}\usepackage{amsfonts}\usepackage{amssymb}\usepackage{amsbsy}\usepackage{mathrsfs}\usepackage{upgreek}\setlength{\oddsidemargin}{-69pt}\begin{document}$$=$$\end{document}
 \documentclass[12pt]{minimal}\usepackage{amsmath}\usepackage{wasysym}\usepackage{amsfonts}\usepackage{amssymb}\usepackage{amsbsy}\usepackage{mathrsfs}\usepackage{upgreek}\setlength{\oddsidemargin}{-69pt}\begin{document}$$(\hat{\lambda }+p-1)/(2p-1)$$\end{document}
 . Therefore, the variance of
\documentclass[12pt]{minimal}\usepackage{amsmath}\usepackage{wasysym}\usepackage{amsfonts}\usepackage{amssymb}\usepackage{amsbsy}\usepackage{mathrsfs}\usepackage{upgreek}\setlength{\oddsidemargin}{-69pt}\begin{document}$$\hat{\pi }_s$$\end{document}
. Therefore, the variance of
\documentclass[12pt]{minimal}\usepackage{amsmath}\usepackage{wasysym}\usepackage{amsfonts}\usepackage{amssymb}\usepackage{amsbsy}\usepackage{mathrsfs}\usepackage{upgreek}\setlength{\oddsidemargin}{-69pt}\begin{document}$$\hat{\pi }_s$$\end{document}
 is given by

As a result, the
\documentclass[12pt]{minimal}\usepackage{amsmath}\usepackage{wasysym}\usepackage{amsfonts}\usepackage{amssymb}\usepackage{amsbsy}\usepackage{mathrsfs}\usepackage{upgreek}\setlength{\oddsidemargin}{-69pt}\begin{document}$$(1-\alpha )100\%$$\end{document}
 Wald confidence interval (CI) for
\documentclass[12pt]{minimal}\usepackage{amsmath}\usepackage{wasysym}\usepackage{amsfonts}\usepackage{amssymb}\usepackage{amsbsy}\usepackage{mathrsfs}\usepackage{upgreek}\setlength{\oddsidemargin}{-69pt}\begin{document}$$\pi _s$$\end{document}
Wald confidence interval (CI) for
\documentclass[12pt]{minimal}\usepackage{amsmath}\usepackage{wasysym}\usepackage{amsfonts}\usepackage{amssymb}\usepackage{amsbsy}\usepackage{mathrsfs}\usepackage{upgreek}\setlength{\oddsidemargin}{-69pt}\begin{document}$$\pi _s$$\end{document}
 is given by

where
\documentclass[12pt]{minimal}\usepackage{amsmath}\usepackage{wasysym}\usepackage{amsfonts}\usepackage{amssymb}\usepackage{amsbsy}\usepackage{mathrsfs}\usepackage{upgreek}\setlength{\oddsidemargin}{-69pt}\begin{document}$$z_{\alpha /2}$$\end{document}
 is the
\documentclass[12pt]{minimal}\usepackage{amsmath}\usepackage{wasysym}\usepackage{amsfonts}\usepackage{amssymb}\usepackage{amsbsy}\usepackage{mathrsfs}\usepackage{upgreek}\setlength{\oddsidemargin}{-69pt}\begin{document}$$1 -\alpha /2$$\end{document}
is the
\documentclass[12pt]{minimal}\usepackage{amsmath}\usepackage{wasysym}\usepackage{amsfonts}\usepackage{amssymb}\usepackage{amsbsy}\usepackage{mathrsfs}\usepackage{upgreek}\setlength{\oddsidemargin}{-69pt}\begin{document}$$1 -\alpha /2$$\end{document}
 quantile of the standard normal distribution. As shown in Newcombe (Reference Newcombe1998) and Agresti and Coull (Reference Agresti and Coull1998), a confidence interval based on Wilson method performs very well compared to the Wald interval, when sample size is not large. Therefore, we also apply the Wilson (Reference Wilson1927) method to construct a
\documentclass[12pt]{minimal}\usepackage{amsmath}\usepackage{wasysym}\usepackage{amsfonts}\usepackage{amssymb}\usepackage{amsbsy}\usepackage{mathrsfs}\usepackage{upgreek}\setlength{\oddsidemargin}{-69pt}\begin{document}$$(1-\alpha )100\%$$\end{document}
quantile of the standard normal distribution. As shown in Newcombe (Reference Newcombe1998) and Agresti and Coull (Reference Agresti and Coull1998), a confidence interval based on Wilson method performs very well compared to the Wald interval, when sample size is not large. Therefore, we also apply the Wilson (Reference Wilson1927) method to construct a
\documentclass[12pt]{minimal}\usepackage{amsmath}\usepackage{wasysym}\usepackage{amsfonts}\usepackage{amssymb}\usepackage{amsbsy}\usepackage{mathrsfs}\usepackage{upgreek}\setlength{\oddsidemargin}{-69pt}\begin{document}$$(1-\alpha )100\%$$\end{document}
 confidence interval for
\documentclass[12pt]{minimal}\usepackage{amsmath}\usepackage{wasysym}\usepackage{amsfonts}\usepackage{amssymb}\usepackage{amsbsy}\usepackage{mathrsfs}\usepackage{upgreek}\setlength{\oddsidemargin}{-69pt}\begin{document}$$\pi _s$$\end{document}
confidence interval for
\documentclass[12pt]{minimal}\usepackage{amsmath}\usepackage{wasysym}\usepackage{amsfonts}\usepackage{amssymb}\usepackage{amsbsy}\usepackage{mathrsfs}\usepackage{upgreek}\setlength{\oddsidemargin}{-69pt}\begin{document}$$\pi _s$$\end{document}
 as
as

where

1.1.2. Sample Size Formula Based on Wald Confidence Interval
\documentclass[12pt]{minimal}\usepackage{amsmath}\usepackage{wasysym}\usepackage{amsfonts}\usepackage{amssymb}\usepackage{amsbsy}\usepackage{mathrsfs}\usepackage{upgreek}\setlength{\oddsidemargin}{-69pt}\begin{document}$${{\varvec{[n_{WM, W}}}}$$\end{document}
 ,
\documentclass[12pt]{minimal}\usepackage{amsmath}\usepackage{wasysym}\usepackage{amsfonts}\usepackage{amssymb}\usepackage{amsbsy}\usepackage{mathrsfs}\usepackage{upgreek}\setlength{\oddsidemargin}{-69pt}\begin{document}$${{\varvec{n_{WM, W, 0.5}]}}}$$\end{document}
,
\documentclass[12pt]{minimal}\usepackage{amsmath}\usepackage{wasysym}\usepackage{amsfonts}\usepackage{amssymb}\usepackage{amsbsy}\usepackage{mathrsfs}\usepackage{upgreek}\setlength{\oddsidemargin}{-69pt}\begin{document}$${{\varvec{n_{WM, W, 0.5}]}}}$$\end{document}


The half width of the
\documentclass[12pt]{minimal}\usepackage{amsmath}\usepackage{wasysym}\usepackage{amsfonts}\usepackage{amssymb}\usepackage{amsbsy}\usepackage{mathrsfs}\usepackage{upgreek}\setlength{\oddsidemargin}{-69pt}\begin{document}$$(1-\alpha )100\%$$\end{document}
 Wald CI for
\documentclass[12pt]{minimal}\usepackage{amsmath}\usepackage{wasysym}\usepackage{amsfonts}\usepackage{amssymb}\usepackage{amsbsy}\usepackage{mathrsfs}\usepackage{upgreek}\setlength{\oddsidemargin}{-69pt}\begin{document}$$\pi _s$$\end{document}
Wald CI for
\documentclass[12pt]{minimal}\usepackage{amsmath}\usepackage{wasysym}\usepackage{amsfonts}\usepackage{amssymb}\usepackage{amsbsy}\usepackage{mathrsfs}\usepackage{upgreek}\setlength{\oddsidemargin}{-69pt}\begin{document}$$\pi _s$$\end{document}
 is given by

Here, we control the half width no larger than
\documentclass[12pt]{minimal}\usepackage{amsmath}\usepackage{wasysym}\usepackage{amsfonts}\usepackage{amssymb}\usepackage{amsbsy}\usepackage{mathrsfs}\usepackage{upgreek}\setlength{\oddsidemargin}{-69pt}\begin{document}$$\omega $$\end{document}
 with probability
\documentclass[12pt]{minimal}\usepackage{amsmath}\usepackage{wasysym}\usepackage{amsfonts}\usepackage{amssymb}\usepackage{amsbsy}\usepackage{mathrsfs}\usepackage{upgreek}\setlength{\oddsidemargin}{-69pt}\begin{document}$$1-\beta $$\end{document}
with probability
\documentclass[12pt]{minimal}\usepackage{amsmath}\usepackage{wasysym}\usepackage{amsfonts}\usepackage{amssymb}\usepackage{amsbsy}\usepackage{mathrsfs}\usepackage{upgreek}\setlength{\oddsidemargin}{-69pt}\begin{document}$$1-\beta $$\end{document}
 . That is,

or equivalently

According to the delta method, it is easily shown that

If we let Z
\documentclass[12pt]{minimal}\usepackage{amsmath}\usepackage{wasysym}\usepackage{amsfonts}\usepackage{amssymb}\usepackage{amsbsy}\usepackage{mathrsfs}\usepackage{upgreek}\setlength{\oddsidemargin}{-69pt}\begin{document}$$=$$\end{document}
 \documentclass[12pt]{minimal}\usepackage{amsmath}\usepackage{wasysym}\usepackage{amsfonts}\usepackage{amssymb}\usepackage{amsbsy}\usepackage{mathrsfs}\usepackage{upgreek}\setlength{\oddsidemargin}{-69pt}\begin{document}$$\frac{\sqrt{\hat{\lambda }(1-\hat{\lambda })}-\sqrt{\lambda (1-\lambda )}}{|1-2\lambda |/(2\sqrt{n})}$$\end{document}
 , then we have

Therefore, the desired sample size n satisfies the following equation:

where
\documentclass[12pt]{minimal}\usepackage{amsmath}\usepackage{wasysym}\usepackage{amsfonts}\usepackage{amssymb}\usepackage{amsbsy}\usepackage{mathrsfs}\usepackage{upgreek}\setlength{\oddsidemargin}{-69pt}\begin{document}$$z_\beta $$\end{document}
 is the
\documentclass[12pt]{minimal}\usepackage{amsmath}\usepackage{wasysym}\usepackage{amsfonts}\usepackage{amssymb}\usepackage{amsbsy}\usepackage{mathrsfs}\usepackage{upgreek}\setlength{\oddsidemargin}{-69pt}\begin{document}$$1-\beta $$\end{document}
is the
\documentclass[12pt]{minimal}\usepackage{amsmath}\usepackage{wasysym}\usepackage{amsfonts}\usepackage{amssymb}\usepackage{amsbsy}\usepackage{mathrsfs}\usepackage{upgreek}\setlength{\oddsidemargin}{-69pt}\begin{document}$$1-\beta $$\end{document}
 quantile of a standard normal distribution.
Solving the above equation yields

In particular, when
\documentclass[12pt]{minimal}\usepackage{amsmath}\usepackage{wasysym}\usepackage{amsfonts}\usepackage{amssymb}\usepackage{amsbsy}\usepackage{mathrsfs}\usepackage{upgreek}\setlength{\oddsidemargin}{-69pt}\begin{document}$$\beta $$\end{document}
 \documentclass[12pt]{minimal}\usepackage{amsmath}\usepackage{wasysym}\usepackage{amsfonts}\usepackage{amssymb}\usepackage{amsbsy}\usepackage{mathrsfs}\usepackage{upgreek}\setlength{\oddsidemargin}{-69pt}\begin{document}$$=$$\end{document}
 0.5 the conventional sample size is given by

Given the values of n, p and
\documentclass[12pt]{minimal}\usepackage{amsmath}\usepackage{wasysym}\usepackage{amsfonts}\usepackage{amssymb}\usepackage{amsbsy}\usepackage{mathrsfs}\usepackage{upgreek}\setlength{\oddsidemargin}{-69pt}\begin{document}$$\pi _s$$\end{document}
 , the assurance probability can be obtained by

where
\documentclass[12pt]{minimal}\usepackage{amsmath}\usepackage{wasysym}\usepackage{amsfonts}\usepackage{amssymb}\usepackage{amsbsy}\usepackage{mathrsfs}\usepackage{upgreek}\setlength{\oddsidemargin}{-69pt}\begin{document}$$\Phi (\cdot )$$\end{document}
 is the distribution function of the standard normal random variable.
1.1.3. Sample Size Formula Based on Wilson Confidence Interval
\documentclass[12pt]{minimal}\usepackage{amsmath}\usepackage{wasysym}\usepackage{amsfonts}\usepackage{amssymb}\usepackage{amsbsy}\usepackage{mathrsfs}\usepackage{upgreek}\setlength{\oddsidemargin}{-69pt}\begin{document}$${{\varvec{[n_{WM, Wi}}}}$$\end{document}
,
\documentclass[12pt]{minimal}\usepackage{amsmath}\usepackage{wasysym}\usepackage{amsfonts}\usepackage{amssymb}\usepackage{amsbsy}\usepackage{mathrsfs}\usepackage{upgreek}\setlength{\oddsidemargin}{-69pt}\begin{document}$${{\varvec{n_{WM, Wi, 0.5}]}}}$$\end{document}


Similarly, in order to control the half width of the Wilson CI to be no larger than
\documentclass[12pt]{minimal}\usepackage{amsmath}\usepackage{wasysym}\usepackage{amsfonts}\usepackage{amssymb}\usepackage{amsbsy}\usepackage{mathrsfs}\usepackage{upgreek}\setlength{\oddsidemargin}{-69pt}\begin{document}$$\omega $$\end{document}
 with probability
\documentclass[12pt]{minimal}\usepackage{amsmath}\usepackage{wasysym}\usepackage{amsfonts}\usepackage{amssymb}\usepackage{amsbsy}\usepackage{mathrsfs}\usepackage{upgreek}\setlength{\oddsidemargin}{-69pt}\begin{document}$$1-\beta $$\end{document}
with probability
\documentclass[12pt]{minimal}\usepackage{amsmath}\usepackage{wasysym}\usepackage{amsfonts}\usepackage{amssymb}\usepackage{amsbsy}\usepackage{mathrsfs}\usepackage{upgreek}\setlength{\oddsidemargin}{-69pt}\begin{document}$$1-\beta $$\end{document}
 , the sample size estimate needs to satisfy

i.e.,

According to the delta method, the asymptotic distribution of
\documentclass[12pt]{minimal}\usepackage{amsmath}\usepackage{wasysym}\usepackage{amsfonts}\usepackage{amssymb}\usepackage{amsbsy}\usepackage{mathrsfs}\usepackage{upgreek}\setlength{\oddsidemargin}{-69pt}\begin{document}$$\hat{\lambda }(1-\hat{\lambda })$$\end{document}
 is
is

Therefore,

i.e., the approximate sample size (denoted as
\documentclass[12pt]{minimal}\usepackage{amsmath}\usepackage{wasysym}\usepackage{amsfonts}\usepackage{amssymb}\usepackage{amsbsy}\usepackage{mathrsfs}\usepackage{upgreek}\setlength{\oddsidemargin}{-69pt}\begin{document}$${{\varvec{n_{WM, Wi}}}}$$\end{document}
 ) can be obtained by solving the following equation:

where

The eigenvalue methods for finding roots of polynomials can be used to obtain the sample size estimate, based on Wilson method by solving Eq. (6) with respect to
\documentclass[12pt]{minimal}\usepackage{amsmath}\usepackage{wasysym}\usepackage{amsfonts}\usepackage{amssymb}\usepackage{amsbsy}\usepackage{mathrsfs}\usepackage{upgreek}\setlength{\oddsidemargin}{-69pt}\begin{document}$$n+z_{\alpha /2}^2$$\end{document}
 . If
\documentclass[12pt]{minimal}\usepackage{amsmath}\usepackage{wasysym}\usepackage{amsfonts}\usepackage{amssymb}\usepackage{amsbsy}\usepackage{mathrsfs}\usepackage{upgreek}\setlength{\oddsidemargin}{-69pt}\begin{document}$$m_\mathrm{max}$$\end{document}
. If
\documentclass[12pt]{minimal}\usepackage{amsmath}\usepackage{wasysym}\usepackage{amsfonts}\usepackage{amssymb}\usepackage{amsbsy}\usepackage{mathrsfs}\usepackage{upgreek}\setlength{\oddsidemargin}{-69pt}\begin{document}$$m_\mathrm{max}$$\end{document}
 is the maximum real root of Eq. (6), then the desired sample size
\documentclass[12pt]{minimal}\usepackage{amsmath}\usepackage{wasysym}\usepackage{amsfonts}\usepackage{amssymb}\usepackage{amsbsy}\usepackage{mathrsfs}\usepackage{upgreek}\setlength{\oddsidemargin}{-69pt}\begin{document}$${{\varvec{n_{WM, Wi}}}}$$\end{document}
is the maximum real root of Eq. (6), then the desired sample size
\documentclass[12pt]{minimal}\usepackage{amsmath}\usepackage{wasysym}\usepackage{amsfonts}\usepackage{amssymb}\usepackage{amsbsy}\usepackage{mathrsfs}\usepackage{upgreek}\setlength{\oddsidemargin}{-69pt}\begin{document}$${{\varvec{n_{WM, Wi}}}}$$\end{document}
 is the minimum integer that is not smaller than
\documentclass[12pt]{minimal}\usepackage{amsmath}\usepackage{wasysym}\usepackage{amsfonts}\usepackage{amssymb}\usepackage{amsbsy}\usepackage{mathrsfs}\usepackage{upgreek}\setlength{\oddsidemargin}{-69pt}\begin{document}$$m_\mathrm{max}-z_{\alpha /2}^2$$\end{document}
is the minimum integer that is not smaller than
\documentclass[12pt]{minimal}\usepackage{amsmath}\usepackage{wasysym}\usepackage{amsfonts}\usepackage{amssymb}\usepackage{amsbsy}\usepackage{mathrsfs}\usepackage{upgreek}\setlength{\oddsidemargin}{-69pt}\begin{document}$$m_\mathrm{max}-z_{\alpha /2}^2$$\end{document}
 .
.
In particular, when
\documentclass[12pt]{minimal}\usepackage{amsmath}\usepackage{wasysym}\usepackage{amsfonts}\usepackage{amssymb}\usepackage{amsbsy}\usepackage{mathrsfs}\usepackage{upgreek}\setlength{\oddsidemargin}{-69pt}\begin{document}$$\beta $$\end{document}
 \documentclass[12pt]{minimal}\usepackage{amsmath}\usepackage{wasysym}\usepackage{amsfonts}\usepackage{amssymb}\usepackage{amsbsy}\usepackage{mathrsfs}\usepackage{upgreek}\setlength{\oddsidemargin}{-69pt}\begin{document}$$=$$\end{document}
 0.5, the approximate sample size n is given by

Given the values of n, p and
\documentclass[12pt]{minimal}\usepackage{amsmath}\usepackage{wasysym}\usepackage{amsfonts}\usepackage{amssymb}\usepackage{amsbsy}\usepackage{mathrsfs}\usepackage{upgreek}\setlength{\oddsidemargin}{-69pt}\begin{document}$$\pi _s$$\end{document}
 , the assurance probability can be obtained by

1.2. Sample Size Estimation Under Unrelated Question Model
1.2.1. Confidence Intervals Under Unrelated Question Model
It should be noted that the unrelated question model (UQM) simply replaces question A
\documentclass[12pt]{minimal}\usepackage{amsmath}\usepackage{wasysym}\usepackage{amsfonts}\usepackage{amssymb}\usepackage{amsbsy}\usepackage{mathrsfs}\usepackage{upgreek}\setlength{\oddsidemargin}{-69pt}\begin{document}$$^c$$\end{document}
 in Warner’s model with a neutral question N (see, Greenberg et al., Reference Greenberg, Abul-Ela, Simmons and Horvitz1969). Similar to Warner’s model, a randomizing device is used to impel a respondent to answer A with a probability of p or the neutral question N with a probability of
\documentclass[12pt]{minimal}\usepackage{amsmath}\usepackage{wasysym}\usepackage{amsfonts}\usepackage{amssymb}\usepackage{amsbsy}\usepackage{mathrsfs}\usepackage{upgreek}\setlength{\oddsidemargin}{-69pt}\begin{document}$$1 - p$$\end{document}
in Warner’s model with a neutral question N (see, Greenberg et al., Reference Greenberg, Abul-Ela, Simmons and Horvitz1969). Similar to Warner’s model, a randomizing device is used to impel a respondent to answer A with a probability of p or the neutral question N with a probability of
\documentclass[12pt]{minimal}\usepackage{amsmath}\usepackage{wasysym}\usepackage{amsfonts}\usepackage{amssymb}\usepackage{amsbsy}\usepackage{mathrsfs}\usepackage{upgreek}\setlength{\oddsidemargin}{-69pt}\begin{document}$$1 - p$$\end{document}
 . Let the probability of responding "yes" to statement N be
\documentclass[12pt]{minimal}\usepackage{amsmath}\usepackage{wasysym}\usepackage{amsfonts}\usepackage{amssymb}\usepackage{amsbsy}\usepackage{mathrsfs}\usepackage{upgreek}\setlength{\oddsidemargin}{-69pt}\begin{document}$$\pi _N$$\end{document}
. Let the probability of responding "yes" to statement N be
\documentclass[12pt]{minimal}\usepackage{amsmath}\usepackage{wasysym}\usepackage{amsfonts}\usepackage{amssymb}\usepackage{amsbsy}\usepackage{mathrsfs}\usepackage{upgreek}\setlength{\oddsidemargin}{-69pt}\begin{document}$$\pi _N$$\end{document}
 . If
\documentclass[12pt]{minimal}\usepackage{amsmath}\usepackage{wasysym}\usepackage{amsfonts}\usepackage{amssymb}\usepackage{amsbsy}\usepackage{mathrsfs}\usepackage{upgreek}\setlength{\oddsidemargin}{-69pt}\begin{document}$$\lambda $$\end{document}
. If
\documentclass[12pt]{minimal}\usepackage{amsmath}\usepackage{wasysym}\usepackage{amsfonts}\usepackage{amssymb}\usepackage{amsbsy}\usepackage{mathrsfs}\usepackage{upgreek}\setlength{\oddsidemargin}{-69pt}\begin{document}$$\lambda $$\end{document}
 \documentclass[12pt]{minimal}\usepackage{amsmath}\usepackage{wasysym}\usepackage{amsfonts}\usepackage{amssymb}\usepackage{amsbsy}\usepackage{mathrsfs}\usepackage{upgreek}\setlength{\oddsidemargin}{-69pt}\begin{document}$$=$$\end{document}
 \documentclass[12pt]{minimal}\usepackage{amsmath}\usepackage{wasysym}\usepackage{amsfonts}\usepackage{amssymb}\usepackage{amsbsy}\usepackage{mathrsfs}\usepackage{upgreek}\setlength{\oddsidemargin}{-69pt}\begin{document}$$p\pi _s+(1-p)\pi _N$$\end{document}
 , then x follows binomial distribution B(n,
\documentclass[12pt]{minimal}\usepackage{amsmath}\usepackage{wasysym}\usepackage{amsfonts}\usepackage{amssymb}\usepackage{amsbsy}\usepackage{mathrsfs}\usepackage{upgreek}\setlength{\oddsidemargin}{-69pt}\begin{document}$$\lambda $$\end{document}
, then x follows binomial distribution B(n,
\documentclass[12pt]{minimal}\usepackage{amsmath}\usepackage{wasysym}\usepackage{amsfonts}\usepackage{amssymb}\usepackage{amsbsy}\usepackage{mathrsfs}\usepackage{upgreek}\setlength{\oddsidemargin}{-69pt}\begin{document}$$\lambda $$\end{document}
 ). Again, the MLE of
\documentclass[12pt]{minimal}\usepackage{amsmath}\usepackage{wasysym}\usepackage{amsfonts}\usepackage{amssymb}\usepackage{amsbsy}\usepackage{mathrsfs}\usepackage{upgreek}\setlength{\oddsidemargin}{-69pt}\begin{document}$$\lambda $$\end{document}
). Again, the MLE of
\documentclass[12pt]{minimal}\usepackage{amsmath}\usepackage{wasysym}\usepackage{amsfonts}\usepackage{amssymb}\usepackage{amsbsy}\usepackage{mathrsfs}\usepackage{upgreek}\setlength{\oddsidemargin}{-69pt}\begin{document}$$\lambda $$\end{document}
 is given by
\documentclass[12pt]{minimal}\usepackage{amsmath}\usepackage{wasysym}\usepackage{amsfonts}\usepackage{amssymb}\usepackage{amsbsy}\usepackage{mathrsfs}\usepackage{upgreek}\setlength{\oddsidemargin}{-69pt}\begin{document}$$\hat{\lambda }$$\end{document}
is given by
\documentclass[12pt]{minimal}\usepackage{amsmath}\usepackage{wasysym}\usepackage{amsfonts}\usepackage{amssymb}\usepackage{amsbsy}\usepackage{mathrsfs}\usepackage{upgreek}\setlength{\oddsidemargin}{-69pt}\begin{document}$$\hat{\lambda }$$\end{document}
 \documentclass[12pt]{minimal}\usepackage{amsmath}\usepackage{wasysym}\usepackage{amsfonts}\usepackage{amssymb}\usepackage{amsbsy}\usepackage{mathrsfs}\usepackage{upgreek}\setlength{\oddsidemargin}{-69pt}\begin{document}$$=$$\end{document}
 x/n, and the expectation and variance of
\documentclass[12pt]{minimal}\usepackage{amsmath}\usepackage{wasysym}\usepackage{amsfonts}\usepackage{amssymb}\usepackage{amsbsy}\usepackage{mathrsfs}\usepackage{upgreek}\setlength{\oddsidemargin}{-69pt}\begin{document}$$\hat{\lambda }$$\end{document}
x/n, and the expectation and variance of
\documentclass[12pt]{minimal}\usepackage{amsmath}\usepackage{wasysym}\usepackage{amsfonts}\usepackage{amssymb}\usepackage{amsbsy}\usepackage{mathrsfs}\usepackage{upgreek}\setlength{\oddsidemargin}{-69pt}\begin{document}$$\hat{\lambda }$$\end{document}
 are, respectively, E(
\documentclass[12pt]{minimal}\usepackage{amsmath}\usepackage{wasysym}\usepackage{amsfonts}\usepackage{amssymb}\usepackage{amsbsy}\usepackage{mathrsfs}\usepackage{upgreek}\setlength{\oddsidemargin}{-69pt}\begin{document}$$\hat{\lambda }$$\end{document}
are, respectively, E(
\documentclass[12pt]{minimal}\usepackage{amsmath}\usepackage{wasysym}\usepackage{amsfonts}\usepackage{amssymb}\usepackage{amsbsy}\usepackage{mathrsfs}\usepackage{upgreek}\setlength{\oddsidemargin}{-69pt}\begin{document}$$\hat{\lambda }$$\end{document}
 )
\documentclass[12pt]{minimal}\usepackage{amsmath}\usepackage{wasysym}\usepackage{amsfonts}\usepackage{amssymb}\usepackage{amsbsy}\usepackage{mathrsfs}\usepackage{upgreek}\setlength{\oddsidemargin}{-69pt}\begin{document}$$=$$\end{document}
)
\documentclass[12pt]{minimal}\usepackage{amsmath}\usepackage{wasysym}\usepackage{amsfonts}\usepackage{amssymb}\usepackage{amsbsy}\usepackage{mathrsfs}\usepackage{upgreek}\setlength{\oddsidemargin}{-69pt}\begin{document}$$=$$\end{document}
 \documentclass[12pt]{minimal}\usepackage{amsmath}\usepackage{wasysym}\usepackage{amsfonts}\usepackage{amssymb}\usepackage{amsbsy}\usepackage{mathrsfs}\usepackage{upgreek}\setlength{\oddsidemargin}{-69pt}\begin{document}$$\lambda $$\end{document}
 and Var(
\documentclass[12pt]{minimal}\usepackage{amsmath}\usepackage{wasysym}\usepackage{amsfonts}\usepackage{amssymb}\usepackage{amsbsy}\usepackage{mathrsfs}\usepackage{upgreek}\setlength{\oddsidemargin}{-69pt}\begin{document}$$\hat{\lambda }$$\end{document}
and Var(
\documentclass[12pt]{minimal}\usepackage{amsmath}\usepackage{wasysym}\usepackage{amsfonts}\usepackage{amssymb}\usepackage{amsbsy}\usepackage{mathrsfs}\usepackage{upgreek}\setlength{\oddsidemargin}{-69pt}\begin{document}$$\hat{\lambda }$$\end{document}
 )
\documentclass[12pt]{minimal}\usepackage{amsmath}\usepackage{wasysym}\usepackage{amsfonts}\usepackage{amssymb}\usepackage{amsbsy}\usepackage{mathrsfs}\usepackage{upgreek}\setlength{\oddsidemargin}{-69pt}\begin{document}$$=$$\end{document}
)
\documentclass[12pt]{minimal}\usepackage{amsmath}\usepackage{wasysym}\usepackage{amsfonts}\usepackage{amssymb}\usepackage{amsbsy}\usepackage{mathrsfs}\usepackage{upgreek}\setlength{\oddsidemargin}{-69pt}\begin{document}$$=$$\end{document}
 \documentclass[12pt]{minimal}\usepackage{amsmath}\usepackage{wasysym}\usepackage{amsfonts}\usepackage{amssymb}\usepackage{amsbsy}\usepackage{mathrsfs}\usepackage{upgreek}\setlength{\oddsidemargin}{-69pt}\begin{document}$$\lambda (1-\lambda )/n$$\end{document}
 . Therefore, the MLE of
\documentclass[12pt]{minimal}\usepackage{amsmath}\usepackage{wasysym}\usepackage{amsfonts}\usepackage{amssymb}\usepackage{amsbsy}\usepackage{mathrsfs}\usepackage{upgreek}\setlength{\oddsidemargin}{-69pt}\begin{document}$$\pi _{s, UQM}$$\end{document}
. Therefore, the MLE of
\documentclass[12pt]{minimal}\usepackage{amsmath}\usepackage{wasysym}\usepackage{amsfonts}\usepackage{amssymb}\usepackage{amsbsy}\usepackage{mathrsfs}\usepackage{upgreek}\setlength{\oddsidemargin}{-69pt}\begin{document}$$\pi _{s, UQM}$$\end{document}
 is
\documentclass[12pt]{minimal}\usepackage{amsmath}\usepackage{wasysym}\usepackage{amsfonts}\usepackage{amssymb}\usepackage{amsbsy}\usepackage{mathrsfs}\usepackage{upgreek}\setlength{\oddsidemargin}{-69pt}\begin{document}$$\hat{\pi }_{s, UQM}$$\end{document}
is
\documentclass[12pt]{minimal}\usepackage{amsmath}\usepackage{wasysym}\usepackage{amsfonts}\usepackage{amssymb}\usepackage{amsbsy}\usepackage{mathrsfs}\usepackage{upgreek}\setlength{\oddsidemargin}{-69pt}\begin{document}$$\hat{\pi }_{s, UQM}$$\end{document}
 \documentclass[12pt]{minimal}\usepackage{amsmath}\usepackage{wasysym}\usepackage{amsfonts}\usepackage{amssymb}\usepackage{amsbsy}\usepackage{mathrsfs}\usepackage{upgreek}\setlength{\oddsidemargin}{-69pt}\begin{document}$$=$$\end{document}
 \documentclass[12pt]{minimal}\usepackage{amsmath}\usepackage{wasysym}\usepackage{amsfonts}\usepackage{amssymb}\usepackage{amsbsy}\usepackage{mathrsfs}\usepackage{upgreek}\setlength{\oddsidemargin}{-69pt}\begin{document}$$(\hat{\lambda }-(1-p)\pi _N)/p$$\end{document}
 , E(
\documentclass[12pt]{minimal}\usepackage{amsmath}\usepackage{wasysym}\usepackage{amsfonts}\usepackage{amssymb}\usepackage{amsbsy}\usepackage{mathrsfs}\usepackage{upgreek}\setlength{\oddsidemargin}{-69pt}\begin{document}$$\hat{\pi }_{s, UQM}$$\end{document}
, E(
\documentclass[12pt]{minimal}\usepackage{amsmath}\usepackage{wasysym}\usepackage{amsfonts}\usepackage{amssymb}\usepackage{amsbsy}\usepackage{mathrsfs}\usepackage{upgreek}\setlength{\oddsidemargin}{-69pt}\begin{document}$$\hat{\pi }_{s, UQM}$$\end{document}
 )
\documentclass[12pt]{minimal}\usepackage{amsmath}\usepackage{wasysym}\usepackage{amsfonts}\usepackage{amssymb}\usepackage{amsbsy}\usepackage{mathrsfs}\usepackage{upgreek}\setlength{\oddsidemargin}{-69pt}\begin{document}$$=$$\end{document}
)
\documentclass[12pt]{minimal}\usepackage{amsmath}\usepackage{wasysym}\usepackage{amsfonts}\usepackage{amssymb}\usepackage{amsbsy}\usepackage{mathrsfs}\usepackage{upgreek}\setlength{\oddsidemargin}{-69pt}\begin{document}$$=$$\end{document}
 \documentclass[12pt]{minimal}\usepackage{amsmath}\usepackage{wasysym}\usepackage{amsfonts}\usepackage{amssymb}\usepackage{amsbsy}\usepackage{mathrsfs}\usepackage{upgreek}\setlength{\oddsidemargin}{-69pt}\begin{document}$$\pi _s$$\end{document}
 and Var(
\documentclass[12pt]{minimal}\usepackage{amsmath}\usepackage{wasysym}\usepackage{amsfonts}\usepackage{amssymb}\usepackage{amsbsy}\usepackage{mathrsfs}\usepackage{upgreek}\setlength{\oddsidemargin}{-69pt}\begin{document}$$\hat{\pi }_{s, UQM}$$\end{document}
and Var(
\documentclass[12pt]{minimal}\usepackage{amsmath}\usepackage{wasysym}\usepackage{amsfonts}\usepackage{amssymb}\usepackage{amsbsy}\usepackage{mathrsfs}\usepackage{upgreek}\setlength{\oddsidemargin}{-69pt}\begin{document}$$\hat{\pi }_{s, UQM}$$\end{document}
 )
\documentclass[12pt]{minimal}\usepackage{amsmath}\usepackage{wasysym}\usepackage{amsfonts}\usepackage{amssymb}\usepackage{amsbsy}\usepackage{mathrsfs}\usepackage{upgreek}\setlength{\oddsidemargin}{-69pt}\begin{document}$$=$$\end{document}
)
\documentclass[12pt]{minimal}\usepackage{amsmath}\usepackage{wasysym}\usepackage{amsfonts}\usepackage{amssymb}\usepackage{amsbsy}\usepackage{mathrsfs}\usepackage{upgreek}\setlength{\oddsidemargin}{-69pt}\begin{document}$$=$$\end{document}
 \documentclass[12pt]{minimal}\usepackage{amsmath}\usepackage{wasysym}\usepackage{amsfonts}\usepackage{amssymb}\usepackage{amsbsy}\usepackage{mathrsfs}\usepackage{upgreek}\setlength{\oddsidemargin}{-69pt}\begin{document}$$\lambda (1-\lambda )/(np^2)$$\end{document}
 .
.
The
\documentclass[12pt]{minimal}\usepackage{amsmath}\usepackage{wasysym}\usepackage{amsfonts}\usepackage{amssymb}\usepackage{amsbsy}\usepackage{mathrsfs}\usepackage{upgreek}\setlength{\oddsidemargin}{-69pt}\begin{document}$$(1-\alpha )100\%$$\end{document}
 confidence interval for
\documentclass[12pt]{minimal}\usepackage{amsmath}\usepackage{wasysym}\usepackage{amsfonts}\usepackage{amssymb}\usepackage{amsbsy}\usepackage{mathrsfs}\usepackage{upgreek}\setlength{\oddsidemargin}{-69pt}\begin{document}$$\pi _s$$\end{document}
confidence interval for
\documentclass[12pt]{minimal}\usepackage{amsmath}\usepackage{wasysym}\usepackage{amsfonts}\usepackage{amssymb}\usepackage{amsbsy}\usepackage{mathrsfs}\usepackage{upgreek}\setlength{\oddsidemargin}{-69pt}\begin{document}$$\pi _s$$\end{document}
 based on Wald method is given by

Alternatively, a
\documentclass[12pt]{minimal}\usepackage{amsmath}\usepackage{wasysym}\usepackage{amsfonts}\usepackage{amssymb}\usepackage{amsbsy}\usepackage{mathrsfs}\usepackage{upgreek}\setlength{\oddsidemargin}{-69pt}\begin{document}$$(1-\alpha )100\%$$\end{document}
 Wilson confidence interval for
\documentclass[12pt]{minimal}\usepackage{amsmath}\usepackage{wasysym}\usepackage{amsfonts}\usepackage{amssymb}\usepackage{amsbsy}\usepackage{mathrsfs}\usepackage{upgreek}\setlength{\oddsidemargin}{-69pt}\begin{document}$$\lambda $$\end{document}
Wilson confidence interval for
\documentclass[12pt]{minimal}\usepackage{amsmath}\usepackage{wasysym}\usepackage{amsfonts}\usepackage{amssymb}\usepackage{amsbsy}\usepackage{mathrsfs}\usepackage{upgreek}\setlength{\oddsidemargin}{-69pt}\begin{document}$$\lambda $$\end{document}
 is given by

Hence, the
\documentclass[12pt]{minimal}\usepackage{amsmath}\usepackage{wasysym}\usepackage{amsfonts}\usepackage{amssymb}\usepackage{amsbsy}\usepackage{mathrsfs}\usepackage{upgreek}\setlength{\oddsidemargin}{-69pt}\begin{document}$$(1-\alpha )100\%$$\end{document}
 Wilson confidence interval for
\documentclass[12pt]{minimal}\usepackage{amsmath}\usepackage{wasysym}\usepackage{amsfonts}\usepackage{amssymb}\usepackage{amsbsy}\usepackage{mathrsfs}\usepackage{upgreek}\setlength{\oddsidemargin}{-69pt}\begin{document}$$\pi _s$$\end{document}
Wilson confidence interval for
\documentclass[12pt]{minimal}\usepackage{amsmath}\usepackage{wasysym}\usepackage{amsfonts}\usepackage{amssymb}\usepackage{amsbsy}\usepackage{mathrsfs}\usepackage{upgreek}\setlength{\oddsidemargin}{-69pt}\begin{document}$$\pi _s$$\end{document}
 can be obtained as

where

and

1.2.2. Sample Size Formula Based on Wald Confidence Interval
\documentclass[12pt]{minimal}\usepackage{amsmath}\usepackage{wasysym}\usepackage{amsfonts}\usepackage{amssymb}\usepackage{amsbsy}\usepackage{mathrsfs}\usepackage{upgreek}\setlength{\oddsidemargin}{-69pt}\begin{document}$${{\varvec{[n_{UQM, W}}}}$$\end{document}
,
\documentclass[12pt]{minimal}\usepackage{amsmath}\usepackage{wasysym}\usepackage{amsfonts}\usepackage{amssymb}\usepackage{amsbsy}\usepackage{mathrsfs}\usepackage{upgreek}\setlength{\oddsidemargin}{-69pt}\begin{document}$${{\varvec{n_{UQM, W, 0.5}]}}}$$\end{document}


Again, we control the half width of the Wald CI to be no larger than
\documentclass[12pt]{minimal}\usepackage{amsmath}\usepackage{wasysym}\usepackage{amsfonts}\usepackage{amssymb}\usepackage{amsbsy}\usepackage{mathrsfs}\usepackage{upgreek}\setlength{\oddsidemargin}{-69pt}\begin{document}$$\omega $$\end{document}
 with probability
\documentclass[12pt]{minimal}\usepackage{amsmath}\usepackage{wasysym}\usepackage{amsfonts}\usepackage{amssymb}\usepackage{amsbsy}\usepackage{mathrsfs}\usepackage{upgreek}\setlength{\oddsidemargin}{-69pt}\begin{document}$$1-\beta $$\end{document}
with probability
\documentclass[12pt]{minimal}\usepackage{amsmath}\usepackage{wasysym}\usepackage{amsfonts}\usepackage{amssymb}\usepackage{amsbsy}\usepackage{mathrsfs}\usepackage{upgreek}\setlength{\oddsidemargin}{-69pt}\begin{document}$$1-\beta $$\end{document}
 . That is,

or,

It is shown that

Equation (10) becomes

Therefore,

i.e.,

By solving the above equation, we have

When
\documentclass[12pt]{minimal}\usepackage{amsmath}\usepackage{wasysym}\usepackage{amsfonts}\usepackage{amssymb}\usepackage{amsbsy}\usepackage{mathrsfs}\usepackage{upgreek}\setlength{\oddsidemargin}{-69pt}\begin{document}$$\beta $$\end{document}
 \documentclass[12pt]{minimal}\usepackage{amsmath}\usepackage{wasysym}\usepackage{amsfonts}\usepackage{amssymb}\usepackage{amsbsy}\usepackage{mathrsfs}\usepackage{upgreek}\setlength{\oddsidemargin}{-69pt}\begin{document}$$=$$\end{document}
 0.5, the approximate sample size is given by

1.2.3. Sample Size Formula Based on Wilson Confidence Interval
\documentclass[12pt]{minimal}\usepackage{amsmath}\usepackage{wasysym}\usepackage{amsfonts}\usepackage{amssymb}\usepackage{amsbsy}\usepackage{mathrsfs}\usepackage{upgreek}\setlength{\oddsidemargin}{-69pt}\begin{document}$${{\varvec{[n_{UQM, Wi}}}}$$\end{document}
,
\documentclass[12pt]{minimal}\usepackage{amsmath}\usepackage{wasysym}\usepackage{amsfonts}\usepackage{amssymb}\usepackage{amsbsy}\usepackage{mathrsfs}\usepackage{upgreek}\setlength{\oddsidemargin}{-69pt}\begin{document}$${{\varvec{n_{UQM, Wi, 0.5}]}}}$$\end{document}


To control the half width of the Wilson CI that is no larger than
\documentclass[12pt]{minimal}\usepackage{amsmath}\usepackage{wasysym}\usepackage{amsfonts}\usepackage{amssymb}\usepackage{amsbsy}\usepackage{mathrsfs}\usepackage{upgreek}\setlength{\oddsidemargin}{-69pt}\begin{document}$$\omega $$\end{document}
 with probability
\documentclass[12pt]{minimal}\usepackage{amsmath}\usepackage{wasysym}\usepackage{amsfonts}\usepackage{amssymb}\usepackage{amsbsy}\usepackage{mathrsfs}\usepackage{upgreek}\setlength{\oddsidemargin}{-69pt}\begin{document}$$1-\beta $$\end{document}
with probability
\documentclass[12pt]{minimal}\usepackage{amsmath}\usepackage{wasysym}\usepackage{amsfonts}\usepackage{amssymb}\usepackage{amsbsy}\usepackage{mathrsfs}\usepackage{upgreek}\setlength{\oddsidemargin}{-69pt}\begin{document}$$1-\beta $$\end{document}
 , the desired sample size should satisfy

i.e.,

It is thus shown that the sample size is the solution to the following equation:

where

Similarly, the eigenvalue methods can be used to find the solutions of the above equation with respect to
\documentclass[12pt]{minimal}\usepackage{amsmath}\usepackage{wasysym}\usepackage{amsfonts}\usepackage{amssymb}\usepackage{amsbsy}\usepackage{mathrsfs}\usepackage{upgreek}\setlength{\oddsidemargin}{-69pt}\begin{document}$$n+z_{\alpha /2}^2$$\end{document}
 , and the approximate sample size n is denoted as
\documentclass[12pt]{minimal}\usepackage{amsmath}\usepackage{wasysym}\usepackage{amsfonts}\usepackage{amssymb}\usepackage{amsbsy}\usepackage{mathrsfs}\usepackage{upgreek}\setlength{\oddsidemargin}{-69pt}\begin{document}$${{\varvec{n_{UQM, Wi}}}}$$\end{document}
, and the approximate sample size n is denoted as
\documentclass[12pt]{minimal}\usepackage{amsmath}\usepackage{wasysym}\usepackage{amsfonts}\usepackage{amssymb}\usepackage{amsbsy}\usepackage{mathrsfs}\usepackage{upgreek}\setlength{\oddsidemargin}{-69pt}\begin{document}$${{\varvec{n_{UQM, Wi}}}}$$\end{document}
 .
.
When
\documentclass[12pt]{minimal}\usepackage{amsmath}\usepackage{wasysym}\usepackage{amsfonts}\usepackage{amssymb}\usepackage{amsbsy}\usepackage{mathrsfs}\usepackage{upgreek}\setlength{\oddsidemargin}{-69pt}\begin{document}$$\beta $$\end{document}
 \documentclass[12pt]{minimal}\usepackage{amsmath}\usepackage{wasysym}\usepackage{amsfonts}\usepackage{amssymb}\usepackage{amsbsy}\usepackage{mathrsfs}\usepackage{upgreek}\setlength{\oddsidemargin}{-69pt}\begin{document}$$=$$\end{document}
 0.5, the formula reduces to

1.3. Sample Size Estimation Under Item Count Technique
1.3.1. Confidence Intervals Under Item Count Technique
Under the item count technique (ICT) model developed by Miller (Reference Miller1984), it was designed that the
\documentclass[12pt]{minimal}\usepackage{amsmath}\usepackage{wasysym}\usepackage{amsfonts}\usepackage{amssymb}\usepackage{amsbsy}\usepackage{mathrsfs}\usepackage{upgreek}\setlength{\oddsidemargin}{-69pt}\begin{document}$$n_c$$\end{document}
 respondents randomly assigned to the control group would receive a list of k neutral questions, while the
\documentclass[12pt]{minimal}\usepackage{amsmath}\usepackage{wasysym}\usepackage{amsfonts}\usepackage{amssymb}\usepackage{amsbsy}\usepackage{mathrsfs}\usepackage{upgreek}\setlength{\oddsidemargin}{-69pt}\begin{document}$$n_e$$\end{document}
respondents randomly assigned to the control group would receive a list of k neutral questions, while the
\documentclass[12pt]{minimal}\usepackage{amsmath}\usepackage{wasysym}\usepackage{amsfonts}\usepackage{amssymb}\usepackage{amsbsy}\usepackage{mathrsfs}\usepackage{upgreek}\setlength{\oddsidemargin}{-69pt}\begin{document}$$n_e$$\end{document}
 respondents randomly assigned to the experiment group would receive the same set of neutral questions as the control group together with the sensitive question. The probability of answering the ith neutral question with "yes" would be
\documentclass[12pt]{minimal}\usepackage{amsmath}\usepackage{wasysym}\usepackage{amsfonts}\usepackage{amssymb}\usepackage{amsbsy}\usepackage{mathrsfs}\usepackage{upgreek}\setlength{\oddsidemargin}{-69pt}\begin{document}$$\pi _i$$\end{document}
respondents randomly assigned to the experiment group would receive the same set of neutral questions as the control group together with the sensitive question. The probability of answering the ith neutral question with "yes" would be
\documentclass[12pt]{minimal}\usepackage{amsmath}\usepackage{wasysym}\usepackage{amsfonts}\usepackage{amssymb}\usepackage{amsbsy}\usepackage{mathrsfs}\usepackage{upgreek}\setlength{\oddsidemargin}{-69pt}\begin{document}$$\pi _i$$\end{document}
 (
\documentclass[12pt]{minimal}\usepackage{amsmath}\usepackage{wasysym}\usepackage{amsfonts}\usepackage{amssymb}\usepackage{amsbsy}\usepackage{mathrsfs}\usepackage{upgreek}\setlength{\oddsidemargin}{-69pt}\begin{document}$$i=1,2,\ldots ,k$$\end{document}
(
\documentclass[12pt]{minimal}\usepackage{amsmath}\usepackage{wasysym}\usepackage{amsfonts}\usepackage{amssymb}\usepackage{amsbsy}\usepackage{mathrsfs}\usepackage{upgreek}\setlength{\oddsidemargin}{-69pt}\begin{document}$$i=1,2,\ldots ,k$$\end{document}
 ). Let the expected numbers of total "yes" response of the control and experiment groups are
\documentclass[12pt]{minimal}\usepackage{amsmath}\usepackage{wasysym}\usepackage{amsfonts}\usepackage{amssymb}\usepackage{amsbsy}\usepackage{mathrsfs}\usepackage{upgreek}\setlength{\oddsidemargin}{-69pt}\begin{document}$$T_c$$\end{document}
). Let the expected numbers of total "yes" response of the control and experiment groups are
\documentclass[12pt]{minimal}\usepackage{amsmath}\usepackage{wasysym}\usepackage{amsfonts}\usepackage{amssymb}\usepackage{amsbsy}\usepackage{mathrsfs}\usepackage{upgreek}\setlength{\oddsidemargin}{-69pt}\begin{document}$$T_c$$\end{document}
 \documentclass[12pt]{minimal}\usepackage{amsmath}\usepackage{wasysym}\usepackage{amsfonts}\usepackage{amssymb}\usepackage{amsbsy}\usepackage{mathrsfs}\usepackage{upgreek}\setlength{\oddsidemargin}{-69pt}\begin{document}$$=$$\end{document}
 \documentclass[12pt]{minimal}\usepackage{amsmath}\usepackage{wasysym}\usepackage{amsfonts}\usepackage{amssymb}\usepackage{amsbsy}\usepackage{mathrsfs}\usepackage{upgreek}\setlength{\oddsidemargin}{-69pt}\begin{document}$$\sum \nolimits _{i=1}^k\pi _i$$\end{document}
 and
\documentclass[12pt]{minimal}\usepackage{amsmath}\usepackage{wasysym}\usepackage{amsfonts}\usepackage{amssymb}\usepackage{amsbsy}\usepackage{mathrsfs}\usepackage{upgreek}\setlength{\oddsidemargin}{-69pt}\begin{document}$$T_e$$\end{document}
and
\documentclass[12pt]{minimal}\usepackage{amsmath}\usepackage{wasysym}\usepackage{amsfonts}\usepackage{amssymb}\usepackage{amsbsy}\usepackage{mathrsfs}\usepackage{upgreek}\setlength{\oddsidemargin}{-69pt}\begin{document}$$T_e$$\end{document}
 \documentclass[12pt]{minimal}\usepackage{amsmath}\usepackage{wasysym}\usepackage{amsfonts}\usepackage{amssymb}\usepackage{amsbsy}\usepackage{mathrsfs}\usepackage{upgreek}\setlength{\oddsidemargin}{-69pt}\begin{document}$$=$$\end{document}
 \documentclass[12pt]{minimal}\usepackage{amsmath}\usepackage{wasysym}\usepackage{amsfonts}\usepackage{amssymb}\usepackage{amsbsy}\usepackage{mathrsfs}\usepackage{upgreek}\setlength{\oddsidemargin}{-69pt}\begin{document}$$\sum \nolimits _{i=1}^k\pi _i+\pi _s$$\end{document}
 , respectively. Let
\documentclass[12pt]{minimal}\usepackage{amsmath}\usepackage{wasysym}\usepackage{amsfonts}\usepackage{amssymb}\usepackage{amsbsy}\usepackage{mathrsfs}\usepackage{upgreek}\setlength{\oddsidemargin}{-69pt}\begin{document}$$t_c$$\end{document}
, respectively. Let
\documentclass[12pt]{minimal}\usepackage{amsmath}\usepackage{wasysym}\usepackage{amsfonts}\usepackage{amssymb}\usepackage{amsbsy}\usepackage{mathrsfs}\usepackage{upgreek}\setlength{\oddsidemargin}{-69pt}\begin{document}$$t_c$$\end{document}
 be the total number of answering "Yes" in the control group and
\documentclass[12pt]{minimal}\usepackage{amsmath}\usepackage{wasysym}\usepackage{amsfonts}\usepackage{amssymb}\usepackage{amsbsy}\usepackage{mathrsfs}\usepackage{upgreek}\setlength{\oddsidemargin}{-69pt}\begin{document}$$t_e$$\end{document}
be the total number of answering "Yes" in the control group and
\documentclass[12pt]{minimal}\usepackage{amsmath}\usepackage{wasysym}\usepackage{amsfonts}\usepackage{amssymb}\usepackage{amsbsy}\usepackage{mathrsfs}\usepackage{upgreek}\setlength{\oddsidemargin}{-69pt}\begin{document}$$t_e$$\end{document}
 be the total number of answering "Yes" in the experiment group, respectively. Therefore,
\documentclass[12pt]{minimal}\usepackage{amsmath}\usepackage{wasysym}\usepackage{amsfonts}\usepackage{amssymb}\usepackage{amsbsy}\usepackage{mathrsfs}\usepackage{upgreek}\setlength{\oddsidemargin}{-69pt}\begin{document}$$\hat{T}_c$$\end{document}
be the total number of answering "Yes" in the experiment group, respectively. Therefore,
\documentclass[12pt]{minimal}\usepackage{amsmath}\usepackage{wasysym}\usepackage{amsfonts}\usepackage{amssymb}\usepackage{amsbsy}\usepackage{mathrsfs}\usepackage{upgreek}\setlength{\oddsidemargin}{-69pt}\begin{document}$$\hat{T}_c$$\end{document}
 \documentclass[12pt]{minimal}\usepackage{amsmath}\usepackage{wasysym}\usepackage{amsfonts}\usepackage{amssymb}\usepackage{amsbsy}\usepackage{mathrsfs}\usepackage{upgreek}\setlength{\oddsidemargin}{-69pt}\begin{document}$$=$$\end{document}
 \documentclass[12pt]{minimal}\usepackage{amsmath}\usepackage{wasysym}\usepackage{amsfonts}\usepackage{amssymb}\usepackage{amsbsy}\usepackage{mathrsfs}\usepackage{upgreek}\setlength{\oddsidemargin}{-69pt}\begin{document}$$t_c/n_c$$\end{document}
 and
\documentclass[12pt]{minimal}\usepackage{amsmath}\usepackage{wasysym}\usepackage{amsfonts}\usepackage{amssymb}\usepackage{amsbsy}\usepackage{mathrsfs}\usepackage{upgreek}\setlength{\oddsidemargin}{-69pt}\begin{document}$$\hat{T}_e$$\end{document}
and
\documentclass[12pt]{minimal}\usepackage{amsmath}\usepackage{wasysym}\usepackage{amsfonts}\usepackage{amssymb}\usepackage{amsbsy}\usepackage{mathrsfs}\usepackage{upgreek}\setlength{\oddsidemargin}{-69pt}\begin{document}$$\hat{T}_e$$\end{document}
 \documentclass[12pt]{minimal}\usepackage{amsmath}\usepackage{wasysym}\usepackage{amsfonts}\usepackage{amssymb}\usepackage{amsbsy}\usepackage{mathrsfs}\usepackage{upgreek}\setlength{\oddsidemargin}{-69pt}\begin{document}$$=$$\end{document}
 \documentclass[12pt]{minimal}\usepackage{amsmath}\usepackage{wasysym}\usepackage{amsfonts}\usepackage{amssymb}\usepackage{amsbsy}\usepackage{mathrsfs}\usepackage{upgreek}\setlength{\oddsidemargin}{-69pt}\begin{document}$$t_e/n_e$$\end{document}
 , and the estimation of
\documentclass[12pt]{minimal}\usepackage{amsmath}\usepackage{wasysym}\usepackage{amsfonts}\usepackage{amssymb}\usepackage{amsbsy}\usepackage{mathrsfs}\usepackage{upgreek}\setlength{\oddsidemargin}{-69pt}\begin{document}$$\pi _s$$\end{document}
, and the estimation of
\documentclass[12pt]{minimal}\usepackage{amsmath}\usepackage{wasysym}\usepackage{amsfonts}\usepackage{amssymb}\usepackage{amsbsy}\usepackage{mathrsfs}\usepackage{upgreek}\setlength{\oddsidemargin}{-69pt}\begin{document}$$\pi _s$$\end{document}
 is given by
\documentclass[12pt]{minimal}\usepackage{amsmath}\usepackage{wasysym}\usepackage{amsfonts}\usepackage{amssymb}\usepackage{amsbsy}\usepackage{mathrsfs}\usepackage{upgreek}\setlength{\oddsidemargin}{-69pt}\begin{document}$$\hat{\pi }_s$$\end{document}
is given by
\documentclass[12pt]{minimal}\usepackage{amsmath}\usepackage{wasysym}\usepackage{amsfonts}\usepackage{amssymb}\usepackage{amsbsy}\usepackage{mathrsfs}\usepackage{upgreek}\setlength{\oddsidemargin}{-69pt}\begin{document}$$\hat{\pi }_s$$\end{document}
 \documentclass[12pt]{minimal}\usepackage{amsmath}\usepackage{wasysym}\usepackage{amsfonts}\usepackage{amssymb}\usepackage{amsbsy}\usepackage{mathrsfs}\usepackage{upgreek}\setlength{\oddsidemargin}{-69pt}\begin{document}$$=$$\end{document}
 \documentclass[12pt]{minimal}\usepackage{amsmath}\usepackage{wasysym}\usepackage{amsfonts}\usepackage{amssymb}\usepackage{amsbsy}\usepackage{mathrsfs}\usepackage{upgreek}\setlength{\oddsidemargin}{-69pt}\begin{document}$$\hat{T}_e$$\end{document}
 −
\documentclass[12pt]{minimal}\usepackage{amsmath}\usepackage{wasysym}\usepackage{amsfonts}\usepackage{amssymb}\usepackage{amsbsy}\usepackage{mathrsfs}\usepackage{upgreek}\setlength{\oddsidemargin}{-69pt}\begin{document}$$\hat{T}_c$$\end{document}
−
\documentclass[12pt]{minimal}\usepackage{amsmath}\usepackage{wasysym}\usepackage{amsfonts}\usepackage{amssymb}\usepackage{amsbsy}\usepackage{mathrsfs}\usepackage{upgreek}\setlength{\oddsidemargin}{-69pt}\begin{document}$$\hat{T}_c$$\end{document}
 \documentclass[12pt]{minimal}\usepackage{amsmath}\usepackage{wasysym}\usepackage{amsfonts}\usepackage{amssymb}\usepackage{amsbsy}\usepackage{mathrsfs}\usepackage{upgreek}\setlength{\oddsidemargin}{-69pt}\begin{document}$$=$$\end{document}
 \documentclass[12pt]{minimal}\usepackage{amsmath}\usepackage{wasysym}\usepackage{amsfonts}\usepackage{amssymb}\usepackage{amsbsy}\usepackage{mathrsfs}\usepackage{upgreek}\setlength{\oddsidemargin}{-69pt}\begin{document}$$t_e/n_e-t_c/n_c$$\end{document}
 .
.
Given that all items are statistically unrelated, it is shown that the sample variance of
\documentclass[12pt]{minimal}\usepackage{amsmath}\usepackage{wasysym}\usepackage{amsfonts}\usepackage{amssymb}\usepackage{amsbsy}\usepackage{mathrsfs}\usepackage{upgreek}\setlength{\oddsidemargin}{-69pt}\begin{document}$$\hat{\pi }_s$$\end{document}
 is given by

Therefore, the
\documentclass[12pt]{minimal}\usepackage{amsmath}\usepackage{wasysym}\usepackage{amsfonts}\usepackage{amssymb}\usepackage{amsbsy}\usepackage{mathrsfs}\usepackage{upgreek}\setlength{\oddsidemargin}{-69pt}\begin{document}$$(1-\alpha )100\%$$\end{document}
 Wald confidence interval for
\documentclass[12pt]{minimal}\usepackage{amsmath}\usepackage{wasysym}\usepackage{amsfonts}\usepackage{amssymb}\usepackage{amsbsy}\usepackage{mathrsfs}\usepackage{upgreek}\setlength{\oddsidemargin}{-69pt}\begin{document}$$\pi _s$$\end{document}
Wald confidence interval for
\documentclass[12pt]{minimal}\usepackage{amsmath}\usepackage{wasysym}\usepackage{amsfonts}\usepackage{amssymb}\usepackage{amsbsy}\usepackage{mathrsfs}\usepackage{upgreek}\setlength{\oddsidemargin}{-69pt}\begin{document}$$\pi _s$$\end{document}
 is given by

where

and

while the
\documentclass[12pt]{minimal}\usepackage{amsmath}\usepackage{wasysym}\usepackage{amsfonts}\usepackage{amssymb}\usepackage{amsbsy}\usepackage{mathrsfs}\usepackage{upgreek}\setlength{\oddsidemargin}{-69pt}\begin{document}$$(1-\alpha )100\%$$\end{document}
 Wilson confidence interval for
\documentclass[12pt]{minimal}\usepackage{amsmath}\usepackage{wasysym}\usepackage{amsfonts}\usepackage{amssymb}\usepackage{amsbsy}\usepackage{mathrsfs}\usepackage{upgreek}\setlength{\oddsidemargin}{-69pt}\begin{document}$$\pi _s$$\end{document}
Wilson confidence interval for
\documentclass[12pt]{minimal}\usepackage{amsmath}\usepackage{wasysym}\usepackage{amsfonts}\usepackage{amssymb}\usepackage{amsbsy}\usepackage{mathrsfs}\usepackage{upgreek}\setlength{\oddsidemargin}{-69pt}\begin{document}$$\pi _s$$\end{document}
 is given by

where

and

1.3.2. Sample Size Formula Based on Wald Confidence Interval
\documentclass[12pt]{minimal}\usepackage{amsmath}\usepackage{wasysym}\usepackage{amsfonts}\usepackage{amssymb}\usepackage{amsbsy}\usepackage{mathrsfs}\usepackage{upgreek}\setlength{\oddsidemargin}{-69pt}\begin{document}$${{\varvec{[n_{ICT, W}}}}$$\end{document}
,
\documentclass[12pt]{minimal}\usepackage{amsmath}\usepackage{wasysym}\usepackage{amsfonts}\usepackage{amssymb}\usepackage{amsbsy}\usepackage{mathrsfs}\usepackage{upgreek}\setlength{\oddsidemargin}{-69pt}\begin{document}$${{\varvec{n_{ICT, W, 0.5}]}}}$$\end{document}


It is noted that the half width of the
\documentclass[12pt]{minimal}\usepackage{amsmath}\usepackage{wasysym}\usepackage{amsfonts}\usepackage{amssymb}\usepackage{amsbsy}\usepackage{mathrsfs}\usepackage{upgreek}\setlength{\oddsidemargin}{-69pt}\begin{document}$$(1-\alpha )100\%$$\end{document}
 Wald CI is given by

To control the half width of the Wald CI that is no larger than
\documentclass[12pt]{minimal}\usepackage{amsmath}\usepackage{wasysym}\usepackage{amsfonts}\usepackage{amssymb}\usepackage{amsbsy}\usepackage{mathrsfs}\usepackage{upgreek}\setlength{\oddsidemargin}{-69pt}\begin{document}$$\omega $$\end{document}
 with a probability of
\documentclass[12pt]{minimal}\usepackage{amsmath}\usepackage{wasysym}\usepackage{amsfonts}\usepackage{amssymb}\usepackage{amsbsy}\usepackage{mathrsfs}\usepackage{upgreek}\setlength{\oddsidemargin}{-69pt}\begin{document}$$1 - \beta $$\end{document}
with a probability of
\documentclass[12pt]{minimal}\usepackage{amsmath}\usepackage{wasysym}\usepackage{amsfonts}\usepackage{amssymb}\usepackage{amsbsy}\usepackage{mathrsfs}\usepackage{upgreek}\setlength{\oddsidemargin}{-69pt}\begin{document}$$1 - \beta $$\end{document}
 , the desired sample size should satisfy

i.e.,

It is clear that

Hence, we have

When
\documentclass[12pt]{minimal}\usepackage{amsmath}\usepackage{wasysym}\usepackage{amsfonts}\usepackage{amssymb}\usepackage{amsbsy}\usepackage{mathrsfs}\usepackage{upgreek}\setlength{\oddsidemargin}{-69pt}\begin{document}$$n_c$$\end{document}
 \documentclass[12pt]{minimal}\usepackage{amsmath}\usepackage{wasysym}\usepackage{amsfonts}\usepackage{amssymb}\usepackage{amsbsy}\usepackage{mathrsfs}\usepackage{upgreek}\setlength{\oddsidemargin}{-69pt}\begin{document}$$=$$\end{document}
 \documentclass[12pt]{minimal}\usepackage{amsmath}\usepackage{wasysym}\usepackage{amsfonts}\usepackage{amssymb}\usepackage{amsbsy}\usepackage{mathrsfs}\usepackage{upgreek}\setlength{\oddsidemargin}{-69pt}\begin{document}$$n_e$$\end{document}
 \documentclass[12pt]{minimal}\usepackage{amsmath}\usepackage{wasysym}\usepackage{amsfonts}\usepackage{amssymb}\usepackage{amsbsy}\usepackage{mathrsfs}\usepackage{upgreek}\setlength{\oddsidemargin}{-69pt}\begin{document}$$=$$\end{document}
 \documentclass[12pt]{minimal}\usepackage{amsmath}\usepackage{wasysym}\usepackage{amsfonts}\usepackage{amssymb}\usepackage{amsbsy}\usepackage{mathrsfs}\usepackage{upgreek}\setlength{\oddsidemargin}{-69pt}\begin{document}$$\frac{1}{2}n$$\end{document}
 and let c
\documentclass[12pt]{minimal}\usepackage{amsmath}\usepackage{wasysym}\usepackage{amsfonts}\usepackage{amssymb}\usepackage{amsbsy}\usepackage{mathrsfs}\usepackage{upgreek}\setlength{\oddsidemargin}{-69pt}\begin{document}$$=$$\end{document}
and let c
\documentclass[12pt]{minimal}\usepackage{amsmath}\usepackage{wasysym}\usepackage{amsfonts}\usepackage{amssymb}\usepackage{amsbsy}\usepackage{mathrsfs}\usepackage{upgreek}\setlength{\oddsidemargin}{-69pt}\begin{document}$$=$$\end{document}
 \documentclass[12pt]{minimal}\usepackage{amsmath}\usepackage{wasysym}\usepackage{amsfonts}\usepackage{amssymb}\usepackage{amsbsy}\usepackage{mathrsfs}\usepackage{upgreek}\setlength{\oddsidemargin}{-69pt}\begin{document}$$2\sum \nolimits _{i=1}^k\pi _i(1-\pi _i)+\pi _s(1-\pi _s)$$\end{document}
 , the above equation can be simplified to

where

According to Cardans formula for solving the cubic equation, the desired sample size
\documentclass[12pt]{minimal}\usepackage{amsmath}\usepackage{wasysym}\usepackage{amsfonts}\usepackage{amssymb}\usepackage{amsbsy}\usepackage{mathrsfs}\usepackage{upgreek}\setlength{\oddsidemargin}{-69pt}\begin{document}$$n_e$$\end{document}
 (
\documentclass[12pt]{minimal}\usepackage{amsmath}\usepackage{wasysym}\usepackage{amsfonts}\usepackage{amssymb}\usepackage{amsbsy}\usepackage{mathrsfs}\usepackage{upgreek}\setlength{\oddsidemargin}{-69pt}\begin{document}$$=\frac{1}{2}n$$\end{document}
(
\documentclass[12pt]{minimal}\usepackage{amsmath}\usepackage{wasysym}\usepackage{amsfonts}\usepackage{amssymb}\usepackage{amsbsy}\usepackage{mathrsfs}\usepackage{upgreek}\setlength{\oddsidemargin}{-69pt}\begin{document}$$=\frac{1}{2}n$$\end{document}
 ) can be estimated to be the unique real root or the maximum root of three real roots. Therefore, the estimated sample size is given by
\documentclass[12pt]{minimal}\usepackage{amsmath}\usepackage{wasysym}\usepackage{amsfonts}\usepackage{amssymb}\usepackage{amsbsy}\usepackage{mathrsfs}\usepackage{upgreek}\setlength{\oddsidemargin}{-69pt}\begin{document}$${{\varvec{n_{ICT, W}}}}=2n_e$$\end{document}
) can be estimated to be the unique real root or the maximum root of three real roots. Therefore, the estimated sample size is given by
\documentclass[12pt]{minimal}\usepackage{amsmath}\usepackage{wasysym}\usepackage{amsfonts}\usepackage{amssymb}\usepackage{amsbsy}\usepackage{mathrsfs}\usepackage{upgreek}\setlength{\oddsidemargin}{-69pt}\begin{document}$${{\varvec{n_{ICT, W}}}}=2n_e$$\end{document}
 .
.
When
\documentclass[12pt]{minimal}\usepackage{amsmath}\usepackage{wasysym}\usepackage{amsfonts}\usepackage{amssymb}\usepackage{amsbsy}\usepackage{mathrsfs}\usepackage{upgreek}\setlength{\oddsidemargin}{-69pt}\begin{document}$$\beta $$\end{document}
 \documentclass[12pt]{minimal}\usepackage{amsmath}\usepackage{wasysym}\usepackage{amsfonts}\usepackage{amssymb}\usepackage{amsbsy}\usepackage{mathrsfs}\usepackage{upgreek}\setlength{\oddsidemargin}{-69pt}\begin{document}$$=$$\end{document}
 0.5, the estimated sample size n is given by

1.3.3. Sample Size Formula Based on Wilson Confidence Interval
\documentclass[12pt]{minimal}\usepackage{amsmath}\usepackage{wasysym}\usepackage{amsfonts}\usepackage{amssymb}\usepackage{amsbsy}\usepackage{mathrsfs}\usepackage{upgreek}\setlength{\oddsidemargin}{-69pt}\begin{document}$${{\varvec{[n_{ICT, Wi}}}}$$\end{document}
,
\documentclass[12pt]{minimal}\usepackage{amsmath}\usepackage{wasysym}\usepackage{amsfonts}\usepackage{amssymb}\usepackage{amsbsy}\usepackage{mathrsfs}\usepackage{upgreek}\setlength{\oddsidemargin}{-69pt}\begin{document}$${{\varvec{n_{ICT, Wi, 0.5}]}}}$$\end{document}


The half width of the
\documentclass[12pt]{minimal}\usepackage{amsmath}\usepackage{wasysym}\usepackage{amsfonts}\usepackage{amssymb}\usepackage{amsbsy}\usepackage{mathrsfs}\usepackage{upgreek}\setlength{\oddsidemargin}{-69pt}\begin{document}$$(1-\alpha )100\%$$\end{document}
 Wilson CI is given by

To control the half width of the Wilson CI to be no larger than
\documentclass[12pt]{minimal}\usepackage{amsmath}\usepackage{wasysym}\usepackage{amsfonts}\usepackage{amssymb}\usepackage{amsbsy}\usepackage{mathrsfs}\usepackage{upgreek}\setlength{\oddsidemargin}{-69pt}\begin{document}$$\omega $$\end{document}
 with probability
\documentclass[12pt]{minimal}\usepackage{amsmath}\usepackage{wasysym}\usepackage{amsfonts}\usepackage{amssymb}\usepackage{amsbsy}\usepackage{mathrsfs}\usepackage{upgreek}\setlength{\oddsidemargin}{-69pt}\begin{document}$$1-\beta $$\end{document}
with probability
\documentclass[12pt]{minimal}\usepackage{amsmath}\usepackage{wasysym}\usepackage{amsfonts}\usepackage{amssymb}\usepackage{amsbsy}\usepackage{mathrsfs}\usepackage{upgreek}\setlength{\oddsidemargin}{-69pt}\begin{document}$$1-\beta $$\end{document}
 , we have

i.e.,

Similarly, it is clear that

Therefore, we have

If
\documentclass[12pt]{minimal}\usepackage{amsmath}\usepackage{wasysym}\usepackage{amsfonts}\usepackage{amssymb}\usepackage{amsbsy}\usepackage{mathrsfs}\usepackage{upgreek}\setlength{\oddsidemargin}{-69pt}\begin{document}$$n_c$$\end{document}
 \documentclass[12pt]{minimal}\usepackage{amsmath}\usepackage{wasysym}\usepackage{amsfonts}\usepackage{amssymb}\usepackage{amsbsy}\usepackage{mathrsfs}\usepackage{upgreek}\setlength{\oddsidemargin}{-69pt}\begin{document}$$=$$\end{document}
 \documentclass[12pt]{minimal}\usepackage{amsmath}\usepackage{wasysym}\usepackage{amsfonts}\usepackage{amssymb}\usepackage{amsbsy}\usepackage{mathrsfs}\usepackage{upgreek}\setlength{\oddsidemargin}{-69pt}\begin{document}$$n_e$$\end{document}
 , then

where

Similarly, the eigenvalue methods can be employed to find the solutions of the above equation with respect to
\documentclass[12pt]{minimal}\usepackage{amsmath}\usepackage{wasysym}\usepackage{amsfonts}\usepackage{amssymb}\usepackage{amsbsy}\usepackage{mathrsfs}\usepackage{upgreek}\setlength{\oddsidemargin}{-69pt}\begin{document}$$n_e+z_{\alpha /2}^2$$\end{document}
 , and the desired sample size is denoted as
\documentclass[12pt]{minimal}\usepackage{amsmath}\usepackage{wasysym}\usepackage{amsfonts}\usepackage{amssymb}\usepackage{amsbsy}\usepackage{mathrsfs}\usepackage{upgreek}\setlength{\oddsidemargin}{-69pt}\begin{document}$${{\varvec{n_{ICT, Wi}}}}$$\end{document}
, and the desired sample size is denoted as
\documentclass[12pt]{minimal}\usepackage{amsmath}\usepackage{wasysym}\usepackage{amsfonts}\usepackage{amssymb}\usepackage{amsbsy}\usepackage{mathrsfs}\usepackage{upgreek}\setlength{\oddsidemargin}{-69pt}\begin{document}$${{\varvec{n_{ICT, Wi}}}}$$\end{document}
 (i.e.,
\documentclass[12pt]{minimal}\usepackage{amsmath}\usepackage{wasysym}\usepackage{amsfonts}\usepackage{amssymb}\usepackage{amsbsy}\usepackage{mathrsfs}\usepackage{upgreek}\setlength{\oddsidemargin}{-69pt}\begin{document}$${{\varvec{n_{ICT, Wi}}}}= 2n_e$$\end{document}
(i.e.,
\documentclass[12pt]{minimal}\usepackage{amsmath}\usepackage{wasysym}\usepackage{amsfonts}\usepackage{amssymb}\usepackage{amsbsy}\usepackage{mathrsfs}\usepackage{upgreek}\setlength{\oddsidemargin}{-69pt}\begin{document}$${{\varvec{n_{ICT, Wi}}}}= 2n_e$$\end{document}
 ).
).
When
\documentclass[12pt]{minimal}\usepackage{amsmath}\usepackage{wasysym}\usepackage{amsfonts}\usepackage{amssymb}\usepackage{amsbsy}\usepackage{mathrsfs}\usepackage{upgreek}\setlength{\oddsidemargin}{-69pt}\begin{document}$$\beta $$\end{document}
 \documentclass[12pt]{minimal}\usepackage{amsmath}\usepackage{wasysym}\usepackage{amsfonts}\usepackage{amssymb}\usepackage{amsbsy}\usepackage{mathrsfs}\usepackage{upgreek}\setlength{\oddsidemargin}{-69pt}\begin{document}$$=$$\end{document}
 0.5, the estimated sample size n is given by

where f
\documentclass[12pt]{minimal}\usepackage{amsmath}\usepackage{wasysym}\usepackage{amsfonts}\usepackage{amssymb}\usepackage{amsbsy}\usepackage{mathrsfs}\usepackage{upgreek}\setlength{\oddsidemargin}{-69pt}\begin{document}$$=$$\end{document}
 \documentclass[12pt]{minimal}\usepackage{amsmath}\usepackage{wasysym}\usepackage{amsfonts}\usepackage{amssymb}\usepackage{amsbsy}\usepackage{mathrsfs}\usepackage{upgreek}\setlength{\oddsidemargin}{-69pt}\begin{document}$$2\sum \nolimits _{i=1}^k\pi _i(1-\pi _i)+\pi _s(1-\pi _s)$$\end{document}
 and g
\documentclass[12pt]{minimal}\usepackage{amsmath}\usepackage{wasysym}\usepackage{amsfonts}\usepackage{amssymb}\usepackage{amsbsy}\usepackage{mathrsfs}\usepackage{upgreek}\setlength{\oddsidemargin}{-69pt}\begin{document}$$=$$\end{document}
and g
\documentclass[12pt]{minimal}\usepackage{amsmath}\usepackage{wasysym}\usepackage{amsfonts}\usepackage{amssymb}\usepackage{amsbsy}\usepackage{mathrsfs}\usepackage{upgreek}\setlength{\oddsidemargin}{-69pt}\begin{document}$$=$$\end{document}
 \documentclass[12pt]{minimal}\usepackage{amsmath}\usepackage{wasysym}\usepackage{amsfonts}\usepackage{amssymb}\usepackage{amsbsy}\usepackage{mathrsfs}\usepackage{upgreek}\setlength{\oddsidemargin}{-69pt}\begin{document}$$\omega ^2[4\pi _s(1-\pi _s)-1]$$\end{document}
 .
.
1.4. Sample Size Estimation Under Cheater Detection Model
1.4.1. Confidence intervals Under Cheater Detection Model
Assume that the true proportions of honest-yes respondents, honest-no respondents, and cheaters are
\documentclass[12pt]{minimal}\usepackage{amsmath}\usepackage{wasysym}\usepackage{amsfonts}\usepackage{amssymb}\usepackage{amsbsy}\usepackage{mathrsfs}\usepackage{upgreek}\setlength{\oddsidemargin}{-69pt}\begin{document}$$\pi _s$$\end{document}
 ,
\documentclass[12pt]{minimal}\usepackage{amsmath}\usepackage{wasysym}\usepackage{amsfonts}\usepackage{amssymb}\usepackage{amsbsy}\usepackage{mathrsfs}\usepackage{upgreek}\setlength{\oddsidemargin}{-69pt}\begin{document}$$\beta _s$$\end{document}
,
\documentclass[12pt]{minimal}\usepackage{amsmath}\usepackage{wasysym}\usepackage{amsfonts}\usepackage{amssymb}\usepackage{amsbsy}\usepackage{mathrsfs}\usepackage{upgreek}\setlength{\oddsidemargin}{-69pt}\begin{document}$$\beta _s$$\end{document}
 and
\documentclass[12pt]{minimal}\usepackage{amsmath}\usepackage{wasysym}\usepackage{amsfonts}\usepackage{amssymb}\usepackage{amsbsy}\usepackage{mathrsfs}\usepackage{upgreek}\setlength{\oddsidemargin}{-69pt}\begin{document}$$\gamma $$\end{document}
and
\documentclass[12pt]{minimal}\usepackage{amsmath}\usepackage{wasysym}\usepackage{amsfonts}\usepackage{amssymb}\usepackage{amsbsy}\usepackage{mathrsfs}\usepackage{upgreek}\setlength{\oddsidemargin}{-69pt}\begin{document}$$\gamma $$\end{document}
 , respectively (i.e.,
\documentclass[12pt]{minimal}\usepackage{amsmath}\usepackage{wasysym}\usepackage{amsfonts}\usepackage{amssymb}\usepackage{amsbsy}\usepackage{mathrsfs}\usepackage{upgreek}\setlength{\oddsidemargin}{-69pt}\begin{document}$$\pi _s$$\end{document}
, respectively (i.e.,
\documentclass[12pt]{minimal}\usepackage{amsmath}\usepackage{wasysym}\usepackage{amsfonts}\usepackage{amssymb}\usepackage{amsbsy}\usepackage{mathrsfs}\usepackage{upgreek}\setlength{\oddsidemargin}{-69pt}\begin{document}$$\pi _s$$\end{document}
 +
\documentclass[12pt]{minimal}\usepackage{amsmath}\usepackage{wasysym}\usepackage{amsfonts}\usepackage{amssymb}\usepackage{amsbsy}\usepackage{mathrsfs}\usepackage{upgreek}\setlength{\oddsidemargin}{-69pt}\begin{document}$$\beta _s$$\end{document}
+
\documentclass[12pt]{minimal}\usepackage{amsmath}\usepackage{wasysym}\usepackage{amsfonts}\usepackage{amssymb}\usepackage{amsbsy}\usepackage{mathrsfs}\usepackage{upgreek}\setlength{\oddsidemargin}{-69pt}\begin{document}$$\beta _s$$\end{document}
 +
\documentclass[12pt]{minimal}\usepackage{amsmath}\usepackage{wasysym}\usepackage{amsfonts}\usepackage{amssymb}\usepackage{amsbsy}\usepackage{mathrsfs}\usepackage{upgreek}\setlength{\oddsidemargin}{-69pt}\begin{document}$$\gamma $$\end{document}
+
\documentclass[12pt]{minimal}\usepackage{amsmath}\usepackage{wasysym}\usepackage{amsfonts}\usepackage{amssymb}\usepackage{amsbsy}\usepackage{mathrsfs}\usepackage{upgreek}\setlength{\oddsidemargin}{-69pt}\begin{document}$$\gamma $$\end{document}
 =1), and a total of n individuals participates in the interview under Cheater Detection Model (CDM). Following Clark & Desharnais (Reference Clark and Desharnais1998), the whole sample n is divided into two subsamples of sizes
\documentclass[12pt]{minimal}\usepackage{amsmath}\usepackage{wasysym}\usepackage{amsfonts}\usepackage{amssymb}\usepackage{amsbsy}\usepackage{mathrsfs}\usepackage{upgreek}\setlength{\oddsidemargin}{-69pt}\begin{document}$$n_1$$\end{document}
=1), and a total of n individuals participates in the interview under Cheater Detection Model (CDM). Following Clark & Desharnais (Reference Clark and Desharnais1998), the whole sample n is divided into two subsamples of sizes
\documentclass[12pt]{minimal}\usepackage{amsmath}\usepackage{wasysym}\usepackage{amsfonts}\usepackage{amssymb}\usepackage{amsbsy}\usepackage{mathrsfs}\usepackage{upgreek}\setlength{\oddsidemargin}{-69pt}\begin{document}$$n_1$$\end{document}
 and
\documentclass[12pt]{minimal}\usepackage{amsmath}\usepackage{wasysym}\usepackage{amsfonts}\usepackage{amssymb}\usepackage{amsbsy}\usepackage{mathrsfs}\usepackage{upgreek}\setlength{\oddsidemargin}{-69pt}\begin{document}$$n_2$$\end{document}
and
\documentclass[12pt]{minimal}\usepackage{amsmath}\usepackage{wasysym}\usepackage{amsfonts}\usepackage{amssymb}\usepackage{amsbsy}\usepackage{mathrsfs}\usepackage{upgreek}\setlength{\oddsidemargin}{-69pt}\begin{document}$$n_2$$\end{document}
 to estimate parameters
\documentclass[12pt]{minimal}\usepackage{amsmath}\usepackage{wasysym}\usepackage{amsfonts}\usepackage{amssymb}\usepackage{amsbsy}\usepackage{mathrsfs}\usepackage{upgreek}\setlength{\oddsidemargin}{-69pt}\begin{document}$$\pi _s$$\end{document}
to estimate parameters
\documentclass[12pt]{minimal}\usepackage{amsmath}\usepackage{wasysym}\usepackage{amsfonts}\usepackage{amssymb}\usepackage{amsbsy}\usepackage{mathrsfs}\usepackage{upgreek}\setlength{\oddsidemargin}{-69pt}\begin{document}$$\pi _s$$\end{document}
 ,
\documentclass[12pt]{minimal}\usepackage{amsmath}\usepackage{wasysym}\usepackage{amsfonts}\usepackage{amssymb}\usepackage{amsbsy}\usepackage{mathrsfs}\usepackage{upgreek}\setlength{\oddsidemargin}{-69pt}\begin{document}$$\beta _s$$\end{document}
,
\documentclass[12pt]{minimal}\usepackage{amsmath}\usepackage{wasysym}\usepackage{amsfonts}\usepackage{amssymb}\usepackage{amsbsy}\usepackage{mathrsfs}\usepackage{upgreek}\setlength{\oddsidemargin}{-69pt}\begin{document}$$\beta _s$$\end{document}
 and
\documentclass[12pt]{minimal}\usepackage{amsmath}\usepackage{wasysym}\usepackage{amsfonts}\usepackage{amssymb}\usepackage{amsbsy}\usepackage{mathrsfs}\usepackage{upgreek}\setlength{\oddsidemargin}{-69pt}\begin{document}$$\gamma $$\end{document}
and
\documentclass[12pt]{minimal}\usepackage{amsmath}\usepackage{wasysym}\usepackage{amsfonts}\usepackage{amssymb}\usepackage{amsbsy}\usepackage{mathrsfs}\usepackage{upgreek}\setlength{\oddsidemargin}{-69pt}\begin{document}$$\gamma $$\end{document}
 . The probabilities of a respondent being assigned by the randomizing device to answer the sensitive question are, respectively,
\documentclass[12pt]{minimal}\usepackage{amsmath}\usepackage{wasysym}\usepackage{amsfonts}\usepackage{amssymb}\usepackage{amsbsy}\usepackage{mathrsfs}\usepackage{upgreek}\setlength{\oddsidemargin}{-69pt}\begin{document}$$p_1$$\end{document}
. The probabilities of a respondent being assigned by the randomizing device to answer the sensitive question are, respectively,
\documentclass[12pt]{minimal}\usepackage{amsmath}\usepackage{wasysym}\usepackage{amsfonts}\usepackage{amssymb}\usepackage{amsbsy}\usepackage{mathrsfs}\usepackage{upgreek}\setlength{\oddsidemargin}{-69pt}\begin{document}$$p_1$$\end{document}
 and
\documentclass[12pt]{minimal}\usepackage{amsmath}\usepackage{wasysym}\usepackage{amsfonts}\usepackage{amssymb}\usepackage{amsbsy}\usepackage{mathrsfs}\usepackage{upgreek}\setlength{\oddsidemargin}{-69pt}\begin{document}$$p_2$$\end{document}
and
\documentclass[12pt]{minimal}\usepackage{amsmath}\usepackage{wasysym}\usepackage{amsfonts}\usepackage{amssymb}\usepackage{amsbsy}\usepackage{mathrsfs}\usepackage{upgreek}\setlength{\oddsidemargin}{-69pt}\begin{document}$$p_2$$\end{document}
 (
\documentclass[12pt]{minimal}\usepackage{amsmath}\usepackage{wasysym}\usepackage{amsfonts}\usepackage{amssymb}\usepackage{amsbsy}\usepackage{mathrsfs}\usepackage{upgreek}\setlength{\oddsidemargin}{-69pt}\begin{document}$$p_1$$\end{document}
(
\documentclass[12pt]{minimal}\usepackage{amsmath}\usepackage{wasysym}\usepackage{amsfonts}\usepackage{amssymb}\usepackage{amsbsy}\usepackage{mathrsfs}\usepackage{upgreek}\setlength{\oddsidemargin}{-69pt}\begin{document}$$p_1$$\end{document}
 \documentclass[12pt]{minimal}\usepackage{amsmath}\usepackage{wasysym}\usepackage{amsfonts}\usepackage{amssymb}\usepackage{amsbsy}\usepackage{mathrsfs}\usepackage{upgreek}\setlength{\oddsidemargin}{-69pt}\begin{document}$$\ne $$\end{document}
 \documentclass[12pt]{minimal}\usepackage{amsmath}\usepackage{wasysym}\usepackage{amsfonts}\usepackage{amssymb}\usepackage{amsbsy}\usepackage{mathrsfs}\usepackage{upgreek}\setlength{\oddsidemargin}{-69pt}\begin{document}$$p_2$$\end{document}
 ) for subsamples 1 and 2. Let
\documentclass[12pt]{minimal}\usepackage{amsmath}\usepackage{wasysym}\usepackage{amsfonts}\usepackage{amssymb}\usepackage{amsbsy}\usepackage{mathrsfs}\usepackage{upgreek}\setlength{\oddsidemargin}{-69pt}\begin{document}$$\lambda _1$$\end{document}
) for subsamples 1 and 2. Let
\documentclass[12pt]{minimal}\usepackage{amsmath}\usepackage{wasysym}\usepackage{amsfonts}\usepackage{amssymb}\usepackage{amsbsy}\usepackage{mathrsfs}\usepackage{upgreek}\setlength{\oddsidemargin}{-69pt}\begin{document}$$\lambda _1$$\end{document}
 and
\documentclass[12pt]{minimal}\usepackage{amsmath}\usepackage{wasysym}\usepackage{amsfonts}\usepackage{amssymb}\usepackage{amsbsy}\usepackage{mathrsfs}\usepackage{upgreek}\setlength{\oddsidemargin}{-69pt}\begin{document}$$\lambda _2$$\end{document}
and
\documentclass[12pt]{minimal}\usepackage{amsmath}\usepackage{wasysym}\usepackage{amsfonts}\usepackage{amssymb}\usepackage{amsbsy}\usepackage{mathrsfs}\usepackage{upgreek}\setlength{\oddsidemargin}{-69pt}\begin{document}$$\lambda _2$$\end{document}
 denote the true proportions of "yes" responses, and
\documentclass[12pt]{minimal}\usepackage{amsmath}\usepackage{wasysym}\usepackage{amsfonts}\usepackage{amssymb}\usepackage{amsbsy}\usepackage{mathrsfs}\usepackage{upgreek}\setlength{\oddsidemargin}{-69pt}\begin{document}$$y_1$$\end{document}
denote the true proportions of "yes" responses, and
\documentclass[12pt]{minimal}\usepackage{amsmath}\usepackage{wasysym}\usepackage{amsfonts}\usepackage{amssymb}\usepackage{amsbsy}\usepackage{mathrsfs}\usepackage{upgreek}\setlength{\oddsidemargin}{-69pt}\begin{document}$$y_1$$\end{document}
 and
\documentclass[12pt]{minimal}\usepackage{amsmath}\usepackage{wasysym}\usepackage{amsfonts}\usepackage{amssymb}\usepackage{amsbsy}\usepackage{mathrsfs}\usepackage{upgreek}\setlength{\oddsidemargin}{-69pt}\begin{document}$$y_2$$\end{document}
and
\documentclass[12pt]{minimal}\usepackage{amsmath}\usepackage{wasysym}\usepackage{amsfonts}\usepackage{amssymb}\usepackage{amsbsy}\usepackage{mathrsfs}\usepackage{upgreek}\setlength{\oddsidemargin}{-69pt}\begin{document}$$y_2$$\end{document}
 the number of "Yes" answers for subsamples 1 and 2. Obviously,
\documentclass[12pt]{minimal}\usepackage{amsmath}\usepackage{wasysym}\usepackage{amsfonts}\usepackage{amssymb}\usepackage{amsbsy}\usepackage{mathrsfs}\usepackage{upgreek}\setlength{\oddsidemargin}{-69pt}\begin{document}$$y_i$$\end{document}
the number of "Yes" answers for subsamples 1 and 2. Obviously,
\documentclass[12pt]{minimal}\usepackage{amsmath}\usepackage{wasysym}\usepackage{amsfonts}\usepackage{amssymb}\usepackage{amsbsy}\usepackage{mathrsfs}\usepackage{upgreek}\setlength{\oddsidemargin}{-69pt}\begin{document}$$y_i$$\end{document}
 follows B(
\documentclass[12pt]{minimal}\usepackage{amsmath}\usepackage{wasysym}\usepackage{amsfonts}\usepackage{amssymb}\usepackage{amsbsy}\usepackage{mathrsfs}\usepackage{upgreek}\setlength{\oddsidemargin}{-69pt}\begin{document}$$n_i,\lambda _i$$\end{document}
follows B(
\documentclass[12pt]{minimal}\usepackage{amsmath}\usepackage{wasysym}\usepackage{amsfonts}\usepackage{amssymb}\usepackage{amsbsy}\usepackage{mathrsfs}\usepackage{upgreek}\setlength{\oddsidemargin}{-69pt}\begin{document}$$n_i,\lambda _i$$\end{document}
 ) (i =1, 2). Then, we have
\documentclass[12pt]{minimal}\usepackage{amsmath}\usepackage{wasysym}\usepackage{amsfonts}\usepackage{amssymb}\usepackage{amsbsy}\usepackage{mathrsfs}\usepackage{upgreek}\setlength{\oddsidemargin}{-69pt}\begin{document}$$\hat{\lambda }_i$$\end{document}
) (i =1, 2). Then, we have
\documentclass[12pt]{minimal}\usepackage{amsmath}\usepackage{wasysym}\usepackage{amsfonts}\usepackage{amssymb}\usepackage{amsbsy}\usepackage{mathrsfs}\usepackage{upgreek}\setlength{\oddsidemargin}{-69pt}\begin{document}$$\hat{\lambda }_i$$\end{document}
 \documentclass[12pt]{minimal}\usepackage{amsmath}\usepackage{wasysym}\usepackage{amsfonts}\usepackage{amssymb}\usepackage{amsbsy}\usepackage{mathrsfs}\usepackage{upgreek}\setlength{\oddsidemargin}{-69pt}\begin{document}$$=$$\end{document}
 \documentclass[12pt]{minimal}\usepackage{amsmath}\usepackage{wasysym}\usepackage{amsfonts}\usepackage{amssymb}\usepackage{amsbsy}\usepackage{mathrsfs}\usepackage{upgreek}\setlength{\oddsidemargin}{-69pt}\begin{document}$$y_i/n_i$$\end{document}
 (i =1, 2),
\documentclass[12pt]{minimal}\usepackage{amsmath}\usepackage{wasysym}\usepackage{amsfonts}\usepackage{amssymb}\usepackage{amsbsy}\usepackage{mathrsfs}\usepackage{upgreek}\setlength{\oddsidemargin}{-69pt}\begin{document}$$\hat{\pi }_s$$\end{document}
(i =1, 2),
\documentclass[12pt]{minimal}\usepackage{amsmath}\usepackage{wasysym}\usepackage{amsfonts}\usepackage{amssymb}\usepackage{amsbsy}\usepackage{mathrsfs}\usepackage{upgreek}\setlength{\oddsidemargin}{-69pt}\begin{document}$$\hat{\pi }_s$$\end{document}
 \documentclass[12pt]{minimal}\usepackage{amsmath}\usepackage{wasysym}\usepackage{amsfonts}\usepackage{amssymb}\usepackage{amsbsy}\usepackage{mathrsfs}\usepackage{upgreek}\setlength{\oddsidemargin}{-69pt}\begin{document}$$=$$\end{document}
 \documentclass[12pt]{minimal}\usepackage{amsmath}\usepackage{wasysym}\usepackage{amsfonts}\usepackage{amssymb}\usepackage{amsbsy}\usepackage{mathrsfs}\usepackage{upgreek}\setlength{\oddsidemargin}{-69pt}\begin{document}$$(p_2\hat{\lambda }_1-p_1\hat{\lambda }_2)/(p_2-p_1)$$\end{document}
 ,
\documentclass[12pt]{minimal}\usepackage{amsmath}\usepackage{wasysym}\usepackage{amsfonts}\usepackage{amssymb}\usepackage{amsbsy}\usepackage{mathrsfs}\usepackage{upgreek}\setlength{\oddsidemargin}{-69pt}\begin{document}$$\hat{\beta }_s$$\end{document}
,
\documentclass[12pt]{minimal}\usepackage{amsmath}\usepackage{wasysym}\usepackage{amsfonts}\usepackage{amssymb}\usepackage{amsbsy}\usepackage{mathrsfs}\usepackage{upgreek}\setlength{\oddsidemargin}{-69pt}\begin{document}$$\hat{\beta }_s$$\end{document}
 \documentclass[12pt]{minimal}\usepackage{amsmath}\usepackage{wasysym}\usepackage{amsfonts}\usepackage{amssymb}\usepackage{amsbsy}\usepackage{mathrsfs}\usepackage{upgreek}\setlength{\oddsidemargin}{-69pt}\begin{document}$$=$$\end{document}
 \documentclass[12pt]{minimal}\usepackage{amsmath}\usepackage{wasysym}\usepackage{amsfonts}\usepackage{amssymb}\usepackage{amsbsy}\usepackage{mathrsfs}\usepackage{upgreek}\setlength{\oddsidemargin}{-69pt}\begin{document}$$(\hat{\lambda }_2-\hat{\lambda }_1)/(p_2-p_1)$$\end{document}
 and
\documentclass[12pt]{minimal}\usepackage{amsmath}\usepackage{wasysym}\usepackage{amsfonts}\usepackage{amssymb}\usepackage{amsbsy}\usepackage{mathrsfs}\usepackage{upgreek}\setlength{\oddsidemargin}{-69pt}\begin{document}$$\hat{\gamma }$$\end{document}
and
\documentclass[12pt]{minimal}\usepackage{amsmath}\usepackage{wasysym}\usepackage{amsfonts}\usepackage{amssymb}\usepackage{amsbsy}\usepackage{mathrsfs}\usepackage{upgreek}\setlength{\oddsidemargin}{-69pt}\begin{document}$$\hat{\gamma }$$\end{document}
 \documentclass[12pt]{minimal}\usepackage{amsmath}\usepackage{wasysym}\usepackage{amsfonts}\usepackage{amssymb}\usepackage{amsbsy}\usepackage{mathrsfs}\usepackage{upgreek}\setlength{\oddsidemargin}{-69pt}\begin{document}$$=$$\end{document}
 \documentclass[12pt]{minimal}\usepackage{amsmath}\usepackage{wasysym}\usepackage{amsfonts}\usepackage{amssymb}\usepackage{amsbsy}\usepackage{mathrsfs}\usepackage{upgreek}\setlength{\oddsidemargin}{-69pt}\begin{document}$$1-\hat{\pi }_s-\hat{\beta }_s$$\end{document}
 . Therefore, the variance of
\documentclass[12pt]{minimal}\usepackage{amsmath}\usepackage{wasysym}\usepackage{amsfonts}\usepackage{amssymb}\usepackage{amsbsy}\usepackage{mathrsfs}\usepackage{upgreek}\setlength{\oddsidemargin}{-69pt}\begin{document}$$\hat{\pi }_s$$\end{document}
. Therefore, the variance of
\documentclass[12pt]{minimal}\usepackage{amsmath}\usepackage{wasysym}\usepackage{amsfonts}\usepackage{amssymb}\usepackage{amsbsy}\usepackage{mathrsfs}\usepackage{upgreek}\setlength{\oddsidemargin}{-69pt}\begin{document}$$\hat{\pi }_s$$\end{document}
 is given by
\documentclass[12pt]{minimal}\usepackage{amsmath}\usepackage{wasysym}\usepackage{amsfonts}\usepackage{amssymb}\usepackage{amsbsy}\usepackage{mathrsfs}\usepackage{upgreek}\setlength{\oddsidemargin}{-69pt}\begin{document}$$\frac{p_2^2}{(p_2-p_1)^2}\cdot \frac{\lambda _1(1-\lambda _1)}{n_1}$$\end{document}
is given by
\documentclass[12pt]{minimal}\usepackage{amsmath}\usepackage{wasysym}\usepackage{amsfonts}\usepackage{amssymb}\usepackage{amsbsy}\usepackage{mathrsfs}\usepackage{upgreek}\setlength{\oddsidemargin}{-69pt}\begin{document}$$\frac{p_2^2}{(p_2-p_1)^2}\cdot \frac{\lambda _1(1-\lambda _1)}{n_1}$$\end{document}
 +
\documentclass[12pt]{minimal}\usepackage{amsmath}\usepackage{wasysym}\usepackage{amsfonts}\usepackage{amssymb}\usepackage{amsbsy}\usepackage{mathrsfs}\usepackage{upgreek}\setlength{\oddsidemargin}{-69pt}\begin{document}$$\frac{p_1^2}{(p_2-p_1)^2}\cdot \frac{\lambda _2(1-\lambda _2)}{n_2}$$\end{document}
+
\documentclass[12pt]{minimal}\usepackage{amsmath}\usepackage{wasysym}\usepackage{amsfonts}\usepackage{amssymb}\usepackage{amsbsy}\usepackage{mathrsfs}\usepackage{upgreek}\setlength{\oddsidemargin}{-69pt}\begin{document}$$\frac{p_1^2}{(p_2-p_1)^2}\cdot \frac{\lambda _2(1-\lambda _2)}{n_2}$$\end{document}
 . As a result, the
\documentclass[12pt]{minimal}\usepackage{amsmath}\usepackage{wasysym}\usepackage{amsfonts}\usepackage{amssymb}\usepackage{amsbsy}\usepackage{mathrsfs}\usepackage{upgreek}\setlength{\oddsidemargin}{-69pt}\begin{document}$$(1-\alpha )100\%$$\end{document}
. As a result, the
\documentclass[12pt]{minimal}\usepackage{amsmath}\usepackage{wasysym}\usepackage{amsfonts}\usepackage{amssymb}\usepackage{amsbsy}\usepackage{mathrsfs}\usepackage{upgreek}\setlength{\oddsidemargin}{-69pt}\begin{document}$$(1-\alpha )100\%$$\end{document}
 Wald confidence interval for
\documentclass[12pt]{minimal}\usepackage{amsmath}\usepackage{wasysym}\usepackage{amsfonts}\usepackage{amssymb}\usepackage{amsbsy}\usepackage{mathrsfs}\usepackage{upgreek}\setlength{\oddsidemargin}{-69pt}\begin{document}$$\pi _s$$\end{document}
Wald confidence interval for
\documentclass[12pt]{minimal}\usepackage{amsmath}\usepackage{wasysym}\usepackage{amsfonts}\usepackage{amssymb}\usepackage{amsbsy}\usepackage{mathrsfs}\usepackage{upgreek}\setlength{\oddsidemargin}{-69pt}\begin{document}$$\pi _s$$\end{document}
 is given by

where

and

Alternately, since
\documentclass[12pt]{minimal}\usepackage{amsmath}\usepackage{wasysym}\usepackage{amsfonts}\usepackage{amssymb}\usepackage{amsbsy}\usepackage{mathrsfs}\usepackage{upgreek}\setlength{\oddsidemargin}{-69pt}\begin{document}$$\pi _s$$\end{document}
 \documentclass[12pt]{minimal}\usepackage{amsmath}\usepackage{wasysym}\usepackage{amsfonts}\usepackage{amssymb}\usepackage{amsbsy}\usepackage{mathrsfs}\usepackage{upgreek}\setlength{\oddsidemargin}{-69pt}\begin{document}$$=$$\end{document}
 \documentclass[12pt]{minimal}\usepackage{amsmath}\usepackage{wasysym}\usepackage{amsfonts}\usepackage{amssymb}\usepackage{amsbsy}\usepackage{mathrsfs}\usepackage{upgreek}\setlength{\oddsidemargin}{-69pt}\begin{document}$$(p_2\lambda _1-p_1\lambda _2)/(p_2-p_1)$$\end{document}
 , we can first construct the Wilson confidence intervals for
\documentclass[12pt]{minimal}\usepackage{amsmath}\usepackage{wasysym}\usepackage{amsfonts}\usepackage{amssymb}\usepackage{amsbsy}\usepackage{mathrsfs}\usepackage{upgreek}\setlength{\oddsidemargin}{-69pt}\begin{document}$$\lambda _1$$\end{document}
, we can first construct the Wilson confidence intervals for
\documentclass[12pt]{minimal}\usepackage{amsmath}\usepackage{wasysym}\usepackage{amsfonts}\usepackage{amssymb}\usepackage{amsbsy}\usepackage{mathrsfs}\usepackage{upgreek}\setlength{\oddsidemargin}{-69pt}\begin{document}$$\lambda _1$$\end{document}
 and
\documentclass[12pt]{minimal}\usepackage{amsmath}\usepackage{wasysym}\usepackage{amsfonts}\usepackage{amssymb}\usepackage{amsbsy}\usepackage{mathrsfs}\usepackage{upgreek}\setlength{\oddsidemargin}{-69pt}\begin{document}$$\lambda _2$$\end{document}
and
\documentclass[12pt]{minimal}\usepackage{amsmath}\usepackage{wasysym}\usepackage{amsfonts}\usepackage{amssymb}\usepackage{amsbsy}\usepackage{mathrsfs}\usepackage{upgreek}\setlength{\oddsidemargin}{-69pt}\begin{document}$$\lambda _2$$\end{document}
 and subsequently obtain the confidence interval for
\documentclass[12pt]{minimal}\usepackage{amsmath}\usepackage{wasysym}\usepackage{amsfonts}\usepackage{amssymb}\usepackage{amsbsy}\usepackage{mathrsfs}\usepackage{upgreek}\setlength{\oddsidemargin}{-69pt}\begin{document}$$\pi _s$$\end{document}
and subsequently obtain the confidence interval for
\documentclass[12pt]{minimal}\usepackage{amsmath}\usepackage{wasysym}\usepackage{amsfonts}\usepackage{amssymb}\usepackage{amsbsy}\usepackage{mathrsfs}\usepackage{upgreek}\setlength{\oddsidemargin}{-69pt}\begin{document}$$\pi _s$$\end{document}
 via the method of variance estimates recovery (MOVER) proposed by Zou & Donner (Reference Zou and Donner2008). It is shown that the
\documentclass[12pt]{minimal}\usepackage{amsmath}\usepackage{wasysym}\usepackage{amsfonts}\usepackage{amssymb}\usepackage{amsbsy}\usepackage{mathrsfs}\usepackage{upgreek}\setlength{\oddsidemargin}{-69pt}\begin{document}$$(1-\alpha )100\%$$\end{document}
via the method of variance estimates recovery (MOVER) proposed by Zou & Donner (Reference Zou and Donner2008). It is shown that the
\documentclass[12pt]{minimal}\usepackage{amsmath}\usepackage{wasysym}\usepackage{amsfonts}\usepackage{amssymb}\usepackage{amsbsy}\usepackage{mathrsfs}\usepackage{upgreek}\setlength{\oddsidemargin}{-69pt}\begin{document}$$(1-\alpha )100\%$$\end{document}
 Wilson confidence lower and upper limits for
\documentclass[12pt]{minimal}\usepackage{amsmath}\usepackage{wasysym}\usepackage{amsfonts}\usepackage{amssymb}\usepackage{amsbsy}\usepackage{mathrsfs}\usepackage{upgreek}\setlength{\oddsidemargin}{-69pt}\begin{document}$$\lambda _i$$\end{document}
Wilson confidence lower and upper limits for
\documentclass[12pt]{minimal}\usepackage{amsmath}\usepackage{wasysym}\usepackage{amsfonts}\usepackage{amssymb}\usepackage{amsbsy}\usepackage{mathrsfs}\usepackage{upgreek}\setlength{\oddsidemargin}{-69pt}\begin{document}$$\lambda _i$$\end{document}
 can be obtained by


for i = 1,2.
By using MOVER proposed by Zou & Donner (Reference Zou and Donner2008), the
\documentclass[12pt]{minimal}\usepackage{amsmath}\usepackage{wasysym}\usepackage{amsfonts}\usepackage{amssymb}\usepackage{amsbsy}\usepackage{mathrsfs}\usepackage{upgreek}\setlength{\oddsidemargin}{-69pt}\begin{document}$$(1-\alpha )100\%$$\end{document}
 confidence interval for
\documentclass[12pt]{minimal}\usepackage{amsmath}\usepackage{wasysym}\usepackage{amsfonts}\usepackage{amssymb}\usepackage{amsbsy}\usepackage{mathrsfs}\usepackage{upgreek}\setlength{\oddsidemargin}{-69pt}\begin{document}$$\pi _s$$\end{document}
confidence interval for
\documentclass[12pt]{minimal}\usepackage{amsmath}\usepackage{wasysym}\usepackage{amsfonts}\usepackage{amssymb}\usepackage{amsbsy}\usepackage{mathrsfs}\usepackage{upgreek}\setlength{\oddsidemargin}{-69pt}\begin{document}$$\pi _s$$\end{document}
 is given by

where

and

1.4.2. Sample Size Formula Based on Wald Confidence Interval
\documentclass[12pt]{minimal}\usepackage{amsmath}\usepackage{wasysym}\usepackage{amsfonts}\usepackage{amssymb}\usepackage{amsbsy}\usepackage{mathrsfs}\usepackage{upgreek}\setlength{\oddsidemargin}{-69pt}\begin{document}$${{\varvec{[n_{CDM, W}}}}$$\end{document}
,
\documentclass[12pt]{minimal}\usepackage{amsmath}\usepackage{wasysym}\usepackage{amsfonts}\usepackage{amssymb}\usepackage{amsbsy}\usepackage{mathrsfs}\usepackage{upgreek}\setlength{\oddsidemargin}{-69pt}\begin{document}$${{\varvec{n_{CDM, W, 0.5}]}}}$$\end{document}


The half width of the
\documentclass[12pt]{minimal}\usepackage{amsmath}\usepackage{wasysym}\usepackage{amsfonts}\usepackage{amssymb}\usepackage{amsbsy}\usepackage{mathrsfs}\usepackage{upgreek}\setlength{\oddsidemargin}{-69pt}\begin{document}$$(1-\alpha )100\%$$\end{document}
 Wald CI is given by

To control the half width of the Wald CI to be no larger than
\documentclass[12pt]{minimal}\usepackage{amsmath}\usepackage{wasysym}\usepackage{amsfonts}\usepackage{amssymb}\usepackage{amsbsy}\usepackage{mathrsfs}\usepackage{upgreek}\setlength{\oddsidemargin}{-69pt}\begin{document}$$\omega $$\end{document}
 with probability
\documentclass[12pt]{minimal}\usepackage{amsmath}\usepackage{wasysym}\usepackage{amsfonts}\usepackage{amssymb}\usepackage{amsbsy}\usepackage{mathrsfs}\usepackage{upgreek}\setlength{\oddsidemargin}{-69pt}\begin{document}$$1-\beta $$\end{document}
with probability
\documentclass[12pt]{minimal}\usepackage{amsmath}\usepackage{wasysym}\usepackage{amsfonts}\usepackage{amssymb}\usepackage{amsbsy}\usepackage{mathrsfs}\usepackage{upgreek}\setlength{\oddsidemargin}{-69pt}\begin{document}$$1-\beta $$\end{document}
 , we have

Let A
\documentclass[12pt]{minimal}\usepackage{amsmath}\usepackage{wasysym}\usepackage{amsfonts}\usepackage{amssymb}\usepackage{amsbsy}\usepackage{mathrsfs}\usepackage{upgreek}\setlength{\oddsidemargin}{-69pt}\begin{document}$$=$$\end{document}
 \documentclass[12pt]{minimal}\usepackage{amsmath}\usepackage{wasysym}\usepackage{amsfonts}\usepackage{amssymb}\usepackage{amsbsy}\usepackage{mathrsfs}\usepackage{upgreek}\setlength{\oddsidemargin}{-69pt}\begin{document}$$p_2^2/n_1$$\end{document}
 , B
\documentclass[12pt]{minimal}\usepackage{amsmath}\usepackage{wasysym}\usepackage{amsfonts}\usepackage{amssymb}\usepackage{amsbsy}\usepackage{mathrsfs}\usepackage{upgreek}\setlength{\oddsidemargin}{-69pt}\begin{document}$$=$$\end{document}
, B
\documentclass[12pt]{minimal}\usepackage{amsmath}\usepackage{wasysym}\usepackage{amsfonts}\usepackage{amssymb}\usepackage{amsbsy}\usepackage{mathrsfs}\usepackage{upgreek}\setlength{\oddsidemargin}{-69pt}\begin{document}$$=$$\end{document}
 \documentclass[12pt]{minimal}\usepackage{amsmath}\usepackage{wasysym}\usepackage{amsfonts}\usepackage{amssymb}\usepackage{amsbsy}\usepackage{mathrsfs}\usepackage{upgreek}\setlength{\oddsidemargin}{-69pt}\begin{document}$$p_1^2/n_2$$\end{document}
 and C
\documentclass[12pt]{minimal}\usepackage{amsmath}\usepackage{wasysym}\usepackage{amsfonts}\usepackage{amssymb}\usepackage{amsbsy}\usepackage{mathrsfs}\usepackage{upgreek}\setlength{\oddsidemargin}{-69pt}\begin{document}$$=$$\end{document}
and C
\documentclass[12pt]{minimal}\usepackage{amsmath}\usepackage{wasysym}\usepackage{amsfonts}\usepackage{amssymb}\usepackage{amsbsy}\usepackage{mathrsfs}\usepackage{upgreek}\setlength{\oddsidemargin}{-69pt}\begin{document}$$=$$\end{document}
 \documentclass[12pt]{minimal}\usepackage{amsmath}\usepackage{wasysym}\usepackage{amsfonts}\usepackage{amssymb}\usepackage{amsbsy}\usepackage{mathrsfs}\usepackage{upgreek}\setlength{\oddsidemargin}{-69pt}\begin{document}$$\omega |p_2-p_1|/z_{\alpha /2}$$\end{document}
 , then we have

Similarly, it is clear that

Therefore, we have

If
\documentclass[12pt]{minimal}\usepackage{amsmath}\usepackage{wasysym}\usepackage{amsfonts}\usepackage{amssymb}\usepackage{amsbsy}\usepackage{mathrsfs}\usepackage{upgreek}\setlength{\oddsidemargin}{-69pt}\begin{document}$$n_1$$\end{document}
 \documentclass[12pt]{minimal}\usepackage{amsmath}\usepackage{wasysym}\usepackage{amsfonts}\usepackage{amssymb}\usepackage{amsbsy}\usepackage{mathrsfs}\usepackage{upgreek}\setlength{\oddsidemargin}{-69pt}\begin{document}$$=$$\end{document}
 \documentclass[12pt]{minimal}\usepackage{amsmath}\usepackage{wasysym}\usepackage{amsfonts}\usepackage{amssymb}\usepackage{amsbsy}\usepackage{mathrsfs}\usepackage{upgreek}\setlength{\oddsidemargin}{-69pt}\begin{document}$$n_2$$\end{document}
 \documentclass[12pt]{minimal}\usepackage{amsmath}\usepackage{wasysym}\usepackage{amsfonts}\usepackage{amssymb}\usepackage{amsbsy}\usepackage{mathrsfs}\usepackage{upgreek}\setlength{\oddsidemargin}{-69pt}\begin{document}$$=$$\end{document}
 \documentclass[12pt]{minimal}\usepackage{amsmath}\usepackage{wasysym}\usepackage{amsfonts}\usepackage{amssymb}\usepackage{amsbsy}\usepackage{mathrsfs}\usepackage{upgreek}\setlength{\oddsidemargin}{-69pt}\begin{document}$$\frac{1}{2}n$$\end{document}
 , the above equation can be simplified as

where
\documentclass[12pt]{minimal}\usepackage{amsmath}\usepackage{wasysym}\usepackage{amsfonts}\usepackage{amssymb}\usepackage{amsbsy}\usepackage{mathrsfs}\usepackage{upgreek}\setlength{\oddsidemargin}{-69pt}\begin{document}$$D=p_2^2\lambda _1(1-\lambda _1)+p_1^2\lambda _2(1-\lambda _2)$$\end{document}
 and E
\documentclass[12pt]{minimal}\usepackage{amsmath}\usepackage{wasysym}\usepackage{amsfonts}\usepackage{amssymb}\usepackage{amsbsy}\usepackage{mathrsfs}\usepackage{upgreek}\setlength{\oddsidemargin}{-69pt}\begin{document}$$=$$\end{document}
and E
\documentclass[12pt]{minimal}\usepackage{amsmath}\usepackage{wasysym}\usepackage{amsfonts}\usepackage{amssymb}\usepackage{amsbsy}\usepackage{mathrsfs}\usepackage{upgreek}\setlength{\oddsidemargin}{-69pt}\begin{document}$$=$$\end{document}
 \documentclass[12pt]{minimal}\usepackage{amsmath}\usepackage{wasysym}\usepackage{amsfonts}\usepackage{amssymb}\usepackage{amsbsy}\usepackage{mathrsfs}\usepackage{upgreek}\setlength{\oddsidemargin}{-69pt}\begin{document}$$p_2^4\lambda _1(1-\lambda _1)(1-2\lambda _1)^2$$\end{document}
 \documentclass[12pt]{minimal}\usepackage{amsmath}\usepackage{wasysym}\usepackage{amsfonts}\usepackage{amssymb}\usepackage{amsbsy}\usepackage{mathrsfs}\usepackage{upgreek}\setlength{\oddsidemargin}{-69pt}\begin{document}$$+$$\end{document}
 \documentclass[12pt]{minimal}\usepackage{amsmath}\usepackage{wasysym}\usepackage{amsfonts}\usepackage{amssymb}\usepackage{amsbsy}\usepackage{mathrsfs}\usepackage{upgreek}\setlength{\oddsidemargin}{-69pt}\begin{document}$$p_1^4\lambda _2(1-\lambda _2)$$\end{document}
 \documentclass[12pt]{minimal}\usepackage{amsmath}\usepackage{wasysym}\usepackage{amsfonts}\usepackage{amssymb}\usepackage{amsbsy}\usepackage{mathrsfs}\usepackage{upgreek}\setlength{\oddsidemargin}{-69pt}\begin{document}$$(1-2\lambda _2)^2$$\end{document}
 . By using Cardans formula for solving the cubic equation, we can obtain the solutions and the desired sample size is the minimum integer that is not smaller than the unique real root or the maximum root of three real roots. The estimated sample size is denoted as
\documentclass[12pt]{minimal}\usepackage{amsmath}\usepackage{wasysym}\usepackage{amsfonts}\usepackage{amssymb}\usepackage{amsbsy}\usepackage{mathrsfs}\usepackage{upgreek}\setlength{\oddsidemargin}{-69pt}\begin{document}$${{\varvec{n_{CDM, W}}}}$$\end{document}
. By using Cardans formula for solving the cubic equation, we can obtain the solutions and the desired sample size is the minimum integer that is not smaller than the unique real root or the maximum root of three real roots. The estimated sample size is denoted as
\documentclass[12pt]{minimal}\usepackage{amsmath}\usepackage{wasysym}\usepackage{amsfonts}\usepackage{amssymb}\usepackage{amsbsy}\usepackage{mathrsfs}\usepackage{upgreek}\setlength{\oddsidemargin}{-69pt}\begin{document}$${{\varvec{n_{CDM, W}}}}$$\end{document}
 .
.
When
\documentclass[12pt]{minimal}\usepackage{amsmath}\usepackage{wasysym}\usepackage{amsfonts}\usepackage{amssymb}\usepackage{amsbsy}\usepackage{mathrsfs}\usepackage{upgreek}\setlength{\oddsidemargin}{-69pt}\begin{document}$$\beta $$\end{document}
 \documentclass[12pt]{minimal}\usepackage{amsmath}\usepackage{wasysym}\usepackage{amsfonts}\usepackage{amssymb}\usepackage{amsbsy}\usepackage{mathrsfs}\usepackage{upgreek}\setlength{\oddsidemargin}{-69pt}\begin{document}$$=$$\end{document}
 0.5, the formula reduces to be

1.4.3. Sample Size Formula Based on Wilson Confidence Interval
\documentclass[12pt]{minimal}\usepackage{amsmath}\usepackage{wasysym}\usepackage{amsfonts}\usepackage{amssymb}\usepackage{amsbsy}\usepackage{mathrsfs}\usepackage{upgreek}\setlength{\oddsidemargin}{-69pt}\begin{document}$${{\varvec{[n_{CDM, Wi}}}}$$\end{document}
,
\documentclass[12pt]{minimal}\usepackage{amsmath}\usepackage{wasysym}\usepackage{amsfonts}\usepackage{amssymb}\usepackage{amsbsy}\usepackage{mathrsfs}\usepackage{upgreek}\setlength{\oddsidemargin}{-69pt}\begin{document}$${{\varvec{n_{CDM, Wi, 0.5}]}}}$$\end{document}


The width of the
\documentclass[12pt]{minimal}\usepackage{amsmath}\usepackage{wasysym}\usepackage{amsfonts}\usepackage{amssymb}\usepackage{amsbsy}\usepackage{mathrsfs}\usepackage{upgreek}\setlength{\oddsidemargin}{-69pt}\begin{document}$$(1-\alpha )100\%$$\end{document}
 Wilson CI is given by

To control the width of the Wilson CI to be no larger than
\documentclass[12pt]{minimal}\usepackage{amsmath}\usepackage{wasysym}\usepackage{amsfonts}\usepackage{amssymb}\usepackage{amsbsy}\usepackage{mathrsfs}\usepackage{upgreek}\setlength{\oddsidemargin}{-69pt}\begin{document}$$2\omega $$\end{document}
 with probability
\documentclass[12pt]{minimal}\usepackage{amsmath}\usepackage{wasysym}\usepackage{amsfonts}\usepackage{amssymb}\usepackage{amsbsy}\usepackage{mathrsfs}\usepackage{upgreek}\setlength{\oddsidemargin}{-69pt}\begin{document}$$1-\beta $$\end{document}
with probability
\documentclass[12pt]{minimal}\usepackage{amsmath}\usepackage{wasysym}\usepackage{amsfonts}\usepackage{amssymb}\usepackage{amsbsy}\usepackage{mathrsfs}\usepackage{upgreek}\setlength{\oddsidemargin}{-69pt}\begin{document}$$1-\beta $$\end{document}
 , we have

Let a
\documentclass[12pt]{minimal}\usepackage{amsmath}\usepackage{wasysym}\usepackage{amsfonts}\usepackage{amssymb}\usepackage{amsbsy}\usepackage{mathrsfs}\usepackage{upgreek}\setlength{\oddsidemargin}{-69pt}\begin{document}$$=$$\end{document}
 \documentclass[12pt]{minimal}\usepackage{amsmath}\usepackage{wasysym}\usepackage{amsfonts}\usepackage{amssymb}\usepackage{amsbsy}\usepackage{mathrsfs}\usepackage{upgreek}\setlength{\oddsidemargin}{-69pt}\begin{document}$$p_2^2(\bar{u}_1-\lambda _1)^2$$\end{document}
 \documentclass[12pt]{minimal}\usepackage{amsmath}\usepackage{wasysym}\usepackage{amsfonts}\usepackage{amssymb}\usepackage{amsbsy}\usepackage{mathrsfs}\usepackage{upgreek}\setlength{\oddsidemargin}{-69pt}\begin{document}$$+$$\end{document}
 \documentclass[12pt]{minimal}\usepackage{amsmath}\usepackage{wasysym}\usepackage{amsfonts}\usepackage{amssymb}\usepackage{amsbsy}\usepackage{mathrsfs}\usepackage{upgreek}\setlength{\oddsidemargin}{-69pt}\begin{document}$$p_1^2(\lambda _2-\bar{l}_2)^2$$\end{document}
 , b
\documentclass[12pt]{minimal}\usepackage{amsmath}\usepackage{wasysym}\usepackage{amsfonts}\usepackage{amssymb}\usepackage{amsbsy}\usepackage{mathrsfs}\usepackage{upgreek}\setlength{\oddsidemargin}{-69pt}\begin{document}$$=$$\end{document}
, b
\documentclass[12pt]{minimal}\usepackage{amsmath}\usepackage{wasysym}\usepackage{amsfonts}\usepackage{amssymb}\usepackage{amsbsy}\usepackage{mathrsfs}\usepackage{upgreek}\setlength{\oddsidemargin}{-69pt}\begin{document}$$=$$\end{document}
 \documentclass[12pt]{minimal}\usepackage{amsmath}\usepackage{wasysym}\usepackage{amsfonts}\usepackage{amssymb}\usepackage{amsbsy}\usepackage{mathrsfs}\usepackage{upgreek}\setlength{\oddsidemargin}{-69pt}\begin{document}$$p_2^2(\lambda _1-\bar{l}_1)^2$$\end{document}
 \documentclass[12pt]{minimal}\usepackage{amsmath}\usepackage{wasysym}\usepackage{amsfonts}\usepackage{amssymb}\usepackage{amsbsy}\usepackage{mathrsfs}\usepackage{upgreek}\setlength{\oddsidemargin}{-69pt}\begin{document}$$+$$\end{document}
 \documentclass[12pt]{minimal}\usepackage{amsmath}\usepackage{wasysym}\usepackage{amsfonts}\usepackage{amssymb}\usepackage{amsbsy}\usepackage{mathrsfs}\usepackage{upgreek}\setlength{\oddsidemargin}{-69pt}\begin{document}$$p_1^2(\bar{u}_2-\lambda _2)^2$$\end{document}
 with
with

and c
\documentclass[12pt]{minimal}\usepackage{amsmath}\usepackage{wasysym}\usepackage{amsfonts}\usepackage{amssymb}\usepackage{amsbsy}\usepackage{mathrsfs}\usepackage{upgreek}\setlength{\oddsidemargin}{-69pt}\begin{document}$$=$$\end{document}
 \documentclass[12pt]{minimal}\usepackage{amsmath}\usepackage{wasysym}\usepackage{amsfonts}\usepackage{amssymb}\usepackage{amsbsy}\usepackage{mathrsfs}\usepackage{upgreek}\setlength{\oddsidemargin}{-69pt}\begin{document}$$n_1\lambda _1(1-\lambda _1)+z_{\alpha /2}^2/4$$\end{document}
 , d
\documentclass[12pt]{minimal}\usepackage{amsmath}\usepackage{wasysym}\usepackage{amsfonts}\usepackage{amssymb}\usepackage{amsbsy}\usepackage{mathrsfs}\usepackage{upgreek}\setlength{\oddsidemargin}{-69pt}\begin{document}$$=$$\end{document}
, d
\documentclass[12pt]{minimal}\usepackage{amsmath}\usepackage{wasysym}\usepackage{amsfonts}\usepackage{amssymb}\usepackage{amsbsy}\usepackage{mathrsfs}\usepackage{upgreek}\setlength{\oddsidemargin}{-69pt}\begin{document}$$=$$\end{document}
 \documentclass[12pt]{minimal}\usepackage{amsmath}\usepackage{wasysym}\usepackage{amsfonts}\usepackage{amssymb}\usepackage{amsbsy}\usepackage{mathrsfs}\usepackage{upgreek}\setlength{\oddsidemargin}{-69pt}\begin{document}$$n_2\lambda _2(1-\lambda _2)+z_{\alpha /2}^2/4$$\end{document}
 , e
\documentclass[12pt]{minimal}\usepackage{amsmath}\usepackage{wasysym}\usepackage{amsfonts}\usepackage{amssymb}\usepackage{amsbsy}\usepackage{mathrsfs}\usepackage{upgreek}\setlength{\oddsidemargin}{-69pt}\begin{document}$$=$$\end{document}
, e
\documentclass[12pt]{minimal}\usepackage{amsmath}\usepackage{wasysym}\usepackage{amsfonts}\usepackage{amssymb}\usepackage{amsbsy}\usepackage{mathrsfs}\usepackage{upgreek}\setlength{\oddsidemargin}{-69pt}\begin{document}$$=$$\end{document}
 \documentclass[12pt]{minimal}\usepackage{amsmath}\usepackage{wasysym}\usepackage{amsfonts}\usepackage{amssymb}\usepackage{amsbsy}\usepackage{mathrsfs}\usepackage{upgreek}\setlength{\oddsidemargin}{-69pt}\begin{document}$$[p_2^2(u_1-\hat{\lambda }_1)^2+p_1^2(\hat{\lambda }_2-l_2)^2]^{1/2}$$\end{document}
 \documentclass[12pt]{minimal}\usepackage{amsmath}\usepackage{wasysym}\usepackage{amsfonts}\usepackage{amssymb}\usepackage{amsbsy}\usepackage{mathrsfs}\usepackage{upgreek}\setlength{\oddsidemargin}{-69pt}\begin{document}$$+$$\end{document}
 \documentclass[12pt]{minimal}\usepackage{amsmath}\usepackage{wasysym}\usepackage{amsfonts}\usepackage{amssymb}\usepackage{amsbsy}\usepackage{mathrsfs}\usepackage{upgreek}\setlength{\oddsidemargin}{-69pt}\begin{document}$$[p_2^2(\hat{\lambda }_1-l_1)^2+p_1^2(u_2-\hat{\lambda }_2)^2]^{1/2}$$\end{document}
 . It is shown that the variance of e is given by

i.e.,

Equation (28) can be re-written as

Therefore, we have

When
\documentclass[12pt]{minimal}\usepackage{amsmath}\usepackage{wasysym}\usepackage{amsfonts}\usepackage{amssymb}\usepackage{amsbsy}\usepackage{mathrsfs}\usepackage{upgreek}\setlength{\oddsidemargin}{-69pt}\begin{document}$$\beta $$\end{document}
 \documentclass[12pt]{minimal}\usepackage{amsmath}\usepackage{wasysym}\usepackage{amsfonts}\usepackage{amssymb}\usepackage{amsbsy}\usepackage{mathrsfs}\usepackage{upgreek}\setlength{\oddsidemargin}{-69pt}\begin{document}$$=$$\end{document}
 0.5, the equation is given as

If
\documentclass[12pt]{minimal}\usepackage{amsmath}\usepackage{wasysym}\usepackage{amsfonts}\usepackage{amssymb}\usepackage{amsbsy}\usepackage{mathrsfs}\usepackage{upgreek}\setlength{\oddsidemargin}{-69pt}\begin{document}$$n_1$$\end{document}
 \documentclass[12pt]{minimal}\usepackage{amsmath}\usepackage{wasysym}\usepackage{amsfonts}\usepackage{amssymb}\usepackage{amsbsy}\usepackage{mathrsfs}\usepackage{upgreek}\setlength{\oddsidemargin}{-69pt}\begin{document}$$=$$\end{document}
 \documentclass[12pt]{minimal}\usepackage{amsmath}\usepackage{wasysym}\usepackage{amsfonts}\usepackage{amssymb}\usepackage{amsbsy}\usepackage{mathrsfs}\usepackage{upgreek}\setlength{\oddsidemargin}{-69pt}\begin{document}$$n_2$$\end{document}
 \documentclass[12pt]{minimal}\usepackage{amsmath}\usepackage{wasysym}\usepackage{amsfonts}\usepackage{amssymb}\usepackage{amsbsy}\usepackage{mathrsfs}\usepackage{upgreek}\setlength{\oddsidemargin}{-69pt}\begin{document}$$=$$\end{document}
 \documentclass[12pt]{minimal}\usepackage{amsmath}\usepackage{wasysym}\usepackage{amsfonts}\usepackage{amssymb}\usepackage{amsbsy}\usepackage{mathrsfs}\usepackage{upgreek}\setlength{\oddsidemargin}{-69pt}\begin{document}$$\frac{1}{2}n$$\end{document}
 , the desired sample sizes can be obtained by solving Eqs. (29) or (30) via the secant method. The desired sample sizes are estimated to be the minimum integer that is not smaller than the maximum real root of Eqs. (29) or (30), respectively. The corresponding estimated sample sizes (i.e., the values of n) are denoted as
\documentclass[12pt]{minimal}\usepackage{amsmath}\usepackage{wasysym}\usepackage{amsfonts}\usepackage{amssymb}\usepackage{amsbsy}\usepackage{mathrsfs}\usepackage{upgreek}\setlength{\oddsidemargin}{-69pt}\begin{document}$${{\varvec{n_{CDM, Wi}}}}$$\end{document}
, the desired sample sizes can be obtained by solving Eqs. (29) or (30) via the secant method. The desired sample sizes are estimated to be the minimum integer that is not smaller than the maximum real root of Eqs. (29) or (30), respectively. The corresponding estimated sample sizes (i.e., the values of n) are denoted as
\documentclass[12pt]{minimal}\usepackage{amsmath}\usepackage{wasysym}\usepackage{amsfonts}\usepackage{amssymb}\usepackage{amsbsy}\usepackage{mathrsfs}\usepackage{upgreek}\setlength{\oddsidemargin}{-69pt}\begin{document}$${{\varvec{n_{CDM, Wi}}}}$$\end{document}
 and
\documentclass[12pt]{minimal}\usepackage{amsmath}\usepackage{wasysym}\usepackage{amsfonts}\usepackage{amssymb}\usepackage{amsbsy}\usepackage{mathrsfs}\usepackage{upgreek}\setlength{\oddsidemargin}{-69pt}\begin{document}$${{\varvec{n_{CDM, Wi, 0.5}}}}$$\end{document}
and
\documentclass[12pt]{minimal}\usepackage{amsmath}\usepackage{wasysym}\usepackage{amsfonts}\usepackage{amssymb}\usepackage{amsbsy}\usepackage{mathrsfs}\usepackage{upgreek}\setlength{\oddsidemargin}{-69pt}\begin{document}$${{\varvec{n_{CDM, Wi, 0.5}}}}$$\end{document}
 , respectively.
2. Evaluation
To evaluate the formulas proposed in this article, we consider the following parameter settings for different models:
(a) Warner model: (1) p
\documentclass[12pt]{minimal}\usepackage{amsmath}\usepackage{wasysym}\usepackage{amsfonts}\usepackage{amssymb}\usepackage{amsbsy}\usepackage{mathrsfs}\usepackage{upgreek}\setlength{\oddsidemargin}{-69pt}\begin{document}$$=$$\end{document}
 0.3, 0.6, 0.8; (2)
\documentclass[12pt]{minimal}\usepackage{amsmath}\usepackage{wasysym}\usepackage{amsfonts}\usepackage{amssymb}\usepackage{amsbsy}\usepackage{mathrsfs}\usepackage{upgreek}\setlength{\oddsidemargin}{-69pt}\begin{document}$$\pi _s$$\end{document}
0.3, 0.6, 0.8; (2)
\documentclass[12pt]{minimal}\usepackage{amsmath}\usepackage{wasysym}\usepackage{amsfonts}\usepackage{amssymb}\usepackage{amsbsy}\usepackage{mathrsfs}\usepackage{upgreek}\setlength{\oddsidemargin}{-69pt}\begin{document}$$\pi _s$$\end{document}
 \documentclass[12pt]{minimal}\usepackage{amsmath}\usepackage{wasysym}\usepackage{amsfonts}\usepackage{amssymb}\usepackage{amsbsy}\usepackage{mathrsfs}\usepackage{upgreek}\setlength{\oddsidemargin}{-69pt}\begin{document}$$=$$\end{document}
 0.04(0.04)0.16; (3)
\documentclass[12pt]{minimal}\usepackage{amsmath}\usepackage{wasysym}\usepackage{amsfonts}\usepackage{amssymb}\usepackage{amsbsy}\usepackage{mathrsfs}\usepackage{upgreek}\setlength{\oddsidemargin}{-69pt}\begin{document}$$\omega $$\end{document}
0.04(0.04)0.16; (3)
\documentclass[12pt]{minimal}\usepackage{amsmath}\usepackage{wasysym}\usepackage{amsfonts}\usepackage{amssymb}\usepackage{amsbsy}\usepackage{mathrsfs}\usepackage{upgreek}\setlength{\oddsidemargin}{-69pt}\begin{document}$$\omega $$\end{document}
 \documentclass[12pt]{minimal}\usepackage{amsmath}\usepackage{wasysym}\usepackage{amsfonts}\usepackage{amssymb}\usepackage{amsbsy}\usepackage{mathrsfs}\usepackage{upgreek}\setlength{\oddsidemargin}{-69pt}\begin{document}$$=$$\end{document}
 \documentclass[12pt]{minimal}\usepackage{amsmath}\usepackage{wasysym}\usepackage{amsfonts}\usepackage{amssymb}\usepackage{amsbsy}\usepackage{mathrsfs}\usepackage{upgreek}\setlength{\oddsidemargin}{-69pt}\begin{document}$$25\%$$\end{document}
 or
\documentclass[12pt]{minimal}\usepackage{amsmath}\usepackage{wasysym}\usepackage{amsfonts}\usepackage{amssymb}\usepackage{amsbsy}\usepackage{mathrsfs}\usepackage{upgreek}\setlength{\oddsidemargin}{-69pt}\begin{document}$$50\%$$\end{document}
or
\documentclass[12pt]{minimal}\usepackage{amsmath}\usepackage{wasysym}\usepackage{amsfonts}\usepackage{amssymb}\usepackage{amsbsy}\usepackage{mathrsfs}\usepackage{upgreek}\setlength{\oddsidemargin}{-69pt}\begin{document}$$50\%$$\end{document}
 of
\documentclass[12pt]{minimal}\usepackage{amsmath}\usepackage{wasysym}\usepackage{amsfonts}\usepackage{amssymb}\usepackage{amsbsy}\usepackage{mathrsfs}\usepackage{upgreek}\setlength{\oddsidemargin}{-69pt}\begin{document}$$\pi _s$$\end{document}
of
\documentclass[12pt]{minimal}\usepackage{amsmath}\usepackage{wasysym}\usepackage{amsfonts}\usepackage{amssymb}\usepackage{amsbsy}\usepackage{mathrsfs}\usepackage{upgreek}\setlength{\oddsidemargin}{-69pt}\begin{document}$$\pi _s$$\end{document}
 ; i.e., a total of 3
\documentclass[12pt]{minimal}\usepackage{amsmath}\usepackage{wasysym}\usepackage{amsfonts}\usepackage{amssymb}\usepackage{amsbsy}\usepackage{mathrsfs}\usepackage{upgreek}\setlength{\oddsidemargin}{-69pt}\begin{document}$$\times $$\end{document}
; i.e., a total of 3
\documentclass[12pt]{minimal}\usepackage{amsmath}\usepackage{wasysym}\usepackage{amsfonts}\usepackage{amssymb}\usepackage{amsbsy}\usepackage{mathrsfs}\usepackage{upgreek}\setlength{\oddsidemargin}{-69pt}\begin{document}$$\times $$\end{document}
 4
\documentclass[12pt]{minimal}\usepackage{amsmath}\usepackage{wasysym}\usepackage{amsfonts}\usepackage{amssymb}\usepackage{amsbsy}\usepackage{mathrsfs}\usepackage{upgreek}\setlength{\oddsidemargin}{-69pt}\begin{document}$$\times $$\end{document}
4
\documentclass[12pt]{minimal}\usepackage{amsmath}\usepackage{wasysym}\usepackage{amsfonts}\usepackage{amssymb}\usepackage{amsbsy}\usepackage{mathrsfs}\usepackage{upgreek}\setlength{\oddsidemargin}{-69pt}\begin{document}$$\times $$\end{document}
 2
\documentclass[12pt]{minimal}\usepackage{amsmath}\usepackage{wasysym}\usepackage{amsfonts}\usepackage{amssymb}\usepackage{amsbsy}\usepackage{mathrsfs}\usepackage{upgreek}\setlength{\oddsidemargin}{-69pt}\begin{document}$$=$$\end{document}
2
\documentclass[12pt]{minimal}\usepackage{amsmath}\usepackage{wasysym}\usepackage{amsfonts}\usepackage{amssymb}\usepackage{amsbsy}\usepackage{mathrsfs}\usepackage{upgreek}\setlength{\oddsidemargin}{-69pt}\begin{document}$$=$$\end{document}
 24 parameter combinations.
(b) Unrelated question model:
\documentclass[12pt]{minimal}\usepackage{amsmath}\usepackage{wasysym}\usepackage{amsfonts}\usepackage{amssymb}\usepackage{amsbsy}\usepackage{mathrsfs}\usepackage{upgreek}\setlength{\oddsidemargin}{-69pt}\begin{document}$$p=0.75$$\end{document}
 and (1)
\documentclass[12pt]{minimal}\usepackage{amsmath}\usepackage{wasysym}\usepackage{amsfonts}\usepackage{amssymb}\usepackage{amsbsy}\usepackage{mathrsfs}\usepackage{upgreek}\setlength{\oddsidemargin}{-69pt}\begin{document}$$\pi _N$$\end{document}
and (1)
\documentclass[12pt]{minimal}\usepackage{amsmath}\usepackage{wasysym}\usepackage{amsfonts}\usepackage{amssymb}\usepackage{amsbsy}\usepackage{mathrsfs}\usepackage{upgreek}\setlength{\oddsidemargin}{-69pt}\begin{document}$$\pi _N$$\end{document}
 \documentclass[12pt]{minimal}\usepackage{amsmath}\usepackage{wasysym}\usepackage{amsfonts}\usepackage{amssymb}\usepackage{amsbsy}\usepackage{mathrsfs}\usepackage{upgreek}\setlength{\oddsidemargin}{-69pt}\begin{document}$$=$$\end{document}
 0.2(0.3)0.8; (2)
\documentclass[12pt]{minimal}\usepackage{amsmath}\usepackage{wasysym}\usepackage{amsfonts}\usepackage{amssymb}\usepackage{amsbsy}\usepackage{mathrsfs}\usepackage{upgreek}\setlength{\oddsidemargin}{-69pt}\begin{document}$$\pi _s$$\end{document}
0.2(0.3)0.8; (2)
\documentclass[12pt]{minimal}\usepackage{amsmath}\usepackage{wasysym}\usepackage{amsfonts}\usepackage{amssymb}\usepackage{amsbsy}\usepackage{mathrsfs}\usepackage{upgreek}\setlength{\oddsidemargin}{-69pt}\begin{document}$$\pi _s$$\end{document}
 \documentclass[12pt]{minimal}\usepackage{amsmath}\usepackage{wasysym}\usepackage{amsfonts}\usepackage{amssymb}\usepackage{amsbsy}\usepackage{mathrsfs}\usepackage{upgreek}\setlength{\oddsidemargin}{-69pt}\begin{document}$$=$$\end{document}
 0.04(0.04)0.16; (3)
\documentclass[12pt]{minimal}\usepackage{amsmath}\usepackage{wasysym}\usepackage{amsfonts}\usepackage{amssymb}\usepackage{amsbsy}\usepackage{mathrsfs}\usepackage{upgreek}\setlength{\oddsidemargin}{-69pt}\begin{document}$$\omega $$\end{document}
0.04(0.04)0.16; (3)
\documentclass[12pt]{minimal}\usepackage{amsmath}\usepackage{wasysym}\usepackage{amsfonts}\usepackage{amssymb}\usepackage{amsbsy}\usepackage{mathrsfs}\usepackage{upgreek}\setlength{\oddsidemargin}{-69pt}\begin{document}$$\omega $$\end{document}
 \documentclass[12pt]{minimal}\usepackage{amsmath}\usepackage{wasysym}\usepackage{amsfonts}\usepackage{amssymb}\usepackage{amsbsy}\usepackage{mathrsfs}\usepackage{upgreek}\setlength{\oddsidemargin}{-69pt}\begin{document}$$=$$\end{document}
 \documentclass[12pt]{minimal}\usepackage{amsmath}\usepackage{wasysym}\usepackage{amsfonts}\usepackage{amssymb}\usepackage{amsbsy}\usepackage{mathrsfs}\usepackage{upgreek}\setlength{\oddsidemargin}{-69pt}\begin{document}$$25\%$$\end{document}
 or
\documentclass[12pt]{minimal}\usepackage{amsmath}\usepackage{wasysym}\usepackage{amsfonts}\usepackage{amssymb}\usepackage{amsbsy}\usepackage{mathrsfs}\usepackage{upgreek}\setlength{\oddsidemargin}{-69pt}\begin{document}$$50\%$$\end{document}
or
\documentclass[12pt]{minimal}\usepackage{amsmath}\usepackage{wasysym}\usepackage{amsfonts}\usepackage{amssymb}\usepackage{amsbsy}\usepackage{mathrsfs}\usepackage{upgreek}\setlength{\oddsidemargin}{-69pt}\begin{document}$$50\%$$\end{document}
 of
\documentclass[12pt]{minimal}\usepackage{amsmath}\usepackage{wasysym}\usepackage{amsfonts}\usepackage{amssymb}\usepackage{amsbsy}\usepackage{mathrsfs}\usepackage{upgreek}\setlength{\oddsidemargin}{-69pt}\begin{document}$$\pi _s$$\end{document}
of
\documentclass[12pt]{minimal}\usepackage{amsmath}\usepackage{wasysym}\usepackage{amsfonts}\usepackage{amssymb}\usepackage{amsbsy}\usepackage{mathrsfs}\usepackage{upgreek}\setlength{\oddsidemargin}{-69pt}\begin{document}$$\pi _s$$\end{document}
 ; i.e., a total of 3
\documentclass[12pt]{minimal}\usepackage{amsmath}\usepackage{wasysym}\usepackage{amsfonts}\usepackage{amssymb}\usepackage{amsbsy}\usepackage{mathrsfs}\usepackage{upgreek}\setlength{\oddsidemargin}{-69pt}\begin{document}$$\times $$\end{document}
; i.e., a total of 3
\documentclass[12pt]{minimal}\usepackage{amsmath}\usepackage{wasysym}\usepackage{amsfonts}\usepackage{amssymb}\usepackage{amsbsy}\usepackage{mathrsfs}\usepackage{upgreek}\setlength{\oddsidemargin}{-69pt}\begin{document}$$\times $$\end{document}
 4
\documentclass[12pt]{minimal}\usepackage{amsmath}\usepackage{wasysym}\usepackage{amsfonts}\usepackage{amssymb}\usepackage{amsbsy}\usepackage{mathrsfs}\usepackage{upgreek}\setlength{\oddsidemargin}{-69pt}\begin{document}$$\times $$\end{document}
4
\documentclass[12pt]{minimal}\usepackage{amsmath}\usepackage{wasysym}\usepackage{amsfonts}\usepackage{amssymb}\usepackage{amsbsy}\usepackage{mathrsfs}\usepackage{upgreek}\setlength{\oddsidemargin}{-69pt}\begin{document}$$\times $$\end{document}
 2
\documentclass[12pt]{minimal}\usepackage{amsmath}\usepackage{wasysym}\usepackage{amsfonts}\usepackage{amssymb}\usepackage{amsbsy}\usepackage{mathrsfs}\usepackage{upgreek}\setlength{\oddsidemargin}{-69pt}\begin{document}$$=$$\end{document}
2
\documentclass[12pt]{minimal}\usepackage{amsmath}\usepackage{wasysym}\usepackage{amsfonts}\usepackage{amssymb}\usepackage{amsbsy}\usepackage{mathrsfs}\usepackage{upgreek}\setlength{\oddsidemargin}{-69pt}\begin{document}$$=$$\end{document}
 24 parameter combinations.
(c) Item count technique: (2) k
\documentclass[12pt]{minimal}\usepackage{amsmath}\usepackage{wasysym}\usepackage{amsfonts}\usepackage{amssymb}\usepackage{amsbsy}\usepackage{mathrsfs}\usepackage{upgreek}\setlength{\oddsidemargin}{-69pt}\begin{document}$$=$$\end{document}
 4(2)8; (2)
\documentclass[12pt]{minimal}\usepackage{amsmath}\usepackage{wasysym}\usepackage{amsfonts}\usepackage{amssymb}\usepackage{amsbsy}\usepackage{mathrsfs}\usepackage{upgreek}\setlength{\oddsidemargin}{-69pt}\begin{document}$$\pi _s$$\end{document}
4(2)8; (2)
\documentclass[12pt]{minimal}\usepackage{amsmath}\usepackage{wasysym}\usepackage{amsfonts}\usepackage{amssymb}\usepackage{amsbsy}\usepackage{mathrsfs}\usepackage{upgreek}\setlength{\oddsidemargin}{-69pt}\begin{document}$$\pi _s$$\end{document}
 \documentclass[12pt]{minimal}\usepackage{amsmath}\usepackage{wasysym}\usepackage{amsfonts}\usepackage{amssymb}\usepackage{amsbsy}\usepackage{mathrsfs}\usepackage{upgreek}\setlength{\oddsidemargin}{-69pt}\begin{document}$$=$$\end{document}
 0.04(0.04)0.16; (3)
\documentclass[12pt]{minimal}\usepackage{amsmath}\usepackage{wasysym}\usepackage{amsfonts}\usepackage{amssymb}\usepackage{amsbsy}\usepackage{mathrsfs}\usepackage{upgreek}\setlength{\oddsidemargin}{-69pt}\begin{document}$$\pi _i=0.5$$\end{document}
0.04(0.04)0.16; (3)
\documentclass[12pt]{minimal}\usepackage{amsmath}\usepackage{wasysym}\usepackage{amsfonts}\usepackage{amssymb}\usepackage{amsbsy}\usepackage{mathrsfs}\usepackage{upgreek}\setlength{\oddsidemargin}{-69pt}\begin{document}$$\pi _i=0.5$$\end{document}
 for
\documentclass[12pt]{minimal}\usepackage{amsmath}\usepackage{wasysym}\usepackage{amsfonts}\usepackage{amssymb}\usepackage{amsbsy}\usepackage{mathrsfs}\usepackage{upgreek}\setlength{\oddsidemargin}{-69pt}\begin{document}$$i=1,2,\ldots ,k$$\end{document}
for
\documentclass[12pt]{minimal}\usepackage{amsmath}\usepackage{wasysym}\usepackage{amsfonts}\usepackage{amssymb}\usepackage{amsbsy}\usepackage{mathrsfs}\usepackage{upgreek}\setlength{\oddsidemargin}{-69pt}\begin{document}$$i=1,2,\ldots ,k$$\end{document}
 ; (4)
\documentclass[12pt]{minimal}\usepackage{amsmath}\usepackage{wasysym}\usepackage{amsfonts}\usepackage{amssymb}\usepackage{amsbsy}\usepackage{mathrsfs}\usepackage{upgreek}\setlength{\oddsidemargin}{-69pt}\begin{document}$$\omega $$\end{document}
; (4)
\documentclass[12pt]{minimal}\usepackage{amsmath}\usepackage{wasysym}\usepackage{amsfonts}\usepackage{amssymb}\usepackage{amsbsy}\usepackage{mathrsfs}\usepackage{upgreek}\setlength{\oddsidemargin}{-69pt}\begin{document}$$\omega $$\end{document}
 \documentclass[12pt]{minimal}\usepackage{amsmath}\usepackage{wasysym}\usepackage{amsfonts}\usepackage{amssymb}\usepackage{amsbsy}\usepackage{mathrsfs}\usepackage{upgreek}\setlength{\oddsidemargin}{-69pt}\begin{document}$$=$$\end{document}
 \documentclass[12pt]{minimal}\usepackage{amsmath}\usepackage{wasysym}\usepackage{amsfonts}\usepackage{amssymb}\usepackage{amsbsy}\usepackage{mathrsfs}\usepackage{upgreek}\setlength{\oddsidemargin}{-69pt}\begin{document}$$25\%$$\end{document}
 or
\documentclass[12pt]{minimal}\usepackage{amsmath}\usepackage{wasysym}\usepackage{amsfonts}\usepackage{amssymb}\usepackage{amsbsy}\usepackage{mathrsfs}\usepackage{upgreek}\setlength{\oddsidemargin}{-69pt}\begin{document}$$50\%$$\end{document}
or
\documentclass[12pt]{minimal}\usepackage{amsmath}\usepackage{wasysym}\usepackage{amsfonts}\usepackage{amssymb}\usepackage{amsbsy}\usepackage{mathrsfs}\usepackage{upgreek}\setlength{\oddsidemargin}{-69pt}\begin{document}$$50\%$$\end{document}
 of
\documentclass[12pt]{minimal}\usepackage{amsmath}\usepackage{wasysym}\usepackage{amsfonts}\usepackage{amssymb}\usepackage{amsbsy}\usepackage{mathrsfs}\usepackage{upgreek}\setlength{\oddsidemargin}{-69pt}\begin{document}$$\pi _s$$\end{document}
of
\documentclass[12pt]{minimal}\usepackage{amsmath}\usepackage{wasysym}\usepackage{amsfonts}\usepackage{amssymb}\usepackage{amsbsy}\usepackage{mathrsfs}\usepackage{upgreek}\setlength{\oddsidemargin}{-69pt}\begin{document}$$\pi _s$$\end{document}
 ; i.e., a total of 3
\documentclass[12pt]{minimal}\usepackage{amsmath}\usepackage{wasysym}\usepackage{amsfonts}\usepackage{amssymb}\usepackage{amsbsy}\usepackage{mathrsfs}\usepackage{upgreek}\setlength{\oddsidemargin}{-69pt}\begin{document}$$\times $$\end{document}
; i.e., a total of 3
\documentclass[12pt]{minimal}\usepackage{amsmath}\usepackage{wasysym}\usepackage{amsfonts}\usepackage{amssymb}\usepackage{amsbsy}\usepackage{mathrsfs}\usepackage{upgreek}\setlength{\oddsidemargin}{-69pt}\begin{document}$$\times $$\end{document}
 4
\documentclass[12pt]{minimal}\usepackage{amsmath}\usepackage{wasysym}\usepackage{amsfonts}\usepackage{amssymb}\usepackage{amsbsy}\usepackage{mathrsfs}\usepackage{upgreek}\setlength{\oddsidemargin}{-69pt}\begin{document}$$\times $$\end{document}
4
\documentclass[12pt]{minimal}\usepackage{amsmath}\usepackage{wasysym}\usepackage{amsfonts}\usepackage{amssymb}\usepackage{amsbsy}\usepackage{mathrsfs}\usepackage{upgreek}\setlength{\oddsidemargin}{-69pt}\begin{document}$$\times $$\end{document}
 2
\documentclass[12pt]{minimal}\usepackage{amsmath}\usepackage{wasysym}\usepackage{amsfonts}\usepackage{amssymb}\usepackage{amsbsy}\usepackage{mathrsfs}\usepackage{upgreek}\setlength{\oddsidemargin}{-69pt}\begin{document}$$=$$\end{document}
2
\documentclass[12pt]{minimal}\usepackage{amsmath}\usepackage{wasysym}\usepackage{amsfonts}\usepackage{amssymb}\usepackage{amsbsy}\usepackage{mathrsfs}\usepackage{upgreek}\setlength{\oddsidemargin}{-69pt}\begin{document}$$=$$\end{document}
 24 parameter combinations.
(d) Cheater detection model: (1)
\documentclass[12pt]{minimal}\usepackage{amsmath}\usepackage{wasysym}\usepackage{amsfonts}\usepackage{amssymb}\usepackage{amsbsy}\usepackage{mathrsfs}\usepackage{upgreek}\setlength{\oddsidemargin}{-69pt}\begin{document}$$p_1$$\end{document}
 \documentclass[12pt]{minimal}\usepackage{amsmath}\usepackage{wasysym}\usepackage{amsfonts}\usepackage{amssymb}\usepackage{amsbsy}\usepackage{mathrsfs}\usepackage{upgreek}\setlength{\oddsidemargin}{-69pt}\begin{document}$$=$$\end{document}
 1/3,
\documentclass[12pt]{minimal}\usepackage{amsmath}\usepackage{wasysym}\usepackage{amsfonts}\usepackage{amssymb}\usepackage{amsbsy}\usepackage{mathrsfs}\usepackage{upgreek}\setlength{\oddsidemargin}{-69pt}\begin{document}$$p_2$$\end{document}
1/3,
\documentclass[12pt]{minimal}\usepackage{amsmath}\usepackage{wasysym}\usepackage{amsfonts}\usepackage{amssymb}\usepackage{amsbsy}\usepackage{mathrsfs}\usepackage{upgreek}\setlength{\oddsidemargin}{-69pt}\begin{document}$$p_2$$\end{document}
 \documentclass[12pt]{minimal}\usepackage{amsmath}\usepackage{wasysym}\usepackage{amsfonts}\usepackage{amssymb}\usepackage{amsbsy}\usepackage{mathrsfs}\usepackage{upgreek}\setlength{\oddsidemargin}{-69pt}\begin{document}$$=$$\end{document}
 2/3 or
\documentclass[12pt]{minimal}\usepackage{amsmath}\usepackage{wasysym}\usepackage{amsfonts}\usepackage{amssymb}\usepackage{amsbsy}\usepackage{mathrsfs}\usepackage{upgreek}\setlength{\oddsidemargin}{-69pt}\begin{document}$$p_1$$\end{document}
2/3 or
\documentclass[12pt]{minimal}\usepackage{amsmath}\usepackage{wasysym}\usepackage{amsfonts}\usepackage{amssymb}\usepackage{amsbsy}\usepackage{mathrsfs}\usepackage{upgreek}\setlength{\oddsidemargin}{-69pt}\begin{document}$$p_1$$\end{document}
 \documentclass[12pt]{minimal}\usepackage{amsmath}\usepackage{wasysym}\usepackage{amsfonts}\usepackage{amssymb}\usepackage{amsbsy}\usepackage{mathrsfs}\usepackage{upgreek}\setlength{\oddsidemargin}{-69pt}\begin{document}$$=$$\end{document}
 1/4,
\documentclass[12pt]{minimal}\usepackage{amsmath}\usepackage{wasysym}\usepackage{amsfonts}\usepackage{amssymb}\usepackage{amsbsy}\usepackage{mathrsfs}\usepackage{upgreek}\setlength{\oddsidemargin}{-69pt}\begin{document}$$p_2$$\end{document}
1/4,
\documentclass[12pt]{minimal}\usepackage{amsmath}\usepackage{wasysym}\usepackage{amsfonts}\usepackage{amssymb}\usepackage{amsbsy}\usepackage{mathrsfs}\usepackage{upgreek}\setlength{\oddsidemargin}{-69pt}\begin{document}$$p_2$$\end{document}
 \documentclass[12pt]{minimal}\usepackage{amsmath}\usepackage{wasysym}\usepackage{amsfonts}\usepackage{amssymb}\usepackage{amsbsy}\usepackage{mathrsfs}\usepackage{upgreek}\setlength{\oddsidemargin}{-69pt}\begin{document}$$=$$\end{document}
 3/4; (2)
\documentclass[12pt]{minimal}\usepackage{amsmath}\usepackage{wasysym}\usepackage{amsfonts}\usepackage{amssymb}\usepackage{amsbsy}\usepackage{mathrsfs}\usepackage{upgreek}\setlength{\oddsidemargin}{-69pt}\begin{document}$$\beta _s$$\end{document}
3/4; (2)
\documentclass[12pt]{minimal}\usepackage{amsmath}\usepackage{wasysym}\usepackage{amsfonts}\usepackage{amssymb}\usepackage{amsbsy}\usepackage{mathrsfs}\usepackage{upgreek}\setlength{\oddsidemargin}{-69pt}\begin{document}$$\beta _s$$\end{document}
 \documentclass[12pt]{minimal}\usepackage{amsmath}\usepackage{wasysym}\usepackage{amsfonts}\usepackage{amssymb}\usepackage{amsbsy}\usepackage{mathrsfs}\usepackage{upgreek}\setlength{\oddsidemargin}{-69pt}\begin{document}$$=$$\end{document}
 0.04(0.04)0.16; (3)
\documentclass[12pt]{minimal}\usepackage{amsmath}\usepackage{wasysym}\usepackage{amsfonts}\usepackage{amssymb}\usepackage{amsbsy}\usepackage{mathrsfs}\usepackage{upgreek}\setlength{\oddsidemargin}{-69pt}\begin{document}$$\pi _s$$\end{document}
0.04(0.04)0.16; (3)
\documentclass[12pt]{minimal}\usepackage{amsmath}\usepackage{wasysym}\usepackage{amsfonts}\usepackage{amssymb}\usepackage{amsbsy}\usepackage{mathrsfs}\usepackage{upgreek}\setlength{\oddsidemargin}{-69pt}\begin{document}$$\pi _s$$\end{document}
 \documentclass[12pt]{minimal}\usepackage{amsmath}\usepackage{wasysym}\usepackage{amsfonts}\usepackage{amssymb}\usepackage{amsbsy}\usepackage{mathrsfs}\usepackage{upgreek}\setlength{\oddsidemargin}{-69pt}\begin{document}$$=$$\end{document}
 0.04(0.04)0.16; (4)
\documentclass[12pt]{minimal}\usepackage{amsmath}\usepackage{wasysym}\usepackage{amsfonts}\usepackage{amssymb}\usepackage{amsbsy}\usepackage{mathrsfs}\usepackage{upgreek}\setlength{\oddsidemargin}{-69pt}\begin{document}$$\omega $$\end{document}
0.04(0.04)0.16; (4)
\documentclass[12pt]{minimal}\usepackage{amsmath}\usepackage{wasysym}\usepackage{amsfonts}\usepackage{amssymb}\usepackage{amsbsy}\usepackage{mathrsfs}\usepackage{upgreek}\setlength{\oddsidemargin}{-69pt}\begin{document}$$\omega $$\end{document}
 \documentclass[12pt]{minimal}\usepackage{amsmath}\usepackage{wasysym}\usepackage{amsfonts}\usepackage{amssymb}\usepackage{amsbsy}\usepackage{mathrsfs}\usepackage{upgreek}\setlength{\oddsidemargin}{-69pt}\begin{document}$$=$$\end{document}
 \documentclass[12pt]{minimal}\usepackage{amsmath}\usepackage{wasysym}\usepackage{amsfonts}\usepackage{amssymb}\usepackage{amsbsy}\usepackage{mathrsfs}\usepackage{upgreek}\setlength{\oddsidemargin}{-69pt}\begin{document}$$25\%$$\end{document}
 or
\documentclass[12pt]{minimal}\usepackage{amsmath}\usepackage{wasysym}\usepackage{amsfonts}\usepackage{amssymb}\usepackage{amsbsy}\usepackage{mathrsfs}\usepackage{upgreek}\setlength{\oddsidemargin}{-69pt}\begin{document}$$50\%$$\end{document}
or
\documentclass[12pt]{minimal}\usepackage{amsmath}\usepackage{wasysym}\usepackage{amsfonts}\usepackage{amssymb}\usepackage{amsbsy}\usepackage{mathrsfs}\usepackage{upgreek}\setlength{\oddsidemargin}{-69pt}\begin{document}$$50\%$$\end{document}
 of
\documentclass[12pt]{minimal}\usepackage{amsmath}\usepackage{wasysym}\usepackage{amsfonts}\usepackage{amssymb}\usepackage{amsbsy}\usepackage{mathrsfs}\usepackage{upgreek}\setlength{\oddsidemargin}{-69pt}\begin{document}$$\pi _s$$\end{document}
of
\documentclass[12pt]{minimal}\usepackage{amsmath}\usepackage{wasysym}\usepackage{amsfonts}\usepackage{amssymb}\usepackage{amsbsy}\usepackage{mathrsfs}\usepackage{upgreek}\setlength{\oddsidemargin}{-69pt}\begin{document}$$\pi _s$$\end{document}
 ; i.e., a total of 3
\documentclass[12pt]{minimal}\usepackage{amsmath}\usepackage{wasysym}\usepackage{amsfonts}\usepackage{amssymb}\usepackage{amsbsy}\usepackage{mathrsfs}\usepackage{upgreek}\setlength{\oddsidemargin}{-69pt}\begin{document}$$\times $$\end{document}
; i.e., a total of 3
\documentclass[12pt]{minimal}\usepackage{amsmath}\usepackage{wasysym}\usepackage{amsfonts}\usepackage{amssymb}\usepackage{amsbsy}\usepackage{mathrsfs}\usepackage{upgreek}\setlength{\oddsidemargin}{-69pt}\begin{document}$$\times $$\end{document}
 4
\documentclass[12pt]{minimal}\usepackage{amsmath}\usepackage{wasysym}\usepackage{amsfonts}\usepackage{amssymb}\usepackage{amsbsy}\usepackage{mathrsfs}\usepackage{upgreek}\setlength{\oddsidemargin}{-69pt}\begin{document}$$\times $$\end{document}
4
\documentclass[12pt]{minimal}\usepackage{amsmath}\usepackage{wasysym}\usepackage{amsfonts}\usepackage{amssymb}\usepackage{amsbsy}\usepackage{mathrsfs}\usepackage{upgreek}\setlength{\oddsidemargin}{-69pt}\begin{document}$$\times $$\end{document}
 2
\documentclass[12pt]{minimal}\usepackage{amsmath}\usepackage{wasysym}\usepackage{amsfonts}\usepackage{amssymb}\usepackage{amsbsy}\usepackage{mathrsfs}\usepackage{upgreek}\setlength{\oddsidemargin}{-69pt}\begin{document}$$=$$\end{document}
2
\documentclass[12pt]{minimal}\usepackage{amsmath}\usepackage{wasysym}\usepackage{amsfonts}\usepackage{amssymb}\usepackage{amsbsy}\usepackage{mathrsfs}\usepackage{upgreek}\setlength{\oddsidemargin}{-69pt}\begin{document}$$=$$\end{document}
 64 parameter combinations.
According to the formulas developed in Sect. 1, the desired sample sizes can be estimated for different RRT models. Given the estimated sample sizes, we can then consider their empirical coverage probabilities (ECPs), empirical assurance probabilities (EAPs), left noncoverage probabilities (LNCPs) and right noncoverage probabilities (RNCPs) of the
\documentclass[12pt]{minimal}\usepackage{amsmath}\usepackage{wasysym}\usepackage{amsfonts}\usepackage{amssymb}\usepackage{amsbsy}\usepackage{mathrsfs}\usepackage{upgreek}\setlength{\oddsidemargin}{-69pt}\begin{document}$$(1-\alpha )100\%$$\end{document}
 Wald and Wilson CIs for evaluating the accuracy of various sample size formulas. For all models, the confidence level
\documentclass[12pt]{minimal}\usepackage{amsmath}\usepackage{wasysym}\usepackage{amsfonts}\usepackage{amssymb}\usepackage{amsbsy}\usepackage{mathrsfs}\usepackage{upgreek}\setlength{\oddsidemargin}{-69pt}\begin{document}$$1-\alpha $$\end{document}
Wald and Wilson CIs for evaluating the accuracy of various sample size formulas. For all models, the confidence level
\documentclass[12pt]{minimal}\usepackage{amsmath}\usepackage{wasysym}\usepackage{amsfonts}\usepackage{amssymb}\usepackage{amsbsy}\usepackage{mathrsfs}\usepackage{upgreek}\setlength{\oddsidemargin}{-69pt}\begin{document}$$1-\alpha $$\end{document}
 is set to be 0.95, and the number of replications is set to be
\documentclass[12pt]{minimal}\usepackage{amsmath}\usepackage{wasysym}\usepackage{amsfonts}\usepackage{amssymb}\usepackage{amsbsy}\usepackage{mathrsfs}\usepackage{upgreek}\setlength{\oddsidemargin}{-69pt}\begin{document}$$K=10000$$\end{document}
is set to be 0.95, and the number of replications is set to be
\documentclass[12pt]{minimal}\usepackage{amsmath}\usepackage{wasysym}\usepackage{amsfonts}\usepackage{amssymb}\usepackage{amsbsy}\usepackage{mathrsfs}\usepackage{upgreek}\setlength{\oddsidemargin}{-69pt}\begin{document}$$K=10000$$\end{document}
 when calculating the following evaluation indices:
(i) Empirical Assurance Probability (EAP)

where
\documentclass[12pt]{minimal}\usepackage{amsmath}\usepackage{wasysym}\usepackage{amsfonts}\usepackage{amssymb}\usepackage{amsbsy}\usepackage{mathrsfs}\usepackage{upgreek}\setlength{\oddsidemargin}{-69pt}\begin{document}$$(\pi _{l}^{(k)},\pi _{u}^{(k)})$$\end{document}
 is the CI for
\documentclass[12pt]{minimal}\usepackage{amsmath}\usepackage{wasysym}\usepackage{amsfonts}\usepackage{amssymb}\usepackage{amsbsy}\usepackage{mathrsfs}\usepackage{upgreek}\setlength{\oddsidemargin}{-69pt}\begin{document}$$\pi _s$$\end{document}
is the CI for
\documentclass[12pt]{minimal}\usepackage{amsmath}\usepackage{wasysym}\usepackage{amsfonts}\usepackage{amssymb}\usepackage{amsbsy}\usepackage{mathrsfs}\usepackage{upgreek}\setlength{\oddsidemargin}{-69pt}\begin{document}$$\pi _s$$\end{document}
 at the kth replication, and
\documentclass[12pt]{minimal}\usepackage{amsmath}\usepackage{wasysym}\usepackage{amsfonts}\usepackage{amssymb}\usepackage{amsbsy}\usepackage{mathrsfs}\usepackage{upgreek}\setlength{\oddsidemargin}{-69pt}\begin{document}$$I(\cdot )$$\end{document}
at the kth replication, and
\documentclass[12pt]{minimal}\usepackage{amsmath}\usepackage{wasysym}\usepackage{amsfonts}\usepackage{amssymb}\usepackage{amsbsy}\usepackage{mathrsfs}\usepackage{upgreek}\setlength{\oddsidemargin}{-69pt}\begin{document}$$I(\cdot )$$\end{document}
 is the indicator function of the event that
\documentclass[12pt]{minimal}\usepackage{amsmath}\usepackage{wasysym}\usepackage{amsfonts}\usepackage{amssymb}\usepackage{amsbsy}\usepackage{mathrsfs}\usepackage{upgreek}\setlength{\oddsidemargin}{-69pt}\begin{document}$$\pi _{u}^{(k)}-\pi _{l}^{(k)}\le 2\omega $$\end{document}
is the indicator function of the event that
\documentclass[12pt]{minimal}\usepackage{amsmath}\usepackage{wasysym}\usepackage{amsfonts}\usepackage{amssymb}\usepackage{amsbsy}\usepackage{mathrsfs}\usepackage{upgreek}\setlength{\oddsidemargin}{-69pt}\begin{document}$$\pi _{u}^{(k)}-\pi _{l}^{(k)}\le 2\omega $$\end{document}
 .
.
(ii) Empirical Coverage Probability (ECP)

(iii) Left and Right Noncoverage Probability (LNCP and RNCP)

Simulation results for assessing the accuracy of various sample size formulas under Warner’s model, unrelated question model, item count technique and cheater detection model are reported in Tables 1, 2, 3, 4 and 5.
Performance of the sample size formula with
\documentclass[12pt]{minimal}\usepackage{amsmath}\usepackage{wasysym}\usepackage{amsfonts}\usepackage{amssymb}\usepackage{amsbsy}\usepackage{mathrsfs}\usepackage{upgreek}\setlength{\oddsidemargin}{-69pt}\begin{document}$$1-\beta $$\end{document}
 assurance probability for Warner’s RRT model under (i)
\documentclass[12pt]{minimal}\usepackage{amsmath}\usepackage{wasysym}\usepackage{amsfonts}\usepackage{amssymb}\usepackage{amsbsy}\usepackage{mathrsfs}\usepackage{upgreek}\setlength{\oddsidemargin}{-69pt}\begin{document}$$\beta =0.5$$\end{document}
assurance probability for Warner’s RRT model under (i)
\documentclass[12pt]{minimal}\usepackage{amsmath}\usepackage{wasysym}\usepackage{amsfonts}\usepackage{amssymb}\usepackage{amsbsy}\usepackage{mathrsfs}\usepackage{upgreek}\setlength{\oddsidemargin}{-69pt}\begin{document}$$\beta =0.5$$\end{document}
 and (ii)
\documentclass[12pt]{minimal}\usepackage{amsmath}\usepackage{wasysym}\usepackage{amsfonts}\usepackage{amssymb}\usepackage{amsbsy}\usepackage{mathrsfs}\usepackage{upgreek}\setlength{\oddsidemargin}{-69pt}\begin{document}$$\beta =0.05$$\end{document}
and (ii)
\documentclass[12pt]{minimal}\usepackage{amsmath}\usepackage{wasysym}\usepackage{amsfonts}\usepackage{amssymb}\usepackage{amsbsy}\usepackage{mathrsfs}\usepackage{upgreek}\setlength{\oddsidemargin}{-69pt}\begin{document}$$\beta =0.05$$\end{document}
 with p = 0.3, 0.6, 0.8

\documentclass[12pt]{minimal}\usepackage{amsmath}\usepackage{wasysym}\usepackage{amsfonts}\usepackage{amssymb}\usepackage{amsbsy}\usepackage{mathrsfs}\usepackage{upgreek}\setlength{\oddsidemargin}{-69pt}\begin{document}$$^\flat $$\end{document}
 Half width (i.e.,
\documentclass[12pt]{minimal}\usepackage{amsmath}\usepackage{wasysym}\usepackage{amsfonts}\usepackage{amssymb}\usepackage{amsbsy}\usepackage{mathrsfs}\usepackage{upgreek}\setlength{\oddsidemargin}{-69pt}\begin{document}$$\omega $$\end{document}
Half width (i.e.,
\documentclass[12pt]{minimal}\usepackage{amsmath}\usepackage{wasysym}\usepackage{amsfonts}\usepackage{amssymb}\usepackage{amsbsy}\usepackage{mathrsfs}\usepackage{upgreek}\setlength{\oddsidemargin}{-69pt}\begin{document}$$\omega $$\end{document}
 ) of a CI as given by the value of
\documentclass[12pt]{minimal}\usepackage{amsmath}\usepackage{wasysym}\usepackage{amsfonts}\usepackage{amssymb}\usepackage{amsbsy}\usepackage{mathrsfs}\usepackage{upgreek}\setlength{\oddsidemargin}{-69pt}\begin{document}$$\pi _s$$\end{document}
) of a CI as given by the value of
\documentclass[12pt]{minimal}\usepackage{amsmath}\usepackage{wasysym}\usepackage{amsfonts}\usepackage{amssymb}\usepackage{amsbsy}\usepackage{mathrsfs}\usepackage{upgreek}\setlength{\oddsidemargin}{-69pt}\begin{document}$$\pi _s$$\end{document}
 , i.e.,
\documentclass[12pt]{minimal}\usepackage{amsmath}\usepackage{wasysym}\usepackage{amsfonts}\usepackage{amssymb}\usepackage{amsbsy}\usepackage{mathrsfs}\usepackage{upgreek}\setlength{\oddsidemargin}{-69pt}\begin{document}$$25\%$$\end{document}
, i.e.,
\documentclass[12pt]{minimal}\usepackage{amsmath}\usepackage{wasysym}\usepackage{amsfonts}\usepackage{amssymb}\usepackage{amsbsy}\usepackage{mathrsfs}\usepackage{upgreek}\setlength{\oddsidemargin}{-69pt}\begin{document}$$25\%$$\end{document}
 and
\documentclass[12pt]{minimal}\usepackage{amsmath}\usepackage{wasysym}\usepackage{amsfonts}\usepackage{amssymb}\usepackage{amsbsy}\usepackage{mathrsfs}\usepackage{upgreek}\setlength{\oddsidemargin}{-69pt}\begin{document}$$50\%$$\end{document}
and
\documentclass[12pt]{minimal}\usepackage{amsmath}\usepackage{wasysym}\usepackage{amsfonts}\usepackage{amssymb}\usepackage{amsbsy}\usepackage{mathrsfs}\usepackage{upgreek}\setlength{\oddsidemargin}{-69pt}\begin{document}$$50\%$$\end{document}
 of
\documentclass[12pt]{minimal}\usepackage{amsmath}\usepackage{wasysym}\usepackage{amsfonts}\usepackage{amssymb}\usepackage{amsbsy}\usepackage{mathrsfs}\usepackage{upgreek}\setlength{\oddsidemargin}{-69pt}\begin{document}$$\pi _s$$\end{document}
of
\documentclass[12pt]{minimal}\usepackage{amsmath}\usepackage{wasysym}\usepackage{amsfonts}\usepackage{amssymb}\usepackage{amsbsy}\usepackage{mathrsfs}\usepackage{upgreek}\setlength{\oddsidemargin}{-69pt}\begin{document}$$\pi _s$$\end{document}
 .
.
\documentclass[12pt]{minimal}\usepackage{amsmath}\usepackage{wasysym}\usepackage{amsfonts}\usepackage{amssymb}\usepackage{amsbsy}\usepackage{mathrsfs}\usepackage{upgreek}\setlength{\oddsidemargin}{-69pt}\begin{document}$$^\dag $$\end{document}
 n denotes the estimated sample size;
\documentclass[12pt]{minimal}\usepackage{amsmath}\usepackage{wasysym}\usepackage{amsfonts}\usepackage{amssymb}\usepackage{amsbsy}\usepackage{mathrsfs}\usepackage{upgreek}\setlength{\oddsidemargin}{-69pt}\begin{document}$$^\ddag $$\end{document}
n denotes the estimated sample size;
\documentclass[12pt]{minimal}\usepackage{amsmath}\usepackage{wasysym}\usepackage{amsfonts}\usepackage{amssymb}\usepackage{amsbsy}\usepackage{mathrsfs}\usepackage{upgreek}\setlength{\oddsidemargin}{-69pt}\begin{document}$$^\ddag $$\end{document}
 (L,R) denotes (LNCP, RNCP).
Performance of the sample size formula with
\documentclass[12pt]{minimal}\usepackage{amsmath}\usepackage{wasysym}\usepackage{amsfonts}\usepackage{amssymb}\usepackage{amsbsy}\usepackage{mathrsfs}\usepackage{upgreek}\setlength{\oddsidemargin}{-69pt}\begin{document}$$1-\beta $$\end{document}
 assurance probability for UQM under (i)
\documentclass[12pt]{minimal}\usepackage{amsmath}\usepackage{wasysym}\usepackage{amsfonts}\usepackage{amssymb}\usepackage{amsbsy}\usepackage{mathrsfs}\usepackage{upgreek}\setlength{\oddsidemargin}{-69pt}\begin{document}$$\beta =0.5$$\end{document}
assurance probability for UQM under (i)
\documentclass[12pt]{minimal}\usepackage{amsmath}\usepackage{wasysym}\usepackage{amsfonts}\usepackage{amssymb}\usepackage{amsbsy}\usepackage{mathrsfs}\usepackage{upgreek}\setlength{\oddsidemargin}{-69pt}\begin{document}$$\beta =0.5$$\end{document}
 and (ii)
\documentclass[12pt]{minimal}\usepackage{amsmath}\usepackage{wasysym}\usepackage{amsfonts}\usepackage{amssymb}\usepackage{amsbsy}\usepackage{mathrsfs}\usepackage{upgreek}\setlength{\oddsidemargin}{-69pt}\begin{document}$$\beta = 0.05$$\end{document}
and (ii)
\documentclass[12pt]{minimal}\usepackage{amsmath}\usepackage{wasysym}\usepackage{amsfonts}\usepackage{amssymb}\usepackage{amsbsy}\usepackage{mathrsfs}\usepackage{upgreek}\setlength{\oddsidemargin}{-69pt}\begin{document}$$\beta = 0.05$$\end{document}
 with
\documentclass[12pt]{minimal}\usepackage{amsmath}\usepackage{wasysym}\usepackage{amsfonts}\usepackage{amssymb}\usepackage{amsbsy}\usepackage{mathrsfs}\usepackage{upgreek}\setlength{\oddsidemargin}{-69pt}\begin{document}$$\pi _N$$\end{document}
with
\documentclass[12pt]{minimal}\usepackage{amsmath}\usepackage{wasysym}\usepackage{amsfonts}\usepackage{amssymb}\usepackage{amsbsy}\usepackage{mathrsfs}\usepackage{upgreek}\setlength{\oddsidemargin}{-69pt}\begin{document}$$\pi _N$$\end{document}
 = 0.2, 0.5, 0.8

Performance of the sample size formula with
\documentclass[12pt]{minimal}\usepackage{amsmath}\usepackage{wasysym}\usepackage{amsfonts}\usepackage{amssymb}\usepackage{amsbsy}\usepackage{mathrsfs}\usepackage{upgreek}\setlength{\oddsidemargin}{-69pt}\begin{document}$$1-\beta $$\end{document}
 assurance probability for ICT model under (i)
\documentclass[12pt]{minimal}\usepackage{amsmath}\usepackage{wasysym}\usepackage{amsfonts}\usepackage{amssymb}\usepackage{amsbsy}\usepackage{mathrsfs}\usepackage{upgreek}\setlength{\oddsidemargin}{-69pt}\begin{document}$$\beta =0.5$$\end{document}
assurance probability for ICT model under (i)
\documentclass[12pt]{minimal}\usepackage{amsmath}\usepackage{wasysym}\usepackage{amsfonts}\usepackage{amssymb}\usepackage{amsbsy}\usepackage{mathrsfs}\usepackage{upgreek}\setlength{\oddsidemargin}{-69pt}\begin{document}$$\beta =0.5$$\end{document}
 and (ii)
\documentclass[12pt]{minimal}\usepackage{amsmath}\usepackage{wasysym}\usepackage{amsfonts}\usepackage{amssymb}\usepackage{amsbsy}\usepackage{mathrsfs}\usepackage{upgreek}\setlength{\oddsidemargin}{-69pt}\begin{document}$$\beta =0.05$$\end{document}
and (ii)
\documentclass[12pt]{minimal}\usepackage{amsmath}\usepackage{wasysym}\usepackage{amsfonts}\usepackage{amssymb}\usepackage{amsbsy}\usepackage{mathrsfs}\usepackage{upgreek}\setlength{\oddsidemargin}{-69pt}\begin{document}$$\beta =0.05$$\end{document}
 with k = 4, 6, 8

Performance of the sample size formula with
\documentclass[12pt]{minimal}\usepackage{amsmath}\usepackage{wasysym}\usepackage{amsfonts}\usepackage{amssymb}\usepackage{amsbsy}\usepackage{mathrsfs}\usepackage{upgreek}\setlength{\oddsidemargin}{-69pt}\begin{document}$$1-\beta $$\end{document}
 assurance probability for CDM for (
\documentclass[12pt]{minimal}\usepackage{amsmath}\usepackage{wasysym}\usepackage{amsfonts}\usepackage{amssymb}\usepackage{amsbsy}\usepackage{mathrsfs}\usepackage{upgreek}\setlength{\oddsidemargin}{-69pt}\begin{document}$$p_1$$\end{document}
assurance probability for CDM for (
\documentclass[12pt]{minimal}\usepackage{amsmath}\usepackage{wasysym}\usepackage{amsfonts}\usepackage{amssymb}\usepackage{amsbsy}\usepackage{mathrsfs}\usepackage{upgreek}\setlength{\oddsidemargin}{-69pt}\begin{document}$$p_1$$\end{document}
 ,
\documentclass[12pt]{minimal}\usepackage{amsmath}\usepackage{wasysym}\usepackage{amsfonts}\usepackage{amssymb}\usepackage{amsbsy}\usepackage{mathrsfs}\usepackage{upgreek}\setlength{\oddsidemargin}{-69pt}\begin{document}$$p_2$$\end{document}
,
\documentclass[12pt]{minimal}\usepackage{amsmath}\usepackage{wasysym}\usepackage{amsfonts}\usepackage{amssymb}\usepackage{amsbsy}\usepackage{mathrsfs}\usepackage{upgreek}\setlength{\oddsidemargin}{-69pt}\begin{document}$$p_2$$\end{document}
 )
\documentclass[12pt]{minimal}\usepackage{amsmath}\usepackage{wasysym}\usepackage{amsfonts}\usepackage{amssymb}\usepackage{amsbsy}\usepackage{mathrsfs}\usepackage{upgreek}\setlength{\oddsidemargin}{-69pt}\begin{document}$$=$$\end{document}
)
\documentclass[12pt]{minimal}\usepackage{amsmath}\usepackage{wasysym}\usepackage{amsfonts}\usepackage{amssymb}\usepackage{amsbsy}\usepackage{mathrsfs}\usepackage{upgreek}\setlength{\oddsidemargin}{-69pt}\begin{document}$$=$$\end{document}
 (1/3, 2/3) under (i)
\documentclass[12pt]{minimal}\usepackage{amsmath}\usepackage{wasysym}\usepackage{amsfonts}\usepackage{amssymb}\usepackage{amsbsy}\usepackage{mathrsfs}\usepackage{upgreek}\setlength{\oddsidemargin}{-69pt}\begin{document}$$\beta =0.5$$\end{document}
(1/3, 2/3) under (i)
\documentclass[12pt]{minimal}\usepackage{amsmath}\usepackage{wasysym}\usepackage{amsfonts}\usepackage{amssymb}\usepackage{amsbsy}\usepackage{mathrsfs}\usepackage{upgreek}\setlength{\oddsidemargin}{-69pt}\begin{document}$$\beta =0.5$$\end{document}
 and (ii)
\documentclass[12pt]{minimal}\usepackage{amsmath}\usepackage{wasysym}\usepackage{amsfonts}\usepackage{amssymb}\usepackage{amsbsy}\usepackage{mathrsfs}\usepackage{upgreek}\setlength{\oddsidemargin}{-69pt}\begin{document}$$\beta =0.05$$\end{document}
and (ii)
\documentclass[12pt]{minimal}\usepackage{amsmath}\usepackage{wasysym}\usepackage{amsfonts}\usepackage{amssymb}\usepackage{amsbsy}\usepackage{mathrsfs}\usepackage{upgreek}\setlength{\oddsidemargin}{-69pt}\begin{document}$$\beta =0.05$$\end{document}
 with
\documentclass[12pt]{minimal}\usepackage{amsmath}\usepackage{wasysym}\usepackage{amsfonts}\usepackage{amssymb}\usepackage{amsbsy}\usepackage{mathrsfs}\usepackage{upgreek}\setlength{\oddsidemargin}{-69pt}\begin{document}$$\beta _s$$\end{document}
with
\documentclass[12pt]{minimal}\usepackage{amsmath}\usepackage{wasysym}\usepackage{amsfonts}\usepackage{amssymb}\usepackage{amsbsy}\usepackage{mathrsfs}\usepackage{upgreek}\setlength{\oddsidemargin}{-69pt}\begin{document}$$\beta _s$$\end{document}
 = 0.04, 0.08, 0.12, 0.16

Performance of the sample size formula with
\documentclass[12pt]{minimal}\usepackage{amsmath}\usepackage{wasysym}\usepackage{amsfonts}\usepackage{amssymb}\usepackage{amsbsy}\usepackage{mathrsfs}\usepackage{upgreek}\setlength{\oddsidemargin}{-69pt}\begin{document}$$1-\beta $$\end{document}
 assurance probability for CDM for (
\documentclass[12pt]{minimal}\usepackage{amsmath}\usepackage{wasysym}\usepackage{amsfonts}\usepackage{amssymb}\usepackage{amsbsy}\usepackage{mathrsfs}\usepackage{upgreek}\setlength{\oddsidemargin}{-69pt}\begin{document}$$p_1$$\end{document}
assurance probability for CDM for (
\documentclass[12pt]{minimal}\usepackage{amsmath}\usepackage{wasysym}\usepackage{amsfonts}\usepackage{amssymb}\usepackage{amsbsy}\usepackage{mathrsfs}\usepackage{upgreek}\setlength{\oddsidemargin}{-69pt}\begin{document}$$p_1$$\end{document}
 ,
\documentclass[12pt]{minimal}\usepackage{amsmath}\usepackage{wasysym}\usepackage{amsfonts}\usepackage{amssymb}\usepackage{amsbsy}\usepackage{mathrsfs}\usepackage{upgreek}\setlength{\oddsidemargin}{-69pt}\begin{document}$$p_2$$\end{document}
,
\documentclass[12pt]{minimal}\usepackage{amsmath}\usepackage{wasysym}\usepackage{amsfonts}\usepackage{amssymb}\usepackage{amsbsy}\usepackage{mathrsfs}\usepackage{upgreek}\setlength{\oddsidemargin}{-69pt}\begin{document}$$p_2$$\end{document}
 )
\documentclass[12pt]{minimal}\usepackage{amsmath}\usepackage{wasysym}\usepackage{amsfonts}\usepackage{amssymb}\usepackage{amsbsy}\usepackage{mathrsfs}\usepackage{upgreek}\setlength{\oddsidemargin}{-69pt}\begin{document}$$=$$\end{document}
)
\documentclass[12pt]{minimal}\usepackage{amsmath}\usepackage{wasysym}\usepackage{amsfonts}\usepackage{amssymb}\usepackage{amsbsy}\usepackage{mathrsfs}\usepackage{upgreek}\setlength{\oddsidemargin}{-69pt}\begin{document}$$=$$\end{document}
 (1/4, 3/4) under (i)
\documentclass[12pt]{minimal}\usepackage{amsmath}\usepackage{wasysym}\usepackage{amsfonts}\usepackage{amssymb}\usepackage{amsbsy}\usepackage{mathrsfs}\usepackage{upgreek}\setlength{\oddsidemargin}{-69pt}\begin{document}$$\beta =0.5$$\end{document}
(1/4, 3/4) under (i)
\documentclass[12pt]{minimal}\usepackage{amsmath}\usepackage{wasysym}\usepackage{amsfonts}\usepackage{amssymb}\usepackage{amsbsy}\usepackage{mathrsfs}\usepackage{upgreek}\setlength{\oddsidemargin}{-69pt}\begin{document}$$\beta =0.5$$\end{document}
 and (ii)
\documentclass[12pt]{minimal}\usepackage{amsmath}\usepackage{wasysym}\usepackage{amsfonts}\usepackage{amssymb}\usepackage{amsbsy}\usepackage{mathrsfs}\usepackage{upgreek}\setlength{\oddsidemargin}{-69pt}\begin{document}$$\beta =0.05$$\end{document}
and (ii)
\documentclass[12pt]{minimal}\usepackage{amsmath}\usepackage{wasysym}\usepackage{amsfonts}\usepackage{amssymb}\usepackage{amsbsy}\usepackage{mathrsfs}\usepackage{upgreek}\setlength{\oddsidemargin}{-69pt}\begin{document}$$\beta =0.05$$\end{document}
 with
\documentclass[12pt]{minimal}\usepackage{amsmath}\usepackage{wasysym}\usepackage{amsfonts}\usepackage{amssymb}\usepackage{amsbsy}\usepackage{mathrsfs}\usepackage{upgreek}\setlength{\oddsidemargin}{-69pt}\begin{document}$$\beta _s$$\end{document}
with
\documentclass[12pt]{minimal}\usepackage{amsmath}\usepackage{wasysym}\usepackage{amsfonts}\usepackage{amssymb}\usepackage{amsbsy}\usepackage{mathrsfs}\usepackage{upgreek}\setlength{\oddsidemargin}{-69pt}\begin{document}$$\beta _s$$\end{document}
 =0.04, 0.08, 0.12, 0.16

When the assurance probability is 95%, results in Tables 1, 2, 3, 4 and 5 consistently show that all the empirical assurance probabilities (EAPs) are generally close to the pre-determined nominal level for both Wald and Wilson methods under the four RRT models. Only when assurance probability is 50%, EAPs of Wald method are slightly lower than the nominal in some cases (e.g.,
\documentclass[12pt]{minimal}\usepackage{amsmath}\usepackage{wasysym}\usepackage{amsfonts}\usepackage{amssymb}\usepackage{amsbsy}\usepackage{mathrsfs}\usepackage{upgreek}\setlength{\oddsidemargin}{-69pt}\begin{document}$$\pi _s$$\end{document}
 \documentclass[12pt]{minimal}\usepackage{amsmath}\usepackage{wasysym}\usepackage{amsfonts}\usepackage{amssymb}\usepackage{amsbsy}\usepackage{mathrsfs}\usepackage{upgreek}\setlength{\oddsidemargin}{-69pt}\begin{document}$$=$$\end{document}
 0.08, 0.12 with p
\documentclass[12pt]{minimal}\usepackage{amsmath}\usepackage{wasysym}\usepackage{amsfonts}\usepackage{amssymb}\usepackage{amsbsy}\usepackage{mathrsfs}\usepackage{upgreek}\setlength{\oddsidemargin}{-69pt}\begin{document}$$=$$\end{document}
0.08, 0.12 with p
\documentclass[12pt]{minimal}\usepackage{amsmath}\usepackage{wasysym}\usepackage{amsfonts}\usepackage{amssymb}\usepackage{amsbsy}\usepackage{mathrsfs}\usepackage{upgreek}\setlength{\oddsidemargin}{-69pt}\begin{document}$$=$$\end{document}
 0.8 and
\documentclass[12pt]{minimal}\usepackage{amsmath}\usepackage{wasysym}\usepackage{amsfonts}\usepackage{amssymb}\usepackage{amsbsy}\usepackage{mathrsfs}\usepackage{upgreek}\setlength{\oddsidemargin}{-69pt}\begin{document}$$\pi _s$$\end{document}
0.8 and
\documentclass[12pt]{minimal}\usepackage{amsmath}\usepackage{wasysym}\usepackage{amsfonts}\usepackage{amssymb}\usepackage{amsbsy}\usepackage{mathrsfs}\usepackage{upgreek}\setlength{\oddsidemargin}{-69pt}\begin{document}$$\pi _s$$\end{document}
 \documentclass[12pt]{minimal}\usepackage{amsmath}\usepackage{wasysym}\usepackage{amsfonts}\usepackage{amssymb}\usepackage{amsbsy}\usepackage{mathrsfs}\usepackage{upgreek}\setlength{\oddsidemargin}{-69pt}\begin{document}$$=$$\end{document}
 0.12 with
\documentclass[12pt]{minimal}\usepackage{amsmath}\usepackage{wasysym}\usepackage{amsfonts}\usepackage{amssymb}\usepackage{amsbsy}\usepackage{mathrsfs}\usepackage{upgreek}\setlength{\oddsidemargin}{-69pt}\begin{document}$$\pi _N$$\end{document}
0.12 with
\documentclass[12pt]{minimal}\usepackage{amsmath}\usepackage{wasysym}\usepackage{amsfonts}\usepackage{amssymb}\usepackage{amsbsy}\usepackage{mathrsfs}\usepackage{upgreek}\setlength{\oddsidemargin}{-69pt}\begin{document}$$\pi _N$$\end{document}
 \documentclass[12pt]{minimal}\usepackage{amsmath}\usepackage{wasysym}\usepackage{amsfonts}\usepackage{amssymb}\usepackage{amsbsy}\usepackage{mathrsfs}\usepackage{upgreek}\setlength{\oddsidemargin}{-69pt}\begin{document}$$=$$\end{document}
 0.2, 0.8 for Warner’s RRT model). Based on the estimated sample sizes, all CIs perform well in the regard that their ECPs are pretty close to the pre-specified nominal level (i.e.,
\documentclass[12pt]{minimal}\usepackage{amsmath}\usepackage{wasysym}\usepackage{amsfonts}\usepackage{amssymb}\usepackage{amsbsy}\usepackage{mathrsfs}\usepackage{upgreek}\setlength{\oddsidemargin}{-69pt}\begin{document}$$95\%$$\end{document}
0.2, 0.8 for Warner’s RRT model). Based on the estimated sample sizes, all CIs perform well in the regard that their ECPs are pretty close to the pre-specified nominal level (i.e.,
\documentclass[12pt]{minimal}\usepackage{amsmath}\usepackage{wasysym}\usepackage{amsfonts}\usepackage{amssymb}\usepackage{amsbsy}\usepackage{mathrsfs}\usepackage{upgreek}\setlength{\oddsidemargin}{-69pt}\begin{document}$$95\%$$\end{document}
 ) and have satisfactory balance between left- and right-tailed errors. The results also show that the sample size estimates, using Wilson approach, are slightly smaller than those based on Wald approach. And, the estimates are more accurate in terms of actual assurance probabilities, coverage probabilities and balances between left- and right-tailed errors.
The above simulation studies are based on the assumption that the expected prevalence equals the true prevalence. We also conduct simulation studies to investigate the performance of the proposed methods in situations where this assumption does not hold true. For this purpose, we let
\documentclass[12pt]{minimal}\usepackage{amsmath}\usepackage{wasysym}\usepackage{amsfonts}\usepackage{amssymb}\usepackage{amsbsy}\usepackage{mathrsfs}\usepackage{upgreek}\setlength{\oddsidemargin}{-69pt}\begin{document}$$\alpha =0.05$$\end{document}
 ,
\documentclass[12pt]{minimal}\usepackage{amsmath}\usepackage{wasysym}\usepackage{amsfonts}\usepackage{amssymb}\usepackage{amsbsy}\usepackage{mathrsfs}\usepackage{upgreek}\setlength{\oddsidemargin}{-69pt}\begin{document}$$\beta =0.05$$\end{document}
,
\documentclass[12pt]{minimal}\usepackage{amsmath}\usepackage{wasysym}\usepackage{amsfonts}\usepackage{amssymb}\usepackage{amsbsy}\usepackage{mathrsfs}\usepackage{upgreek}\setlength{\oddsidemargin}{-69pt}\begin{document}$$\beta =0.05$$\end{document}
 , and assume the true prevalence
\documentclass[12pt]{minimal}\usepackage{amsmath}\usepackage{wasysym}\usepackage{amsfonts}\usepackage{amssymb}\usepackage{amsbsy}\usepackage{mathrsfs}\usepackage{upgreek}\setlength{\oddsidemargin}{-69pt}\begin{document}$$\pi _s=0.165$$\end{document}
, and assume the true prevalence
\documentclass[12pt]{minimal}\usepackage{amsmath}\usepackage{wasysym}\usepackage{amsfonts}\usepackage{amssymb}\usepackage{amsbsy}\usepackage{mathrsfs}\usepackage{upgreek}\setlength{\oddsidemargin}{-69pt}\begin{document}$$\pi _s=0.165$$\end{document}
 , the expected prevalence
\documentclass[12pt]{minimal}\usepackage{amsmath}\usepackage{wasysym}\usepackage{amsfonts}\usepackage{amssymb}\usepackage{amsbsy}\usepackage{mathrsfs}\usepackage{upgreek}\setlength{\oddsidemargin}{-69pt}\begin{document}$$\pi _{es}=r\pi _s$$\end{document}
, the expected prevalence
\documentclass[12pt]{minimal}\usepackage{amsmath}\usepackage{wasysym}\usepackage{amsfonts}\usepackage{amssymb}\usepackage{amsbsy}\usepackage{mathrsfs}\usepackage{upgreek}\setlength{\oddsidemargin}{-69pt}\begin{document}$$\pi _{es}=r\pi _s$$\end{document}
 with
\documentclass[12pt]{minimal}\usepackage{amsmath}\usepackage{wasysym}\usepackage{amsfonts}\usepackage{amssymb}\usepackage{amsbsy}\usepackage{mathrsfs}\usepackage{upgreek}\setlength{\oddsidemargin}{-69pt}\begin{document}$$r=0.5,0.7,0.95,1.2$$\end{document}
with
\documentclass[12pt]{minimal}\usepackage{amsmath}\usepackage{wasysym}\usepackage{amsfonts}\usepackage{amssymb}\usepackage{amsbsy}\usepackage{mathrsfs}\usepackage{upgreek}\setlength{\oddsidemargin}{-69pt}\begin{document}$$r=0.5,0.7,0.95,1.2$$\end{document}
 , and the half-widths of CI
\documentclass[12pt]{minimal}\usepackage{amsmath}\usepackage{wasysym}\usepackage{amsfonts}\usepackage{amssymb}\usepackage{amsbsy}\usepackage{mathrsfs}\usepackage{upgreek}\setlength{\oddsidemargin}{-69pt}\begin{document}$$\omega =0.05,0.10$$\end{document}
, and the half-widths of CI
\documentclass[12pt]{minimal}\usepackage{amsmath}\usepackage{wasysym}\usepackage{amsfonts}\usepackage{amssymb}\usepackage{amsbsy}\usepackage{mathrsfs}\usepackage{upgreek}\setlength{\oddsidemargin}{-69pt}\begin{document}$$\omega =0.05,0.10$$\end{document}
 . In addition, for cheater detection model, we set the true prevalence
\documentclass[12pt]{minimal}\usepackage{amsmath}\usepackage{wasysym}\usepackage{amsfonts}\usepackage{amssymb}\usepackage{amsbsy}\usepackage{mathrsfs}\usepackage{upgreek}\setlength{\oddsidemargin}{-69pt}\begin{document}$$\pi _s=0.165$$\end{document}
. In addition, for cheater detection model, we set the true prevalence
\documentclass[12pt]{minimal}\usepackage{amsmath}\usepackage{wasysym}\usepackage{amsfonts}\usepackage{amssymb}\usepackage{amsbsy}\usepackage{mathrsfs}\usepackage{upgreek}\setlength{\oddsidemargin}{-69pt}\begin{document}$$\pi _s=0.165$$\end{document}
 and the expected prevalence
\documentclass[12pt]{minimal}\usepackage{amsmath}\usepackage{wasysym}\usepackage{amsfonts}\usepackage{amssymb}\usepackage{amsbsy}\usepackage{mathrsfs}\usepackage{upgreek}\setlength{\oddsidemargin}{-69pt}\begin{document}$$\pi _{es}=r_1\pi _s$$\end{document}
and the expected prevalence
\documentclass[12pt]{minimal}\usepackage{amsmath}\usepackage{wasysym}\usepackage{amsfonts}\usepackage{amssymb}\usepackage{amsbsy}\usepackage{mathrsfs}\usepackage{upgreek}\setlength{\oddsidemargin}{-69pt}\begin{document}$$\pi _{es}=r_1\pi _s$$\end{document}
 with
\documentclass[12pt]{minimal}\usepackage{amsmath}\usepackage{wasysym}\usepackage{amsfonts}\usepackage{amssymb}\usepackage{amsbsy}\usepackage{mathrsfs}\usepackage{upgreek}\setlength{\oddsidemargin}{-69pt}\begin{document}$$r_1=0.6,0.95,1.2$$\end{document}
with
\documentclass[12pt]{minimal}\usepackage{amsmath}\usepackage{wasysym}\usepackage{amsfonts}\usepackage{amssymb}\usepackage{amsbsy}\usepackage{mathrsfs}\usepackage{upgreek}\setlength{\oddsidemargin}{-69pt}\begin{document}$$r_1=0.6,0.95,1.2$$\end{document}
 . We also consider that the expected cheating parameter
\documentclass[12pt]{minimal}\usepackage{amsmath}\usepackage{wasysym}\usepackage{amsfonts}\usepackage{amssymb}\usepackage{amsbsy}\usepackage{mathrsfs}\usepackage{upgreek}\setlength{\oddsidemargin}{-69pt}\begin{document}$$\gamma $$\end{document}
. We also consider that the expected cheating parameter
\documentclass[12pt]{minimal}\usepackage{amsmath}\usepackage{wasysym}\usepackage{amsfonts}\usepackage{amssymb}\usepackage{amsbsy}\usepackage{mathrsfs}\usepackage{upgreek}\setlength{\oddsidemargin}{-69pt}\begin{document}$$\gamma $$\end{document}
 is different from the true parameter. Since
\documentclass[12pt]{minimal}\usepackage{amsmath}\usepackage{wasysym}\usepackage{amsfonts}\usepackage{amssymb}\usepackage{amsbsy}\usepackage{mathrsfs}\usepackage{upgreek}\setlength{\oddsidemargin}{-69pt}\begin{document}$$\pi _s+\beta _s+\gamma =1.0$$\end{document}
is different from the true parameter. Since
\documentclass[12pt]{minimal}\usepackage{amsmath}\usepackage{wasysym}\usepackage{amsfonts}\usepackage{amssymb}\usepackage{amsbsy}\usepackage{mathrsfs}\usepackage{upgreek}\setlength{\oddsidemargin}{-69pt}\begin{document}$$\pi _s+\beta _s+\gamma =1.0$$\end{document}
 (i.e.,
\documentclass[12pt]{minimal}\usepackage{amsmath}\usepackage{wasysym}\usepackage{amsfonts}\usepackage{amssymb}\usepackage{amsbsy}\usepackage{mathrsfs}\usepackage{upgreek}\setlength{\oddsidemargin}{-69pt}\begin{document}$$\gamma =1.0-\pi _s-\beta _s$$\end{document}
(i.e.,
\documentclass[12pt]{minimal}\usepackage{amsmath}\usepackage{wasysym}\usepackage{amsfonts}\usepackage{amssymb}\usepackage{amsbsy}\usepackage{mathrsfs}\usepackage{upgreek}\setlength{\oddsidemargin}{-69pt}\begin{document}$$\gamma =1.0-\pi _s-\beta _s$$\end{document}
 ), we consider the following expected proportion of honest-no respondent (i.e.,
\documentclass[12pt]{minimal}\usepackage{amsmath}\usepackage{wasysym}\usepackage{amsfonts}\usepackage{amssymb}\usepackage{amsbsy}\usepackage{mathrsfs}\usepackage{upgreek}\setlength{\oddsidemargin}{-69pt}\begin{document}$$\beta _{es}$$\end{document}
), we consider the following expected proportion of honest-no respondent (i.e.,
\documentclass[12pt]{minimal}\usepackage{amsmath}\usepackage{wasysym}\usepackage{amsfonts}\usepackage{amssymb}\usepackage{amsbsy}\usepackage{mathrsfs}\usepackage{upgreek}\setlength{\oddsidemargin}{-69pt}\begin{document}$$\beta _{es}$$\end{document}
 ), which differs from the true proportion (i.e.,
\documentclass[12pt]{minimal}\usepackage{amsmath}\usepackage{wasysym}\usepackage{amsfonts}\usepackage{amssymb}\usepackage{amsbsy}\usepackage{mathrsfs}\usepackage{upgreek}\setlength{\oddsidemargin}{-69pt}\begin{document}$$\beta _s$$\end{document}
), which differs from the true proportion (i.e.,
\documentclass[12pt]{minimal}\usepackage{amsmath}\usepackage{wasysym}\usepackage{amsfonts}\usepackage{amssymb}\usepackage{amsbsy}\usepackage{mathrsfs}\usepackage{upgreek}\setlength{\oddsidemargin}{-69pt}\begin{document}$$\beta _s$$\end{document}
 ): the true proportion
\documentclass[12pt]{minimal}\usepackage{amsmath}\usepackage{wasysym}\usepackage{amsfonts}\usepackage{amssymb}\usepackage{amsbsy}\usepackage{mathrsfs}\usepackage{upgreek}\setlength{\oddsidemargin}{-69pt}\begin{document}$$\beta _s=0.7$$\end{document}
): the true proportion
\documentclass[12pt]{minimal}\usepackage{amsmath}\usepackage{wasysym}\usepackage{amsfonts}\usepackage{amssymb}\usepackage{amsbsy}\usepackage{mathrsfs}\usepackage{upgreek}\setlength{\oddsidemargin}{-69pt}\begin{document}$$\beta _s=0.7$$\end{document}
 and the expected proportion
\documentclass[12pt]{minimal}\usepackage{amsmath}\usepackage{wasysym}\usepackage{amsfonts}\usepackage{amssymb}\usepackage{amsbsy}\usepackage{mathrsfs}\usepackage{upgreek}\setlength{\oddsidemargin}{-69pt}\begin{document}$$\beta _{es}=r_2\beta _s$$\end{document}
and the expected proportion
\documentclass[12pt]{minimal}\usepackage{amsmath}\usepackage{wasysym}\usepackage{amsfonts}\usepackage{amssymb}\usepackage{amsbsy}\usepackage{mathrsfs}\usepackage{upgreek}\setlength{\oddsidemargin}{-69pt}\begin{document}$$\beta _{es}=r_2\beta _s$$\end{document}
 with
\documentclass[12pt]{minimal}\usepackage{amsmath}\usepackage{wasysym}\usepackage{amsfonts}\usepackage{amssymb}\usepackage{amsbsy}\usepackage{mathrsfs}\usepackage{upgreek}\setlength{\oddsidemargin}{-69pt}\begin{document}$$r_2=0.6,0.95,1.1$$\end{document}
with
\documentclass[12pt]{minimal}\usepackage{amsmath}\usepackage{wasysym}\usepackage{amsfonts}\usepackage{amssymb}\usepackage{amsbsy}\usepackage{mathrsfs}\usepackage{upgreek}\setlength{\oddsidemargin}{-69pt}\begin{document}$$r_2=0.6,0.95,1.1$$\end{document}
 . As shown in Tables 1, 2, 3, 4 and 5, the performances of the estimated sample sizes under various models are not affected by the settings of the other parameters (i.e., p,
\documentclass[12pt]{minimal}\usepackage{amsmath}\usepackage{wasysym}\usepackage{amsfonts}\usepackage{amssymb}\usepackage{amsbsy}\usepackage{mathrsfs}\usepackage{upgreek}\setlength{\oddsidemargin}{-69pt}\begin{document}$$\pi _N$$\end{document}
. As shown in Tables 1, 2, 3, 4 and 5, the performances of the estimated sample sizes under various models are not affected by the settings of the other parameters (i.e., p,
\documentclass[12pt]{minimal}\usepackage{amsmath}\usepackage{wasysym}\usepackage{amsfonts}\usepackage{amssymb}\usepackage{amsbsy}\usepackage{mathrsfs}\usepackage{upgreek}\setlength{\oddsidemargin}{-69pt}\begin{document}$$\pi _N$$\end{document}
 , k,
\documentclass[12pt]{minimal}\usepackage{amsmath}\usepackage{wasysym}\usepackage{amsfonts}\usepackage{amssymb}\usepackage{amsbsy}\usepackage{mathrsfs}\usepackage{upgreek}\setlength{\oddsidemargin}{-69pt}\begin{document}$$p_1$$\end{document}
, k,
\documentclass[12pt]{minimal}\usepackage{amsmath}\usepackage{wasysym}\usepackage{amsfonts}\usepackage{amssymb}\usepackage{amsbsy}\usepackage{mathrsfs}\usepackage{upgreek}\setlength{\oddsidemargin}{-69pt}\begin{document}$$p_1$$\end{document}
 ,
\documentclass[12pt]{minimal}\usepackage{amsmath}\usepackage{wasysym}\usepackage{amsfonts}\usepackage{amssymb}\usepackage{amsbsy}\usepackage{mathrsfs}\usepackage{upgreek}\setlength{\oddsidemargin}{-69pt}\begin{document}$$p_2$$\end{document}
,
\documentclass[12pt]{minimal}\usepackage{amsmath}\usepackage{wasysym}\usepackage{amsfonts}\usepackage{amssymb}\usepackage{amsbsy}\usepackage{mathrsfs}\usepackage{upgreek}\setlength{\oddsidemargin}{-69pt}\begin{document}$$p_2$$\end{document}
 ). Therefore, we consider other settings of the parameters for each model: (i) Warner model:
\documentclass[12pt]{minimal}\usepackage{amsmath}\usepackage{wasysym}\usepackage{amsfonts}\usepackage{amssymb}\usepackage{amsbsy}\usepackage{mathrsfs}\usepackage{upgreek}\setlength{\oddsidemargin}{-69pt}\begin{document}$$p=0.3$$\end{document}
). Therefore, we consider other settings of the parameters for each model: (i) Warner model:
\documentclass[12pt]{minimal}\usepackage{amsmath}\usepackage{wasysym}\usepackage{amsfonts}\usepackage{amssymb}\usepackage{amsbsy}\usepackage{mathrsfs}\usepackage{upgreek}\setlength{\oddsidemargin}{-69pt}\begin{document}$$p=0.3$$\end{document}
 ; (ii) unrelated question model:
\documentclass[12pt]{minimal}\usepackage{amsmath}\usepackage{wasysym}\usepackage{amsfonts}\usepackage{amssymb}\usepackage{amsbsy}\usepackage{mathrsfs}\usepackage{upgreek}\setlength{\oddsidemargin}{-69pt}\begin{document}$$p=0.7$$\end{document}
; (ii) unrelated question model:
\documentclass[12pt]{minimal}\usepackage{amsmath}\usepackage{wasysym}\usepackage{amsfonts}\usepackage{amssymb}\usepackage{amsbsy}\usepackage{mathrsfs}\usepackage{upgreek}\setlength{\oddsidemargin}{-69pt}\begin{document}$$p=0.7$$\end{document}
 and
\documentclass[12pt]{minimal}\usepackage{amsmath}\usepackage{wasysym}\usepackage{amsfonts}\usepackage{amssymb}\usepackage{amsbsy}\usepackage{mathrsfs}\usepackage{upgreek}\setlength{\oddsidemargin}{-69pt}\begin{document}$$\pi _N=0.5$$\end{document}
and
\documentclass[12pt]{minimal}\usepackage{amsmath}\usepackage{wasysym}\usepackage{amsfonts}\usepackage{amssymb}\usepackage{amsbsy}\usepackage{mathrsfs}\usepackage{upgreek}\setlength{\oddsidemargin}{-69pt}\begin{document}$$\pi _N=0.5$$\end{document}
 ; (iii) item count technique: k
\documentclass[12pt]{minimal}\usepackage{amsmath}\usepackage{wasysym}\usepackage{amsfonts}\usepackage{amssymb}\usepackage{amsbsy}\usepackage{mathrsfs}\usepackage{upgreek}\setlength{\oddsidemargin}{-69pt}\begin{document}$$=$$\end{document}
; (iii) item count technique: k
\documentclass[12pt]{minimal}\usepackage{amsmath}\usepackage{wasysym}\usepackage{amsfonts}\usepackage{amssymb}\usepackage{amsbsy}\usepackage{mathrsfs}\usepackage{upgreek}\setlength{\oddsidemargin}{-69pt}\begin{document}$$=$$\end{document}
 4 and
\documentclass[12pt]{minimal}\usepackage{amsmath}\usepackage{wasysym}\usepackage{amsfonts}\usepackage{amssymb}\usepackage{amsbsy}\usepackage{mathrsfs}\usepackage{upgreek}\setlength{\oddsidemargin}{-69pt}\begin{document}$$\pi _i=0.5$$\end{document}
4 and
\documentclass[12pt]{minimal}\usepackage{amsmath}\usepackage{wasysym}\usepackage{amsfonts}\usepackage{amssymb}\usepackage{amsbsy}\usepackage{mathrsfs}\usepackage{upgreek}\setlength{\oddsidemargin}{-69pt}\begin{document}$$\pi _i=0.5$$\end{document}
 for
\documentclass[12pt]{minimal}\usepackage{amsmath}\usepackage{wasysym}\usepackage{amsfonts}\usepackage{amssymb}\usepackage{amsbsy}\usepackage{mathrsfs}\usepackage{upgreek}\setlength{\oddsidemargin}{-69pt}\begin{document}$$i=1,2,\cdots ,k$$\end{document}
for
\documentclass[12pt]{minimal}\usepackage{amsmath}\usepackage{wasysym}\usepackage{amsfonts}\usepackage{amssymb}\usepackage{amsbsy}\usepackage{mathrsfs}\usepackage{upgreek}\setlength{\oddsidemargin}{-69pt}\begin{document}$$i=1,2,\cdots ,k$$\end{document}
 ; (iv) cheater detection model:
\documentclass[12pt]{minimal}\usepackage{amsmath}\usepackage{wasysym}\usepackage{amsfonts}\usepackage{amssymb}\usepackage{amsbsy}\usepackage{mathrsfs}\usepackage{upgreek}\setlength{\oddsidemargin}{-69pt}\begin{document}$$p_1$$\end{document}
; (iv) cheater detection model:
\documentclass[12pt]{minimal}\usepackage{amsmath}\usepackage{wasysym}\usepackage{amsfonts}\usepackage{amssymb}\usepackage{amsbsy}\usepackage{mathrsfs}\usepackage{upgreek}\setlength{\oddsidemargin}{-69pt}\begin{document}$$p_1$$\end{document}
 \documentclass[12pt]{minimal}\usepackage{amsmath}\usepackage{wasysym}\usepackage{amsfonts}\usepackage{amssymb}\usepackage{amsbsy}\usepackage{mathrsfs}\usepackage{upgreek}\setlength{\oddsidemargin}{-69pt}\begin{document}$$=$$\end{document}
 0.2,
\documentclass[12pt]{minimal}\usepackage{amsmath}\usepackage{wasysym}\usepackage{amsfonts}\usepackage{amssymb}\usepackage{amsbsy}\usepackage{mathrsfs}\usepackage{upgreek}\setlength{\oddsidemargin}{-69pt}\begin{document}$$p_2$$\end{document}
0.2,
\documentclass[12pt]{minimal}\usepackage{amsmath}\usepackage{wasysym}\usepackage{amsfonts}\usepackage{amssymb}\usepackage{amsbsy}\usepackage{mathrsfs}\usepackage{upgreek}\setlength{\oddsidemargin}{-69pt}\begin{document}$$p_2$$\end{document}
 \documentclass[12pt]{minimal}\usepackage{amsmath}\usepackage{wasysym}\usepackage{amsfonts}\usepackage{amssymb}\usepackage{amsbsy}\usepackage{mathrsfs}\usepackage{upgreek}\setlength{\oddsidemargin}{-69pt}\begin{document}$$=$$\end{document}
 0.8. We conduct the simulation study as follows. First, given the expected prevalence
\documentclass[12pt]{minimal}\usepackage{amsmath}\usepackage{wasysym}\usepackage{amsfonts}\usepackage{amssymb}\usepackage{amsbsy}\usepackage{mathrsfs}\usepackage{upgreek}\setlength{\oddsidemargin}{-69pt}\begin{document}$$\pi _{es}$$\end{document}
0.8. We conduct the simulation study as follows. First, given the expected prevalence
\documentclass[12pt]{minimal}\usepackage{amsmath}\usepackage{wasysym}\usepackage{amsfonts}\usepackage{amssymb}\usepackage{amsbsy}\usepackage{mathrsfs}\usepackage{upgreek}\setlength{\oddsidemargin}{-69pt}\begin{document}$$\pi _{es}$$\end{document}
 , the expected proportion
\documentclass[12pt]{minimal}\usepackage{amsmath}\usepackage{wasysym}\usepackage{amsfonts}\usepackage{amssymb}\usepackage{amsbsy}\usepackage{mathrsfs}\usepackage{upgreek}\setlength{\oddsidemargin}{-69pt}\begin{document}$$\beta _{es}$$\end{document}
, the expected proportion
\documentclass[12pt]{minimal}\usepackage{amsmath}\usepackage{wasysym}\usepackage{amsfonts}\usepackage{amssymb}\usepackage{amsbsy}\usepackage{mathrsfs}\usepackage{upgreek}\setlength{\oddsidemargin}{-69pt}\begin{document}$$\beta _{es}$$\end{document}
 and other parameters from each model, the estimated sample size for each model is obtained via the formulas illustrated in Sect. 1. Second, based on the estimated sample size for each model, 10000 random samples are generated under the true parameter values, and consequently 10000 confidence intervals for
\documentclass[12pt]{minimal}\usepackage{amsmath}\usepackage{wasysym}\usepackage{amsfonts}\usepackage{amssymb}\usepackage{amsbsy}\usepackage{mathrsfs}\usepackage{upgreek}\setlength{\oddsidemargin}{-69pt}\begin{document}$$\pi _s$$\end{document}
and other parameters from each model, the estimated sample size for each model is obtained via the formulas illustrated in Sect. 1. Second, based on the estimated sample size for each model, 10000 random samples are generated under the true parameter values, and consequently 10000 confidence intervals for
\documentclass[12pt]{minimal}\usepackage{amsmath}\usepackage{wasysym}\usepackage{amsfonts}\usepackage{amssymb}\usepackage{amsbsy}\usepackage{mathrsfs}\usepackage{upgreek}\setlength{\oddsidemargin}{-69pt}\begin{document}$$\pi _s$$\end{document}
 are obtained. Third, based on the 10000 confidence intervals for each model, we calculate the proportion of these intervals that include the true prevalence
\documentclass[12pt]{minimal}\usepackage{amsmath}\usepackage{wasysym}\usepackage{amsfonts}\usepackage{amssymb}\usepackage{amsbsy}\usepackage{mathrsfs}\usepackage{upgreek}\setlength{\oddsidemargin}{-69pt}\begin{document}$$\pi _s$$\end{document}
are obtained. Third, based on the 10000 confidence intervals for each model, we calculate the proportion of these intervals that include the true prevalence
\documentclass[12pt]{minimal}\usepackage{amsmath}\usepackage{wasysym}\usepackage{amsfonts}\usepackage{amssymb}\usepackage{amsbsy}\usepackage{mathrsfs}\usepackage{upgreek}\setlength{\oddsidemargin}{-69pt}\begin{document}$$\pi _s$$\end{document}
 to obtain the ECP, and we calculate the proportion of the widths of the intervals being controlled within the pre-given value (i.e.,
\documentclass[12pt]{minimal}\usepackage{amsmath}\usepackage{wasysym}\usepackage{amsfonts}\usepackage{amssymb}\usepackage{amsbsy}\usepackage{mathrsfs}\usepackage{upgreek}\setlength{\oddsidemargin}{-69pt}\begin{document}$$\omega $$\end{document}
to obtain the ECP, and we calculate the proportion of the widths of the intervals being controlled within the pre-given value (i.e.,
\documentclass[12pt]{minimal}\usepackage{amsmath}\usepackage{wasysym}\usepackage{amsfonts}\usepackage{amssymb}\usepackage{amsbsy}\usepackage{mathrsfs}\usepackage{upgreek}\setlength{\oddsidemargin}{-69pt}\begin{document}$$\omega $$\end{document}
 ) to obtain the ACP. Simulation results are reported in Table 6.
Performance of the sample size formula with
\documentclass[12pt]{minimal}\usepackage{amsmath}\usepackage{wasysym}\usepackage{amsfonts}\usepackage{amssymb}\usepackage{amsbsy}\usepackage{mathrsfs}\usepackage{upgreek}\setlength{\oddsidemargin}{-69pt}\begin{document}$$95\%$$\end{document}
 assurance probability for various models when the expected prevalence or proportion (i.e.,
\documentclass[12pt]{minimal}\usepackage{amsmath}\usepackage{wasysym}\usepackage{amsfonts}\usepackage{amssymb}\usepackage{amsbsy}\usepackage{mathrsfs}\usepackage{upgreek}\setlength{\oddsidemargin}{-69pt}\begin{document}$$\pi _{es}$$\end{document}
assurance probability for various models when the expected prevalence or proportion (i.e.,
\documentclass[12pt]{minimal}\usepackage{amsmath}\usepackage{wasysym}\usepackage{amsfonts}\usepackage{amssymb}\usepackage{amsbsy}\usepackage{mathrsfs}\usepackage{upgreek}\setlength{\oddsidemargin}{-69pt}\begin{document}$$\pi _{es}$$\end{document}
 or
\documentclass[12pt]{minimal}\usepackage{amsmath}\usepackage{wasysym}\usepackage{amsfonts}\usepackage{amssymb}\usepackage{amsbsy}\usepackage{mathrsfs}\usepackage{upgreek}\setlength{\oddsidemargin}{-69pt}\begin{document}$$\beta _{es}$$\end{document}
or
\documentclass[12pt]{minimal}\usepackage{amsmath}\usepackage{wasysym}\usepackage{amsfonts}\usepackage{amssymb}\usepackage{amsbsy}\usepackage{mathrsfs}\usepackage{upgreek}\setlength{\oddsidemargin}{-69pt}\begin{document}$$\beta _{es}$$\end{document}
 ) differs from the true prevalence or proportion (i.e.,
\documentclass[12pt]{minimal}\usepackage{amsmath}\usepackage{wasysym}\usepackage{amsfonts}\usepackage{amssymb}\usepackage{amsbsy}\usepackage{mathrsfs}\usepackage{upgreek}\setlength{\oddsidemargin}{-69pt}\begin{document}$$\pi _{s}$$\end{document}
) differs from the true prevalence or proportion (i.e.,
\documentclass[12pt]{minimal}\usepackage{amsmath}\usepackage{wasysym}\usepackage{amsfonts}\usepackage{amssymb}\usepackage{amsbsy}\usepackage{mathrsfs}\usepackage{upgreek}\setlength{\oddsidemargin}{-69pt}\begin{document}$$\pi _{s}$$\end{document}
 or
\documentclass[12pt]{minimal}\usepackage{amsmath}\usepackage{wasysym}\usepackage{amsfonts}\usepackage{amssymb}\usepackage{amsbsy}\usepackage{mathrsfs}\usepackage{upgreek}\setlength{\oddsidemargin}{-69pt}\begin{document}$$\beta _s$$\end{document}
or
\documentclass[12pt]{minimal}\usepackage{amsmath}\usepackage{wasysym}\usepackage{amsfonts}\usepackage{amssymb}\usepackage{amsbsy}\usepackage{mathrsfs}\usepackage{upgreek}\setlength{\oddsidemargin}{-69pt}\begin{document}$$\beta _s$$\end{document}
 )
)

\documentclass[12pt]{minimal}\usepackage{amsmath}\usepackage{wasysym}\usepackage{amsfonts}\usepackage{amssymb}\usepackage{amsbsy}\usepackage{mathrsfs}\usepackage{upgreek}\setlength{\oddsidemargin}{-69pt}\begin{document}$$^c$$\end{document}
 Expected prevalence (
\documentclass[12pt]{minimal}\usepackage{amsmath}\usepackage{wasysym}\usepackage{amsfonts}\usepackage{amssymb}\usepackage{amsbsy}\usepackage{mathrsfs}\usepackage{upgreek}\setlength{\oddsidemargin}{-69pt}\begin{document}$$\pi _\mathrm{es}$$\end{document}
Expected prevalence (
\documentclass[12pt]{minimal}\usepackage{amsmath}\usepackage{wasysym}\usepackage{amsfonts}\usepackage{amssymb}\usepackage{amsbsy}\usepackage{mathrsfs}\usepackage{upgreek}\setlength{\oddsidemargin}{-69pt}\begin{document}$$\pi _\mathrm{es}$$\end{document}
 ) as given by the values of
\documentclass[12pt]{minimal}\usepackage{amsmath}\usepackage{wasysym}\usepackage{amsfonts}\usepackage{amssymb}\usepackage{amsbsy}\usepackage{mathrsfs}\usepackage{upgreek}\setlength{\oddsidemargin}{-69pt}\begin{document}$$\pi _s$$\end{document}
) as given by the values of
\documentclass[12pt]{minimal}\usepackage{amsmath}\usepackage{wasysym}\usepackage{amsfonts}\usepackage{amssymb}\usepackage{amsbsy}\usepackage{mathrsfs}\usepackage{upgreek}\setlength{\oddsidemargin}{-69pt}\begin{document}$$\pi _s$$\end{document}
 , i.e.,
\documentclass[12pt]{minimal}\usepackage{amsmath}\usepackage{wasysym}\usepackage{amsfonts}\usepackage{amssymb}\usepackage{amsbsy}\usepackage{mathrsfs}\usepackage{upgreek}\setlength{\oddsidemargin}{-69pt}\begin{document}$$\pi _\mathrm{es}=(0.50,0.70,0.95,1.20)$$\end{document}
, i.e.,
\documentclass[12pt]{minimal}\usepackage{amsmath}\usepackage{wasysym}\usepackage{amsfonts}\usepackage{amssymb}\usepackage{amsbsy}\usepackage{mathrsfs}\usepackage{upgreek}\setlength{\oddsidemargin}{-69pt}\begin{document}$$\pi _\mathrm{es}=(0.50,0.70,0.95,1.20)$$\end{document}
 or
\documentclass[12pt]{minimal}\usepackage{amsmath}\usepackage{wasysym}\usepackage{amsfonts}\usepackage{amssymb}\usepackage{amsbsy}\usepackage{mathrsfs}\usepackage{upgreek}\setlength{\oddsidemargin}{-69pt}\begin{document}$$(0.60,0.95,1.20) \pi _s$$\end{document}
or
\documentclass[12pt]{minimal}\usepackage{amsmath}\usepackage{wasysym}\usepackage{amsfonts}\usepackage{amssymb}\usepackage{amsbsy}\usepackage{mathrsfs}\usepackage{upgreek}\setlength{\oddsidemargin}{-69pt}\begin{document}$$(0.60,0.95,1.20) \pi _s$$\end{document}
 .
.
\documentclass[12pt]{minimal}\usepackage{amsmath}\usepackage{wasysym}\usepackage{amsfonts}\usepackage{amssymb}\usepackage{amsbsy}\usepackage{mathrsfs}\usepackage{upgreek}\setlength{\oddsidemargin}{-69pt}\begin{document}$$^d$$\end{document}
 Expected proportion (
\documentclass[12pt]{minimal}\usepackage{amsmath}\usepackage{wasysym}\usepackage{amsfonts}\usepackage{amssymb}\usepackage{amsbsy}\usepackage{mathrsfs}\usepackage{upgreek}\setlength{\oddsidemargin}{-69pt}\begin{document}$$\beta _\mathrm{es}$$\end{document}
Expected proportion (
\documentclass[12pt]{minimal}\usepackage{amsmath}\usepackage{wasysym}\usepackage{amsfonts}\usepackage{amssymb}\usepackage{amsbsy}\usepackage{mathrsfs}\usepackage{upgreek}\setlength{\oddsidemargin}{-69pt}\begin{document}$$\beta _\mathrm{es}$$\end{document}
 ) as given by the values of
\documentclass[12pt]{minimal}\usepackage{amsmath}\usepackage{wasysym}\usepackage{amsfonts}\usepackage{amssymb}\usepackage{amsbsy}\usepackage{mathrsfs}\usepackage{upgreek}\setlength{\oddsidemargin}{-69pt}\begin{document}$$\beta _s$$\end{document}
) as given by the values of
\documentclass[12pt]{minimal}\usepackage{amsmath}\usepackage{wasysym}\usepackage{amsfonts}\usepackage{amssymb}\usepackage{amsbsy}\usepackage{mathrsfs}\usepackage{upgreek}\setlength{\oddsidemargin}{-69pt}\begin{document}$$\beta _s$$\end{document}
 , i.e.,
\documentclass[12pt]{minimal}\usepackage{amsmath}\usepackage{wasysym}\usepackage{amsfonts}\usepackage{amssymb}\usepackage{amsbsy}\usepackage{mathrsfs}\usepackage{upgreek}\setlength{\oddsidemargin}{-69pt}\begin{document}$$\beta _\mathrm{es}=(0.60,0.95,1.10) \beta _s$$\end{document}
, i.e.,
\documentclass[12pt]{minimal}\usepackage{amsmath}\usepackage{wasysym}\usepackage{amsfonts}\usepackage{amssymb}\usepackage{amsbsy}\usepackage{mathrsfs}\usepackage{upgreek}\setlength{\oddsidemargin}{-69pt}\begin{document}$$\beta _\mathrm{es}=(0.60,0.95,1.10) \beta _s$$\end{document}
 .
.
According to Table 6, when the expected prevalence differs from the true prevalence, we have the following observations: (i) ECPs of all CIs are still very close to the nominal confidence level for each RRT model; (ii) most CIs have satisfactory balance between left- and right-tailed errors; (iii) the closer the expected prevalence rate (i.e.,
\documentclass[12pt]{minimal}\usepackage{amsmath}\usepackage{wasysym}\usepackage{amsfonts}\usepackage{amssymb}\usepackage{amsbsy}\usepackage{mathrsfs}\usepackage{upgreek}\setlength{\oddsidemargin}{-69pt}\begin{document}$$\pi _{es}$$\end{document}
 ) to the true prevalence rate (i.e.,
\documentclass[12pt]{minimal}\usepackage{amsmath}\usepackage{wasysym}\usepackage{amsfonts}\usepackage{amssymb}\usepackage{amsbsy}\usepackage{mathrsfs}\usepackage{upgreek}\setlength{\oddsidemargin}{-69pt}\begin{document}$$\pi _s$$\end{document}
) to the true prevalence rate (i.e.,
\documentclass[12pt]{minimal}\usepackage{amsmath}\usepackage{wasysym}\usepackage{amsfonts}\usepackage{amssymb}\usepackage{amsbsy}\usepackage{mathrsfs}\usepackage{upgreek}\setlength{\oddsidemargin}{-69pt}\begin{document}$$\pi _s$$\end{document}
 ), the closer the actual assurance probability to the pre-specified assurance probability; (iv) similar observations can be found when the expected cheating parameter differs from the true parameter for the cheater detection model.
3. Numerical Examples
To demonstrate the practicability and applicability of the proposed methods, we apply them to the study on unethical behavior in negotiation as discussed in Sect. 1. Suppose that an applied psychologist collects survey data and examines whether negotiators use this unethical tactic to increase the likelihood of reaching an agreement. He or she believes that approximately
\documentclass[12pt]{minimal}\usepackage{amsmath}\usepackage{wasysym}\usepackage{amsfonts}\usepackage{amssymb}\usepackage{amsbsy}\usepackage{mathrsfs}\usepackage{upgreek}\setlength{\oddsidemargin}{-69pt}\begin{document}$$16.5\%$$\end{document}
 of negotiators make false promises in negotiations (i.e.,
\documentclass[12pt]{minimal}\usepackage{amsmath}\usepackage{wasysym}\usepackage{amsfonts}\usepackage{amssymb}\usepackage{amsbsy}\usepackage{mathrsfs}\usepackage{upgreek}\setlength{\oddsidemargin}{-69pt}\begin{document}$$\pi _s$$\end{document}
of negotiators make false promises in negotiations (i.e.,
\documentclass[12pt]{minimal}\usepackage{amsmath}\usepackage{wasysym}\usepackage{amsfonts}\usepackage{amssymb}\usepackage{amsbsy}\usepackage{mathrsfs}\usepackage{upgreek}\setlength{\oddsidemargin}{-69pt}\begin{document}$$\pi _s$$\end{document}
 \documentclass[12pt]{minimal}\usepackage{amsmath}\usepackage{wasysym}\usepackage{amsfonts}\usepackage{amssymb}\usepackage{amsbsy}\usepackage{mathrsfs}\usepackage{upgreek}\setlength{\oddsidemargin}{-69pt}\begin{document}$$=$$\end{document}
 0.165). We calculate the required sample size for a new study in which we have
\documentclass[12pt]{minimal}\usepackage{amsmath}\usepackage{wasysym}\usepackage{amsfonts}\usepackage{amssymb}\usepackage{amsbsy}\usepackage{mathrsfs}\usepackage{upgreek}\setlength{\oddsidemargin}{-69pt}\begin{document}$$95\%$$\end{document}
0.165). We calculate the required sample size for a new study in which we have
\documentclass[12pt]{minimal}\usepackage{amsmath}\usepackage{wasysym}\usepackage{amsfonts}\usepackage{amssymb}\usepackage{amsbsy}\usepackage{mathrsfs}\usepackage{upgreek}\setlength{\oddsidemargin}{-69pt}\begin{document}$$95\%$$\end{document}
 chance (i.e.,
\documentclass[12pt]{minimal}\usepackage{amsmath}\usepackage{wasysym}\usepackage{amsfonts}\usepackage{amssymb}\usepackage{amsbsy}\usepackage{mathrsfs}\usepackage{upgreek}\setlength{\oddsidemargin}{-69pt}\begin{document}$$\beta $$\end{document}
chance (i.e.,
\documentclass[12pt]{minimal}\usepackage{amsmath}\usepackage{wasysym}\usepackage{amsfonts}\usepackage{amssymb}\usepackage{amsbsy}\usepackage{mathrsfs}\usepackage{upgreek}\setlength{\oddsidemargin}{-69pt}\begin{document}$$\beta $$\end{document}
 \documentclass[12pt]{minimal}\usepackage{amsmath}\usepackage{wasysym}\usepackage{amsfonts}\usepackage{amssymb}\usepackage{amsbsy}\usepackage{mathrsfs}\usepackage{upgreek}\setlength{\oddsidemargin}{-69pt}\begin{document}$$=$$\end{document}
 0.05) that the half width of the
\documentclass[12pt]{minimal}\usepackage{amsmath}\usepackage{wasysym}\usepackage{amsfonts}\usepackage{amssymb}\usepackage{amsbsy}\usepackage{mathrsfs}\usepackage{upgreek}\setlength{\oddsidemargin}{-69pt}\begin{document}$$95\%$$\end{document}
0.05) that the half width of the
\documentclass[12pt]{minimal}\usepackage{amsmath}\usepackage{wasysym}\usepackage{amsfonts}\usepackage{amssymb}\usepackage{amsbsy}\usepackage{mathrsfs}\usepackage{upgreek}\setlength{\oddsidemargin}{-69pt}\begin{document}$$95\%$$\end{document}
 (i.e.,
\documentclass[12pt]{minimal}\usepackage{amsmath}\usepackage{wasysym}\usepackage{amsfonts}\usepackage{amssymb}\usepackage{amsbsy}\usepackage{mathrsfs}\usepackage{upgreek}\setlength{\oddsidemargin}{-69pt}\begin{document}$$1-\alpha $$\end{document}
(i.e.,
\documentclass[12pt]{minimal}\usepackage{amsmath}\usepackage{wasysym}\usepackage{amsfonts}\usepackage{amssymb}\usepackage{amsbsy}\usepackage{mathrsfs}\usepackage{upgreek}\setlength{\oddsidemargin}{-69pt}\begin{document}$$1-\alpha $$\end{document}
 \documentclass[12pt]{minimal}\usepackage{amsmath}\usepackage{wasysym}\usepackage{amsfonts}\usepackage{amssymb}\usepackage{amsbsy}\usepackage{mathrsfs}\usepackage{upgreek}\setlength{\oddsidemargin}{-69pt}\begin{document}$$=$$\end{document}
 0.95) confidence interval is no greater than
\documentclass[12pt]{minimal}\usepackage{amsmath}\usepackage{wasysym}\usepackage{amsfonts}\usepackage{amssymb}\usepackage{amsbsy}\usepackage{mathrsfs}\usepackage{upgreek}\setlength{\oddsidemargin}{-69pt}\begin{document}$$25\%$$\end{document}
0.95) confidence interval is no greater than
\documentclass[12pt]{minimal}\usepackage{amsmath}\usepackage{wasysym}\usepackage{amsfonts}\usepackage{amssymb}\usepackage{amsbsy}\usepackage{mathrsfs}\usepackage{upgreek}\setlength{\oddsidemargin}{-69pt}\begin{document}$$25\%$$\end{document}
 of the point estimate (i.e.,
\documentclass[12pt]{minimal}\usepackage{amsmath}\usepackage{wasysym}\usepackage{amsfonts}\usepackage{amssymb}\usepackage{amsbsy}\usepackage{mathrsfs}\usepackage{upgreek}\setlength{\oddsidemargin}{-69pt}\begin{document}$$\omega $$\end{document}
of the point estimate (i.e.,
\documentclass[12pt]{minimal}\usepackage{amsmath}\usepackage{wasysym}\usepackage{amsfonts}\usepackage{amssymb}\usepackage{amsbsy}\usepackage{mathrsfs}\usepackage{upgreek}\setlength{\oddsidemargin}{-69pt}\begin{document}$$\omega $$\end{document}
 =
\documentclass[12pt]{minimal}\usepackage{amsmath}\usepackage{wasysym}\usepackage{amsfonts}\usepackage{amssymb}\usepackage{amsbsy}\usepackage{mathrsfs}\usepackage{upgreek}\setlength{\oddsidemargin}{-69pt}\begin{document}$$0.25\pi _s$$\end{document}
=
\documentclass[12pt]{minimal}\usepackage{amsmath}\usepackage{wasysym}\usepackage{amsfonts}\usepackage{amssymb}\usepackage{amsbsy}\usepackage{mathrsfs}\usepackage{upgreek}\setlength{\oddsidemargin}{-69pt}\begin{document}$$0.25\pi _s$$\end{document}
 ), for the various RRT models considered in this article.
3.1. Warner’s RRT Model
Within Warner’s RRT model, two mutually exclusive questions about the sensitive attributes are: (A) Have you ever made promises without an intention to deliver in a negotiation? (A
\documentclass[12pt]{minimal}\usepackage{amsmath}\usepackage{wasysym}\usepackage{amsfonts}\usepackage{amssymb}\usepackage{amsbsy}\usepackage{mathrsfs}\usepackage{upgreek}\setlength{\oddsidemargin}{-69pt}\begin{document}$$^c$$\end{document}
 ) Have you never made promises without an intention to deliver in a negotiation? These two questions are presented with probability p
\documentclass[12pt]{minimal}\usepackage{amsmath}\usepackage{wasysym}\usepackage{amsfonts}\usepackage{amssymb}\usepackage{amsbsy}\usepackage{mathrsfs}\usepackage{upgreek}\setlength{\oddsidemargin}{-69pt}\begin{document}$$=$$\end{document}
) Have you never made promises without an intention to deliver in a negotiation? These two questions are presented with probability p
\documentclass[12pt]{minimal}\usepackage{amsmath}\usepackage{wasysym}\usepackage{amsfonts}\usepackage{amssymb}\usepackage{amsbsy}\usepackage{mathrsfs}\usepackage{upgreek}\setlength{\oddsidemargin}{-69pt}\begin{document}$$=$$\end{document}
 0.3 and
\documentclass[12pt]{minimal}\usepackage{amsmath}\usepackage{wasysym}\usepackage{amsfonts}\usepackage{amssymb}\usepackage{amsbsy}\usepackage{mathrsfs}\usepackage{upgreek}\setlength{\oddsidemargin}{-69pt}\begin{document}$$1-p$$\end{document}
0.3 and
\documentclass[12pt]{minimal}\usepackage{amsmath}\usepackage{wasysym}\usepackage{amsfonts}\usepackage{amssymb}\usepackage{amsbsy}\usepackage{mathrsfs}\usepackage{upgreek}\setlength{\oddsidemargin}{-69pt}\begin{document}$$1-p$$\end{document}
 \documentclass[12pt]{minimal}\usepackage{amsmath}\usepackage{wasysym}\usepackage{amsfonts}\usepackage{amssymb}\usepackage{amsbsy}\usepackage{mathrsfs}\usepackage{upgreek}\setlength{\oddsidemargin}{-69pt}\begin{document}$$=$$\end{document}
 0.7, respectively. With
\documentclass[12pt]{minimal}\usepackage{amsmath}\usepackage{wasysym}\usepackage{amsfonts}\usepackage{amssymb}\usepackage{amsbsy}\usepackage{mathrsfs}\usepackage{upgreek}\setlength{\oddsidemargin}{-69pt}\begin{document}$$\pi _s$$\end{document}
0.7, respectively. With
\documentclass[12pt]{minimal}\usepackage{amsmath}\usepackage{wasysym}\usepackage{amsfonts}\usepackage{amssymb}\usepackage{amsbsy}\usepackage{mathrsfs}\usepackage{upgreek}\setlength{\oddsidemargin}{-69pt}\begin{document}$$\pi _s$$\end{document}
 \documentclass[12pt]{minimal}\usepackage{amsmath}\usepackage{wasysym}\usepackage{amsfonts}\usepackage{amssymb}\usepackage{amsbsy}\usepackage{mathrsfs}\usepackage{upgreek}\setlength{\oddsidemargin}{-69pt}\begin{document}$$=$$\end{document}
 0.165, the approximate sample size n
\documentclass[12pt]{minimal}\usepackage{amsmath}\usepackage{wasysym}\usepackage{amsfonts}\usepackage{amssymb}\usepackage{amsbsy}\usepackage{mathrsfs}\usepackage{upgreek}\setlength{\oddsidemargin}{-69pt}\begin{document}$$=$$\end{document}
0.165, the approximate sample size n
\documentclass[12pt]{minimal}\usepackage{amsmath}\usepackage{wasysym}\usepackage{amsfonts}\usepackage{amssymb}\usepackage{amsbsy}\usepackage{mathrsfs}\usepackage{upgreek}\setlength{\oddsidemargin}{-69pt}\begin{document}$$=$$\end{document}
 3326 is calculated from Eq. (4) based on Wald CI and n
\documentclass[12pt]{minimal}\usepackage{amsmath}\usepackage{wasysym}\usepackage{amsfonts}\usepackage{amssymb}\usepackage{amsbsy}\usepackage{mathrsfs}\usepackage{upgreek}\setlength{\oddsidemargin}{-69pt}\begin{document}$$=$$\end{document}
3326 is calculated from Eq. (4) based on Wald CI and n
\documentclass[12pt]{minimal}\usepackage{amsmath}\usepackage{wasysym}\usepackage{amsfonts}\usepackage{amssymb}\usepackage{amsbsy}\usepackage{mathrsfs}\usepackage{upgreek}\setlength{\oddsidemargin}{-69pt}\begin{document}$$=$$\end{document}
 3322 is calculated from Eq. (6) based on Wilson CI, respectively. The corresponding ECPs (EAPs) are
\documentclass[12pt]{minimal}\usepackage{amsmath}\usepackage{wasysym}\usepackage{amsfonts}\usepackage{amssymb}\usepackage{amsbsy}\usepackage{mathrsfs}\usepackage{upgreek}\setlength{\oddsidemargin}{-69pt}\begin{document}$$94.93\%$$\end{document}
3322 is calculated from Eq. (6) based on Wilson CI, respectively. The corresponding ECPs (EAPs) are
\documentclass[12pt]{minimal}\usepackage{amsmath}\usepackage{wasysym}\usepackage{amsfonts}\usepackage{amssymb}\usepackage{amsbsy}\usepackage{mathrsfs}\usepackage{upgreek}\setlength{\oddsidemargin}{-69pt}\begin{document}$$94.93\%$$\end{document}
 (
\documentclass[12pt]{minimal}\usepackage{amsmath}\usepackage{wasysym}\usepackage{amsfonts}\usepackage{amssymb}\usepackage{amsbsy}\usepackage{mathrsfs}\usepackage{upgreek}\setlength{\oddsidemargin}{-69pt}\begin{document}$$95.89\%$$\end{document}
(
\documentclass[12pt]{minimal}\usepackage{amsmath}\usepackage{wasysym}\usepackage{amsfonts}\usepackage{amssymb}\usepackage{amsbsy}\usepackage{mathrsfs}\usepackage{upgreek}\setlength{\oddsidemargin}{-69pt}\begin{document}$$95.89\%$$\end{document}
 ) and
\documentclass[12pt]{minimal}\usepackage{amsmath}\usepackage{wasysym}\usepackage{amsfonts}\usepackage{amssymb}\usepackage{amsbsy}\usepackage{mathrsfs}\usepackage{upgreek}\setlength{\oddsidemargin}{-69pt}\begin{document}$$95.03\%$$\end{document}
) and
\documentclass[12pt]{minimal}\usepackage{amsmath}\usepackage{wasysym}\usepackage{amsfonts}\usepackage{amssymb}\usepackage{amsbsy}\usepackage{mathrsfs}\usepackage{upgreek}\setlength{\oddsidemargin}{-69pt}\begin{document}$$95.03\%$$\end{document}
 (
\documentclass[12pt]{minimal}\usepackage{amsmath}\usepackage{wasysym}\usepackage{amsfonts}\usepackage{amssymb}\usepackage{amsbsy}\usepackage{mathrsfs}\usepackage{upgreek}\setlength{\oddsidemargin}{-69pt}\begin{document}$$95.73\%$$\end{document}
(
\documentclass[12pt]{minimal}\usepackage{amsmath}\usepackage{wasysym}\usepackage{amsfonts}\usepackage{amssymb}\usepackage{amsbsy}\usepackage{mathrsfs}\usepackage{upgreek}\setlength{\oddsidemargin}{-69pt}\begin{document}$$95.73\%$$\end{document}
 ) for Wald and Wilson methods, respectively. In contrast, the conventional sample sizes (i.e., the assurance probability
\documentclass[12pt]{minimal}\usepackage{amsmath}\usepackage{wasysym}\usepackage{amsfonts}\usepackage{amssymb}\usepackage{amsbsy}\usepackage{mathrsfs}\usepackage{upgreek}\setlength{\oddsidemargin}{-69pt}\begin{document}$$1-\beta =50\%$$\end{document}
) for Wald and Wilson methods, respectively. In contrast, the conventional sample sizes (i.e., the assurance probability
\documentclass[12pt]{minimal}\usepackage{amsmath}\usepackage{wasysym}\usepackage{amsfonts}\usepackage{amssymb}\usepackage{amsbsy}\usepackage{mathrsfs}\usepackage{upgreek}\setlength{\oddsidemargin}{-69pt}\begin{document}$$1-\beta =50\%$$\end{document}
 ) required for a two-sided
\documentclass[12pt]{minimal}\usepackage{amsmath}\usepackage{wasysym}\usepackage{amsfonts}\usepackage{amssymb}\usepackage{amsbsy}\usepackage{mathrsfs}\usepackage{upgreek}\setlength{\oddsidemargin}{-69pt}\begin{document}$$95\%$$\end{document}
) required for a two-sided
\documentclass[12pt]{minimal}\usepackage{amsmath}\usepackage{wasysym}\usepackage{amsfonts}\usepackage{amssymb}\usepackage{amsbsy}\usepackage{mathrsfs}\usepackage{upgreek}\setlength{\oddsidemargin}{-69pt}\begin{document}$$95\%$$\end{document}
 confidence interval with expected width
\documentclass[12pt]{minimal}\usepackage{amsmath}\usepackage{wasysym}\usepackage{amsfonts}\usepackage{amssymb}\usepackage{amsbsy}\usepackage{mathrsfs}\usepackage{upgreek}\setlength{\oddsidemargin}{-69pt}\begin{document}$$\omega $$\end{document}
confidence interval with expected width
\documentclass[12pt]{minimal}\usepackage{amsmath}\usepackage{wasysym}\usepackage{amsfonts}\usepackage{amssymb}\usepackage{amsbsy}\usepackage{mathrsfs}\usepackage{upgreek}\setlength{\oddsidemargin}{-69pt}\begin{document}$$\omega $$\end{document}
 \documentclass[12pt]{minimal}\usepackage{amsmath}\usepackage{wasysym}\usepackage{amsfonts}\usepackage{amssymb}\usepackage{amsbsy}\usepackage{mathrsfs}\usepackage{upgreek}\setlength{\oddsidemargin}{-69pt}\begin{document}$$=$$\end{document}
 \documentclass[12pt]{minimal}\usepackage{amsmath}\usepackage{wasysym}\usepackage{amsfonts}\usepackage{amssymb}\usepackage{amsbsy}\usepackage{mathrsfs}\usepackage{upgreek}\setlength{\oddsidemargin}{-69pt}\begin{document}$$0.25\pi _s$$\end{document}
 are n
\documentclass[12pt]{minimal}\usepackage{amsmath}\usepackage{wasysym}\usepackage{amsfonts}\usepackage{amssymb}\usepackage{amsbsy}\usepackage{mathrsfs}\usepackage{upgreek}\setlength{\oddsidemargin}{-69pt}\begin{document}$$=$$\end{document}
are n
\documentclass[12pt]{minimal}\usepackage{amsmath}\usepackage{wasysym}\usepackage{amsfonts}\usepackage{amssymb}\usepackage{amsbsy}\usepackage{mathrsfs}\usepackage{upgreek}\setlength{\oddsidemargin}{-69pt}\begin{document}$$=$$\end{document}
 3274 and 3271, respectively. The corresponding ECPs (EAPs) are
\documentclass[12pt]{minimal}\usepackage{amsmath}\usepackage{wasysym}\usepackage{amsfonts}\usepackage{amssymb}\usepackage{amsbsy}\usepackage{mathrsfs}\usepackage{upgreek}\setlength{\oddsidemargin}{-69pt}\begin{document}$$94.87\%$$\end{document}
3274 and 3271, respectively. The corresponding ECPs (EAPs) are
\documentclass[12pt]{minimal}\usepackage{amsmath}\usepackage{wasysym}\usepackage{amsfonts}\usepackage{amssymb}\usepackage{amsbsy}\usepackage{mathrsfs}\usepackage{upgreek}\setlength{\oddsidemargin}{-69pt}\begin{document}$$94.87\%$$\end{document}
 (
\documentclass[12pt]{minimal}\usepackage{amsmath}\usepackage{wasysym}\usepackage{amsfonts}\usepackage{amssymb}\usepackage{amsbsy}\usepackage{mathrsfs}\usepackage{upgreek}\setlength{\oddsidemargin}{-69pt}\begin{document}$$50.95\%$$\end{document}
(
\documentclass[12pt]{minimal}\usepackage{amsmath}\usepackage{wasysym}\usepackage{amsfonts}\usepackage{amssymb}\usepackage{amsbsy}\usepackage{mathrsfs}\usepackage{upgreek}\setlength{\oddsidemargin}{-69pt}\begin{document}$$50.95\%$$\end{document}
 ) and
\documentclass[12pt]{minimal}\usepackage{amsmath}\usepackage{wasysym}\usepackage{amsfonts}\usepackage{amssymb}\usepackage{amsbsy}\usepackage{mathrsfs}\usepackage{upgreek}\setlength{\oddsidemargin}{-69pt}\begin{document}$$95.15\%$$\end{document}
) and
\documentclass[12pt]{minimal}\usepackage{amsmath}\usepackage{wasysym}\usepackage{amsfonts}\usepackage{amssymb}\usepackage{amsbsy}\usepackage{mathrsfs}\usepackage{upgreek}\setlength{\oddsidemargin}{-69pt}\begin{document}$$95.15\%$$\end{document}
 (
\documentclass[12pt]{minimal}\usepackage{amsmath}\usepackage{wasysym}\usepackage{amsfonts}\usepackage{amssymb}\usepackage{amsbsy}\usepackage{mathrsfs}\usepackage{upgreek}\setlength{\oddsidemargin}{-69pt}\begin{document}$$51.16\%$$\end{document}
(
\documentclass[12pt]{minimal}\usepackage{amsmath}\usepackage{wasysym}\usepackage{amsfonts}\usepackage{amssymb}\usepackage{amsbsy}\usepackage{mathrsfs}\usepackage{upgreek}\setlength{\oddsidemargin}{-69pt}\begin{document}$$51.16\%$$\end{document}
 ) for the Wald and Wilson methods, respectively.
3.2. Unrelated Question Model
Within the unrelated question model, a neutral question N, for example, “Were you born in odd months?” is required in addition to the sensitive question (A): Have you ever made promises without an intention to deliver in a negotiation? Hence,
\documentclass[12pt]{minimal}\usepackage{amsmath}\usepackage{wasysym}\usepackage{amsfonts}\usepackage{amssymb}\usepackage{amsbsy}\usepackage{mathrsfs}\usepackage{upgreek}\setlength{\oddsidemargin}{-69pt}\begin{document}$$\pi _N$$\end{document}
 \documentclass[12pt]{minimal}\usepackage{amsmath}\usepackage{wasysym}\usepackage{amsfonts}\usepackage{amssymb}\usepackage{amsbsy}\usepackage{mathrsfs}\usepackage{upgreek}\setlength{\oddsidemargin}{-69pt}\begin{document}$$=$$\end{document}
 0.5. Assume that the sensitive question and the neutral question are presented with probabilities p
\documentclass[12pt]{minimal}\usepackage{amsmath}\usepackage{wasysym}\usepackage{amsfonts}\usepackage{amssymb}\usepackage{amsbsy}\usepackage{mathrsfs}\usepackage{upgreek}\setlength{\oddsidemargin}{-69pt}\begin{document}$$=$$\end{document}
0.5. Assume that the sensitive question and the neutral question are presented with probabilities p
\documentclass[12pt]{minimal}\usepackage{amsmath}\usepackage{wasysym}\usepackage{amsfonts}\usepackage{amssymb}\usepackage{amsbsy}\usepackage{mathrsfs}\usepackage{upgreek}\setlength{\oddsidemargin}{-69pt}\begin{document}$$=$$\end{document}
 0.7 and
\documentclass[12pt]{minimal}\usepackage{amsmath}\usepackage{wasysym}\usepackage{amsfonts}\usepackage{amssymb}\usepackage{amsbsy}\usepackage{mathrsfs}\usepackage{upgreek}\setlength{\oddsidemargin}{-69pt}\begin{document}$$1-p$$\end{document}
0.7 and
\documentclass[12pt]{minimal}\usepackage{amsmath}\usepackage{wasysym}\usepackage{amsfonts}\usepackage{amssymb}\usepackage{amsbsy}\usepackage{mathrsfs}\usepackage{upgreek}\setlength{\oddsidemargin}{-69pt}\begin{document}$$1-p$$\end{document}
 \documentclass[12pt]{minimal}\usepackage{amsmath}\usepackage{wasysym}\usepackage{amsfonts}\usepackage{amssymb}\usepackage{amsbsy}\usepackage{mathrsfs}\usepackage{upgreek}\setlength{\oddsidemargin}{-69pt}\begin{document}$$=$$\end{document}
 0.3, respectively. With
\documentclass[12pt]{minimal}\usepackage{amsmath}\usepackage{wasysym}\usepackage{amsfonts}\usepackage{amssymb}\usepackage{amsbsy}\usepackage{mathrsfs}\usepackage{upgreek}\setlength{\oddsidemargin}{-69pt}\begin{document}$$\pi _s$$\end{document}
0.3, respectively. With
\documentclass[12pt]{minimal}\usepackage{amsmath}\usepackage{wasysym}\usepackage{amsfonts}\usepackage{amssymb}\usepackage{amsbsy}\usepackage{mathrsfs}\usepackage{upgreek}\setlength{\oddsidemargin}{-69pt}\begin{document}$$\pi _s$$\end{document}
 \documentclass[12pt]{minimal}\usepackage{amsmath}\usepackage{wasysym}\usepackage{amsfonts}\usepackage{amssymb}\usepackage{amsbsy}\usepackage{mathrsfs}\usepackage{upgreek}\setlength{\oddsidemargin}{-69pt}\begin{document}$$=$$\end{document}
 0.165, the approximate sample size n
\documentclass[12pt]{minimal}\usepackage{amsmath}\usepackage{wasysym}\usepackage{amsfonts}\usepackage{amssymb}\usepackage{amsbsy}\usepackage{mathrsfs}\usepackage{upgreek}\setlength{\oddsidemargin}{-69pt}\begin{document}$$=$$\end{document}
0.165, the approximate sample size n
\documentclass[12pt]{minimal}\usepackage{amsmath}\usepackage{wasysym}\usepackage{amsfonts}\usepackage{amssymb}\usepackage{amsbsy}\usepackage{mathrsfs}\usepackage{upgreek}\setlength{\oddsidemargin}{-69pt}\begin{document}$$=$$\end{document}
 950 is calculated from Equation (11) based on Wald CI and n
\documentclass[12pt]{minimal}\usepackage{amsmath}\usepackage{wasysym}\usepackage{amsfonts}\usepackage{amssymb}\usepackage{amsbsy}\usepackage{mathrsfs}\usepackage{upgreek}\setlength{\oddsidemargin}{-69pt}\begin{document}$$=$$\end{document}
950 is calculated from Equation (11) based on Wald CI and n
\documentclass[12pt]{minimal}\usepackage{amsmath}\usepackage{wasysym}\usepackage{amsfonts}\usepackage{amssymb}\usepackage{amsbsy}\usepackage{mathrsfs}\usepackage{upgreek}\setlength{\oddsidemargin}{-69pt}\begin{document}$$=$$\end{document}
 946 is calculated from Equation (14) based on Wilson CI, respectively. The corresponding ECPs (EAPs) are
\documentclass[12pt]{minimal}\usepackage{amsmath}\usepackage{wasysym}\usepackage{amsfonts}\usepackage{amssymb}\usepackage{amsbsy}\usepackage{mathrsfs}\usepackage{upgreek}\setlength{\oddsidemargin}{-69pt}\begin{document}$$94.77\%$$\end{document}
946 is calculated from Equation (14) based on Wilson CI, respectively. The corresponding ECPs (EAPs) are
\documentclass[12pt]{minimal}\usepackage{amsmath}\usepackage{wasysym}\usepackage{amsfonts}\usepackage{amssymb}\usepackage{amsbsy}\usepackage{mathrsfs}\usepackage{upgreek}\setlength{\oddsidemargin}{-69pt}\begin{document}$$94.77\%$$\end{document}
 (
\documentclass[12pt]{minimal}\usepackage{amsmath}\usepackage{wasysym}\usepackage{amsfonts}\usepackage{amssymb}\usepackage{amsbsy}\usepackage{mathrsfs}\usepackage{upgreek}\setlength{\oddsidemargin}{-69pt}\begin{document}$$96.13\%$$\end{document}
(
\documentclass[12pt]{minimal}\usepackage{amsmath}\usepackage{wasysym}\usepackage{amsfonts}\usepackage{amssymb}\usepackage{amsbsy}\usepackage{mathrsfs}\usepackage{upgreek}\setlength{\oddsidemargin}{-69pt}\begin{document}$$96.13\%$$\end{document}
 ) and
\documentclass[12pt]{minimal}\usepackage{amsmath}\usepackage{wasysym}\usepackage{amsfonts}\usepackage{amssymb}\usepackage{amsbsy}\usepackage{mathrsfs}\usepackage{upgreek}\setlength{\oddsidemargin}{-69pt}\begin{document}$$94.97\%$$\end{document}
) and
\documentclass[12pt]{minimal}\usepackage{amsmath}\usepackage{wasysym}\usepackage{amsfonts}\usepackage{amssymb}\usepackage{amsbsy}\usepackage{mathrsfs}\usepackage{upgreek}\setlength{\oddsidemargin}{-69pt}\begin{document}$$94.97\%$$\end{document}
 (
\documentclass[12pt]{minimal}\usepackage{amsmath}\usepackage{wasysym}\usepackage{amsfonts}\usepackage{amssymb}\usepackage{amsbsy}\usepackage{mathrsfs}\usepackage{upgreek}\setlength{\oddsidemargin}{-69pt}\begin{document}$$95.62\%$$\end{document}
(
\documentclass[12pt]{minimal}\usepackage{amsmath}\usepackage{wasysym}\usepackage{amsfonts}\usepackage{amssymb}\usepackage{amsbsy}\usepackage{mathrsfs}\usepackage{upgreek}\setlength{\oddsidemargin}{-69pt}\begin{document}$$95.62\%$$\end{document}
 ) for Wald and Wilson methods, respectively. In contrast, when the conventional sample sizes (i.e., the assurance probability
\documentclass[12pt]{minimal}\usepackage{amsmath}\usepackage{wasysym}\usepackage{amsfonts}\usepackage{amssymb}\usepackage{amsbsy}\usepackage{mathrsfs}\usepackage{upgreek}\setlength{\oddsidemargin}{-69pt}\begin{document}$$1-\beta =50\%$$\end{document}
) for Wald and Wilson methods, respectively. In contrast, when the conventional sample sizes (i.e., the assurance probability
\documentclass[12pt]{minimal}\usepackage{amsmath}\usepackage{wasysym}\usepackage{amsfonts}\usepackage{amssymb}\usepackage{amsbsy}\usepackage{mathrsfs}\usepackage{upgreek}\setlength{\oddsidemargin}{-69pt}\begin{document}$$1-\beta =50\%$$\end{document}
 ) required for a two-sided
\documentclass[12pt]{minimal}\usepackage{amsmath}\usepackage{wasysym}\usepackage{amsfonts}\usepackage{amssymb}\usepackage{amsbsy}\usepackage{mathrsfs}\usepackage{upgreek}\setlength{\oddsidemargin}{-69pt}\begin{document}$$95\%$$\end{document}
) required for a two-sided
\documentclass[12pt]{minimal}\usepackage{amsmath}\usepackage{wasysym}\usepackage{amsfonts}\usepackage{amssymb}\usepackage{amsbsy}\usepackage{mathrsfs}\usepackage{upgreek}\setlength{\oddsidemargin}{-69pt}\begin{document}$$95\%$$\end{document}
 confidence interval with an expected width
\documentclass[12pt]{minimal}\usepackage{amsmath}\usepackage{wasysym}\usepackage{amsfonts}\usepackage{amssymb}\usepackage{amsbsy}\usepackage{mathrsfs}\usepackage{upgreek}\setlength{\oddsidemargin}{-69pt}\begin{document}$$\omega $$\end{document}
confidence interval with an expected width
\documentclass[12pt]{minimal}\usepackage{amsmath}\usepackage{wasysym}\usepackage{amsfonts}\usepackage{amssymb}\usepackage{amsbsy}\usepackage{mathrsfs}\usepackage{upgreek}\setlength{\oddsidemargin}{-69pt}\begin{document}$$\omega $$\end{document}
 \documentclass[12pt]{minimal}\usepackage{amsmath}\usepackage{wasysym}\usepackage{amsfonts}\usepackage{amssymb}\usepackage{amsbsy}\usepackage{mathrsfs}\usepackage{upgreek}\setlength{\oddsidemargin}{-69pt}\begin{document}$$=$$\end{document}
 \documentclass[12pt]{minimal}\usepackage{amsmath}\usepackage{wasysym}\usepackage{amsfonts}\usepackage{amssymb}\usepackage{amsbsy}\usepackage{mathrsfs}\usepackage{upgreek}\setlength{\oddsidemargin}{-69pt}\begin{document}$$0.25\pi _s$$\end{document}
 are n
\documentclass[12pt]{minimal}\usepackage{amsmath}\usepackage{wasysym}\usepackage{amsfonts}\usepackage{amssymb}\usepackage{amsbsy}\usepackage{mathrsfs}\usepackage{upgreek}\setlength{\oddsidemargin}{-69pt}\begin{document}$$=$$\end{document}
are n
\documentclass[12pt]{minimal}\usepackage{amsmath}\usepackage{wasysym}\usepackage{amsfonts}\usepackage{amssymb}\usepackage{amsbsy}\usepackage{mathrsfs}\usepackage{upgreek}\setlength{\oddsidemargin}{-69pt}\begin{document}$$=$$\end{document}
 898 and 896, the corresponding ECPs (EAPs) are
\documentclass[12pt]{minimal}\usepackage{amsmath}\usepackage{wasysym}\usepackage{amsfonts}\usepackage{amssymb}\usepackage{amsbsy}\usepackage{mathrsfs}\usepackage{upgreek}\setlength{\oddsidemargin}{-69pt}\begin{document}$$94.67\%$$\end{document}
898 and 896, the corresponding ECPs (EAPs) are
\documentclass[12pt]{minimal}\usepackage{amsmath}\usepackage{wasysym}\usepackage{amsfonts}\usepackage{amssymb}\usepackage{amsbsy}\usepackage{mathrsfs}\usepackage{upgreek}\setlength{\oddsidemargin}{-69pt}\begin{document}$$94.67\%$$\end{document}
 (
\documentclass[12pt]{minimal}\usepackage{amsmath}\usepackage{wasysym}\usepackage{amsfonts}\usepackage{amssymb}\usepackage{amsbsy}\usepackage{mathrsfs}\usepackage{upgreek}\setlength{\oddsidemargin}{-69pt}\begin{document}$$50.68\%$$\end{document}
(
\documentclass[12pt]{minimal}\usepackage{amsmath}\usepackage{wasysym}\usepackage{amsfonts}\usepackage{amssymb}\usepackage{amsbsy}\usepackage{mathrsfs}\usepackage{upgreek}\setlength{\oddsidemargin}{-69pt}\begin{document}$$50.68\%$$\end{document}
 ) and
\documentclass[12pt]{minimal}\usepackage{amsmath}\usepackage{wasysym}\usepackage{amsfonts}\usepackage{amssymb}\usepackage{amsbsy}\usepackage{mathrsfs}\usepackage{upgreek}\setlength{\oddsidemargin}{-69pt}\begin{document}$$94.94\%$$\end{document}
) and
\documentclass[12pt]{minimal}\usepackage{amsmath}\usepackage{wasysym}\usepackage{amsfonts}\usepackage{amssymb}\usepackage{amsbsy}\usepackage{mathrsfs}\usepackage{upgreek}\setlength{\oddsidemargin}{-69pt}\begin{document}$$94.94\%$$\end{document}
 (
\documentclass[12pt]{minimal}\usepackage{amsmath}\usepackage{wasysym}\usepackage{amsfonts}\usepackage{amssymb}\usepackage{amsbsy}\usepackage{mathrsfs}\usepackage{upgreek}\setlength{\oddsidemargin}{-69pt}\begin{document}$$49.17\%$$\end{document}
(
\documentclass[12pt]{minimal}\usepackage{amsmath}\usepackage{wasysym}\usepackage{amsfonts}\usepackage{amssymb}\usepackage{amsbsy}\usepackage{mathrsfs}\usepackage{upgreek}\setlength{\oddsidemargin}{-69pt}\begin{document}$$49.17\%$$\end{document}
 ) for the Wald and Wilson methods, respectively.
3.3. Item Count Technique
Within the model of item count technique, assume that
\documentclass[12pt]{minimal}\usepackage{amsmath}\usepackage{wasysym}\usepackage{amsfonts}\usepackage{amssymb}\usepackage{amsbsy}\usepackage{mathrsfs}\usepackage{upgreek}\setlength{\oddsidemargin}{-69pt}\begin{document}$$k=4$$\end{document}
 neutral questions are used by a researcher and that the probability of answering each of these neutral question with “yes” is 0.5, i.e.,
\documentclass[12pt]{minimal}\usepackage{amsmath}\usepackage{wasysym}\usepackage{amsfonts}\usepackage{amssymb}\usepackage{amsbsy}\usepackage{mathrsfs}\usepackage{upgreek}\setlength{\oddsidemargin}{-69pt}\begin{document}$$\pi _i$$\end{document}
neutral questions are used by a researcher and that the probability of answering each of these neutral question with “yes” is 0.5, i.e.,
\documentclass[12pt]{minimal}\usepackage{amsmath}\usepackage{wasysym}\usepackage{amsfonts}\usepackage{amssymb}\usepackage{amsbsy}\usepackage{mathrsfs}\usepackage{upgreek}\setlength{\oddsidemargin}{-69pt}\begin{document}$$\pi _i$$\end{document}
 \documentclass[12pt]{minimal}\usepackage{amsmath}\usepackage{wasysym}\usepackage{amsfonts}\usepackage{amssymb}\usepackage{amsbsy}\usepackage{mathrsfs}\usepackage{upgreek}\setlength{\oddsidemargin}{-69pt}\begin{document}$$=$$\end{document}
 0.5 for i
\documentclass[12pt]{minimal}\usepackage{amsmath}\usepackage{wasysym}\usepackage{amsfonts}\usepackage{amssymb}\usepackage{amsbsy}\usepackage{mathrsfs}\usepackage{upgreek}\setlength{\oddsidemargin}{-69pt}\begin{document}$$=$$\end{document}
0.5 for i
\documentclass[12pt]{minimal}\usepackage{amsmath}\usepackage{wasysym}\usepackage{amsfonts}\usepackage{amssymb}\usepackage{amsbsy}\usepackage{mathrsfs}\usepackage{upgreek}\setlength{\oddsidemargin}{-69pt}\begin{document}$$=$$\end{document}
 1, 2, 3, 4, the number of respondents in control group is the same as that in experiment group, i.e.,
\documentclass[12pt]{minimal}\usepackage{amsmath}\usepackage{wasysym}\usepackage{amsfonts}\usepackage{amssymb}\usepackage{amsbsy}\usepackage{mathrsfs}\usepackage{upgreek}\setlength{\oddsidemargin}{-69pt}\begin{document}$$n_c$$\end{document}
1, 2, 3, 4, the number of respondents in control group is the same as that in experiment group, i.e.,
\documentclass[12pt]{minimal}\usepackage{amsmath}\usepackage{wasysym}\usepackage{amsfonts}\usepackage{amssymb}\usepackage{amsbsy}\usepackage{mathrsfs}\usepackage{upgreek}\setlength{\oddsidemargin}{-69pt}\begin{document}$$n_c$$\end{document}
 \documentclass[12pt]{minimal}\usepackage{amsmath}\usepackage{wasysym}\usepackage{amsfonts}\usepackage{amssymb}\usepackage{amsbsy}\usepackage{mathrsfs}\usepackage{upgreek}\setlength{\oddsidemargin}{-69pt}\begin{document}$$=$$\end{document}
 \documentclass[12pt]{minimal}\usepackage{amsmath}\usepackage{wasysym}\usepackage{amsfonts}\usepackage{amssymb}\usepackage{amsbsy}\usepackage{mathrsfs}\usepackage{upgreek}\setlength{\oddsidemargin}{-69pt}\begin{document}$$n_e$$\end{document}
 \documentclass[12pt]{minimal}\usepackage{amsmath}\usepackage{wasysym}\usepackage{amsfonts}\usepackage{amssymb}\usepackage{amsbsy}\usepackage{mathrsfs}\usepackage{upgreek}\setlength{\oddsidemargin}{-69pt}\begin{document}$$=$$\end{document}
 \documentclass[12pt]{minimal}\usepackage{amsmath}\usepackage{wasysym}\usepackage{amsfonts}\usepackage{amssymb}\usepackage{amsbsy}\usepackage{mathrsfs}\usepackage{upgreek}\setlength{\oddsidemargin}{-69pt}\begin{document}$$\frac{1}{2}n$$\end{document}
 . With
\documentclass[12pt]{minimal}\usepackage{amsmath}\usepackage{wasysym}\usepackage{amsfonts}\usepackage{amssymb}\usepackage{amsbsy}\usepackage{mathrsfs}\usepackage{upgreek}\setlength{\oddsidemargin}{-69pt}\begin{document}$$\pi _s$$\end{document}
. With
\documentclass[12pt]{minimal}\usepackage{amsmath}\usepackage{wasysym}\usepackage{amsfonts}\usepackage{amssymb}\usepackage{amsbsy}\usepackage{mathrsfs}\usepackage{upgreek}\setlength{\oddsidemargin}{-69pt}\begin{document}$$\pi _s$$\end{document}
 \documentclass[12pt]{minimal}\usepackage{amsmath}\usepackage{wasysym}\usepackage{amsfonts}\usepackage{amssymb}\usepackage{amsbsy}\usepackage{mathrsfs}\usepackage{upgreek}\setlength{\oddsidemargin}{-69pt}\begin{document}$$=$$\end{document}
 0.165, the approximate sample size n
\documentclass[12pt]{minimal}\usepackage{amsmath}\usepackage{wasysym}\usepackage{amsfonts}\usepackage{amssymb}\usepackage{amsbsy}\usepackage{mathrsfs}\usepackage{upgreek}\setlength{\oddsidemargin}{-69pt}\begin{document}$$=$$\end{document}
0.165, the approximate sample size n
\documentclass[12pt]{minimal}\usepackage{amsmath}\usepackage{wasysym}\usepackage{amsfonts}\usepackage{amssymb}\usepackage{amsbsy}\usepackage{mathrsfs}\usepackage{upgreek}\setlength{\oddsidemargin}{-69pt}\begin{document}$$=$$\end{document}
 9756 is calculated from Equation (18) based on Wald CI and n
\documentclass[12pt]{minimal}\usepackage{amsmath}\usepackage{wasysym}\usepackage{amsfonts}\usepackage{amssymb}\usepackage{amsbsy}\usepackage{mathrsfs}\usepackage{upgreek}\setlength{\oddsidemargin}{-69pt}\begin{document}$$=$$\end{document}
9756 is calculated from Equation (18) based on Wald CI and n
\documentclass[12pt]{minimal}\usepackage{amsmath}\usepackage{wasysym}\usepackage{amsfonts}\usepackage{amssymb}\usepackage{amsbsy}\usepackage{mathrsfs}\usepackage{upgreek}\setlength{\oddsidemargin}{-69pt}\begin{document}$$=$$\end{document}
 9748 is calculated from Equation (20) based on Wilson CI, respectively. The corresponding ECPs (EAPs) are
\documentclass[12pt]{minimal}\usepackage{amsmath}\usepackage{wasysym}\usepackage{amsfonts}\usepackage{amssymb}\usepackage{amsbsy}\usepackage{mathrsfs}\usepackage{upgreek}\setlength{\oddsidemargin}{-69pt}\begin{document}$$95.04\%$$\end{document}
9748 is calculated from Equation (20) based on Wilson CI, respectively. The corresponding ECPs (EAPs) are
\documentclass[12pt]{minimal}\usepackage{amsmath}\usepackage{wasysym}\usepackage{amsfonts}\usepackage{amssymb}\usepackage{amsbsy}\usepackage{mathrsfs}\usepackage{upgreek}\setlength{\oddsidemargin}{-69pt}\begin{document}$$95.04\%$$\end{document}
 (
\documentclass[12pt]{minimal}\usepackage{amsmath}\usepackage{wasysym}\usepackage{amsfonts}\usepackage{amssymb}\usepackage{amsbsy}\usepackage{mathrsfs}\usepackage{upgreek}\setlength{\oddsidemargin}{-69pt}\begin{document}$$95.83\%$$\end{document}
(
\documentclass[12pt]{minimal}\usepackage{amsmath}\usepackage{wasysym}\usepackage{amsfonts}\usepackage{amssymb}\usepackage{amsbsy}\usepackage{mathrsfs}\usepackage{upgreek}\setlength{\oddsidemargin}{-69pt}\begin{document}$$95.83\%$$\end{document}
 ) and
\documentclass[12pt]{minimal}\usepackage{amsmath}\usepackage{wasysym}\usepackage{amsfonts}\usepackage{amssymb}\usepackage{amsbsy}\usepackage{mathrsfs}\usepackage{upgreek}\setlength{\oddsidemargin}{-69pt}\begin{document}$$95.05\%$$\end{document}
) and
\documentclass[12pt]{minimal}\usepackage{amsmath}\usepackage{wasysym}\usepackage{amsfonts}\usepackage{amssymb}\usepackage{amsbsy}\usepackage{mathrsfs}\usepackage{upgreek}\setlength{\oddsidemargin}{-69pt}\begin{document}$$95.05\%$$\end{document}
 (
\documentclass[12pt]{minimal}\usepackage{amsmath}\usepackage{wasysym}\usepackage{amsfonts}\usepackage{amssymb}\usepackage{amsbsy}\usepackage{mathrsfs}\usepackage{upgreek}\setlength{\oddsidemargin}{-69pt}\begin{document}$$95.56\%$$\end{document}
(
\documentclass[12pt]{minimal}\usepackage{amsmath}\usepackage{wasysym}\usepackage{amsfonts}\usepackage{amssymb}\usepackage{amsbsy}\usepackage{mathrsfs}\usepackage{upgreek}\setlength{\oddsidemargin}{-69pt}\begin{document}$$95.56\%$$\end{document}
 ) for Wald and Wilson methods, respectively. In contrast, when the conventional sample sizes (i.e., the assurance probability
\documentclass[12pt]{minimal}\usepackage{amsmath}\usepackage{wasysym}\usepackage{amsfonts}\usepackage{amssymb}\usepackage{amsbsy}\usepackage{mathrsfs}\usepackage{upgreek}\setlength{\oddsidemargin}{-69pt}\begin{document}$$1-\beta =50\%$$\end{document}
) for Wald and Wilson methods, respectively. In contrast, when the conventional sample sizes (i.e., the assurance probability
\documentclass[12pt]{minimal}\usepackage{amsmath}\usepackage{wasysym}\usepackage{amsfonts}\usepackage{amssymb}\usepackage{amsbsy}\usepackage{mathrsfs}\usepackage{upgreek}\setlength{\oddsidemargin}{-69pt}\begin{document}$$1-\beta =50\%$$\end{document}
 ) required for a two-sided
\documentclass[12pt]{minimal}\usepackage{amsmath}\usepackage{wasysym}\usepackage{amsfonts}\usepackage{amssymb}\usepackage{amsbsy}\usepackage{mathrsfs}\usepackage{upgreek}\setlength{\oddsidemargin}{-69pt}\begin{document}$$95\%$$\end{document}
) required for a two-sided
\documentclass[12pt]{minimal}\usepackage{amsmath}\usepackage{wasysym}\usepackage{amsfonts}\usepackage{amssymb}\usepackage{amsbsy}\usepackage{mathrsfs}\usepackage{upgreek}\setlength{\oddsidemargin}{-69pt}\begin{document}$$95\%$$\end{document}
 confidence interval only with an expected width
\documentclass[12pt]{minimal}\usepackage{amsmath}\usepackage{wasysym}\usepackage{amsfonts}\usepackage{amssymb}\usepackage{amsbsy}\usepackage{mathrsfs}\usepackage{upgreek}\setlength{\oddsidemargin}{-69pt}\begin{document}$$\omega $$\end{document}
confidence interval only with an expected width
\documentclass[12pt]{minimal}\usepackage{amsmath}\usepackage{wasysym}\usepackage{amsfonts}\usepackage{amssymb}\usepackage{amsbsy}\usepackage{mathrsfs}\usepackage{upgreek}\setlength{\oddsidemargin}{-69pt}\begin{document}$$\omega $$\end{document}
 \documentclass[12pt]{minimal}\usepackage{amsmath}\usepackage{wasysym}\usepackage{amsfonts}\usepackage{amssymb}\usepackage{amsbsy}\usepackage{mathrsfs}\usepackage{upgreek}\setlength{\oddsidemargin}{-69pt}\begin{document}$$=$$\end{document}
 \documentclass[12pt]{minimal}\usepackage{amsmath}\usepackage{wasysym}\usepackage{amsfonts}\usepackage{amssymb}\usepackage{amsbsy}\usepackage{mathrsfs}\usepackage{upgreek}\setlength{\oddsidemargin}{-69pt}\begin{document}$$0.25\pi _s$$\end{document}
 are n
\documentclass[12pt]{minimal}\usepackage{amsmath}\usepackage{wasysym}\usepackage{amsfonts}\usepackage{amssymb}\usepackage{amsbsy}\usepackage{mathrsfs}\usepackage{upgreek}\setlength{\oddsidemargin}{-69pt}\begin{document}$$=$$\end{document}
are n
\documentclass[12pt]{minimal}\usepackage{amsmath}\usepackage{wasysym}\usepackage{amsfonts}\usepackage{amssymb}\usepackage{amsbsy}\usepackage{mathrsfs}\usepackage{upgreek}\setlength{\oddsidemargin}{-69pt}\begin{document}$$=$$\end{document}
 9652 and 9646, the corresponding ECPs (EAPs) are
\documentclass[12pt]{minimal}\usepackage{amsmath}\usepackage{wasysym}\usepackage{amsfonts}\usepackage{amssymb}\usepackage{amsbsy}\usepackage{mathrsfs}\usepackage{upgreek}\setlength{\oddsidemargin}{-69pt}\begin{document}$$94.78\%$$\end{document}
9652 and 9646, the corresponding ECPs (EAPs) are
\documentclass[12pt]{minimal}\usepackage{amsmath}\usepackage{wasysym}\usepackage{amsfonts}\usepackage{amssymb}\usepackage{amsbsy}\usepackage{mathrsfs}\usepackage{upgreek}\setlength{\oddsidemargin}{-69pt}\begin{document}$$94.78\%$$\end{document}
 (
\documentclass[12pt]{minimal}\usepackage{amsmath}\usepackage{wasysym}\usepackage{amsfonts}\usepackage{amssymb}\usepackage{amsbsy}\usepackage{mathrsfs}\usepackage{upgreek}\setlength{\oddsidemargin}{-69pt}\begin{document}$$49.03\%$$\end{document}
(
\documentclass[12pt]{minimal}\usepackage{amsmath}\usepackage{wasysym}\usepackage{amsfonts}\usepackage{amssymb}\usepackage{amsbsy}\usepackage{mathrsfs}\usepackage{upgreek}\setlength{\oddsidemargin}{-69pt}\begin{document}$$49.03\%$$\end{document}
 ) and
\documentclass[12pt]{minimal}\usepackage{amsmath}\usepackage{wasysym}\usepackage{amsfonts}\usepackage{amssymb}\usepackage{amsbsy}\usepackage{mathrsfs}\usepackage{upgreek}\setlength{\oddsidemargin}{-69pt}\begin{document}$$95.03\%$$\end{document}
) and
\documentclass[12pt]{minimal}\usepackage{amsmath}\usepackage{wasysym}\usepackage{amsfonts}\usepackage{amssymb}\usepackage{amsbsy}\usepackage{mathrsfs}\usepackage{upgreek}\setlength{\oddsidemargin}{-69pt}\begin{document}$$95.03\%$$\end{document}
 (
\documentclass[12pt]{minimal}\usepackage{amsmath}\usepackage{wasysym}\usepackage{amsfonts}\usepackage{amssymb}\usepackage{amsbsy}\usepackage{mathrsfs}\usepackage{upgreek}\setlength{\oddsidemargin}{-69pt}\begin{document}$$50.54\%$$\end{document}
(
\documentclass[12pt]{minimal}\usepackage{amsmath}\usepackage{wasysym}\usepackage{amsfonts}\usepackage{amssymb}\usepackage{amsbsy}\usepackage{mathrsfs}\usepackage{upgreek}\setlength{\oddsidemargin}{-69pt}\begin{document}$$50.54\%$$\end{document}
 ) for the Wald and Wilson methods, respectively.
3.4. Cheater Detection Model
Within the cheater detection model, assume that participants in the experiment and control groups receive the sensitive question with probability
\documentclass[12pt]{minimal}\usepackage{amsmath}\usepackage{wasysym}\usepackage{amsfonts}\usepackage{amssymb}\usepackage{amsbsy}\usepackage{mathrsfs}\usepackage{upgreek}\setlength{\oddsidemargin}{-69pt}\begin{document}$$p_1$$\end{document}
 \documentclass[12pt]{minimal}\usepackage{amsmath}\usepackage{wasysym}\usepackage{amsfonts}\usepackage{amssymb}\usepackage{amsbsy}\usepackage{mathrsfs}\usepackage{upgreek}\setlength{\oddsidemargin}{-69pt}\begin{document}$$=$$\end{document}
 0.2 and
\documentclass[12pt]{minimal}\usepackage{amsmath}\usepackage{wasysym}\usepackage{amsfonts}\usepackage{amssymb}\usepackage{amsbsy}\usepackage{mathrsfs}\usepackage{upgreek}\setlength{\oddsidemargin}{-69pt}\begin{document}$$p_2$$\end{document}
0.2 and
\documentclass[12pt]{minimal}\usepackage{amsmath}\usepackage{wasysym}\usepackage{amsfonts}\usepackage{amssymb}\usepackage{amsbsy}\usepackage{mathrsfs}\usepackage{upgreek}\setlength{\oddsidemargin}{-69pt}\begin{document}$$p_2$$\end{document}
 \documentclass[12pt]{minimal}\usepackage{amsmath}\usepackage{wasysym}\usepackage{amsfonts}\usepackage{amssymb}\usepackage{amsbsy}\usepackage{mathrsfs}\usepackage{upgreek}\setlength{\oddsidemargin}{-69pt}\begin{document}$$=$$\end{document}
 0.8, respectively. The numbers of participants in two groups are equal, i.e.,
\documentclass[12pt]{minimal}\usepackage{amsmath}\usepackage{wasysym}\usepackage{amsfonts}\usepackage{amssymb}\usepackage{amsbsy}\usepackage{mathrsfs}\usepackage{upgreek}\setlength{\oddsidemargin}{-69pt}\begin{document}$$n_1$$\end{document}
0.8, respectively. The numbers of participants in two groups are equal, i.e.,
\documentclass[12pt]{minimal}\usepackage{amsmath}\usepackage{wasysym}\usepackage{amsfonts}\usepackage{amssymb}\usepackage{amsbsy}\usepackage{mathrsfs}\usepackage{upgreek}\setlength{\oddsidemargin}{-69pt}\begin{document}$$n_1$$\end{document}
 \documentclass[12pt]{minimal}\usepackage{amsmath}\usepackage{wasysym}\usepackage{amsfonts}\usepackage{amssymb}\usepackage{amsbsy}\usepackage{mathrsfs}\usepackage{upgreek}\setlength{\oddsidemargin}{-69pt}\begin{document}$$=$$\end{document}
 \documentclass[12pt]{minimal}\usepackage{amsmath}\usepackage{wasysym}\usepackage{amsfonts}\usepackage{amssymb}\usepackage{amsbsy}\usepackage{mathrsfs}\usepackage{upgreek}\setlength{\oddsidemargin}{-69pt}\begin{document}$$n_2$$\end{document}
 \documentclass[12pt]{minimal}\usepackage{amsmath}\usepackage{wasysym}\usepackage{amsfonts}\usepackage{amssymb}\usepackage{amsbsy}\usepackage{mathrsfs}\usepackage{upgreek}\setlength{\oddsidemargin}{-69pt}\begin{document}$$=$$\end{document}
 \documentclass[12pt]{minimal}\usepackage{amsmath}\usepackage{wasysym}\usepackage{amsfonts}\usepackage{amssymb}\usepackage{amsbsy}\usepackage{mathrsfs}\usepackage{upgreek}\setlength{\oddsidemargin}{-69pt}\begin{document}$$\frac{1}{2}n$$\end{document}
 . With
\documentclass[12pt]{minimal}\usepackage{amsmath}\usepackage{wasysym}\usepackage{amsfonts}\usepackage{amssymb}\usepackage{amsbsy}\usepackage{mathrsfs}\usepackage{upgreek}\setlength{\oddsidemargin}{-69pt}\begin{document}$$\beta _s$$\end{document}
. With
\documentclass[12pt]{minimal}\usepackage{amsmath}\usepackage{wasysym}\usepackage{amsfonts}\usepackage{amssymb}\usepackage{amsbsy}\usepackage{mathrsfs}\usepackage{upgreek}\setlength{\oddsidemargin}{-69pt}\begin{document}$$\beta _s$$\end{document}
 \documentclass[12pt]{minimal}\usepackage{amsmath}\usepackage{wasysym}\usepackage{amsfonts}\usepackage{amssymb}\usepackage{amsbsy}\usepackage{mathrsfs}\usepackage{upgreek}\setlength{\oddsidemargin}{-69pt}\begin{document}$$=$$\end{document}
 0.7 and
\documentclass[12pt]{minimal}\usepackage{amsmath}\usepackage{wasysym}\usepackage{amsfonts}\usepackage{amssymb}\usepackage{amsbsy}\usepackage{mathrsfs}\usepackage{upgreek}\setlength{\oddsidemargin}{-69pt}\begin{document}$$\pi _s$$\end{document}
0.7 and
\documentclass[12pt]{minimal}\usepackage{amsmath}\usepackage{wasysym}\usepackage{amsfonts}\usepackage{amssymb}\usepackage{amsbsy}\usepackage{mathrsfs}\usepackage{upgreek}\setlength{\oddsidemargin}{-69pt}\begin{document}$$\pi _s$$\end{document}
 \documentclass[12pt]{minimal}\usepackage{amsmath}\usepackage{wasysym}\usepackage{amsfonts}\usepackage{amssymb}\usepackage{amsbsy}\usepackage{mathrsfs}\usepackage{upgreek}\setlength{\oddsidemargin}{-69pt}\begin{document}$$=$$\end{document}
 0.165, the approximate sample size of n
\documentclass[12pt]{minimal}\usepackage{amsmath}\usepackage{wasysym}\usepackage{amsfonts}\usepackage{amssymb}\usepackage{amsbsy}\usepackage{mathrsfs}\usepackage{upgreek}\setlength{\oddsidemargin}{-69pt}\begin{document}$$=$$\end{document}
0.165, the approximate sample size of n
\documentclass[12pt]{minimal}\usepackage{amsmath}\usepackage{wasysym}\usepackage{amsfonts}\usepackage{amssymb}\usepackage{amsbsy}\usepackage{mathrsfs}\usepackage{upgreek}\setlength{\oddsidemargin}{-69pt}\begin{document}$$=$$\end{document}
 1878 is calculated from Equation (26) based on Wald CI and the approximate sample size of n
\documentclass[12pt]{minimal}\usepackage{amsmath}\usepackage{wasysym}\usepackage{amsfonts}\usepackage{amssymb}\usepackage{amsbsy}\usepackage{mathrsfs}\usepackage{upgreek}\setlength{\oddsidemargin}{-69pt}\begin{document}$$=$$\end{document}
1878 is calculated from Equation (26) based on Wald CI and the approximate sample size of n
\documentclass[12pt]{minimal}\usepackage{amsmath}\usepackage{wasysym}\usepackage{amsfonts}\usepackage{amssymb}\usepackage{amsbsy}\usepackage{mathrsfs}\usepackage{upgreek}\setlength{\oddsidemargin}{-69pt}\begin{document}$$=$$\end{document}
 1872 is calculated from Equation (29) based on Wilson CI, respectively. The corresponding ECPs (EAPs) are
\documentclass[12pt]{minimal}\usepackage{amsmath}\usepackage{wasysym}\usepackage{amsfonts}\usepackage{amssymb}\usepackage{amsbsy}\usepackage{mathrsfs}\usepackage{upgreek}\setlength{\oddsidemargin}{-69pt}\begin{document}$$95.04\%$$\end{document}
1872 is calculated from Equation (29) based on Wilson CI, respectively. The corresponding ECPs (EAPs) are
\documentclass[12pt]{minimal}\usepackage{amsmath}\usepackage{wasysym}\usepackage{amsfonts}\usepackage{amssymb}\usepackage{amsbsy}\usepackage{mathrsfs}\usepackage{upgreek}\setlength{\oddsidemargin}{-69pt}\begin{document}$$95.04\%$$\end{document}
 (
\documentclass[12pt]{minimal}\usepackage{amsmath}\usepackage{wasysym}\usepackage{amsfonts}\usepackage{amssymb}\usepackage{amsbsy}\usepackage{mathrsfs}\usepackage{upgreek}\setlength{\oddsidemargin}{-69pt}\begin{document}$$95.92\%$$\end{document}
(
\documentclass[12pt]{minimal}\usepackage{amsmath}\usepackage{wasysym}\usepackage{amsfonts}\usepackage{amssymb}\usepackage{amsbsy}\usepackage{mathrsfs}\usepackage{upgreek}\setlength{\oddsidemargin}{-69pt}\begin{document}$$95.92\%$$\end{document}
 ) and
\documentclass[12pt]{minimal}\usepackage{amsmath}\usepackage{wasysym}\usepackage{amsfonts}\usepackage{amssymb}\usepackage{amsbsy}\usepackage{mathrsfs}\usepackage{upgreek}\setlength{\oddsidemargin}{-69pt}\begin{document}$$94.78\%$$\end{document}
) and
\documentclass[12pt]{minimal}\usepackage{amsmath}\usepackage{wasysym}\usepackage{amsfonts}\usepackage{amssymb}\usepackage{amsbsy}\usepackage{mathrsfs}\usepackage{upgreek}\setlength{\oddsidemargin}{-69pt}\begin{document}$$94.78\%$$\end{document}
 (
\documentclass[12pt]{minimal}\usepackage{amsmath}\usepackage{wasysym}\usepackage{amsfonts}\usepackage{amssymb}\usepackage{amsbsy}\usepackage{mathrsfs}\usepackage{upgreek}\setlength{\oddsidemargin}{-69pt}\begin{document}$$95.95\%$$\end{document}
(
\documentclass[12pt]{minimal}\usepackage{amsmath}\usepackage{wasysym}\usepackage{amsfonts}\usepackage{amssymb}\usepackage{amsbsy}\usepackage{mathrsfs}\usepackage{upgreek}\setlength{\oddsidemargin}{-69pt}\begin{document}$$95.95\%$$\end{document}
 ) for the Wald and Wilson methods, respectively. In contrast, when the conventional sample sizes (i.e., the assurance probability
\documentclass[12pt]{minimal}\usepackage{amsmath}\usepackage{wasysym}\usepackage{amsfonts}\usepackage{amssymb}\usepackage{amsbsy}\usepackage{mathrsfs}\usepackage{upgreek}\setlength{\oddsidemargin}{-69pt}\begin{document}$$1-\beta =50\%$$\end{document}
) for the Wald and Wilson methods, respectively. In contrast, when the conventional sample sizes (i.e., the assurance probability
\documentclass[12pt]{minimal}\usepackage{amsmath}\usepackage{wasysym}\usepackage{amsfonts}\usepackage{amssymb}\usepackage{amsbsy}\usepackage{mathrsfs}\usepackage{upgreek}\setlength{\oddsidemargin}{-69pt}\begin{document}$$1-\beta =50\%$$\end{document}
 ) required for a two-sided
\documentclass[12pt]{minimal}\usepackage{amsmath}\usepackage{wasysym}\usepackage{amsfonts}\usepackage{amssymb}\usepackage{amsbsy}\usepackage{mathrsfs}\usepackage{upgreek}\setlength{\oddsidemargin}{-69pt}\begin{document}$$95\%$$\end{document}
) required for a two-sided
\documentclass[12pt]{minimal}\usepackage{amsmath}\usepackage{wasysym}\usepackage{amsfonts}\usepackage{amssymb}\usepackage{amsbsy}\usepackage{mathrsfs}\usepackage{upgreek}\setlength{\oddsidemargin}{-69pt}\begin{document}$$95\%$$\end{document}
 confidence interval with an expected width
\documentclass[12pt]{minimal}\usepackage{amsmath}\usepackage{wasysym}\usepackage{amsfonts}\usepackage{amssymb}\usepackage{amsbsy}\usepackage{mathrsfs}\usepackage{upgreek}\setlength{\oddsidemargin}{-69pt}\begin{document}$$\omega $$\end{document}
confidence interval with an expected width
\documentclass[12pt]{minimal}\usepackage{amsmath}\usepackage{wasysym}\usepackage{amsfonts}\usepackage{amssymb}\usepackage{amsbsy}\usepackage{mathrsfs}\usepackage{upgreek}\setlength{\oddsidemargin}{-69pt}\begin{document}$$\omega $$\end{document}
 \documentclass[12pt]{minimal}\usepackage{amsmath}\usepackage{wasysym}\usepackage{amsfonts}\usepackage{amssymb}\usepackage{amsbsy}\usepackage{mathrsfs}\usepackage{upgreek}\setlength{\oddsidemargin}{-69pt}\begin{document}$$=$$\end{document}
 \documentclass[12pt]{minimal}\usepackage{amsmath}\usepackage{wasysym}\usepackage{amsfonts}\usepackage{amssymb}\usepackage{amsbsy}\usepackage{mathrsfs}\usepackage{upgreek}\setlength{\oddsidemargin}{-69pt}\begin{document}$$0.25\pi _s$$\end{document}
 are n
\documentclass[12pt]{minimal}\usepackage{amsmath}\usepackage{wasysym}\usepackage{amsfonts}\usepackage{amssymb}\usepackage{amsbsy}\usepackage{mathrsfs}\usepackage{upgreek}\setlength{\oddsidemargin}{-69pt}\begin{document}$$=$$\end{document}
are n
\documentclass[12pt]{minimal}\usepackage{amsmath}\usepackage{wasysym}\usepackage{amsfonts}\usepackage{amssymb}\usepackage{amsbsy}\usepackage{mathrsfs}\usepackage{upgreek}\setlength{\oddsidemargin}{-69pt}\begin{document}$$=$$\end{document}
 1800 and 1794, the corresponding ECPs (EAPs) are
\documentclass[12pt]{minimal}\usepackage{amsmath}\usepackage{wasysym}\usepackage{amsfonts}\usepackage{amssymb}\usepackage{amsbsy}\usepackage{mathrsfs}\usepackage{upgreek}\setlength{\oddsidemargin}{-69pt}\begin{document}$$94.75\%$$\end{document}
1800 and 1794, the corresponding ECPs (EAPs) are
\documentclass[12pt]{minimal}\usepackage{amsmath}\usepackage{wasysym}\usepackage{amsfonts}\usepackage{amssymb}\usepackage{amsbsy}\usepackage{mathrsfs}\usepackage{upgreek}\setlength{\oddsidemargin}{-69pt}\begin{document}$$94.75\%$$\end{document}
 (
\documentclass[12pt]{minimal}\usepackage{amsmath}\usepackage{wasysym}\usepackage{amsfonts}\usepackage{amssymb}\usepackage{amsbsy}\usepackage{mathrsfs}\usepackage{upgreek}\setlength{\oddsidemargin}{-69pt}\begin{document}$$49.41\%$$\end{document}
(
\documentclass[12pt]{minimal}\usepackage{amsmath}\usepackage{wasysym}\usepackage{amsfonts}\usepackage{amssymb}\usepackage{amsbsy}\usepackage{mathrsfs}\usepackage{upgreek}\setlength{\oddsidemargin}{-69pt}\begin{document}$$49.41\%$$\end{document}
 ) and
\documentclass[12pt]{minimal}\usepackage{amsmath}\usepackage{wasysym}\usepackage{amsfonts}\usepackage{amssymb}\usepackage{amsbsy}\usepackage{mathrsfs}\usepackage{upgreek}\setlength{\oddsidemargin}{-69pt}\begin{document}$$95.00\%$$\end{document}
) and
\documentclass[12pt]{minimal}\usepackage{amsmath}\usepackage{wasysym}\usepackage{amsfonts}\usepackage{amssymb}\usepackage{amsbsy}\usepackage{mathrsfs}\usepackage{upgreek}\setlength{\oddsidemargin}{-69pt}\begin{document}$$95.00\%$$\end{document}
 (
\documentclass[12pt]{minimal}\usepackage{amsmath}\usepackage{wasysym}\usepackage{amsfonts}\usepackage{amssymb}\usepackage{amsbsy}\usepackage{mathrsfs}\usepackage{upgreek}\setlength{\oddsidemargin}{-69pt}\begin{document}$$49.07\%$$\end{document}
(
\documentclass[12pt]{minimal}\usepackage{amsmath}\usepackage{wasysym}\usepackage{amsfonts}\usepackage{amssymb}\usepackage{amsbsy}\usepackage{mathrsfs}\usepackage{upgreek}\setlength{\oddsidemargin}{-69pt}\begin{document}$$49.07\%$$\end{document}
 ) for the Wald and Wilson methods, respectively.
It should be noted that the recommended sample sizes for all models are greater than the number of participants (i.e., 240) recruited to Kern and Chugh’s (Reference Kern and Chugh2009) studies. In fact, with the sample size 240, the actual ECPs, ECWs and EAPs of CIs for
\documentclass[12pt]{minimal}\usepackage{amsmath}\usepackage{wasysym}\usepackage{amsfonts}\usepackage{amssymb}\usepackage{amsbsy}\usepackage{mathrsfs}\usepackage{upgreek}\setlength{\oddsidemargin}{-69pt}\begin{document}$$\pi _s$$\end{document}
 under the parameter settings being considered in the above studies for each model are reported in Table 7.
ECPs(%), ECWs and EAPs(%) of CIs for
\documentclass[12pt]{minimal}\usepackage{amsmath}\usepackage{wasysym}\usepackage{amsfonts}\usepackage{amssymb}\usepackage{amsbsy}\usepackage{mathrsfs}\usepackage{upgreek}\setlength{\oddsidemargin}{-69pt}\begin{document}$$\pi _s$$\end{document}
 under various RRT models with the actual sample size (i.e.,240 participants) and parameter settings same as those in Sect. 3 for the studies conducted in Kern and Chugh (Reference Kern and Chugh2009)

According to the results, the ECPs of CIs for
\documentclass[12pt]{minimal}\usepackage{amsmath}\usepackage{wasysym}\usepackage{amsfonts}\usepackage{amssymb}\usepackage{amsbsy}\usepackage{mathrsfs}\usepackage{upgreek}\setlength{\oddsidemargin}{-69pt}\begin{document}$$\pi _s$$\end{document}
 under all models are very close to the pre-assigned nominal confidence level (i.e.,
\documentclass[12pt]{minimal}\usepackage{amsmath}\usepackage{wasysym}\usepackage{amsfonts}\usepackage{amssymb}\usepackage{amsbsy}\usepackage{mathrsfs}\usepackage{upgreek}\setlength{\oddsidemargin}{-69pt}\begin{document}$$95\%$$\end{document}
under all models are very close to the pre-assigned nominal confidence level (i.e.,
\documentclass[12pt]{minimal}\usepackage{amsmath}\usepackage{wasysym}\usepackage{amsfonts}\usepackage{amssymb}\usepackage{amsbsy}\usepackage{mathrsfs}\usepackage{upgreek}\setlength{\oddsidemargin}{-69pt}\begin{document}$$95\%$$\end{document}
 ). However, the probabilities of controlling the half width of the CI that are not larger than
\documentclass[12pt]{minimal}\usepackage{amsmath}\usepackage{wasysym}\usepackage{amsfonts}\usepackage{amssymb}\usepackage{amsbsy}\usepackage{mathrsfs}\usepackage{upgreek}\setlength{\oddsidemargin}{-69pt}\begin{document}$$\omega =0.25\pi _s=0.04125$$\end{document}
). However, the probabilities of controlling the half width of the CI that are not larger than
\documentclass[12pt]{minimal}\usepackage{amsmath}\usepackage{wasysym}\usepackage{amsfonts}\usepackage{amssymb}\usepackage{amsbsy}\usepackage{mathrsfs}\usepackage{upgreek}\setlength{\oddsidemargin}{-69pt}\begin{document}$$\omega =0.25\pi _s=0.04125$$\end{document}
 are 0.0 for all models. In fact, the actual half widths of all CIs with sample size 240 are much greater than
\documentclass[12pt]{minimal}\usepackage{amsmath}\usepackage{wasysym}\usepackage{amsfonts}\usepackage{amssymb}\usepackage{amsbsy}\usepackage{mathrsfs}\usepackage{upgreek}\setlength{\oddsidemargin}{-69pt}\begin{document}$$\omega =0.25\pi _s=0.04125$$\end{document}
are 0.0 for all models. In fact, the actual half widths of all CIs with sample size 240 are much greater than
\documentclass[12pt]{minimal}\usepackage{amsmath}\usepackage{wasysym}\usepackage{amsfonts}\usepackage{amssymb}\usepackage{amsbsy}\usepackage{mathrsfs}\usepackage{upgreek}\setlength{\oddsidemargin}{-69pt}\begin{document}$$\omega =0.25\pi _s=0.04125$$\end{document}
 , as indicated in Table 7. Specifically, our findings suggest that when the assurance probability is not incorporated into the sample size estimation, the widths of CIs cannot be controlled even though the coverage probability is close to the nominal confidence level.
4. Conclusion and Discussion
For studying the prevalence of a sensitive attribute, determining the number of participants to be recruited to the survey is an important research aspect. In the context of survey sampling, sample size determination based on interval estimation is key objective. Therefore, the current research considers sample size determination using interval width control based on two CI types (i.e., Wald and Wilson CIs) for four different randomized response models (i.e., Warner’s model, UQM, ICT and CDM). The derived sample size formulas can control the width of a confidence interval at a specified confidence level with the assurance probability of achieving the pre-specified precision. Our simulation results demonstrate that all formulas derived from Wald and Wilson CIs are accurate in terms of empirical coverage probability (ECP) and empirical assurance probability (EAP). An important note is that sample size formulas based on Wilson CIs outperform those based on Wald CIs for various RRT models in the sense that the ECPs and EAPs of the former are closer to the pre-specified levels than those of the latter. Therefore, sample size formulas derived in this article may help researchers determine a sample size that can achieve pre-specified precision with an assurance probability in a survey study for detecting meaningful prevalence rates. As shown in Ulrich et al. (Reference Ulrich, Schröter, Striegel and Simon2012), the parameters of the four RRT models cannot be matched with each other; therefore, it is not realistic to compare the sample size formulas of the different RRT models in order to determine the most accurate one. Finally, the numerical examples regarding detecting negotiators’ use of unethical tactics in Sect. 3 clearly demonstrate how to better estimate the required sample size by using interval width control and carrying out a survey instead of conducting a full-scale experiment.
Generally, the two approaches that are employed to determine the desired sample size are, namely hypothesis testing and confidence interval estimation. It is well documented that the former involves both the type I error rate and power, while the latter does not explicitly involve power. In order that the sample size estimation based on expected confidence interval width can provide high assurance in achieving the desired precision, we incorporate an assurance probability for sample size determination to control the width of a confidence interval, i.e., sample size can be estimated by controlling the width of a confidence interval at a specified assurance probability. Ulrich et al. (Reference Ulrich, Schröter, Striegel and Simon2012) considered the sample size determination, in terms of hypothesis testing under four randomized response models. However, sample size formulas based on confidence interval width are not available in the extant literature. In this article, we derived such formulas for survey sampling of sensitive attributes. Note that most sample size estimates can be obtained by solving polynomial equation of degree not greater than four. Thus, no complicated computations are required in this article. We also developed program codes to compute the estimated sample sizes, and these program codes are available to readers as the supplementary material.
A restriction of our proposed sample size formulas relies on the specifications of relative accurate values of the prevalence rate (i.e.,
\documentclass[12pt]{minimal}\usepackage{amsmath}\usepackage{wasysym}\usepackage{amsfonts}\usepackage{amssymb}\usepackage{amsbsy}\usepackage{mathrsfs}\usepackage{upgreek}\setlength{\oddsidemargin}{-69pt}\begin{document}$$\pi _s$$\end{document}
 ) and other model parameters (e.g.,
\documentclass[12pt]{minimal}\usepackage{amsmath}\usepackage{wasysym}\usepackage{amsfonts}\usepackage{amssymb}\usepackage{amsbsy}\usepackage{mathrsfs}\usepackage{upgreek}\setlength{\oddsidemargin}{-69pt}\begin{document}$$\beta _s$$\end{document}
) and other model parameters (e.g.,
\documentclass[12pt]{minimal}\usepackage{amsmath}\usepackage{wasysym}\usepackage{amsfonts}\usepackage{amssymb}\usepackage{amsbsy}\usepackage{mathrsfs}\usepackage{upgreek}\setlength{\oddsidemargin}{-69pt}\begin{document}$$\beta _s$$\end{document}
 in CDM model). Researchers, who consider applying our proposed sample size formulas, should be aware that the actual confidence intervals could be wider than required if they cannot come up with accurate approximations of the true prevalence and other model parameters beforehand.
Recently, many variants of the RRT technique have been proposed. For example, Yu, Tian, & Tang (Reference Yu, Tian and Tang2008) developed a RRT variant (i.e., the crosswise model (CWM) with simple instructions. Specifically, the interviewee received a sensitive question (denoted as "S") and a neutral question (denoted as "N") simultaneously and was then asked to indicate whether the two answers given in "S" and "N" were the same or different. This model can be applied to both face-to-face personal interviews and mail questionnaire, because no randomization device is required. This also enables the interviewee to mask his or her answer to the sensitive question. Therefore, it has received considerable attention in the scientific community (e.g., Sagoe et al., Reference Sagoe, Cruyff, Spendiff, Chegeni, de Hon, van der Heijden, Saugy and Petrczi2021; Schnell & Thomas, Reference Schnell and Thomas2021). It is clear that the crosswise model is mathematically equivalent as Warner’s model. As a result, the reported formulas and the results of the Warner model are equally valid for CWM. Ostapczuk et al. (Reference Ostapczuk, Moshagen, Zhao and Musch2009) proposed a symmetric variant of CDM, but an iterative algorithm (e.g., expectation-maximization (EM) algorithm (Dempster, Laird, & Rubin, Reference Dempster, Laird and Rubin1977)) is needed to obtain the maximum likelihood estimations (MLEs) of parameters
\documentclass[12pt]{minimal}\usepackage{amsmath}\usepackage{wasysym}\usepackage{amsfonts}\usepackage{amssymb}\usepackage{amsbsy}\usepackage{mathrsfs}\usepackage{upgreek}\setlength{\oddsidemargin}{-69pt}\begin{document}$$\pi _s$$\end{document}
 ,
\documentclass[12pt]{minimal}\usepackage{amsmath}\usepackage{wasysym}\usepackage{amsfonts}\usepackage{amssymb}\usepackage{amsbsy}\usepackage{mathrsfs}\usepackage{upgreek}\setlength{\oddsidemargin}{-69pt}\begin{document}$$\beta _s$$\end{document}
,
\documentclass[12pt]{minimal}\usepackage{amsmath}\usepackage{wasysym}\usepackage{amsfonts}\usepackage{amssymb}\usepackage{amsbsy}\usepackage{mathrsfs}\usepackage{upgreek}\setlength{\oddsidemargin}{-69pt}\begin{document}$$\beta _s$$\end{document}
 and
\documentclass[12pt]{minimal}\usepackage{amsmath}\usepackage{wasysym}\usepackage{amsfonts}\usepackage{amssymb}\usepackage{amsbsy}\usepackage{mathrsfs}\usepackage{upgreek}\setlength{\oddsidemargin}{-69pt}\begin{document}$$\gamma $$\end{document}
and
\documentclass[12pt]{minimal}\usepackage{amsmath}\usepackage{wasysym}\usepackage{amsfonts}\usepackage{amssymb}\usepackage{amsbsy}\usepackage{mathrsfs}\usepackage{upgreek}\setlength{\oddsidemargin}{-69pt}\begin{document}$$\gamma $$\end{document}
 . Therefore, we do not consider the sample size determination under the symmetric CDM in this article.
Acknowledgements
The work of Shi-Fang Qiu and Man-Lai Tang was supported by the grants from the National Natural Science Foundation of China (Grant No. 11871124). The work of Man-Lai Tang was also supported through grants from the Research Grant Council of the Hong Kong Special Administrative Region (Projects UGC/FDS14/P06/17 and UGC/FDS14/P02/18).
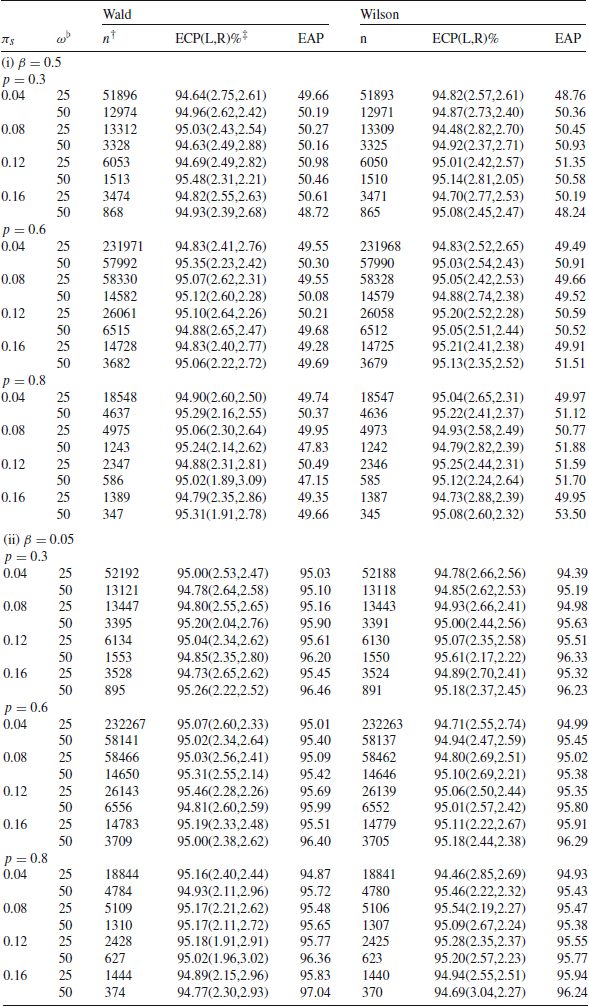


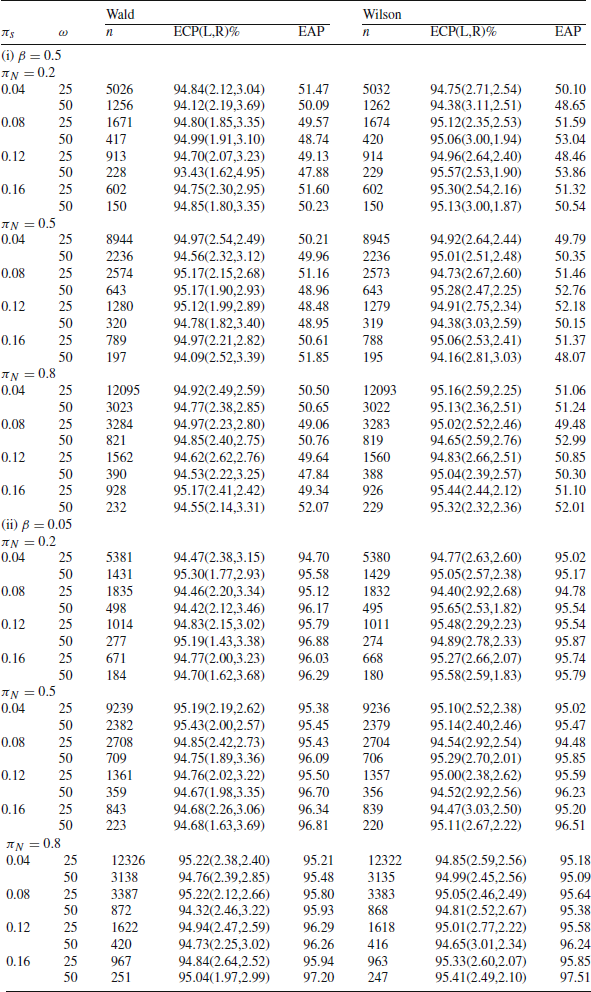


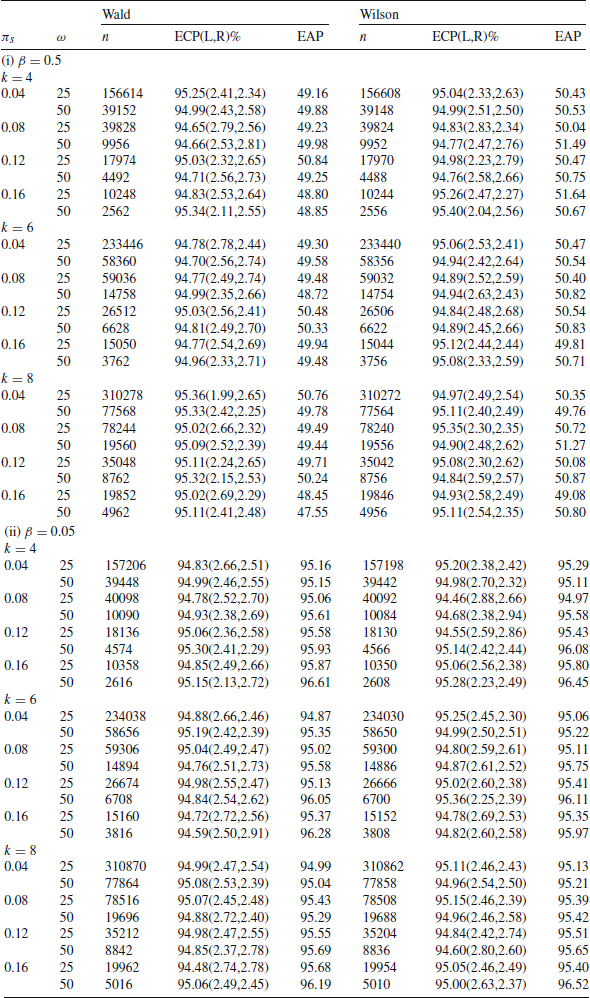


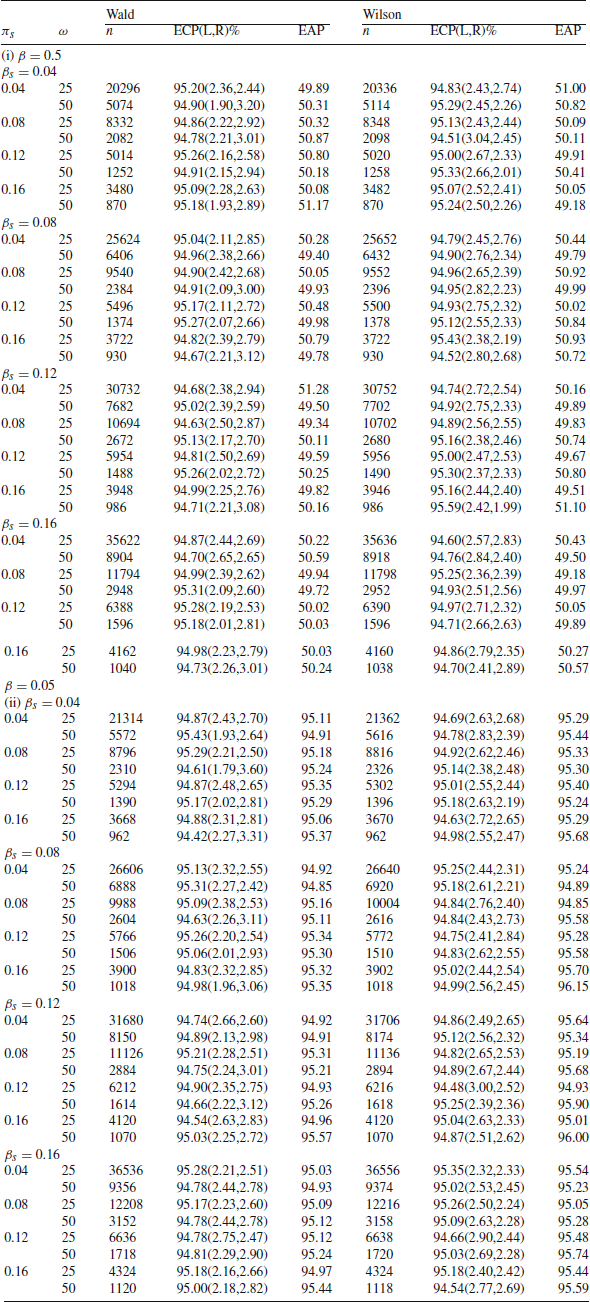


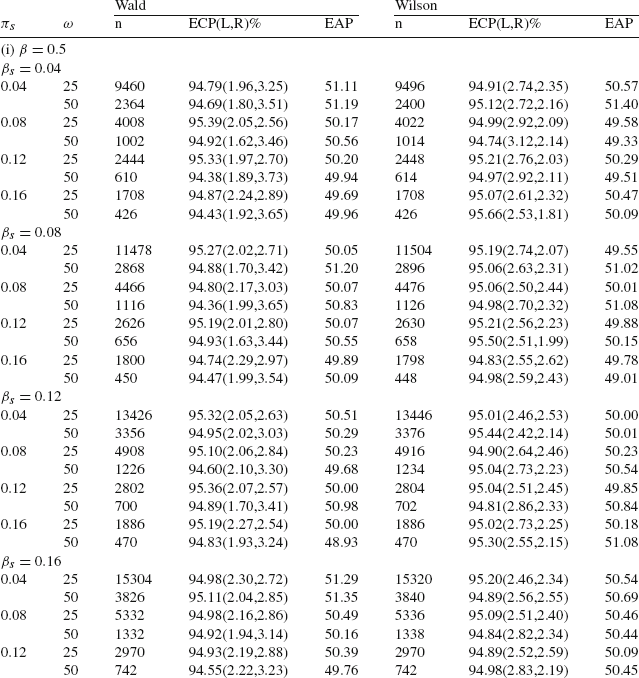


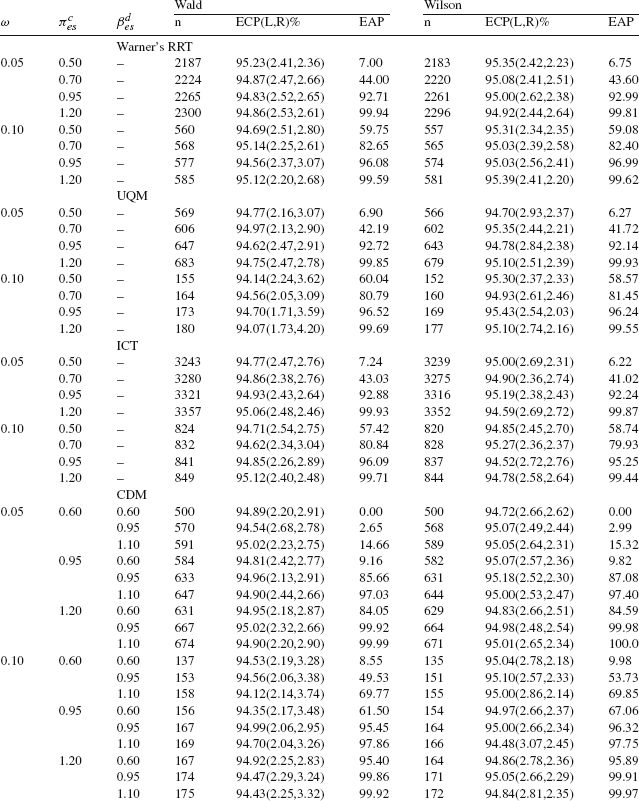


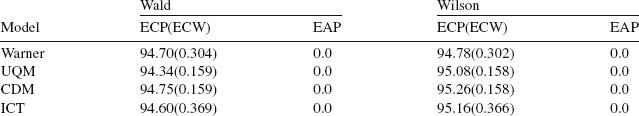


 Open access