

Introduction
A sound knowledge of the total ice volume and ice-thickness distribution of a glacier is essential for many glaciological and hydrological applications. The total ice volume defines the amount of water stored by glaciers in a given catchment, and the ice-thickness distribution exerts an influence on the hydrological characteristics of the basin. Studies addressing the impact of climate change on the hydrology of high alpine catchments (e.g. Reference Huss, Farinotti, Bauder and FunkHuss and others, 2008b) and most glacio-dynamical models (e.g. Reference Hubbard, Blatter, Nienow, Mair and HubbardHubbard and others, 1998) require the ice-thickness distribution as an initial condition.
Measuring the ice-thickness distribution of a glacier and deriving an estimate of its total volume is not, however, an easy task. Current ice-thickness measurement techniques, such as radio-echo sounding or borehole measurements, are expensive, laborious and difficult because of topographical constraints. Moreover, the determination of the ice volume of a glacier cannot be carried out directly, but is necessarily linked to inter- and extrapolation of direct (point) measurements.
For studies focusing on large samples of glaciers, it is necessary to develop alternative approaches which are based on readily available datasets. At present, the total ice volume of glaciers is often estimated using volume–area scaling relations (Reference ErasovErasov, 1968; Reference Müller, Caflisch and MüllerMüller and others, 1976; Reference Macheret and ZhuravlevMacheret and Zhuravlev, 1982; Reference Chen and OhmuraChen and Ohmura, 1990; Reference Bahr, Meier and PeckhamBahr and others, 1997). Several attempts have been made to infer the ice-thickness distribution on the basis of surface characteristics. These include applications of the shallow-ice approximation (Reference Paterson and DemersPaterson, 1971; Reference Haeberli and HoelzleHaeberli and Hoelzle, 1995) or more complex procedures such as inverse methods based on modelling (Reference Thorsteinsson, Raymond, Guðmundsson, Bindschadler, Vornberger and JoughinThorsteinsson and others, 2003; Reference RaymondRaymond, 2007). The second category has focused mainly on ice sheets and ice streams (Reference CollinsCollins, 1968; Reference Guðmundsson, Thorsteinsson and RaymondGuðmundsson and others, 2001).
We present a method for estimating both the overall ice volume and the ice-thickness distribution of alpine glaciers, based on mass turnover and principles of the ice-flow mechanics. The method was developed and validated on four alpine glaciers in Switzerland (Rhonegletscher, Silvrettagletscher, Unteraargletscher and Glacier de Zinal; Fig. 1), where ice-thickness measurements are available.
Location in Switzerland (map on the right) of the glaciers (a–d) considered in this study. Glacier surface elevation is indicated by 100 m contours. Solid lines show profiles for which radio-echo soundings are available. Note that the inset of Silvrettagletscher has been enlarged by a factor of two in relation to other glaciers.

Method
The purpose of our method is to estimate ice-thickness distribution from a given glacier surface topography. According to the principle of mass conservation, the mass-balance distribution should be balanced by the ice-flux divergence and the resulting surface elevation change. The ice thickness can then be inferred from the ice fluxes. The theoretical background is as follows.
Consider a vertical column of ice with length dx and height h in a longitudinal glacier profile (Fig. 2). If the ice density ρ is constant and only plane strain is occurring, in the continuum limit of Figure 2 the mass conservation equation is of the form:
Schematic diagram of the concept of mass conservation for an ice element in a longitudinal glacier profile.

where ∂h/∂t is the rate of ice-thickness change, ![]() and
and ![]() are the rates of mass gain or loss (mass balance) at the surface and the bed, respectively and q is the specific mass flux. In most glaciers
are the rates of mass gain or loss (mass balance) at the surface and the bed, respectively and q is the specific mass flux. In most glaciers ![]() is small compared to
is small compared to ![]() (Reference PatersonPaterson, 1994). In a more general three-dimensional (3-D) case, the mass conservation equation can be written:
(Reference PatersonPaterson, 1994). In a more general three-dimensional (3-D) case, the mass conservation equation can be written:
where ![]() is the ice-flux divergence. Integrating Equation (2) over the glacier map domain Ω leads to:
is the ice-flux divergence. Integrating Equation (2) over the glacier map domain Ω leads to:
since we can write (using Gauss’s law):
where ![]() is the normal vector to the glacier outline ∂Ω. In general, for a glacier, the spatial distributions of
is the normal vector to the glacier outline ∂Ω. In general, for a glacier, the spatial distributions of ![]() and ∂h/∂t are unknown and difficult to estimate because of the complex spatial variability. We therefore introduce a new variable,
and ∂h/∂t are unknown and difficult to estimate because of the complex spatial variability. We therefore introduce a new variable, ![]() (m w.e. a−1; the ‘dot’ of the time derivative is omitted to simplify notation), which varies linearly with elevation and satisfies:
(m w.e. a−1; the ‘dot’ of the time derivative is omitted to simplify notation), which varies linearly with elevation and satisfies:

The main advantage of estimating ![]() instead of
instead of ![]() and ∂h/∂t separately is that, under the condition in Equation (5), the integrated mass conservation equation (Equation (3)) is fulfilled without the need for information about the distribution of the surface mass balance and the spatial and temporal variation of the glacier surface elevation. If the given geometry corresponds to steady state,
and ∂h/∂t separately is that, under the condition in Equation (5), the integrated mass conservation equation (Equation (3)) is fulfilled without the need for information about the distribution of the surface mass balance and the spatial and temporal variation of the glacier surface elevation. If the given geometry corresponds to steady state, ![]() is the ‘actual’ (i.e. the actual observable) glacier surface mass balance. In the following,
is the ‘actual’ (i.e. the actual observable) glacier surface mass balance. In the following, ![]() is referred to as ‘apparent mass balance’.
is referred to as ‘apparent mass balance’.
The proposed method consists of estimating a distribution of the apparent mass balance, from which an ice flux for defined ice flowlines is computed. The flux is then converted to an ice thickness using an integrated form of Glen’s flow law (Reference GlenGlen, 1955) and interpolated over the entire glacier. The resulting ice-thickness distribution is adjusted with a factor that accounts for the local surface slope. The result is an estimate of the ice-thickness distribution of the considered glacier.
The required inputs are: (1) a digital elevation model (DEM) of the region; (2) a corresponding glacier outline; (3) a set of ice flowlines which determine the main ice-flow paths through the glacier; (4) a set of borders that confine the ‘ice-flow catchments’ of the defined ice flowlines (Fig. 3a); (5) three parameters defining the distribution of the apparent mass balance; and (6) two parameters describing the ice-flow dynamics.
Determination of (a) the area contributing to the ice volume flux at a given point of an ice flowline and (b) the ice-discharge effective width. Thin solid curves in (a) show the boundaries of the ice-flow catchments. The section p–p′ is perpendicular to the ice flowline (dashed) at the considered location (dot). The ice-discharge effective width (boundaries marked by crosses) is determined using the glacier surface slope as a criterion, i.e. the boundaries are set where the slope exceeds a given threshold α lim. The example refers to the northern tributary of Unteraargletscher.

Alpine valley glaciers are often composed of distinct branches flowing together into a main stream (e.g. Fig. 1a and c). In this case, a division into different units, here called ‘ice-flow catchments’, is necessary in order to represent the ice-flow dynamics. These catchments are digitized using topographic maps, aerial photographs or DEMs, tracking moraines or other geomorphological structures. The ice flowlines mainly correspond to the centre of the ice-flow catchments.
The following assumptions are made: (1) the apparent mass-balance distribution can be described using two vertical mass-balance gradients: ![]() for the accumulation area and
for the accumulation area and ![]() for the ablation area and an equilibrium-line altitude (ELA); (2) debris coverage reduces the apparent mass balance at a given location by a fixed percentage f
debris (Reference Schuler, Fischer, Sterr, Hock and GuðmundssonSchuler and others, 2002); and (3) the glacier flow dynamics can be described by Reference GlenGlen’s (1955) flow law.
for the ablation area and an equilibrium-line altitude (ELA); (2) debris coverage reduces the apparent mass balance at a given location by a fixed percentage f
debris (Reference Schuler, Fischer, Sterr, Hock and GuðmundssonSchuler and others, 2002); and (3) the glacier flow dynamics can be described by Reference GlenGlen’s (1955) flow law.
The vertical mass-balance gradients ![]() refer to the apparent mass balance
refer to the apparent mass balance ![]() and therefore do not necessarily correspond to the gradients of the actual mass balance. Glen’s flow law is parameterized with the flow rate factor A, the exponent n and a correction factor C, which accounts for the valley shape (in analogy to the shape factor introduced by Reference NyeNye (1965)), the basal sliding and the error arising from the approximation of the specific ice volume flux at the profile centre.
and therefore do not necessarily correspond to the gradients of the actual mass balance. Glen’s flow law is parameterized with the flow rate factor A, the exponent n and a correction factor C, which accounts for the valley shape (in analogy to the shape factor introduced by Reference NyeNye (1965)), the basal sliding and the error arising from the approximation of the specific ice volume flux at the profile centre.
The method can be divided into seven steps as follows.
-
1. Using the given glacier surface topography and the defined vertical mass-balance gradients, the apparent mass-balance distribution is calculated for each ice-flow catchment. Starting with an estimated ELA of z 0, the corresponding apparent mass balance
 for every gridcell i of elevation zi
is calculated using:(6)
for every gridcell i of elevation zi
is calculated using:(6)with f debris = 1 if the cell i is not debris-covered. The estimated ELA z 0 is then varied iteratively until the condition of Equation (5) is met. The ELA which satisfies this criterion is an ‘apparent ELA’
, which does not necessarily correspond to the actual ELA. The procedure is repeated for every ice-flow catchment. -
2. With the apparent mass-balance distribution calculated in step (1), the ice volume flux at each point of the ice flowlines is determined. This is done by cumulating the apparent mass balance
of every gridcell i of the area that contributes to the ice volume flux at the considered point. The contributing area is approximated as the area located upstream of a line perpendicular to the ice flowline at the considered point (Fig. 3a). -
3. The ice volume flux calculated in step (2) is normalized with the local glacier width relevant for the ice discharge (here called ‘ice-discharge effective width’) in order to obtain the mean specific ice volume flux
. The ice-discharge effective width is determined along cross-sections perpendicular to the ice flowlines and is based on the surrounding topography (Fig. 3b). The local glacier width, determined by the intersection of the perpendicular line and the glacier outline, is therefore reduced to the width for which the slope of the ice surface does not exceed a given threshold α
lim. The error due to the approximation of the specific ice volume flux at the centre of the cross-profile (q
centre) with the mean specific ice volume flux over the cross-profile is accounted for in the correction factor C. -
4. When laminar flow is assumed in a parallel-sided slab glacier model (Reference PatersonPaterson, 1994), the flow relation by Reference GlenGlen (1955) can be integrated and solved for the ice thickness. The ice thickness hi at any point of the flowline with a mean specific ice volume flux
can then be calculated with the equation:(7)The contribution of basal sliding to the total flow speed is accounted for in the correction factor C. ρ is the ice density, g the acceleration due to gravity and
the mean surface slope along the considered ice flowline. In the following, the flow rate factor A is taken from the literature. Its uncertainties are transferred into parameter C. If ice-thickness measurements are available, the correction factor C can be calibrated. Otherwise, an estimation is required. -
5. The ice thickness calculated in step (4) is used as input for a spatial interpolation. The glacier outline is used as a boundary condition with zero ice thickness. The interpolation routine uses an inverse distance averaging technique, weighting the individual interpolation nodes with the inverse of the squared distance from the considered point.
-
6. To include the effect of the local surface slope α on the ice thickness, the ice thickness interpolated in step (5) is multiplied by a factor proportional to
at every gridcell. The factor is derived from Equation (7). The local surface slope is determined from a smoothed ice surface and is filtered with a lower slope limit α
0 to prevent an overestimation of ice thicknesses in very flat zones (as the factor tends to infinity when α tends to zero). The factor is normalized in order to preserve the previously calculated total ice volume. -
7. Finally, the calculated ice thickness is smoothed with a two-dimensional (2-D) discrete Gaussian filter of constant extension.


The result is an estimate of the ice-thickness distribution of the entire glacier, which defines the overall ice volume. The bedrock topography can be calculated by subtracting the local ice thickness from the given glacier surface. A glacier surface smoothing is necessary to avoid the reproduction of small topographic surface features in the underlying bedrock.
Field Data
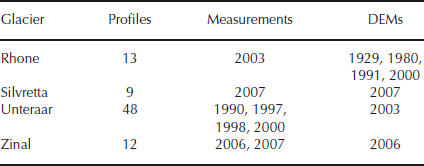
The method is applied to four alpine glaciers located in Switzerland (Fig. 1). The selected glaciers comprise different glacier types. Unteraargletscher and Rhonegletscher are large valley glaciers. The former is divided into three main branches flowing together and the latter has a compact geometry. Glacier de Zinal is a highly branched valley glacier of medium size and Silvrettagletscher is a small and compact mountain glacier. The ice-thickness distributions of the four glaciers are known along several cross-profiles from radio-echo soundings (Fig. 1). The glacier surface topography is given by DEMs and glacier outlines for different years. The methods used for data acquisition are described by Reference Bauder, Funk and GuðmundssonBauder and others (2003, Reference Bauder, Funk and Huss2007). The spatial resolution of the DEMs is 25 m for all glaciers. The available datasets are summarized in Table 1.
Available datasets: profiles (number of profiles with ice-thickness measurements); measurements (years in which the radio-echo sounding measurements were performed); and DEMs (years for which surface topography and glacier outlines are used)
Unteraargletscher was chosen for the validation because of the large number of datasets available. These include radio-echo sounding ice-thickness measurements (Reference Funk, Guðmundsson and HermannFunk and others, 1994; Reference Bauder, Funk and GuðmundssonBauder and others, 2003), annual surface ice-flow speed measurements from 1924 to 2005 on cross-profiles in the ablation area (Reference FlotronFlotron, 2007) and annual ice volume fluxes across profiles in the ablation area determined from surface velocity data (Reference Huss, Sugiyama, Bauder and FunkHuss and others, 2007).
Results
The method was applied to Rhonegletscher, Glacier de Zinal and Silvrettagletscher in order to calibrate the input parameters and to determine the sensitivity of the output with respect to the calibrated parameters. A validation was performed on Unteraargletscher.
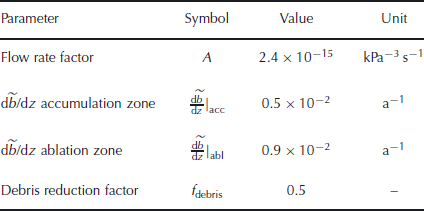
For the sake of simplicity, the same values for the vertical mass-balance gradients ![]() , the debris coverage reduction factor f
debris and the parameters of Glen’s flow law A and n were used for all glaciers (Table 2). The only glacier-specific parameter is the correction factor C (Table 3).
, the debris coverage reduction factor f
debris and the parameters of Glen’s flow law A and n were used for all glaciers (Table 2). The only glacier-specific parameter is the correction factor C (Table 3).
Parameter values and units
Glacier-specific values of the dimensionless correction factor C

The flow rate factor A was set to the value determined for alpine glaciers in previous studies (Reference Hubbard, Blatter, Nienow, Mair and HubbardHubbard and others, 1998; Reference GuðmundssonGuðmundsson, 1999). This value, obtained by fitting measured ice surface velocities to results of ice-flow models, is smaller by a factor of ∼2 compared to results from laboratory experiments (e.g. Reference PatersonPaterson, 1994).
For Rhonegletscher, Glacier de Zinal and Silvrettagletscher, the correction factor C was calibrated by fitting the calculated ice thicknesses to the radio-echo sounding measurements. For the validation on Unteraargletscher, C was set to the mean value calibrated for the considered valley glaciers, i.e. Rhonegletscher and Glacier de Zinal. The flow law exponent is n = 3. The values chosen for ![]() and f
debris are based on mass-balance studies on the considered glaciers (Reference Huss, Sugiyama, Bauder and FunkHuss and others, 2007, Reference Huss, Bauder, Funk and Hock2008a). As an approximation, we assumed that the gradients of the apparent mass balance
and f
debris are based on mass-balance studies on the considered glaciers (Reference Huss, Sugiyama, Bauder and FunkHuss and others, 2007, Reference Huss, Bauder, Funk and Hock2008a). As an approximation, we assumed that the gradients of the apparent mass balance ![]() correspond to the gradients of the actual mass balance. The ice density was assumed to be ρ = 900 kg m−3 for all glaciers. The threshold slope α
lim, which defines the ice-discharge effective width, and the lower slope limit used for the surface slope filtering were determined empirically and set at α
lim = 20° and α
0 = 5°, respectively.
correspond to the gradients of the actual mass balance. The ice density was assumed to be ρ = 900 kg m−3 for all glaciers. The threshold slope α
lim, which defines the ice-discharge effective width, and the lower slope limit used for the surface slope filtering were determined empirically and set at α
lim = 20° and α
0 = 5°, respectively.
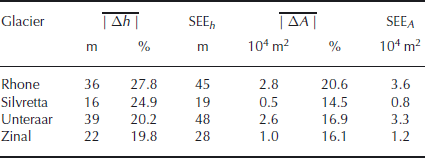
For Rhonegletscher, Glacier de Zinal and Silvrettagletscher, the mean absolute deviation between calculated and measured ice thicknesses is 26 m (corresponding to 19% of the measured ice thickness; standard error of estimate SEE = 36 m) (Fig. 4a). The mean absolute deviation between calculated and measured cross-sectional area is 1.6×10⁴ m2 (15%; SEE = 2.3 × 10⁴ m2) (Fig. 4b). The sum of all calculated cross-sectional areas deviates by 3% from the sum of the measured cross-sectional areas.
Comparison of calculated and measured (a) ice thickness h and (b) cross-sectional area A. For better visualization, the cross-sectional area is normalized with the mean measured area A N. The statistics, bottom right, refer to the whole ensemble of points (n: number of points; avg dev: average deviation; SEE: standard error of estimate).

On Unteraargletscher (used for validation), the absolute mean deviation between calculated and measured ice thickness is 39 m (20%; SEE = 50 m) (Fig. 5a). The absolute mean deviation between the calculated and the measured cross-sectional area is 2.6 × 10⁴ m2 (17%; SEE = 3.3 × 10⁴ m2) (Fig. 5b). The deviation of the sum of all cross-sectional areas amounts to 6%.
Comparison of calculated and measured ice thickness h (a) and cross-sectional area A (b) for Unteraargletscher (n: number of points; avg dev: average deviation; SEE: standard error of estimate).

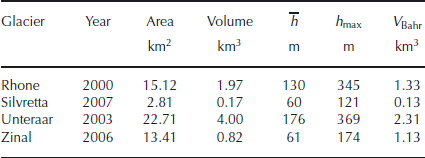
Table 4 lists the key parameters of the four analyzed glaciers. The ice volume determined using a volume–area scaling relation (Reference Bahr, Meier and PeckhamBahr and others, 1997) is reported for comparison purposes. Except for the highly branched Glacier de Zinal, the ice volume determined using the volume–area scaling relation is smaller than the volume calculated by our method (−37% on average). Numerical values characterizing the deviation between calculated and measured ice thicknesses for the individual glaciers are listed in Table 5. Figures 6–9 depict the calculated ice-thickness distribution; comparisons between calculated and measured bedrock topography along selected profiles are also provided.
Calculated ice-thickness distribution of Rhonegletscher. The insets (a–g) show the marked cross-sections; all have the same vertical exaggeration.

Calculated ice-thickness distribution of Glacier de Zinal. The insets (a–h) show the marked cross-sections; all have the same vertical exaggeration.

Calculated ice-thickness distribution of Silvrettagletscher. The insets (a–f) show the marked cross-sections; all have the same vertical exaggeration.

Calculated and measured ice-thickness distribution of Unteraargletscher. The insets (a–h) show the marked cross-sections. All have the same vertical exaggeration. ice-flow velocity measurements are available for the grey dashed profiles with numbers.

Key parameters for the four analyzed glaciers resulting from the method application. V Bahr is the total ice volume determined using the volume–area scaling relation of Reference Bahr, Meier and PeckhamBahr and others (1997)
Comparison between measured and calculated ice thickness and cross-sectional area (![]() : average absolute deviation between measured and calculated ice thickness; SEE
h
: standard error of estimate of
: average absolute deviation between measured and calculated ice thickness; SEE
h
: standard error of estimate of ![]() : average absolute deviation between measured and calculated cross-sectional area; and SEE
A
: standard error of estimate of |ΔA|)
: average absolute deviation between measured and calculated cross-sectional area; and SEE
A
: standard error of estimate of |ΔA|)
The comprehensive dataset available for Unteraargletscher allows two more aspects of the results to be validated. In the following, the ice volume fluxes and the surface flow velocities resulting from the presented method are compared with measurements and results of earlier studies.
Using the surface flow-speed measurements of Reference FlotronFlotron (2007) and the ice-thickness distribution known from radio-echo soundings, Reference Huss, Sugiyama, Bauder and FunkHuss and others (2007) calculated an annual ice volume flux (here referred to as ‘observed’ ice volume flux) for different cross-profiles in the ablation area. The flux was determined by integrating the flow-speed field resulting from up to 30 surface velocity measurements per profile. The vertical distribution of the horizontal flow speed was calculated from measured surface velocities with an assumption of simple shearing (Reference PatersonPaterson, 1994). These results are compared with the ice volume flux resulting from our method. The latter is determined by adding the ice volume fluxes of the individual ice flowlines at the location where the flowlines cross the considered profile.
The observed ice volume flux can be reproduced within a factor of 1.3 for four cross-sections located at the tongue of Unteraargletscher (Fig. 9a). The mean deviation between observed and calculated ice volume flux is 1.3×10⁶ m3 a−1 (SEE = 2.6 × 10⁶ m3 a−1) and is almost constant for the individual profiles.
For the same cross-sections considered above, an ice-flow velocity distribution was calculated using a model described by Reference Sugiyama, Bauder, Zahno and FunkSugiyama and others (2007). The model calculates the horizontal flow-speed field along a given cross-section by solving the equations for balance of shear stress and Glen’s flow law. Basal sliding is introduced by a linear relation between the sliding speed and the shear stress acting on the bed (Reference WeertmanWeertman, 1964; Reference LliboutryLliboutry, 1979). The relation is given by the so-called ‘sliding coefficient’. The glacier bedrock calculated with the presented method and the glacier surface topography was used as the boundary condition. For the flow rate factor A, the same value was chosen as for the calculation of the ice-thickness distribution (Table 2).
The surface slope of each profile was derived from the DEM. The sliding coefficient was supposed to be constant across one single profile but was adjusted for each in a range of 30–90 m a−1 MPa−1 in order to match the respective maximum surface velocity. This leads to a basal sliding that accounts for 15–35% of the observed surface speed, which is slightly less than that found by Reference Guðmundsson, Bauder, Lüthi, Fischer and FunkGuðmundsson and others (1999) and Reference HelbingHelbing (2005) by inclinometer measurements. The ice-flow velocities at the surface calculated using the model were then compared with the surface velocity measurements (Fig. 10b). The average deviation is 2.2 m a−1 (SEE = 3.7 m a−1).
Comparison of (a) calculated and observed ice volume fluxes Q ice and (b) calculated and measured surface ice-flow velocities v surf for the four cross-profiles labelled with numbers in Figure 9. Observed ice volume fluxes represent mean values for the 1989–98 period (bars corresponding to two standard deviations); measured ice-flow velocities at surface refer to the year 2001.

Discussion
The accuracy of the method in estimating ice thicknesses is assessed by comparing calculated and measured quantities for Unteraargletscher, which was used for validation without tuning of the parameters. The accuracy of the ice-thickness estimation is therefore about 20%, which corresponds to less than 40 m for this glacier. The cross-sectional areas are estimated within 17%.
The estimated accuracy is a measure for the resolution of the calculated glacier bedrock topographies. Bedrock features smaller than the estimated accuracy cannot be resolved and should not be further interpreted. This may partially limit the use of the results for applications where the resolution of small-scale features is required (e.g. 3-D ice-flow modelling of basal processes). In such a case, an assessment of the sensitivity with respect to the input bedrock geometry is recommended.
Our method is based on the determination of the ice volume fluxes of a glacier. The apparent mass balance ![]() , defined at any point as the difference between the surface mass balance
, defined at any point as the difference between the surface mass balance ![]() and the rate of thickness change ∂h/∂t, is introduced in order to account for mass conservation. The main advantage of estimating
and the rate of thickness change ∂h/∂t, is introduced in order to account for mass conservation. The main advantage of estimating ![]() and not
and not ![]() and ∂h/∂t separately, is that the glacier-wide average of
and ∂h/∂t separately, is that the glacier-wide average of ![]() is zero by definition (Equation (5)) and no steady-state assumption is therefore required. This is in contrast to other methods, such as volume–area scaling, that have an inherent steady-state assumption. A unique relationship between volume and area is only possible with glaciers in steady state. This assumption is often violated in today’s climate with many glaciers out of equilibrium.
is zero by definition (Equation (5)) and no steady-state assumption is therefore required. This is in contrast to other methods, such as volume–area scaling, that have an inherent steady-state assumption. A unique relationship between volume and area is only possible with glaciers in steady state. This assumption is often violated in today’s climate with many glaciers out of equilibrium.
The distribution of ![]() is described by two parameters,
is described by two parameters, ![]() and
and ![]() , defining the vertical gradient of
, defining the vertical gradient of ![]() in the ablation and the accumulation zone, respectively. In general, the gradients
in the ablation and the accumulation zone, respectively. In general, the gradients ![]() do not correspond to the gradients of the actual mass balance
do not correspond to the gradients of the actual mass balance ![]() . A correspondence of the two is given only if the rate of ice-thickness change ∂h/∂t is zero everywhere, i.e. the glacier is in steady state. Thus,
. A correspondence of the two is given only if the rate of ice-thickness change ∂h/∂t is zero everywhere, i.e. the glacier is in steady state. Thus, ![]() is a good approximation of
is a good approximation of ![]() when ∂h/∂t is small.
when ∂h/∂t is small.
According to Reference Jóhannesson, Raymond and WaddingtonJóhannesson and others (1989), ∂h/∂t is highest at the glacier tongue and becomes rapidly smaller as the distance from the tongue increases. In the accumulation zone, the approximation of ![]() by
by ![]() is therefore justified in most cases and we can write
is therefore justified in most cases and we can write ![]() . A larger difference is expected between
. A larger difference is expected between ![]() and
and ![]() . The difference increases as the glacier is further from equilibrium. In the ablation zone,
. The difference increases as the glacier is further from equilibrium. In the ablation zone, ![]() is expected to be steeper than
is expected to be steeper than ![]() .
.
Figure 11 illustrates the result of the parameterization of ![]() with
with ![]() for the case of Rhonegletscher in the period 1991–2000. The distribution of the mass balance
for the case of Rhonegletscher in the period 1991–2000. The distribution of the mass balance ![]() with altitude was calculated based on direct measurements and a distributed mass-balance model (Reference Huss, Bauder, Funk and HockHuss and others, 2008a). The rate of thickness change ∂h/∂t was determined by differencing the DEMs of the years 1991 and 2000. Despite the approximation of
with altitude was calculated based on direct measurements and a distributed mass-balance model (Reference Huss, Bauder, Funk and HockHuss and others, 2008a). The rate of thickness change ∂h/∂t was determined by differencing the DEMs of the years 1991 and 2000. Despite the approximation of ![]() by
by ![]() , the difference
, the difference ![]() − ∂h/∂t and the estimated apparent mass balance
− ∂h/∂t and the estimated apparent mass balance ![]() agree well in both the accumulation and the ablation zone (Fig. 11b). In this case, the approximation
agree well in both the accumulation and the ablation zone (Fig. 11b). In this case, the approximation ![]() is therefore justified.
is therefore justified.
Altitudinal distribution of modelled mass balance ![]() , observed rate of ice-thickness change ∂h/∂t (Reference Huss, Bauder, Funk and HockHuss and others, 2008a) and estimated apparent mass balance
, observed rate of ice-thickness change ∂h/∂t (Reference Huss, Bauder, Funk and HockHuss and others, 2008a) and estimated apparent mass balance ![]() (a) and difference
(a) and difference ![]() and estimated
and estimated ![]() (b) for Rhonegletscher. The elevation range is normalized. Values are means over the period 1991–2000 and expressed in m w.e. a−1.
(b) for Rhonegletscher. The elevation range is normalized. Values are means over the period 1991–2000 and expressed in m w.e. a−1.

The sensitivity of the present method with respect to the input surface topography was tested for Rhonegletscher. Bedrock topographies were calculated based on the surface topographies of the years 1929, 1980, 1991 and 2000. The comparison of the results showed that the difference between two bedrock topographies becomes larger as the time lag between the two considered input geometries increases. The mean specific net balance in the previous 20 years, ![]() , is considered an indicator for how far the considered glacier geometry is from a steady state.
, is considered an indicator for how far the considered glacier geometry is from a steady state.
Figure 12 shows the bedrock calculated for Rhonegletscher with the surface topographies for the years 2000 ![]() and 1929 (+0.16 m w.e. a−1) (Reference Huss, Bauder, Funk and HockHuss and others, 2008a). The mean deviation between the two bedrock topographies is +22 m, indicating that the bedrock calculated with the surface topography of the year 2000 has a higher average elevation. The mean deviation is smaller than the estimated accuracy. The largest differences occur in the ablation area (Fig. 12). This was expected due to the approximation of
and 1929 (+0.16 m w.e. a−1) (Reference Huss, Bauder, Funk and HockHuss and others, 2008a). The mean deviation between the two bedrock topographies is +22 m, indicating that the bedrock calculated with the surface topography of the year 2000 has a higher average elevation. The mean deviation is smaller than the estimated accuracy. The largest differences occur in the ablation area (Fig. 12). This was expected due to the approximation of ![]() with
with ![]() .
.
Comparison of the glacier bedrock along the central flowline of Rhonegletscher calculated using two different input geometries: (a) glacier extent for the years 2000 (black) and 1929 (grey) and central flowline (dashed); and (b) distribution of the deviation between the two calculated bedrocks in the domain covered by both (24 024 gridcells, 15.0 km2). The mean deviation (22.4 m) is marked by the black dot-dashed line, and the range of two standard deviations (±27.1 m) by the grey dashed lines.

The sensitivity of the method with respect to the input parameters was tested on Rhonegletscher and Glacier de Zinal. The sensitivity is quantified in terms of relative change in the mean ice thickness for all parameters. For the mass-balance gradients, the sensitivity is also expressed in terms of relative change in the calculated apparent ELA.
The flow rate factor A and the correction factor C are the most sensitive parameters affecting the calculated mean ice thickness (Fig. 13a). On average, a variation in C of 0.1 leads to a variation of 9% in the mean ice thickness. The parameters C and A are not independent of each other (Equation (7)). An increase in A by a factor of 2 is equivalent to a decrease in C by 20%, and reduces the mean ice thickness by 18% (Fig. 13a). The sensitivity of the two parameters diminishes slightly towards larger values of A and C and is glacier-independent.
Sensitivity of calculated mean ice thickness ![]() with respect to (a) correction factor C and flow rate factor A and (b) calculated apparent ELA
with respect to (a) correction factor C and flow rate factor A and (b) calculated apparent ELA ![]() (curves from top left to bottom right). The curves for Rhonegletscher and Glacier de Zinal overlap in (a). In (b), the curves from bottom left to top right show the sensitivity of
(curves from top left to bottom right). The curves for Rhonegletscher and Glacier de Zinal overlap in (a). In (b), the curves from bottom left to top right show the sensitivity of ![]() with respect to the gradient of the apparent mass balance
with respect to the gradient of the apparent mass balance ![]() .
.

The sensitivity of the flow rate factor A and the correction factor C are intrinsic to the approach. Since uncertainties in A can be transferred to C, the flow rate factor A is set to values reported in the literature (e.g. Reference Hubbard, Blatter, Nienow, Mair and HubbardHubbard and others, 1998; Reference GuðmundssonGuðmundsson, 1999).
The determination of C is more difficult, as it accounts for different approximations and uncertainties. These are: (1) the approximation of the shear stress distribution by a linear relation (Reference NyeNye, 1965); (2) the approximation of the specific ice volume flux at the centre of the profile q
centre with the mean ice volume flux across the profile ![]() ; (3) the influence of the basal sliding, assuming a linear relation with the deformation velocity (e.g. Reference GuðmundssonGuðmundsson, 1999); and (4) the uncertainties in the flow rate factor A.
; (3) the influence of the basal sliding, assuming a linear relation with the deformation velocity (e.g. Reference GuðmundssonGuðmundsson, 1999); and (4) the uncertainties in the flow rate factor A.
Considering only approximation (1), the correction factor C depends on the shape of the cross-section only. In this case, C assumes a value between 0 (channel of infinite depth) and 1 (channel of infinite width) (Reference NyeNye, 1965). For approximation (2), we can show that in the case of a channel with cylindrical shape, the approximation of q
centre with ![]() increases C by less than 10%. With approximation (3), a doubling of the surface velocity due to increased basal sliding would require an increase in C by 25%. An uncertainty in A (approximation (4)) by a factor of 2 results in an uncertainty in C of about 20%.
increases C by less than 10%. With approximation (3), a doubling of the surface velocity due to increased basal sliding would require an increase in C by 25%. An uncertainty in A (approximation (4)) by a factor of 2 results in an uncertainty in C of about 20%.
For cross-sections which have a greater width than depth, C is expected to assume values between 0.4 and 1.0. For glaciers with some field data, the correction factor C can be calibrated. However, for glaciers with no a priori information, an estimation is necessary. Since C depends on the shape of the cross-section, one approach to estimate C is to consider glaciers for which similar bedrock shapes are expected. For Unteraargletscher, C was set to the mean value calibrated for similar valley glaciers, i.e. Rhonegletscher and Glacier de Zinal.
The sensitivity of the mean ice thickness with respect to changes in the gradients of the apparent mass balance and the calculated apparent ELA ![]() (Fig. 13b) is glacier-dependent. A change in
(Fig. 13b) is glacier-dependent. A change in ![]() has stronger effects for highly branched glaciers (e.g. Glacier de Zinal, Fig. 1a) than for glaciers with compact geometry (e.g. Rhonegletscher, Fig. 1b). This is due to the different distribution of area and volume, with branched glaciers having a larger area-to-volume ratio than glaciers with compact geometry. The difference between the mass-balance gradients for the ablation and the accumulation area leads to a different sensitivity of the mean ice thickness for an increase or a decrease in the apparent ELA. The sensitivity of
has stronger effects for highly branched glaciers (e.g. Glacier de Zinal, Fig. 1a) than for glaciers with compact geometry (e.g. Rhonegletscher, Fig. 1b). This is due to the different distribution of area and volume, with branched glaciers having a larger area-to-volume ratio than glaciers with compact geometry. The difference between the mass-balance gradients for the ablation and the accumulation area leads to a different sensitivity of the mean ice thickness for an increase or a decrease in the apparent ELA. The sensitivity of ![]() with respect to the gradients of the apparent mass balance is almost linear. The method is less sensitive to changes in the mass-balance gradients compared to the parameters of Glen’s flow law.
with respect to the gradients of the apparent mass balance is almost linear. The method is less sensitive to changes in the mass-balance gradients compared to the parameters of Glen’s flow law.
For the considered glaciers, identical gradients were assumed. This may not be realistic, but is a practical approach that diminishes the degrees of freedom. For an application of the method to glaciers in different climatic regions (e.g. maritime glaciers with high mass turnover or continental glaciers) additional input data (e.g. mass-balance measurements and rates of ice-thickness change) to determine the model parameters may be required.
The comparison of calculated and measured ice thicknesses is the most direct way to validate the result. The validation with other types of data, such as flow-speed or ice volume flux measurements, is more complicated since additional assumptions are required. The comparison between calculated and measured ice-flow velocities requires assumptions about unknown processes such as basal motion. It therefore only provides a plausibility check of the calculated glacier bedrock while indicating whether the observations can be reproduced using realistic assumptions, rather than supplying direct information on the calculated bedrock.
In the case of Unteraargletscher, the comparison reveals an unrealistic bedrock for profile 4 (Fig. 9), since no match between modelled and observed velocities can be achieved using realistic assumptions on basal sliding. The flow speed for profile 4 is overestimated at the cross-sectional margins (Fig. 10b) and indicates an overestimation of the calculated ice thickness in this sector. This is confirmed by the comparison with the bedrock determined by radio-echo soundings.
The comparison of calculated and observed ice volume fluxes (Fig. 10a) is also influenced by assumptions about the basal sliding. According to Reference HelbingHelbing (2005), Reference Huss, Sugiyama, Bauder and FunkHuss and others (2007) assumed that basal motion accounts for 50% of the surface speed. The observed ice volume fluxes are systematically overestimated by our method (Fig. 10a). The over-estimation for profile 6 (located furthest from the glacier tongue) indicates an overestimation of ![]() in the accumulation zone. Reference Huss, Sugiyama, Bauder and FunkHuss and others (2007) showed that, at present, only about 40% of the ablational mass loss of the tongue is compensated by the ice flux. The rate of ice-thickness change ∂h/∂t is therefore relatively high and the apparent mass balance
in the accumulation zone. Reference Huss, Sugiyama, Bauder and FunkHuss and others (2007) showed that, at present, only about 40% of the ablational mass loss of the tongue is compensated by the ice flux. The rate of ice-thickness change ∂h/∂t is therefore relatively high and the apparent mass balance ![]() differs significantly from the actual surface mass balance
differs significantly from the actual surface mass balance ![]() . This means that the overestimation of the ice volume flux contributes to the correct reproduction of the ice thickness in the tongue region which would otherwise be underestimated.
. This means that the overestimation of the ice volume flux contributes to the correct reproduction of the ice thickness in the tongue region which would otherwise be underestimated.
Conclusions
A method to estimate the ice-thickness distribution and the total ice volume of alpine glaciers from surface topography is presented. The accuracy inferred from point-to-point comparison of calculated and measured ice thickness is ∼25%. Individual cross-sectional areas can be reproduced with an accuracy of 20%.
The method is robust with respect to the chosen input geometry, and relatively insensitive with respect to the parameters describing the apparent glacier mass balance. The sensitivity of the method is higher for the flow rate factor A and the correction factor C. C can be calibrated when measurements of the ice thickness or the ice-flow velocities are available; otherwise it has to be estimated. An estimate of C can be derived from the glacier type and geometry, since C is influenced by the bedrock shape. At present, the database of ice-thickness measurements available for estimating C is small and needs to be expanded.
The analysis performed on four Swiss glaciers shows that the method is well suited to estimate the bedrock topography for glaciers where no direct measurements are available. The application of the method to different glaciers may require additional input data in order to correctly adjust the parameters describing the glacier mass turnover.
The method is well suited for estimating the total ice volume of individual glaciers or small mountain ranges. The potential for analysis on a larger scale (e.g. questions related to sea-level rise) is limited by the required (manual) digitization effort (glacier boundaries, flowlines and ice-flow catchments). For such analysis, the scaling approach may remain the only viable method (Reference Raper and BraithwaiteRaper and Braithwaite, 2005). In this regard, the presented method can be very valuable for enlarging the datasets that such scaling relations are based on.
Acknowledgements
Financial support for this study was provided by the BigLink project of the Competence Center Environment and Sustainability (CCES) of the ETH Domain. Swisstopo provided topographic maps and DEMs. H. Boesch evaluated the DEMs from aerial photographs. We thank all members of the field campaigns on which the radio-echo soundings were collected. P. Helfenstein and C. Zahno are acknowledged for evaluating the data from the field campaigns on Silvretta- and Rhonegletscher, respectively. S. Braun-Clarke edited the English. The constructive comments of the scientific editor H. Rott and the reviews of S. Raper and two anonymous reviewers helped to improve the manuscript.


