

Argillaceous sedimentary rocks, ranging from soft claystones to harder shales, are currently under global evaluation for deep radioactive waste disposal (NEA, 2005, 2022). Such mudrock lithologies represent the most abundant type of sedimentary rock in the geological record and are estimated to make up∼3.6 × 10⁸ km3 of the Earth’s upper crust, equivalent to∼14 vol.% of the continental crust down to 12 km depth (Warr, Reference Warr2022). In this context, the Federal Republic of Germany is assessing all such rock formations at suitable depths (>300 m) for repository construction as potential host rocks for the disposal of high-level radioactive waste (HLRW). As a relevant part of this assessment, there is a strong focus on comparing the various rock properties of claystone formations based on the available datasets to ensure a comprehensive, valid and reliable evaluation of their performance (based on the ‘Standortauswahlgesetz’ law; StandAG, 2017).
The present contribution aims to investigate the applicability of various measurable claystone properties (including thermal maturity indices established by hydrocarbon research studies) for the comparison of potentially relevant HLRW host rocks. The study is based on (1) a summary of published relations of claystone properties and burial depths and (2) the investigation of a set of claystones and related lithologies, including some of the well-known underground rock laboratories such as Bure (France) and Mont Terri (Switzerland). As many of these argillaceous mudrocks are from different geological sedimentary rock formations, deposited and lithified at various buried depths in sedimentary basins with diverse tectono-thermal histories, a primary aim was to identify common relationships between measurable physical parameters that could serve as predictive tools, despite differences in rock history.
Argillaceous (mud) rock terminology
Very-fine-grained marine siliciclastic sediments, deposited on and in a distal part of the continental shelf, are primarily composed of particles that settled from suspension by flocculation under low-energy conditions (Aplin & Moore, Reference Aplin, Moore, Schäfer, Dohrmann and Greenwell2016). These sediments consist mainly of silt-sized (<62.5 μm) and clay-sized (<2 μm) particles. Upon burial, the sedimentary strata undergoes dehydration and compaction within sedimentary basins, followed by mineral transformations during early and late diagenesis, up to the onset of metamorphic reactions at crustal depths corresponding to temperatures above 200°C (Warr, Reference Warr2022).
The mineralogical changes occurring during diagenesis, such as the formation of pyrite and the recrystallization of carbonates as well as hydrous phyllosilicates, lead to progressive lithification of the sediment, forming a variety of mudrock types referred to as claystones, mudstones, siltstones, shales, argillite or pelites depending on the extent of lithification. Their metamorphic equivalents are commonly termed metapelites, slates or schists. Depending on particle size, degree of compaction, fabric and the ability to fracture (known as fissility), various lithological terms are applied. Further classifications based on particle-size distribution and mineralogical composition, such using the ratios of carbonate, quartz and clay minerals, are not always consistent (Potter et al., Reference Potter, Maynard and Depetris2005; Stow, Reference Stow2007; Farrokhrouz & Asef, Reference Farrokhrouz and Asef2013).
In the present study, most mudrocks investigated represent either claystone- or shale-related rock lithologies. A claystone is defined as an argillaceous lithology whereby the most abundant grain size is that of clay-sized particles. According to Folk (Reference Folk1974), this is as high as >66.6 mass% clay, <33.3 mass% silt and <10 mass% sand-sized particles, when the clay-sized fraction is defined as <4 μm. When adopting the mineralogical <2 μm size boundary used to separate and identify clay minerals, a claystone can be considered to contain at least 50 mass% of this finer clay-size fraction, which typically corresponds to high hydrous phyllosilicate contents (e.g. smectite, kaolinite, chlorite and illitic minerals). Due to the high clay mineral contents, these lithologies often have poorly developed fabrics and deform plastically by flow rather than by fracturing. In contrast, shales are typically composed of mudstones and/or siltstones with lower clay contents (<66.6 mass% of the <4 μm fraction), whereby the higher silt and quartz content often leads to rock lamination and fissility. As most materials in this study are considered to be claystone lithologies, with only some shale samples, for simplicity the former term (claystone) is used for all materials considered in the present study.
Relevant host-rock properties
Claystone barrier properties are controlled by a range of factors, commonly varying with burial depth and degree of diagenesis, but they may also be influenced by other factors such as fluid–rock interaction during later uplift.
For the disposal of HLRW, suitable claystones should contain a low amount of organic matter (OM; respective limits have not been established to date), as its exposure to increasing temperatures may lead to cracking of kerogen and the generation of liquid hydrocarbons (oil) and gas and the inducing of the formation of secondary porosity, thereby increasing permeability. In addition, OM can also serve as a nutrient source for microbial activity, which should be minimized in clay host rocks. Therefore, a low OM content is an initial favourable property for a potential claystone host rock. Other primary parameters involve the thickness and homogeneity of the lithological unit, as a greater homogeneous thickness increases the distance that radionuclides must travel before reaching the biosphere. Heterogeneity of the lithological unit, however, is difficult to describe in a quantitative manner because various scales have to be considered.
In addition, a set of specific physical, mechanical and hydraulic rock properties can be identified that are largely controlled by burial depth and the degree of diagenesis and that depend on a combination of geological, mineralogical, porewater chemistry, petrophysical, flow and solute transport and geomechanical factors (Fig. 1; NEA, 2022). Changes in these properties with increasing depth may be either favourable or unfavourable with respect to the performance of the host rock.
Schematic representation of host rock-relevant properties that change in relation to initial burial depth and progressive diagenesis either from favourable (green) to unfavourable (red) or vice versa with respect to the disposal of HLRW. In the case of swelling capacity, more information is required to resolve whether deeper burial increases the swelling potential of claystones and shales or not.

Mechanical strength
According to Bjorlykke & Hoeg (Reference Bjorlykke and Hoeg1997), the mechanical strength of claystones and related argillaceous rocks increases significantly during diagenesis; however, at higher compaction, it becomes more dependent on mineral cement and microstructure. Consistently, Klinkenberg et al. (Reference Klinkenberg, Kaufhold, Dohrmann and Siegesmund2009) and Kaufhold et al. (Reference Kaufhold, Graesle, Plischke, Dohrmann and Siegesmund2013a) reported that inorganic neoformed carbonates supporting the matrix enhanced mechanical strength, whereas biogenic carbonates in the matrix (e.g. fossil mussels) may act as predetermined planes of weakness. The mechanical strength generally increases with burial depth, potentially up to a certain limit (Hoyer, Reference Hoyer2018; e.g. 40 MPa uniaxial compressive strength (Gaus et al., Reference Gaus, Hoyer, Seemann, Fink, Amann and Littke2022)), but variations in microstructure and mineralogy can explain differences in mechanical strength among claystones with similar compaction. The mechanical strength hence may differ from site to site regardless of comparable burial depth.
Thermal conductivity
The thermal conductivity of porous systems depends on both the conductivity of the matrix and the nature of the pore-filling material. According to Labus & Labus (Reference Labus and Labus2018), the most important factor determining the thermal conductivity of sediments is their quartz content, due to its high thermal conductivity (6.5–11.3 W K–1 m–1). The thermal conductivity of claystones, siltstones (0.80–1.25 W K–1 m–1) and shales (1.05–1.45 W K–1 m–1) increases with decreasing porosity as well as the degree of progressive compaction, while the measured values also depend on the nature of the pore-filling minerals (Blackwell & Steele, Reference Blackwell and Steele1989). With decreasing pore diameter, silicate grains are brought into closer contact, which enhances thermal conductivity (Midttomme et al., Reference Midttomme, Roaldset and Aagaard1998).
In the shallow upper crust, the well-studied shale lithologies are generally assumed to be water-saturated, whereas under near-surface conditions unsaturated systems exhibit significantly lower thermal conductivity due to the insulating effect of air-filled pores. The combined presence of both water- and air-filled pores explains the weak correlation between porosity and thermal conductivity reported by Midttomme et al. (Reference Midttomme, Roaldset and Aagaard1998). By contrast, these authors observed a strong correlation between bulk density and thermal conductivity. Additional variations arise from mineral textures in shales that produce rock anisotropy, but, in general, thermal conductivity tends to increase with the degree of compaction.
Palaeotemperature/Tmaxgeo
As the evolution of temperature history in the context of the sedimentary basin, to which the fine-grained siliciclastic sedimentary rocks have been exposed, strongly influences many of the rock properties summarized earlier, understanding this evolution is crucial to predicting the physical, mineralogical and mechanical behaviours of these rocks, particularly in the case of claystones and their associated lithologies. Moreover, the preservation and transformation of dispersed OM contained in claystones is highly sensitive to temperature history. Several organic petrological and geochemical indicators can therefore be used and applied to estimate maximum palaeoburial temperature or palaeogeothermal conditions (explained later in more detail). Such information, particularly when integrated with 2D and 3D basin-modelling approaches (cf. e.g. Castro-Vera et al., Reference Castro-Vera, Amberg, Gaus and Littke2024, Reference Castro-Vera, Gaus, Colling Cassel, Amberg and Littke2025), is essential for assessing the thermal stability of the host rock for instructing, guiding and directing repository site selection.
For a repository design, the maximum permissible temperatures for both the geotechnical barrier and the clay-bearing host rock must be defined, as these limits determine the allowed amount and type of radioactive material per canister, as well as its spatial distribution within the repository. It is generally assumed that the properties and composition of the host rock will remain stable over thousands of years, provided that storage temperatures do not exceed the maximum temperature values experienced during its geological history and that continuous water saturation is maintained.
In the following section, the term ‘maximum temperature of palaeoburial heating’ derived from the vitrinite reflectance (VRo %) parameter (an organic petrological indicator of maximum palaeoburial temperature) using the correlation equation of Barker & Pawlewicz (Reference Barker and Pawlewicz1994) will be abbreviated as ‘T maxgeo’. This parameter denotes the maximum palaeotemperature experienced by the claystone or associated lithologies during their geological history. In addition to the term ‘maximum palaeoburial temperature’ also exists ‘palaeotemperature’, which refers to thermal conditions that can be reconstructed from (1) VRo % data in combination with burial history modelling using the Sweeney & Burnham (Reference Sweeney and Burnham1990) algorithm (Easy Ro %) applied in 1D, 2D or 3D basin models and from (2) biomarker maturity ratios. Furthermore, as well as the aforementioned terms of ‘maximum palaeoburial temperature’ and ‘palaeotemperature’ is the term ‘temperature of maximum pyrolysis yield’ (known as T max). The term T max refers to the temperature at which the rate of hydrocarbon generation is at its maximum, and it is measured by the method of Rock-Eval pyrolysis. The transformation of T max to vitrinite reflectance equivalence (VReq %) is used to estimate the maximum temperature of palaeoburial heating. T max should not be confused with T maxgeo.
For claystone samples investigated as potential host rocks at various locations, published palaeotemperature estimates are available. In the Mont Terri underground laboratory (Switzerland), the palaeotemperature of the Opalinus Clay during the Cretaceous is estimated to have reached 85°C (Mazurek et al., Reference Mazurek, Hurford and Leuz2006; Bossart et al., Reference Bossart, Bossart and Milnes2018). For the Callovo-Oxfordian claystone investigated near Bure, France, the palaeotemperature has been estimated at 50°C ± 5°C (Blaise et al., Reference Blaise, Barbarand, Kars, Ploquin, Aubourg and Brigaud2014). In the case of the Boom Clay, near Mol, Belgium, the palaeotemperature estimates based on biomarker maturity ratios indicate a maximum of ∼30°C (De Man et al., Reference De Man, Van Simaeys, Vandenberghe, Harris and Wampler2010; Vandenberghe et al., Reference Vandenberghe, De Craen and Wouters2014).
As in present-day sedimentary basins, the temperature of a claystone generally increases with increasing depth. Recorded palaeotemperatures of sedimentary rocks generally reflect the maximum depth attained during their burial history. This holds true when no additional regional near-surface geothermal anomalies influenced the palaeotemperatures of sedimentary rocks. However, present-day burial depth is not a reliable indicator of maximum palaeotemperature. Uplift and exhumation can transport rocks from greater depths – where they reached higher palaeotemperatures – to shallower positions over geological time. Overall, the thermal history of a sedimentary basin is often investigated using VRo % and T max (Rock-Eval pyrolysis; further discussed in Supplement 3).
Porosity
Much research has been published on the porosity of claystones and related lithologies due to their importance to the hydrocarbon industry. Consequently, numerous pore-classification schemes have been proposed, although not all are equally useful. For example, Ma et al. (Reference Ma, Slater, Dowey, Yue, Rutter, Taylor and Lee2018) distinguished different types of pores, including intra-organic, organic–mineral interface, inter-mineral and intra-mineral pores. According to Hemes (Reference Hemes2015), larger distances were observed for clay mineral–non-clay mineral interfaces compared to pores within the clay matrix, hence even inter-mineral pores can be further subdivided. The smallest pores, which are associated with minerals and OM, are sometimes referred to as nanopores, reflecting their small scale. Most studies, however, reasonably adopt the International Union of Pure and Applied Chemistry (IUPAC) classification for pore sizes (IUPAC, 1994), according to which such small pores would be classified as micropores.
Mineral microporosity primarily arises from the ‘quasi-crystalline overlap regions’ of clay minerals (Kaufhold et al., Reference Kaufhold, Dohrmann, Klinkenberg, Siegesmund and Ufer2010). Additional microporosity can also be present within organic particles. The pore volume of a claystone is primarily determined by mesoporosity, which is correlated with the distances between particles (Kaufhold et al., Reference Kaufhold, Grathoff, Halisch, Plötze, Kus and Ufer2016). In addition, some macropores will be present; however, they will be minor with respect to the pore volume and generally isolated, which makes them less important to the permeability resulting from porosity. Upon compaction, macropores and mesopores decrease in size and volume. Micropores cannot be compacted; their presence depends on microporous constituents such as smectite, goethite or OM, and they control the specific surface area (SSA), which is commonly measured by gas physisorption.
In the case of organic-rich argillaceous rocks, the porosity of organic particles must be considered, although this is complex, because such pores change during thermal maturation. Fine-scale intra-organic pores are typically absent in immature or only weakly mature shales (Chen et al., Reference Chen, Zhang, Tang, Li and Li2016). These pores tend to enlarge with progressive maturation, and, consequently, the micropore volume per unit OM decreases with increasing maximum VRo % (Yan et al., Reference Yan, Wei, Song and Zhang2017). However, the total intra-organic pore volume increases, in contrast to the pores not associated with OM. The relevance of distinguishing between organic and mineral porosity naturally depends on the OM content. According to Zhang et al. (Reference Zhang, Shao, Yan, Jia, Li, Yu and Zhang2016), organic porosity in shales becomes significant when Corg contents exceed 2 mass%. Suitable host rocks, however, should contain only low amounts of organic carbon (as noted previously) and hence are less important for assessing host rocks.
In Fig. 2, various published relationships between porosity and burial depth are compared for argillaceous rocks, primarily claystone and shale lithologies. The variations among the curves are largely attributed to lithology, with coarser-grained rocks containing higher proportions of quartz, which tend to retain higher porosities (Magara, Reference Magara1980; Yang & Aplin, Reference Yang and Aplin2010). Shale data from Magara (Reference Magara1980) are presented as minimum and maximum curves based on the comparison of 10 different basins. From Fig. 2, it is evident that the relationship between porosity and burial depth can be described by an exponential function, whereas coarser sandstones exhibit a linear trend. The data further allow the conclusion to be drawn that the porosity of argillaceous rocks is generally below 20% at burial depths reaching 2000 m, and that highly compacted material (burial depths of 4000–6000 m) shows significant porosity variability, ranging from 1% to 15 %. Castro-Verra et al. (Reference Castro-Vera, Amberg, Gaus and Littke2024) recently described porosity conservation despite deep burial (>3300 m) because of local overpressure generation attributed to OM decomposition, which may explain at least part of the data scatter. Furthermore, Puttiwongrak et al. (Reference Puttiwongrak, Nufus, Bunprasert, Giao, Vann, Suteerasak and Sasaki2021) outlined that large scatter in porosity–depth functions can be due to the differences in temperature, geological age, clay mineral diagenesis and overpressure across the various basins. They stated that the effect of geological age is particularly underestimated, meaning that compaction at a depth of 1000 m over 100 million years does not produce the same porosity reduction as over 1 million years at the same depth.
Comparison of porosities in argillaceous rocks (mostly claystones and shales) as a function of burial depth. Data from Ewy et al. (Reference Ewy, Dirkzwager and Bovberg2020) are based on 35 preserved claystone cores from various locations; data from Magara (Reference Magara1980) are based on 10 different shale studies from multiple basins; and data from Mondol et al. (Reference Mondol, Bjørlykke, Jahren and Høeg2007) are based on 22 studies.

Figure 2 Long description
The horizontal axis represents depth in meters, ranging from 0 to 8000 meters. The vertical axis represents porosity in percent, ranging from 0 to 90 percent. A legend on the right side of the graph identifies thirteen distinct lines, each corresponding to a separate published dataset. The lines are visually distinguished by varying line styles including solid and dashed lines and each is associated with a different study label in the legend. The thirteen labeled series are: Katsube et al. (1992) appearing twice, NEA (2022), Yang and Guo (2020), Magara (1980) minimum, Magara (1980) maximum, Potter et al. (2005) shale, Potter et al. (2005) mud, Osipov et al. (2004), Proshlyakov (1960), Ewy et al. (2020), Mondol et al. (2007) maximum and Mondol et al. (2007) minimum. At shallow depths near 0 meters, porosity values across datasets range approximately from 40 percent to 80 percent. By approximately 1000 meters depth, most lines have dropped to a range of roughly 20 percent to 50 percent. At approximately 2000 meters depth, most datasets show porosity values below 20 percent, with some as low as approximately 5 percent. At depths between 4000 and 6000 meters, the remaining visible lines show porosity values ranging from approximately 1 percent to 15 percent. Magara (1980) minimum and maximum lines define a spread across the full depth range, with the maximum curve consistently higher than the minimum curve. Mondol et al. (2007) maximum and minimum lines similarly present an envelope of variability at greater depths. NEA (2022) shows a comparatively steeper early decline. Potter et al. (2005) shale and mud lines follow gradual declining paths. Proshlyakov (1960) and Osipov et al. (2004) lines extend to depths beyond 4000 meters. All lines show a general decrease in porosity with increasing depth.
Pore size
Far fewer studies have investigated pore-diameter variations as a function of burial depth and/or thermal maturity. According to Aplin & Moore (Reference Aplin, Moore, Schäfer, Dohrmann and Greenwell2016), the deposition of muds forming mudstones with more than 30% of clay-sized (<2 µm) particles generates nanometre-sized pores (<20 nm) during the initial flocculation and desiccation, even in the absence of compaction. Yan et al. (Reference Yan, Wei, Song and Zhang2017) report that pore sizes in shales range from 3 to 100 nm. According to Ma et al. (Reference Ma, Slater, Dowey, Yue, Rutter, Taylor and Lee2018), pores ranging between 10 and 100 nm are the most connected and therefore primarily control transport properties. The measured pore diameters are believed to primarily reflect interparticle distances (Kaufhold et al., Reference Kaufhold, Grathoff, Halisch, Plötze, Kus and Ufer2016), which are consequently reduced during consolidation/compaction and further burial. In Fig. 3, the pore sizes and burial depths of various claystones and related lithologies reported by different authors are compared. The data were obtained using different methods, and often it is not stated whether the mean, mode or median pore size is referred to, which explains part of the scatter. In addition, the initial pore-size distribution depends on the chemical environment (porewater composition; Bennett & Hurlbut, Reference Bennett and Hurlbut1986), the mineralogical composition and the particle-size distribution of the clays. Fine particles lead to smaller pore sizes at low compaction. This relation is discussed in more detail by, for example, Wu (Reference Wu1987). Unconsolidated clays can also contain mesopores, but they commonly also show significant microporosity, which is reduced upon compaction (Hoffmann et al., Reference Hoffmann, Alonso and Romero2007; Kaufhold et al., Reference Kaufhold, Plötze, Klinkenberg and Dohrmann2013b). Based on Fig. 3, it can be concluded that common claystones that were buried at least as deep as 2000 m are dominated by pore sizes of <40 nm.
Comparison of different pore sizes in claystones and related lithologies as a function of burial depths published by different authors. The red line represents data published by Katsube et al. (Reference Katsube, Williamson and Best1992), the blue line represents the trend of the data published by Katsube et al. (Reference Katsube, Mudford and Best1991), and the dashed line indicates the possible effect of particle size on the shape of the curve.

Figure 3 Long description
Depth (m) The x-axis is labeled Depth (m), ranging from 0 to 6000 with tick marks at 0, 2000, 4000 and 6000. The y-axis is labeled Pore size (nm), ranging from 0 to 160 with tick marks at 0, 20, 40, 60, 80, 100, 120, 140 and 160. A legend lists: Katsube et al. (1992) Hg-intrusion; Yang et al. (2022) N2-adsorption, average pore size; Yan et al. (2017) N2-adsorption, pore width; Katsube and Williams (1994) Hg-intrusion; Hemes (2015) Hg-intrusion, pore throat diameter; Katsube et al. (1991) Hg-intrusion; Evy et al. (2020) Hg-intrusion, equivalent pore diameter (2*r). Two curves are drawn: one solid curve that starts near 150 nm at low depth and decreases to about 20 nm by around 4000 m, then continues near about 20 nm toward higher depth; and one dashed curve labeled particle size that rises from about 20 nm near 0 m to about 60 nm near 2000 m. Plotted points include: near 0 to 500 m, points around 50 to 110 nm; near 1000 to 2500 m, points around 10 to 30 nm; near 3500 to 4200 m, a vertical cluster around 5 to 20 nm; near 5000 to 6000 m, multiple points around 2 to 10 nm.
Hydraulic conductivity/permeability
The low permeability (or hydraulic conductivity) of claystones and related argillaceous lithologies, resulting from the abundance of clay-sized particles, is considered their most important host-rock property, as permeability governs radionuclide migration. As a consequence, water and ion migration is governed by diffusion. Permeability is known to depend on connected porosity, which, in the case of argillaceous lithologies, corresponds to mesoporosity. Upon burial, mesoporosity is further reduced, leading to a corresponding decrease in permeability. Many studies have investigated the relationship between permeability and porosity, as these properties are critical for the hydrocarbon industry. A general dependence between permeability and porosity, based on Horseman et al. (Reference Horseman, Higgo, Alexander and Harrington1996), is illustrated in Fig. 4. The grey-shaded field represents the natural variability, which may also arise fromdifferences in the methods or analytical set-ups used to determine permeability. Yang & Aplin (Reference Yang and Aplin2010; blue lines in Fig. 4) demonstrated that much of the observed variability can be attributed to differences in clay content. These differences can be even more pronounced when the highly swelling clay mineral Na-smectite is present, which, even in small amounts, can effectively seal sandstones (Lindenmaier et al., Reference Lindenmaier, Miller, Fenner, Christelis, Dill, Himmelsbach, Kaufhold, Lohe, Quinger, Schildknecht, Symons, Walzer and van Wyk2014). Overall, however, increasing compaction generally leads to a decrease in permeability.
Summary of published porosity/permeability relationships of claystones based on Horseman et al. (Reference Horseman, Higgo, Alexander and Harrington1996). The blue lines (Yang & Aplin, Reference Yang and Aplin2010) account for at least part of the observed variation.

Figure 4 Long description
Log hydraulic conductivity (m s superscript -1) The bottom axis is labeled Log permeability (m superscript 2), ranging from minus 22 to minus 14 with ticks at minus 22, minus 20, minus 18, minus 16 and minus 14. The left axis is labeled Porosity slash void ratio, ranging from 0.0 to 0.8 with ticks at 0.0, 0.2, 0.4, 0.6 and 0.8. The top axis is labeled Log hydraulic conductivity (m s superscript -1), ranging from minus 16 to minus 8 with ticks at minus 16, minus 14, minus 12, minus 10 and minus 8. A wide diagonal shaded band runs from near (minus 22, about 0.1) to near (minus 14, about 0.8). A red arrow labeled Increasing trend points up and to the right across the shaded band. Two thin diagonal lines run roughly parallel to the shaded band. One line is labeled High clay content and the other is labeled Low clay content. Text inside the shaded band includes Boom Clay (Mol) near about (minus 18, about 0.4). Text near the lower left includes Eleana Form. (Nevada) near about (minus 22, about 0.1), Opalinus Clay near about (minus 21, about 0.2) and Callovo-Oxf. (Bure) near about (minus 20, about 0.25). Text near the upper right includes Opalinus section (Mont Terri) near about (minus 16, about 0.7). A small boxed note at the lower right reads Clay types after Mazurek et al. 2009.
Permeability is the prerequisite for the migration of ions (including radionuclides) or neutral complexes. However, their actual mobility depends on coupled transport processes. The migration of ions and complexes in free water becomes less important as the pore diameter decreases (Horseman et al., Reference Horseman, Higgo, Alexander and Harrington1996). Instead, migration is governed by interactions with mineral surfaces, which are particularly influenced by the ionic strength of the solution. Such coupled transport phenomena are not further discussed in the present review. It is only important to note that a highly compacted claystone may serve as a more effective barrier than a less consolidated one.
Colloid detachment
Detachment of colloidal particles from clay materials (often referred to as erosion) is significant because, on the one hand, it can generate secondary porosity and, on the other hand, these colloidal particles may transport adsorbed radionuclides (Huber et al., Reference Huber, Nosek and Schäfer2013). Most research on erosion, however, has focused on geotechnical barriers (e.g. bentonite), with considerably less attention given to claystone host rocks. Nevertheless, claystones and other argillaceous rock may also be affected by erosion, and the underlying mechanisms are believed to be similar to bentonites. Consequently, such lithologies with a higher content of free (i.e. not incorporated in mixed-layer minerals) smectites may release more colloidal particles than others. The type of exchangeable cation is also considered important, as Na-dominated smectites tend to form soft, water-rich gels from which colloidal particles can detach (Kaufhold & Dohrmann, Reference Kaufhold and Dohrmann2008). With increasing burial, however, the smectite content decreases because of illitization, and, consequently, the likelihood of colloid detachment diminishes as compaction increases. Within an intact host rock (i.e. without secondary cracks or fissures), smectite particles are unlikely to be released because the pore sizes are generally smaller than 50 nm, which is smaller than the common smectite particles ranging from 50 to 200 nm.
Microbiology
Microbial activity also becomes less significant as pore space decreases with increasing compaction and is therefore less significant in consolidated claystones. Friedrikson et al. (Reference Fredrickson, McKinley, Bjornstad, Long, Ringelberg and White1997) reported that bioactivity is largely limited to pores >200 nm. Hence, regarding potential microbiological impacts, greater burial depths and smaller pore sizes are expected to be advantageous. Temperature further imposes a limiting effect on microbiological activity (Jobmann & Meleshyn, Reference Jobmann and Meleshyn2015). According to Colwell et al. (Reference Colwell, Delwiche, Chandler, Frederickson, Yao and McKinley1997), significantly lower microbial populations can be expected in sedimentary rocks that are exposed to at least 140°C or 150°C (Lommerzheim et al., Reference Lommerzheim, Jobmann, Meleshyn, Mrugalla, Rübel and Stark2019).
Swelling capacity
The swelling capacity of claystones is considered important for their self-sealing ability. It induces the closure of fractures and various apertures both within and – under certain conditions – outside the excavated damaged zone. Note, however, that tectonic fractures in clays can frequently also seal by vein formation (Laurich et al. Reference Laurich, Urai, Desbois, Vollmer and Nussbaum2014). Zhang (Reference Zhang2013) demonstrated that different claystones could recover their low hydraulic conductivity under realistic pressure–temperature conditions. Zhang & Talandier (Reference Zhang and Talandier2023) reported that clay-rich materials exhibit better self-sealing ability than carbonate-rich ones. Bock et al. (Reference Bock, Dehandschutter, Martin, Mazurek, de Haller, Skoczylas and Davy2010) and Fisher et al. (Reference Fisher, Kets and Crook2013) summarized seven such sealing mechanisms: matrix compaction, mechanical sealing of fractures by normal stress, shearing, creeping, swelling, slaking and mineral precipitation. Laurich et al. (Reference Laurich, Fourrière and Gräsle2019) showed for fracture-guided resaturation in Opalinus Clay that inhomogeneous wetting causes uneven stress relaxation and the strain release of locked-in stresses, producing localized volume increases via the growth of tiny pre-existing fissures. This increase is at the expense of wider fractures and hence lowers the overall permeability. This strain release happens almost immediate and is later followed by the slower distributed volume increase due to clay mineral swelling.
Bourg & Ajo-Franklin (Reference Bourg and Ajo-Franklin2017) distinguished the effects of interlayer and osmotic swelling, finding that interlayer swelling (intra-crystalline swelling) is significant at the nanoscale, whereas osmotic swelling is associated with the mesoscale (i.e. interparticle spaces). They also stated that the ratio between the nano- and mesoscale (porosity) depends on the compaction, which can be correlated with dry density and is similarly known to affect the thickness of the water layers forming in the interlayer upon water saturation.
In smectite-rich lithologies, such as bentonites, the dry density strongly controls interlayer hydration. Without confinement and at dry densities below a 1.2 g cm–3, up to four water layers can solvate the exchangeable cations (Bourg & Ajo-Franklin, Reference Bourg and Ajo-Franklin2017). At dry densities above 1.6 g cm–3, a maximum of two water layers can form, indicating that the volume increase is lower at higher dry densities. Nevertheless, the much closer arrangement of smectite particles (aggregates) at higher densities leads to higher swelling pressure in confined-volume experiments (e.g. Liu et al., Reference Liu2013; Manzel et al., Reference Manzel, Podlech, Grathoff, Kaufhold and Warr2021). Based on this behaviour, claystones from different burial depths could be expected to exhibit enhanced self-sealing ability with increasing burial depth due to high packing densities. However, since the smectite content is reduced during burial-related illitization, this depth-related trend in self-sealing may be reversed.
In contrast to other properties such as porosity, which generally decreases with burial depth across different basins, illitization can vary considerably, most probably due to differences in potassium availability. This implies that highly compacted claystones can exist with widely varying smectite contents. To date, little to no information is available on the self-sealing and swelling pressures of various claystones as a function of dry density and smectite content. Consequently, it is not yet possible to determine whether increasing burial is beneficial for self-sealing due to higher swelling pressures, or whether shallow burial is more favourable because of the higher smectite content (sum of the smectitic layer in illite-smectite interstratified minerals plus free smectite).
Ductility and retention capacity
In the case of ductility, there is no doubt that it decreases with increasing burial depth. Ductile deformation is advantageous, as it results in the less frequent and less extensive formation of cracks and voids. Cementation may also reduce ductility; however, this effect cannot be directly related to burial depth, but rather to locally varying geochemical environments and the initial composition of the clay-rich sediment.
With increasing burial depth and hence decreasing smectite content in a specific basin, the number of possible adsorption sites for radionuclides generally decreases according to the decreasing content of smectitic layers. These possess the highest SSA and cation-exchange capacity (CEC) of all claystone components and are, therefore, most important for radionuclide retention by adsorption, and, as discussed previously, their average content generally decreases with increasing burial depth. Notably, illitic layers may have specific selectivities and hence can be more effective for specific radionuclides.
Illitization
The self-sealing ability, ductility, adsorption (radionuclide retention) capacity and erosion (detachment of colloidal particles) of claystones and associated lithologies all strongly depend on their smectite content. In freshly sedimented mud (prior to diagenesis), this content depends on the geological setting and therefore varies between different claystones and related lithologies (Warr, Reference Warr2022). With increasing burial depth (i.e. during the onset of late diagenesis), the content of smectitic layers, both as discrete smectite or as layered components in illite-smectite interstratified (‘mixed-layer’) minerals, decreases as they transform into illite when K+ is available in the system (Kaufhold & Dohrmann, Reference Kaufhold and Dohrmann2010; Warr, Reference Warr2022).
Illitization not only decreases the abundance of smectitic layers but also plays an important role in cementation through the crystallization of secondary phases within pore and interparticle spaces. As a result of the reaction of smectite with K+, illite and quartz are formed, with the latter precipitating in the interparticle space. Quartz cementation becomes increasingly relevant at greater burial depths, as illitization proceeds more rapidly under elevated-temperature (>60°C) conditions (Bjorlykke & Hoeg, Reference Bjorlykke and Hoeg1997). Carbonates, in contrast, can act as important cements throughout all depths of a basin. Ilgen et al. (Reference Ilgen, Heath, Akkutlu, Bryndzia, Cole and Kharaka2017) emphasized that illitization not only promotes quartz cementation but also results in a volume increase, thereby affecting porosity and, consequently, the properties of claystones. Mineral cements can reduce pore volume while increasing mechanical strength and thermal conductivity, but they simultaneously reduce ductility. The presence or absence of such mineral cements may therefore explain part of the scatter observed when comparing claystones, such as that regarding porosity, across different burial depths. For the investigation of the extent of illitization, the Kübler Index (KI) is often used. Methodological details are provided in Supplement 4 and by Kübler (Reference Kübler1964, Reference Kübler1967) and Kübler & Goy-Eggenberger (Reference Kübler and Goy-Eggenberger2000).
Thermal maturity indices
To characterize the thermal and palaeoburial history of claystone-rich formations, various thermal maturity proxies can be employed. In the present study, VRo %, Rock-Eval pyrolysis (T max) and the illite ‘crystallinity’ (IC) method are considered, as these proxies are well-established and routinely applied by the upstream oil and gas industry and therefore are often available for a large number of different argillaceous rock samples. In scientific studies, VRo % was often compared with IC as measured by KI values (e.g. Underwood et al., Reference Underwood, Strong and Blake1988; Reinhardt, Reference Reinhardt1991; Mählmann, Reference Mählmann1996; Suchy, Reference Suchy2000; Uysal et al., Reference Uysal, Glikson, Golding and Audsley2000; Hartkopf-Fröder et al., Reference Hartkopf-Fröder, Königshof, Littke and Schwarzbauer2015; Baludikay et al., Reference Baludikay, François, Sforna, Beghin, Cornet and Storme2018) in assessments of the thermal maturity of OM in sedimentary rocks. VRo % as an organic petrological parameter primarily reflects the thermal evolution of OM, whereas the mineralogical IC parameter depends on both the thermal history and chemistry of porewaters in a sedimentary basin, particularly K+ availability. According to Katz & Lin (Reference Katz and Lin2021), VRo % values, similarly to all other thermal maturity indicators, should be interpreted within a geological framework, with an emphasis placed on trends rather than discrete values.
VRo % is often compared with T max derived from Rock-Eval analysis (e.g. Pagel et al., Reference Pagel, Braun, Disnar, Martinez, Renac and Vasseur1997; Dellisanti et al., Reference Dellisanti, Pini and Baudin2010; Evenick, Reference Evenick2021; Katz & Lin, Reference Katz and Lin2021; Waliczek et al., Reference Waliczek, Machowski, Poprawa, Świerczewska and Więcław2021). The correlation between the two parameters shows considerable scatter, primarily due to different kerogen types. Katz & Lin (Reference Katz and Lin2021) and Waliczek et al. (Reference Waliczek, Machowski, Poprawa, Świerczewska and Więcław2021) showed that the relationship between VRo % and T max varies systematically depending on kerogen type (Fig. 5). According to Dellisanti et al. (Reference Dellisanti, Pini and Baudin2010), the correlation between these parameters is most straightforward for type III kerogen (mainly derived from terrestrial higher plants) when estimating the degree of maturation. For type I kerogen (commonly lacustrine bacterial–algal mixtures), the slope of VRo % vs T max is steep. Additional compositional characteristics of the kerogen, such as the sulfur content, can further influence the correlation, particularly for type II or II-S kerogens (mainly marine algae and bacteria). Moreover, based on a large dataset, Evenick (Reference Evenick2021) demonstrated that differences between the two methods (VRo % and T max) become significant below peak pyrolysis temperatures of 420°C and above 500°C T max.
Published relations between VRo % and Tmax derived from Rock-Eval analysis for various types of kerogen.

Figure 5 Long description
The graph shows vitrinite reflectance percentage on the vertical axis, ranging from 0 to 2.5 percent and Tmax from Rock-Eval in degrees Celsius on the horizontal axis, ranging from 400 to 550 degrees Celsius. The lines represent different studies and kerogen types: Katz and Lin (2021) kerogen I, II and III; Pagel et al. (1997); Evenick (2021); Dellisanti et al. (2010); Waliczek et al. (2021) kerogen I and II. Each line is visually distinguished by different styles. The graph illustrates how vitrinite reflectance varies with Tmax for different kerogen types, showing distinct trends and slopes for each study. Notable peaks and variations are observed across the lines, indicating differences in the relationship between the two parameters.
The pore size measured by Hg intrusion has also been found to correlate with VRo % (Kaufhold et al., Reference Kaufhold, Grathoff, Halisch, Plötze, Kus and Ufer2016) and could therefore serve as an additional parameter, particularly reflecting the burial history rather than thermal history. However, in this context, the pore size is rarely considered in the literature.
Non-linear evolution of properties
The HLRW host rock-relevant properties change with increasing burial depth, as outlined previously. Some of these properties show a linear relationship with depth, whereas others show asymptotic behaviour, which can be explained by the fact that a progressively greater load is required to move particles closer together once the interparticle distances are small. For example, Katsube & Williams (Reference Katsube and Williamson1994) showed that both porosity (∼10 %) and pore size (∼20 nm) did not change significantly between 2500 and 4000 m (Figs 2 & 3). Furthermore, permeability does not decrease further once pore sizes are below 10 nm (Tian et al., Reference Tian, Xu, Li, Wang and Lin2019). According to Smith (Reference Smith1971), porosity decreases during compaction until it reaches a minimum, which is controlled by the difference between total vertical stress (overburden pressure) and porewater pressure. Mechanical strength reaches a maximum and porosity reaches a minimum at a certain depth (Gaus et al., Reference Gaus, Hoyer, Seemann, Fink, Amann and Littke2022).
With respect to assessing different HLRW host rocks, it is important to note that at least some relevant properties, such as porosity, permeability and mechanical strength, cease to change once a critical burial depth, corresponding to a certain pore size (also depending on mineralogy), is reached (Fig. 3).
Materials and methods
A range of representative claystones and related lithologies relevant for the selection of suitable host rock for the storage of HLRW were acquired from various drillings in Europe. The aim of the rock sample acquisition was to compile a sample set covering a significant range of burial depths and hence different host rock-relevant properties. The sample set is therefore not suitable for comparing different locations, as key properties such as the CEC are known to vary substantially over a small scale within a particular drilling. The sample set includes established sedimentary host rocks from Switzerland and France, as well as a range of argillaceous rocks from Germany. The latter includes material from the recent drilling in Lower Saxony (Lower Cretaceous) and the ‘Posidonienschiefer’ (Posidonia shale) from a well-investigated Hils syncline area (Hilsmulde area) location. Where applicable, the four Hilsmulde shales (WIC9, DOH10, DIE13, HAD10) investigated by Kaufhold et al. (Reference Kaufhold, Grathoff, Halisch, Plötze, Kus and Ufer2016) were also considered in the present study. In addition, three established reference shale samples from the USA were selected. All samples and available information are listed in Table 1.
Samples characterized and discussed in the present study.

Table 1 Long description
The table lists 22 rock samples with sample IDs, locations and countries, remarks, geologic age, drilling code or sampling depth, and literature sources. Most samples are from Germany and are described as Jurassic claystone from the Hilsmulde area, collected either from specific boreholes or at the surface. Switzerland contributes three Jurassic samples from Mont Terri with borehole identifiers and depths around 10 m and one at 130 m. France contributes three Callovo-Oxfordian samples from Bure at shallow depths of about 4.5 to 6 m. Germany also includes several Cretaceous samples from the “Unterkreidebohrung Niedersachsen” program at depths of 36 m, 60 m, 87 m, and 212 m. The USA entries are oil shales from Eagleford and Mancos (Cretaceous) and Wolfcamp (Permian), identified by product-style drilling codes rather than depths. Depth information mixes numeric depths, borehole codes, and “at surface,” so direct depth comparisons are limited without additional metadata.
URL = underground rock laboratory.
Samples TS1 (Zuckerfabrik) and TS9 (Frielingen) were described in more detail by Thöle et al. (Reference Thöle, Bornemann, Heimhofer, Luppold, Blumenberg, Dohrmann and Erbacher2020). The mineralogical composition and CEC values of Zuckerfabrik 2 borehole samples were reported by Kneuker et al. (Reference Kneuker, Blumenberg, Strauss, Dohrmann, Hammer and Zulauf2020). Both samples are derived from the so-called BC6 zone (boreal calcareous nanofossil zone; Thöle et al., Reference Thöle, Bornemann, Heimhofer, Luppold, Blumenberg, Dohrmann and Erbacher2020). The drill cores containing samples TS3 and TS9 were described by Janufske & Keupp (Reference Janofske and Keupp1988) and are located in the central position of the Lower Saxony Basin (Cretaceous, Valanginian).
Samples TS4, TS8 and TS10 were obtained from the Mont Terri underground rock laboratory. TS4 and TS8 originate from the drill core BLT A8, whereas TS10 originates from a separate drill core, BHE F1.
Samples TS5, TS6 and TS7 were collected in Bure in conjunction with geophysical and permeability borehole measurements. Further details are reported by ANDRA (2015).
The Hilsmulde area was investigated in detail due to an interesting thermal anomaly there and locally high contents of OM (e.g. Rullkötter et al., Reference Rullkötter, Leythauser, Horsfield, Littke, Mann and Müller1987, Munoz, Reference Munoz2006; Bernard et al., Reference Bernard, Horsfield, Schulz, Wirth, Schreiber and Sherwood2012).
Additionally, three US oil shale samples were included in the present study, which were obtained from Kocurek Industries (www.kocurekindustries.com). The samples originate from famous and well-known US shale formations that have been studied by numerous researchers (e.g. Rauzi & Spencer, Reference Rauzi and Spencer2013; EIA, 2018; Speight, Reference Speight2020).
The samples were broken down to a particle size of 1–5 mm (aggregates), and part of that was ground by brief rotary disc milling for the production of powdered material for the analyses.
Hg intrusion
Mercury intrusion measurements were carried out using Pascal model 140 and Pascal model 440 instruments (Porotec, Germany). The combination of these devices enabled the determination of pore sizes down to a diameter of 3.6 nm. First, the air-dried specimens were evacuated (0.03 kPa) at room temperature for 2 h. Measurements were then performed by gradually increasing the pressure up to 400 MPa while the sample was immersed in the mercury. The pressure was increased automatically using an advanced procedure, with lower rates applied at lower pressure levels and during intrusion measurements. Pore-size distributions were calculated based on the Washburn equation (Washburn, Reference Washburn1921), assuming cylindrical symmetry, a surface tension of 480 mN m–1 and a contact angle of 140°.
Gas physisorption
Argon physisorption isotherms were measured on ∼0.5–1.0 g of vacuum-dried (T = 105°C, P vac < 13 mPa) bulk rock aggregates (250–400 µm) at 87 K in a liquid argon bath. Isotherms were recorded between 0.001 < p/p° < 0.995 at 67 discrete adsorption and 37 discrete desorption points using a Micrometrics Gemini VII 2390t apparatus (Micromeritics Instrument Corporation, Norcross, GA, USA). The void volume difference, with respect to a reference cell, was measured prior to the actual physisorption measurements using helium pycnometry at room temperature. Operational equilibrium was defined as a pressure change below 0.01% of the target pressure over a period of 30 s. The saturation pressure (p°) was determined separately for each pressure point.
Gurvich pore volumes were estimated at the highest relative pressure of the adsorption isotherm (p/p° ≈ 0.993) assuming a liquid molar volume of argon (28.7 mL mol–1; Gurvich, Reference Gurvich1915). For the purpose of comparison, specific pore volumes were converted to porosities by multiplying them by the skeletal density obtained from helium pycnometry. Pore-size distributions were obtained by applying Barrett–Joyner–Halenda (BJH) theory to the desorption branch, assuming capillary condensation and a cylindrical (pore) geometry (Barret et al., Reference Barrett, Joyner and Halenda1951). The statistical thickness curve of argon was based on the experimental data of Kruk & Jaroniec (Reference Kruk and Jaroniec2000). The modal diameters were extracted from the maximum of the differential pore volume distribution (dV/dlog(D)), where V is the cumulative pore volume and D is the corresponding pore diameter. SSAs were obtained by means of Brunauer–Emmett–Teller (BET) theory using a molecular cross-sectional area of 0.142 nm2, according to ISO 9277, and applying the Rouquérol plot to constrain the upper fitting limit (Brunauer et al., Reference Brunauer, Emmett and Teller1938; Rouquérol et al., Reference Rouquérol, Llewellyn, Rouquérol, Llewellyn, Rodriquez-Reinoso, Rouqerol and Seaton2007; DIN ISO 9277:2010, 2010).
For comparison to argon BET areas, nitrogen SSAs were determined by N2 physisorption using a five-point BET method up to a relative pressure of 0.3. Measurements were performed on a Micromeritics Gemini III 2375 surface area analyser with ∼300 mg weight of powdered material. Samples were degassed for 24 h under vacuum at T = 105°C.
Dry flow porosimetry
Total porosity (for porosity <50 µm) was determined according to Webb & Orr (Reference Webb and Orr1997) using a Micromeritics AccuPyc 1330 He-pycnometer and a Micromeritics GeoPyc 1360 (Norcross, GA, USA). The GeoPyc instrument utilizes free-flowing, finely divided dry powder as the displacement medium instead of a liquid. The smallest diameter of powder particles is 50 µm; consequently, the method assesses porosity for pores <50 µm.
X-ray florescence
Samples were crushed and ground using a rotating disc mill and analysed for chemical composition by X-ray fluorescence (XRF; PANalytical Zetium spectrometer, ALMELO, The Netherlands). For analysis, the powdered bulk rocks were mixed with a flux material (lithium metaborate Spectroflux, Flux No. 100A, Alfa Aesar) and fused into glass beads. The beads were then analysed by wavelength-dispersive XRF. Loss on ignition (LOI) was determined by heating 1000 mg of sample to 1030°C for 10 min, including a temperature ramp to 700°C.
C/S analysis (LECO)
Bulk samples of 170–180 mg of dried material were used to measure total carbon (TC) and total organic carbon (TOC) contents with a LECO CarbonSulfur-444-Analyzer. TOC was determined after removal of inorganic carbonates by repeatedly treating the samples with 10% HCl at 80°C until no further gas evolution was observed. Total inorganic carbon (TIC) was calculated as the difference between TC and TOC. For analysis, samples were heated to 1800–2000°C in an oxygen atmosphere, and evolved CO2 was detected using an infrared detector and quantified via daily calibrations with external standards. The detection limit for both TC and TOC is 0.02 mass%.
Cation-exchange capacity
The CEC of all samples was measured using the Cu-triethylenetetramine complex (Cu-trien; Meier & Kahr, Reference Meier and Kahr1999). Measurements were performed in 85 mL polycarbonate centrifuge vials using 10.0 mL Cu-trien solution plus 50.0 mL water (electrical conductivity 0.05 μS cm–1), with sample masses of 500, 800 and 1100 mg. The reaction time was allowed to proceed for 120 min at room temperature (23–24°C), followed by centrifugation to separate the clay from the solution, and the Cu concentration was determined by visible (VIS) spectroscopy.
Vitrinite reflectance
Whole-rock samples were prepared for petrographic analyses following DIN 51701-3:2006-09 (2006). Polished whole-rock pellets were produced using a dry polishing technique at LAOP, Tübingen, Germany, in accordance to DIN 22020-2:1998-08 (1998) and the procedures described by Taylor et al. (Reference Taylor, Teichmüller, Davis, Diessel, Littke and Robert1998). Final polishing was performed using an abrasive with a maximum size of 0.05 μm, as required by ISO 7404-5 (2009) and ASTM D7708-23 (2023). The maceral nomenclature used in this study follows the International Committee for Coal and Organic Petrology, ICCP System 1994 (ICCP, 1998, 2001; Sýkorova et al., Reference Sýkorova, Pickel, Christanis, Wolf, Talor and Flores2005; Pickel et al., Reference Pickel, Kus, Flores, Kalaitzidis, Christanis and Cardott2017). Random VRo % measurements were performed following DIN 22020-5:2005-02 (2005) and ASTM D7708-23 (2023). Analyses were carried out in non-polarized light at 500× magnification and at room temperature (23°C ± 1°C) using a Leica DMRX incident-light microscope equipped with a MPV Compact 2 microphotometer photomultiplier tube, a 12 V/100 W halogen lamp, a HBO® 103 W/2 (12 V) lamp and Leica Oil P 50×/0.85 oil immersion objective. Leica Type F immersion oil (n e = 1.518 at 23°C) was used for the measurements, along with synthetic glass and mineral standards (0.423%, 0.590%, 0.683% and 1.005% reflectances) for calibration purposes. Up to 56 reflectance measurements (mean ≈ 26) were performed on each sample using Leica MPV Meas software. For analysis using blue fluorescence light, the following filter set was applied: Leica excitation filter BP 355–425, dichroic mirror RKP 455 and barrier filter LP 460. Photomicrographs were acquired in incident bright and blue light excitation using a Leica digital fluorescence camera DFC 300 FX at a resolution of 1300 × 1030 pixels stored using Image Access Premium 23 imaging software.
IC and intensity ratio determinations
The IC and intensity ratio (IR) values were determined as follows: the full width at half-maximum (FWHM) of the illite (001) reflection was measured in °2θ using cobalt radiation from the ethylene glycol-solvated, orientated pattern of the orientated <2 µm size fraction prepared via the filter transfer method. The FWHM measurements were then calibrated using a set of Crystallinity Index Standards (CIS) documented by Warr (Reference Warr2018). The calibration equation determined was: IC = 1.58 × FWHM + 0.046. Simultaneously, the IR values were calculated using the IRs of the 001 and 003 air-dried sample divided by the same reflections after ethylene glycol saturation (Srodon & Eberl, Reference Srodon, Eberl and Bailey1984). This is an empirical measure that is proportional to the amount of expandable layers, whereby 1.0 represents pure illite and values >1.0 represent illites with variable amounts of smectite interlayers. X-ray diffraction traces are available on request.
Rock-Eval pyrolysis
The breakdown of OM contained in the claystones and shales was studied by pyrolysis (i.e. heating samples according to a controlled temperature programme in a non-oxidizing atmosphere). The method follows the procedure described by Espitalie et al. (Reference Espitalie, Madec, Tissot, Menning and Leplat1977) using the updated Rock-Eval6 instrument (cf. Lafargue et al., Reference Lafargue, Marquis and Daniel1998). Depending on the organic carbon content, 20–200 mg of the rock sample is weighed in a crucible and placed into an oven under a nitrogen atmosphere. The sample is first heated to 300°C for 3 min, followed by a temperature ramp of 25°C min–1 up to 650°C. The hydrocarbons released during pyrolysis are detected by a flame ionization detector, and the temperature at which the maximum amount of hydrocarbons is detected is recorded as the T max value. In addition, the total amount of hydrocarbons released during the initial isothermal step at 300°C is quantified as S1 (mg of hydrocarbons/g rock), while the total amount of hydrocarbons released during the subsequent temperature ramp up to 650°C is quantified as S2 (also in mg hydrocarbons/g rock). The amount of oxygen contained in the OM is estimated by quantifying the amount of carbon dioxide released up to 400°C, denoted as S3 (mg CO2/g TOC). Using S2, S3 and TOC, the hydrogen index (HI = S2/TOC) and oxygen index (OI = S3/TOC) are calculated, providing information on the chemical composition of the OM. Daily calibrations with an external standard are performed to ensure accuracy.
Broad-ion beam scanning electron microscopy
Samples TS8 and TS12 were prepared for microstructural analysis by scanning electron microscopy (SEM). Broad-ion beam (BIB) milling (Leica-Tic 3x Ar-BIB, oscillating rotary stage) produced ∼2 mm2 flat surfaces (±5 nm roughness) without mechanical polishing artefacts. The milling was accomplished at varying acceleration voltages up to 8 kV, removing a layer of ∼100 µm thickness in 10–16 h. SEM imaging was carried out with a ZEISS Sigma 300VP FEG instrument. Secondary electron (SE) and backscattered electron (BSE) micrographs were acquired at 3 and 20 kV accelerating voltages, respectively. Prior to imaging, both samples were coated with iridium. The micrographs were imported into the software QGIS (2025) for interpretation. Pores were segmented in SE images using an in-house code (Brysch et al., Reference Brysch, Laurich and Sester2026) to enhance contrast and visibility. Analyses of samples other than TS8 and TS12 as well as pore-size distributions and pore morphologies will be presented separately.
Results and discussion
Compositional variability of the sample set
Geochemical analyses of the samples investigated in this study, together with the data published by Kaufhold et al. (Reference Kaufhold, Grathoff, Halisch, Plötze, Kus and Ufer2016), are compiled in Supplement 1 . The mineralogical composition of the claystone and shale samples will be presented in a separate study because the complexity of the clay mineralogical composition requires substantial explanation regarding the methods used and subsequent discussion, which is beyond the scope of the present study. Argillaceous rocks are mineralogically classified according to the relative contents of carbonates, quartz + feldspar and clay minerals (explained earlier). Hence, in order to be able to compare the samples of the present study, the compositional variability was semi-quantitatively assessed based on chemical data. Moreover, with respect to comparing potential clay host rocks, the carbonate content and abundance of swellable layers (smectitic layers = sum of swellable layers in both smectite and interstratified clay minerals, such as illite-smectite) are considered to be most important because they, as outlined earlier, determine properties such as mechanical strength, ductility, retention capacity, swelling and sealing. The carbonate content can be calculated based on the Cinorg content derived from elemental C analysis (LECO; Supplement 1). The content of smectitic layers can be estimated based on the CEC. Kaufhold et al. (Reference Kaufhold, Dohrmann, Ufer and Meyer2002) discussed the variability in the parameters needed to convert the CEC into a smectite content. Assuming a layer charge density of 0.30 equivalents per formula unit (eq FU–1), 10% variable charge and 365 g mol–1 results in contents of smectitic layers slightly above the CEC. The minor contribution of illitic layers and kaolinite towards the CEC has to be considered as well, slightly reducing the content of smectitic layers calculated from the CEC. Nevertheless, as will be shown later, the CEC can be used as a proxy for the semi-quantitative estimation of the content of smectitic layers. The phyllosilicate content was estimated based on the K2O content, assuming an average of 7 mass% K2O in the clay minerals. In addition, K, Mg and Al serve as indicators of the clay mineral fraction, while Ca provides an additional measure of the carbonate content. The quartz content could be estimated by subtracting SiO2 attributable to other silicates, with the remainder expressed as mass% quartz. The results are shown in Fig. 6, in which the size of the circles represents the comparably large error of approximately ±10 mass%. The accuracy, however, is sufficient to characterize the mineralogical variability of the sample set primarily resulting from differences in carbonate content, whereas the quartz/feldspar to clay mineral ratio appears relatively uniform (Fig. 6). The phyllosilicate content ranges from 20 to 50 mass% and the quartz/feldspar content from 50 to 80 mass%. Such dependencies are often observed within a single formation or sedimentary basin, such as in the Bossier shale of east Texas (Wang et al., Reference Wang, Hu, Zhao, Zhang, Ilavsky and Yu2014), whereas significant variations in clay mineral to quartz ratios (60 ± 20 mass% clay minerals) were reported for the Chang7 and Chang9 shales, which are essentially carbonate-free. When investigating relationships between different argillaceous rock properties, it is important to consider the relative abundances of quartz and clay components, as variations in these may lead to correlations that are not representative of all claystones in general.
Ternary plots showing the approximate ratios of phyllosilicates, carbonates and other components (mainly quartz) calculated from chemical data. The size of the circles represents an error of ±10 mass%.

Sample TS18 is almost exclusively composed of carbonates and hence can hardly be considered as either a shale or claystone (despite being distributed as such). Similarly, sample TS16 contains few silicates, so its properties are probably more influenced by carbonates than by typical claystone minerals such as illite-smectite or quartz. Neither sample may be comparable to the others due to their low silicate content.
Moreover, high Corg contents were found in samples TS13 and TS15, and all samples studied by Kaufhold et al. (Reference Kaufhold, Grathoff, Halisch, Plötze, Kus and Ufer2016) also exhibited high Corg (marked in grey in Supplement 1). Therefore, as previously discussed, these are considered to be less suitable as host rocks.
Porosity and pore size
Figure 7a compares the (total) porosities derived from helium pycnometry in combination with the dry flow technique with the (total) porosities derived from mercury intrusion porosimetry and argon physisorption (Ar isotherms are discussed in Supplement 5). Compared to the He/dry flow technique, mercury intrusion underestimates porosity, especially in the higher range, while porosities derived from argon adsorption correspond well in this range. In this porosity range, pore throats in the nanometre range may prohibit mercury from entering the entire pore volume. Hence, the most probable explanation for lower Hg porosities being compared to He/Ar porosity is that the gas molecules can enter much smaller pores compared to Hg (e.g. NEA, 2025). For lower porosities, both mercury intrusion and argon adsorption porosities show a certain scatter with respect to helium pycnometry. Because the structural homogeneity of the samples was not investigated, it is difficult to draw conclusions regarding the reasons for this (Lis et al., Reference Lis, Topór and Mastalerz2026).
(a) Comparison of porosities determined by helium pycnometry in combination with dry flow along with Hg intrusion and Ar physisorption, (b,c) total porosities derived from Hg intrusion and Ar physisorption regarding pore size and (d) comparison of the pore sizes derived from Hg intrusion and Ar physisorption. Blue = all samples; orange = without samples TS8, TS11 and TS12.

Figure 7 Long description
The image A showing a scatter plot comparing porosity He or Ar percent versus porosity He dry flow percent. The vertical axis label is porosity He or Ar percent. The horizontal axis label is porosity He dry flow percent. The horizontal axis range is 0 to 25. The vertical axis range is 0 to 25. A legend lists Hg and Ar, shown with different marker shapes. Two fitted lines are shown with text y equals 1.1x minus 2.3, R superscript 2 equals 0.9 and y equals 0.7x minus 0.3, R superscript 2 equals 0.9. The plotted points form an upward pattern. Points are concentrated at low porosity values near 0 to 10 on both axes, with additional points extending to around 20 on both axes. The image B showing a scatter plot comparing modal pore size Hg nanometer versus Hg total porosity percent. The vertical axis label is modal pore size Hg nanometer. The horizontal axis label is Hg total porosity percent. The horizontal axis range is 0 to 25. The vertical axis range is 0 to 70. A legend lists TS11 and TS12 and points use different marker shapes. Two fitted lines are shown with text y equals 2.5x, R superscript 2 equals 0.9 and y equals 1.5x plus 15.9, R superscript 2 equals 0.2. The plotted points form an upward pattern. Points span from low porosity values near 0 to higher values near 20 to 25, with modal pore size values extending up to around 60. The image C showing a scatter plot comparing modal pore size Ar nanometer versus Ar total porosity percent. The vertical axis label is modal pore size Ar nanometer. The horizontal axis label is Ar total porosity percent. The horizontal axis range is 0 to 25. The vertical axis range is 0 to 70. A legend lists TS12, TS11 and TS8 and points use different marker shapes. One fitted line is shown with text y equals 0.9x plus 9.3 and R superscript 2 equals 0.5. The plotted points form an upward pattern. Points are concentrated at Ar total porosity values near 0 to 10, with modal pore size values ranging from around 10 to above 50. The image D showing a scatter plot comparing modal pore size Ar nanometer versus modal pore size Hg nanometer. The vertical axis label is modal pore size Ar nanometer. The horizontal axis label is modal pore size Hg nanometer. The horizontal axis range is 0 to 70. The vertical axis range is 0 to 70. One fitted line is shown with text y equals 0.7x plus 3.3 and R superscript 2 equals 0.7. The plotted points form an upward pattern. Points extend from low modal pore size values to higher values, with several points near Hg modal pore size values around 40 to 60 and Ar modal pore size values around 30 to 55. Across the four scatter plots, the first plot compares porosity values between methods, the second and third plots relate total porosity to modal pore size for Hg and Ar and the fourth plot compares modal pore size between Ar and Hg.
In Fig. 7b, the total porosity measured by Hg intrusion is compared with the modal pore diameter derived from Hg intrusion, and Fig. 7c displays the corresponding data for modal pore diameters derived from the argon desorption isotherms. In Fig. 7d, the modal pore diameters derived from both methods are compared. In general, one can observe that the modal pore diameters determined via mercury intrusion and argon desorption are in the same order of magnitude. Exact correspondence of these two techniques should not be expected with this sample set because, as noted in connection with the porosities, argon and mercury can have access to different parts of the pore space, and the materials may be structurally inhomogeneous. It should be noted that these correlations can only be achieved with modal pore diameters. If, for instance, the mean of the distribution were to be chosen, the entire correlation would be lost.
Apart some samples (TS8, TS11 and TS12 in the case of mercury intrusion and TS11 and TS12 in the case of argon adsorption), the data suggest a decrease in pore-size mode with decreasing porosity, consistent with burial-related compaction. However, TS11 and TS12 exhibit comparably large modal pore sizes despite their low porosity. Interestingly, TS8, TS11 and TS12 contain high carbonate contents, which might suggest dissolution/cementation processes, resulting in a larger pore size at comparatively low porosity. However, TS13, TS14, TS15 and TS16 also show high carbonate contents but smaller modal pore sizes. Conceptually, a large modal pore size is not in contradiction to a low porosity, as porosity represents the total void volume while the pore-size mode is a measure of the primary pore size. In turn, reduced porosity can result from cementation, selective loss of pore volume associated with non-modal pores or a reduction in the abundance of pores, without a causal change in the modal pore size.
Overall, the data shown in Fig. 7 indicate (1) that the pore size and porosity are related and probably reflect the burial history, but (2) that other, secondary processes such as cementation or other unidentified processes can cause deviations from this trend. To further investigate this hypothesis, samples TS12 and TS8 (low porosity with large pore size, considered unusual) and TS15 (low porosity with small pore size, considered typical) were selected for analysis using electron microscopy.
Electron microscopy
The focused ion beam SEM images of TS12 feature dissolution pores within primary Mg-rich carbonates, along with localized calcium phosphates, as verified by energy-dispersive X-ray spectroscopy (EDX; Fig. 8a,b; Camp et al., Reference Camp, Diaz and Wawak2013; Han et al., Reference Han, Li, Liu, Xiao, Ren and Guo2023). The botryoidal structure of the calcium phosphates form pores of ∼50 nm, which is in agreement with bulk pore-size measurements (Fig. 7). Numerous framboidal pyrites are also present, in addition to veins of gypsum.
Overview of different pore types observed in TS12 and TS15. In TS12, secondary redox-driven mineral dissolution and precipitation is evident (a,b), along with interparticle pores at the grain–matrix boundary (c). In TS15, syn-tectonic, pressure-driven syntaxial carbonate crystal growth occurred within fractures (d,e). Interparticle pores at the grain–matrix boundary (f) in TS15 are less frequent and smaller in size compared to those of TS12.

Figure 8 Long description
The image A showing a grayscale micrograph labeled TS12 and a. A bright, irregular central region sits within a darker field with multiple thin, branching lines. A scale bar at the lower right reads 3 micrometers. The image B showing a grayscale micrograph labeled b. A diffuse, mottled area occupies the center with soft edges and low contrast against a gray background. A scale bar at the lower right reads 400 nanometers. The image C showing a grayscale micrograph labeled c. Several thin, dark, elongated marks and faint branching lines are scattered across a gray background, with a small darker cluster near the right side. A scale bar at the lower right reads 750 nanometers. The image D showing a grayscale micrograph labeled TS15 and d. A row of adjacent, light-toned, block-like shapes runs diagonally across the middle over a darker, granular background. A scale bar at the lower right reads 20 nanometers. The image E showing a grayscale micrograph labeled e. A few long, thin, dark lines intersect near the left-center, forming sharp angles on a smooth gray background. A scale bar at the lower right reads 600 nanometers. The image F showing a grayscale micrograph labeled f. Several thin, dark, curved and segmented lines are dispersed across a gray background, with one longer curved line near the upper right. A scale bar at the lower right reads 640 nanometers.
The TS15 sample displays two distinct domains. The first consists of quartz grains in a clay-rich matrix, with abundant interparticle pores. The second, more complex domain is dominated by massive carbonates and smaller quartz grains, with only a minor phase of clay in between. Pores in this domain are elongated, fissure-like voids, many of which are partially infilled (Fig. 8e). Transmission electron microscopy (TEM) reveals syntaxial calcite growth lining these fissures, associated with nanopores of ∼15 nm in diameter (Fig. 8d), which is similar to the bulk pore-size data.
The dissolution of primary Mg-rich carbonates in TS12 was possibly driven by acidification resulting from pyrite oxidation at elevated temperatures (Warren, Reference Warren2006; Tate, Reference Tate2015). The released H+ ions locally lowered pH, promoting carbonate dissolution. As the system buffered back towards neutral pH, authigenic minerals precipitated preferentially in smaller voids, while gypsum formed in expansive veins (Putnis & Austrheim, Reference Putnis, Austrheim, Harlov and Austrheim2012; Sharp, Reference Z.D2017).
In contrast, TS15 shows no strong evidence of possibly redox-driven mineral alteration. The syntaxial grown calcite within the fissure suggest a syn-tectonic precipitation.
The BIB-SEM images in Fig. 9a,e are representative of the respective samples that showed unusual ratios of porosity and pore size. Carbonate and clay minerals constitute the dominant components, with occasional framboidal pyrite present in both. Sample TS8 contains sparse but largely intact carbonate fossils and a higher abundance of quartz. Quartz in TS12 is smaller, less abundant and tightly intercalated between carbonate grains, unlike in TS8. A further distinction lies in the carbonate phase: in TS12, carbonate grains are generally smaller and form a connected grain skeleton, whereas in TS8, carbonate grains are larger, typically embedded in the clay matrix and only rarely exhibit grain–grain contacts (Fig. 9a,e). Carbonate grains in TS12 frequently display straight edges, sometimes even idiomorphic shapes, in contrast to TS8, where only rhombic siderite grains show such morphology.
BIB-SEM images of TS8 (left) and TS12 (right) in BSE (a,b,e,f) and SE modes (c,d,g,h). Mineral phases: 1 = quartz; 2 = carbonate grain; 3 = clay; 4 = carbonate fossil; 5 = pyrite. Pores (pink) occur mainly within the clay matrix; larger pores (>150 µm) are rare in TS12 and appear as agglomerations between sub-idiomorphic carbonate grains. Quartz in TS12 is smaller, less abundant and tightly intercalated between carbonate grains, unlike in TS8.

Figure 9 Long description
The image A showing a grayscale micrograph labeled TS8 with five numbered regions (1, 2, 3, 4, 5). A red rectangular box is placed near the center. The field contains irregular polygonal areas separated by thin darker boundaries. A scale bar at the lower right reads 20 micrometers. The image B showing a grayscale micrograph labeled TS8. A red rectangular box spans the central area. The left side contains a large smooth light-gray region and the boxed area includes a mottled texture near a boundary with darker linear features. A scale bar at the lower right reads 10 micrometers. The image C showing a grayscale micrograph labeled TS8 with a red rectangular box near the center. Thin magenta lines overlay multiple boundaries and linear features across the field, including within and around the boxed region. A scale bar at the lower right reads 5 micrometers. The image D showing a grayscale micrograph labeled TS8. The field contains elongated, layered and jagged dark and light bands running diagonally, with multiple thin dark fissure-like lines. A scale bar at the lower right reads 500 nanometers. The image E showing a grayscale micrograph labeled TS12 with five numbered regions (1, 2, 3, 4, 5). A red rectangular box is placed near the center. The field contains many tightly packed irregular polygonal areas with thin darker boundaries and scattered small bright circular spots. A scale bar at the lower right reads 20 micrometers. The image F showing a grayscale micrograph labeled TS12. A red rectangular box is placed in the upper left quadrant. The field contains irregular polygonal areas with thin darker boundaries and small dark linear separations between adjacent regions. A scale bar at the lower right reads 10 micrometers. The image G showing a grayscale micrograph labeled TS12 with a red rectangular box near the upper center. Thin magenta lines overlay multiple boundaries and linear features across the field, including within and around the boxed region. A scale bar at the lower right reads 5 micrometers. The image H showing a grayscale micrograph labeled TS12. The field contains many angular regions separated by dark linear gaps, with clusters of short, dark, rod-like marks aligned in several directions. A scale bar at the lower right reads 500 nanometers.
In both samples TS8 and TS12, the majority of pores are located within the clay matrix, whereas their grains contain only a few, strictly isolated pores (Fig. 9c,d,g,h). Larger pores along grain boundaries are interpreted as artefacts, as indicated by the congruent geometries of opposing pore walls (Fig. 10c). The congruency suggests inhomogeneous unloading and/or drying of the clay matrix relative to the more rigid quartz and carbonate grains, probably induced during sample retrieval, storage and preparation. These artefacts are not restricted to BIB-SEM imaging but also affect other measurement techniques such as mercury intrusion porosimetry and permeability tests. It remains uncertain whether these grain-boundary pores are entirely artificial, represent enlargements of pre-existing pores or reflect a combination of both conditions.
(a) Micrograph detail (BIB-SEM, BSE at 20 kV) of sample TS12 showing pores at grain edges in (b) serrated and (c) straight geometry with congruent pore-wall geometries. (b) is indicative of dissolution, whereas (c) indicates unloading/drying of the specimen. Note that (b) is rare and (c) is common. Ca = carbonate-bearing grain; Cly = clay particle matrix; Qz = quartz.

Rare examples of pores with non-matching pore walls were observed in TS12, particularly between carbonate grains (Fig. 10b). The finely serrated pore-wall geometry suggests dissolution by a fluid residing along grain boundaries, which challenges the hypothesis that all grain-boundary pores are purely artefactual.
The remaining pores are interpreted as in situ features, consistent with Houben et al. (Reference Houben, Desbois and Urai2013), who reported no SEM-visible alteration of pore morphology between artefact pores across various sample drying techniques. Under this assumption, sample TS12 contains fewer large pores (>150 nm) than TS8, with such pores mainly occurring as localized clusters (Fig. 9g,h) between sub-idiomorphic Ca grains. A previous study on carbonate pore types (Norbisrath et al., Reference Norbisrath, Eberli, Laurich, Desbois, Weger and Urai2015) describes this microstructure as pore type (I), which is characteristic of low-permeability wackestones with limited cementation.
Electron microscopy reveals indicators of dissolution and precipitation processes in sample TS12. These include dissolution pores along Ca-grain edges, idiomorphic grain shapes, in combination with a grain–grain bridging Ca skeleton, and tightly intergrown Ca and quartz grains, as well as localized botryoidal Ca-phosphates. Such features are absent from samples TS8 and TS15. In TS8 even delicate Ca fossils remain intact, indicating that the sample did not experience any significant Ca dissolution or reprecipitation. However, samples TS12 and TS8 share void interparticle pores within the clay matrix that are not filled with Ca. Although this suggests that the cementation primarily occurred on pre-existing calcite grains, it does not preclude selective authigenic precipitation within micropores. We favour the explanation that such a growth has happened in a syntaxial manner, as suggested by several idiomorphic facets of Ca grains. Moreover, syntaxial growth would agree with an expected low to moderate supersaturation.
SSA and CEC
A strong correlation was observed between the CEC and the SSA (Fig. 11b; data in Supplement 1) either determined by N2 or Ar (Fig. 11a). Both SSA methods (Ar and N2) are so highly correlated that either could be used for the comparison with other parameters without any difference in results. However, the SSAs determined with argon were slightly smaller than the corresponding SSAs determined from nitrogen adsorption. This is in line with the findings presented in Seemann et al. (Reference Seemann, Weber, Bertier, Claes and Stanjek2025). In this context it should be recalled that BET areas are operational quantities and, depending on contributions from micropores, do not correspond to the physical surface area. In particular, smectites, illite-smectite interstratified clay minerals and OM can contribute to microporosity in organic-rich shales.
Comparison of various parameters that are expected to be correlated with either the content of smectitic layers (CEC, SSA) or overall clay mineral content (K2O content, porosity).

Figure 11 Long description
The image contains four scatter plots labeled a, b, c and d. Plot a shows the relationship between SSA subscript N2BET and SSA subscript Ar, with a fitted line equation y equals 1.1x minus 2.5 and R squared equals 1.0. The x-axis and y-axis both range from 0 to 40 m squared g superscript minus 1. The plot indicates a near 1:1 agreement between the two SSA measurements. Plot b displays CEC versus SSA subscript N2BET, with a fitted line equation y equals 0.4x plus 0.4 and R squared equals 0.9. The x-axis ranges from 0 to 45 m squared g superscript minus 1 and the y-axis ranges from 0 to 20 meq 100 g superscript minus 1. The plot shows that CEC increases with SSA, with notable clusters labeled TS1 and TS2. Plot c illustrates CEC against K2O content, with a fitted curve equation y equals 1.3e superscript 0.8x and R squared equals 0.8. The x-axis ranges from 0.0 to 4.0 mass percent and the y-axis ranges from 0 to 20 meq 100 g superscript minus 1. The plot reveals a nonlinear increase in CEC with K2O content, with a cluster labeled TS1. Plot d presents CEC versus total porosity dryflow, with a fitted line equation y equals 0.8x minus 1.7 and R squared equals 0.8. The x-axis ranges from 0 to 20 volume percent and the y-axis ranges from 0 to 20 meq 100 g superscript minus 1. The plot indicates that CEC increases with total porosity, with a cluster labeled TS13. Overall, the plots demonstrate positive correlations between CEC and the various predictors, with SSA subscript Ar closely matching SSA subscript N2BET and CEC increasing with SSA, K2O content and porosity. Key data points and clusters are highlighted, showing trends and relationships across the different parameters.
The CEC, on the other hand, is largely controlled by smectitic layers, with minor contributions from illite, chlorite and kaolinite. In soils, the CEC is also influenced by organic molecules/materials rich in functional groups. Because in this sample set the CEC does not correlate with organic carbon content, we can deduce that smectite and other clay minerals are the primary cation exchangers.
A good correlation was also observed between the CEC and the K2O content, which is known to be closely associated with the illite and illite-smectite contents. Illites and/or illite-smectite show higher potassium contents than smectite, with the latter strongly affecting the CEC. Significant scatter of the data points shown in Fig. 11c would, therefore, indicate significant variation in the ratio of smectite to illite/illite-smectite. The good correlation shown in Fig. 11c consequently indicates a relatively constant ratio of smectite to illite/illite-smectite. TS1 is an exception here because, for its comparatively high CEC, it shows a relatively low potassium content. Kaufhold et al. (Reference Kaufhold, Dohrmann, Ufer and Meyer2002) proved that sample TS1 contains the highest smectite content. This might hint towards the existence of free smectite in addition to mixed-layer minerals.
The good correlation between the CEC and the total porosity (Fig. 11d) indicates that a significant portion of the porosity is associated with the clay minerals, as the CEC was found to most probably reflect the clay mineral content (smectite + illite/illite-smectite) in the present sample set. No correlation was observed between the CEC and the modal pore size, suggesting that here the clay content does not significantly depend on the burial depth.
Thermal maturity indices
The results of the most widely used approach for assessing thermal maturity and the resulting maximum temperature of palaeoburial heating (T maxgeo) are given in Supplement 2, using VRo % data in combination with the correlation equation of Barker & Pawlewicz (Reference Barker and Pawlewicz1994).
VRo % is the most widely accepted method for determining thermal maturity of OM in sedimentary rocks (e.g. Gonçalves et al., Reference Gonçalves, Kus, Hackley, Borrego, Hámor-Vidó and Kalkreuth2024). In the studied samples, the obtained values range from 0.44% to 1.47% VRo, with the number of measurements per sample varying between 9 and 56 (Supplement 2). The overall reflectance determination for samples with fewer than 20 individual measurement points (TS1, TS5, TS6, TS7, TS8, TS11, TS12, TS16, TS18) does not comply with the ASTM D7708-23 (2023) standard. This results from the low content of organic carbon, which in turn results in a low content of vitrinite particles in the section used for determining the vitrinite reflectance. Thus, values from such non-compliant analyses should be used only as qualitative indicators of thermal maturity. In general, the precision of obtained VRo % values is based on (1) pooled standard deviation for random VRo % values and (2) the reproducibility limit, which represent the uncertainty (in absolute reflectance) for any individual measurement as an estimate of measurement precision (Hackley et al., Reference Hackley, Zhang, Jubb, Valentine, Dulong and Hatcherian2020; ASTM D7708-23, 2023). For the pooled standard deviation of mean random VRo % values, excluding the non-compliant values, the reported standard deviation amounts to 0.06, with the highest value of 0.09. The highest reported standard deviation of 0.09 therefore indicates very good reliability, as reflected by the corresponding coefficient of variation (standard deviation/mean) of <0.1. Regarding the reproducibility limit, the obtained mean random VRo % values (Supplement 2) further demonstrate very good compliance, with (1) reproducibility limit values of 0.1–0.2% VRo for peak oil thermal maturity obtained for shales, with VRo ranging from 0.31% to 0.50%, and (2) reproducibility limit values of ∼0.3% for wet gas/condensate thermal maturity acquired in shales, with VRo ranging from 0.80% to 0.99%.
The reliable VRo % also indicate that the dispersed OM in the analysed samples ranges from thermally immature to overmature, corresponding to late oil generation, if the start of the oil window is set at VRo of 0.6% for oil-prone kerogen (e.g. Senftle & Landis, Reference Senftle, Landis and Merrill1991; Dembicki, Reference Dembicki2009, amongst others).
The VRo % measurements obtained in this study for Opalinus Clay (0.59% VRo in the TS4 and TS8 samples) samples correspond well with previously reported values in, for example, the Betznau well (0.45–0.75% VRo; Mukhopadhyay & Leythaeuser, Reference Mukhopadhyay and Leythaeuser1984), the Benken well (0.52–0.58%; NAGRA, 2001) and Mont Terri (0.52–0.58% VRo published in NAGRA, 2002; 0.58% VRo published in Mazurek et al. Reference Mazurek, Hurford and Leuz2006).
The VRo % data from the Hilsmulde area obtained in this study for Posidonia Shale correspond well with previously reported thermal maturity values. In the Dielmissen well, a value of 0.61% VRo was obtained, in Dohnsen it was 0.73% VRo, in Bensen they were 1.40% and 1.41% VRo and in Haddessen it was 1.47% VRo for TS11–15, all of which corresponds well to thermal maturities reported in the literature. According to Littke & Rullkötter (Reference Littke and Rullkötter1987), the reported VRo % values in the Hilsmulde area are 0.68% VRo in Dielmissen, 0.73% VRo in Dohnsen and 1.45% VRo in Haddessen. Similarly, Rullkötter et al. (Reference Rullkötter, Leythauser, Horsfield, Littke, Mann and Müller1987) and Littke et al. (Reference Littke, Baker and Leythaeuser1988) reported compatible values, listing 0.68% VRo in Dielmissen and 1.45% VRo in Haddessen.
Regarding VRo % in the Callovo-Oxfordian claystones of Bure, lignite fragments were observed and measured. In the examined samples, ulminite reflectance from 0.36% to 0.40% VRo is based on measurements of relatively few particles (≤10). These results, however, are consistent with those of Blaise et al. (Reference Blaise, Izart, Michels, Suarez-Ruiz, Cathelineau and Landrein2011) for the equivalent Callovo-Oxfordian strata, who reported values from 0.35% to 0.41% VRo. It should be noted that, in contrast to Blaise et al. (Reference Blaise, Izart, Michels, Suarez-Ruiz, Cathelineau and Landrein2011), who performed the reflectance measurements on kerogen concentrates, the data presented here were obtained from polished whole-rock pellets.
The VRo % data obtained at the Zuckerfabrik (TS1) drill site represent 0.45% VRo, supporting the low thermal maturity of Lower Cretaceous claystones reported by Kneuker et al. (Reference Kneuker, Blumenberg, Strauss, Dohrmann, Hammer and Zulauf2020). The exact location and depth of samples TS16 and TS17 (Eagleford Shale and Mancos Shale) are unknown, and therefore a comparison of VRo % values is not possible.
The solid bitumen reflectance value (BRo %) of 0.78% BRo obtained in this study for the Wolfcamp Shale (TS18) is consistent with previously reported thermal maturity data. Hackley et al. (Reference Hackley, Zhang, Jubb, Valentine, Dulong and Hatcherian2020) reported an average of 0.68% BRo for 12 siliceous and calcareous mudrock samples and an average of 0.77% BRo for four fine-grained carbonate samples of Leonardian Wolfcamp (Wolfcamp A; Lower Permian) and organic-rich siliceous and calcareous mudrocks from the Ricker #1 well in northern Reagan County, Midland Basin. Similarly, Hentz et al. (Reference Hentz, Baumgardner, Hamlin and Breton2014) reported an average of 0.68% VRo from four samples of Leonardian Wolfcamp shale from the same well. Furthermore, Landis (Reference Landis1990) published values ranging from 0.72% to 0.94% VRo from 36 Wolfcamp shale samples, with an average of 0.84% VRo. The VRo values obtained in this study range from 0.90% to 1.07% VRo, with an average of 0.96% VRo, indicating a slightly higher thermal maturity compared to earlier studies.
Using the correlation equation of Barker & Pawlewicz (Reference Barker and Pawlewicz1994), ASTM D7708-23 (2023) standard-compliant VRo % values were converted to maximum temperature of palaeoburial heating (T maxgeo), with values ranging from 54°C to 167°C (Supplement 2). These temperatures were compared with the calibrated illite crystallinity values (CIS) determined for the samples, which range from 0.39–0.76°2θ on the CIS scale (Fig. 12). This range indicates largely diagenetic values, with some samples ranging into the lower anchizone grades when the appropriate boundary is set between the two zones at 0.52°2 θ (Warr & Ferreiro Mählmann, Reference Warr and Ferreiro Mählmann2015). For samples TS16 and TS18, no values could be determined because of their too low clay content.
Comparison of IC, VRo % and maximum temperature of palaeoburial heating (T maxgeo) derived from VRo % and Rock-Eval (T max). Blue symbols indicate all samples; orange symbols indicate only quality-checked samples (see Supplements 2 & 3): (a) 9 validated (orange), 16 all (blue); (b) 4 non-ASTM D7708-23 (2023) standard-compliant samples (orange), 15 all (blue); (c) 8 ASTM D7708-23 (2023) standard-compliant samples (orange), 21 all (blue).

Figure 12 Long description
The image A showing a scatter plot with the horizontal axis labeled calibrated illite crystallinity with unit degree 2 theta, ranging from 0.0 to 1.0. The vertical axis is labeled VR subscript o with unit percent, ranging from 0.0 to 2.0. Point labels visible include TS14, TS11 and TS12. The plotted points appear between about 0.4 and 0.9 on calibrated illite crystallinity and between about 0.3 and 1.2 on VR subscript o percent. The image B showing a scatter plot with the horizontal axis labeled calibrated illite crystallinity with unit degree 2 theta, ranging from 0.0 to 1.0. The vertical axis is labeled Tmaxgeo, Rock-Eval with unit degree celsius, ranging from 0 to 150. A fitted line slopes downward from higher Tmaxgeo, Rock-Eval values at lower calibrated illite crystallinity to lower Tmaxgeo, Rock-Eval values at higher calibrated illite crystallinity. Text near the upper right reads R superscript 2 equals 0.5. The plotted points appear between about 0.3 and 0.9 on calibrated illite crystallinity and between about 40 and 130 on Tmaxgeo, Rock-Eval. The image C showing a scatter plot with the horizontal axis labeled Tmaxgeo, Rock-Eval with unit degree celsius, ranging from 0 to 200. The vertical axis is labeled Tmaxgeo, VR subscript o with unit degree celsius, ranging from 0 to 200. A diagonal reference line is drawn and a fitted line slopes upward. Text near the upper right reads R superscript 2 equals 0.5. The plotted points appear between about 40 and 170 on Tmaxgeo, Rock-Eval and between about 40 and 170 on Tmaxgeo, VR subscript o.
However, when IC is plotted against VRo %, no correlation is apparent, regardless of whether all data points or only ASTM D7708-23 (2023) standard-compliant values are considered (Fig. 12a). This discrepancy can be explained, at least in part, by the fact that VRo % is influenced by variations in thermal gradients, whereas IC is additionally affected by the chemical composition of the porewater. IC values may be further influenced by the presence of detrital illite-muscovite, if present in the <2 μm size fraction. The VRo % of samples TS11, TS12 and TS14 from the Hilsmulde area is ∼1.5% VRo, whereas all other samples show values well below 1% VRo. The possibility of local lower anchizone grades being reached in the thermally mature shales, with palaeotemperatures of ∼160°C, is indicated by the respective IC values of 0.54, 0.51 and 0.55°2θ for samples TS11, TS12 and TS14 and IR values of 1.0–1.4, which are indicative of negligible smectite present in the authigenic illite particles (Supplement 2). However, this pattern is not mirrored by the other Hilsmulde area samples TS13 and TS15, for which palaeotemperatures of ∼100°C were calculated despite the IC values falling within the lower anchizonal conditions (0.51 and 0.30°2θ, respectively). The precise reason for this discrepancy remains unclear, but low IRs may indicate either enhanced K concentrations in the porewaters or contamination by detrital micas. As outlined earlier, different kerogen types can also explain the poor correlation.
In contrast, the Rock-Eval-derived palaeotemperatures reveal a more consistent thermal history for all Hilsmulde area samples (TS11–15), for which lower palaeotemperatures of ∼110°C were calculated. A correlation between IC and Rock-Eval-derived palaeotemperatures calculated on the basis of T max (Fig. 12b), albeit weak (R 2 = 0.5), is evident when plotting all samples, but because of the small number of values, no regression function was calculated. This relationship indicates the Rock-Eval-derived palaeo temperatures are likely to represent more reliable estimates of the samples state of thermal maturity and to indicate that the Hilsmulde area may not have reached metamorphic, lower-anchizonal conditions (i.e. >150°C).
In Fig. 12c, the maximum temperatures of palaeoburial heating (T maxgeo) calculated using both the VRo % and T max from Rock-Eval pyrolysis are compared. On average, VRo % yields higher T maxgeo values than those derived from Rock-Eval analyses. Both methods, however, show similar trends, indicating that they are equally capable of distinguishing samples with lower and higher palaeotemperatures. A slightly better correlation was found when considering only validated data (Fig. 12c). The two outliers with lower T maxgeo of ∼90°C, based on Rock-Eval T max, are the Opalinus Clay from Mont Terri and the Mancos Clay. Both contain a mixture of kerogen types III and II, which may partly explain the discrepancy between the VRo % and Tmax values.
Pore size and maturity proxies
The modal pore diameter depends on burial depth, but it is not commonly used as maturity proxy. It may, however, provide additional valuable information and is therefore compared with the other maturity proxies (Fig. 13). A good correlation between pore size and VRo % is observed when the samples of the highest VRo %, and thus greatest thermal maturity, from the Hilsmulde area are excluded (Fig. 13a, green). This high thermal maturity may be attributed to the thermal anomaly caused by a shallow (6 km deep) intrusion (Petmecky et al., Reference Petmecky, Meier, Reiser and Littke1999) that resulted in such ‘maturation anomalies’ (Bernard et al., Reference Bernard, Horsfield, Schulz, Wirth, Schreiber and Sherwood2012). However, the lithostatic pressure experienced by at least some Hilsmulde area samples (e.g. TS11, TS12, TS14) seemed insufficient to cause significant pore-size reduction, at least regarding the modal pore size. Notably, not all Hilsmulde area samples deviate from the main trend, suggesting that these particular rocks were buried deeper.
Comparison of average pore sizes (blue: all samples; green: without Hilsmulde area samples). Modal pore size compared with maturity proxies such as (a) vitrinite reflectance, (b) calibrated illite crystallinity and (c) T maxgeo.

No correlation was observed between pore size (Hg data were used, but a similar trend is observed with Ar data) and IC (Fig. 13b). This can be explained, as before, by the fact that the potassium availability differs between basins, and this strongly affects the IC, and/or that there are varying degrees of detrital and authigenic illites in these diagenetic samples. An additional explanation is that the IC reflects the mineral growth history of a rock rather than acting as a strict geothermometer, since at these low temperatures the kinetics of crystal growth predominate over temperature alone.
Figure 13c compares the pore size with the palaeotemperature derived from Rock-Eval. Overall, samples with a smaller pore size tend to correspond with higher palaeotemperatures, probably recording from deeper burial depths; however, no correlation is apparent. Samples TS11 and TS12 are anomalous, exhibiting significantly larger pore sizes than expected based on their palaeotemperatures. This supports the idea that these samples experienced higher temperatures under comparably lower lithostatic pressures (as shown in Fig. 13a).
Smectitic layers and maturity proxies
The content of smectitic layers is known to decrease with increasing burial depth (e.g. Waliczek et al., Reference Waliczek, Machowski, Poprawa, Świerczewska and Więcław2021), whereas the quartz/clay mineral ratio in the sample set remained relatively constant. Hence, it was expected that either the SSA or CEC would exhibit some relation with the maturity proxies. In Fig. 14, the SSA is compared with maturity proxies, as it had been shown to correlate well with the smectitic layer content (Fig. 11). Therefore, other parameters such as CEC or K₂O content could also be used, as they would be expected to show similar trends.
Comparison of the SSA (highly correlated with CEC and K2O; Figure. 11) with (a) pore size, (b) IC and (c) palaeotemperature derived from Rock-Eval (orange = only validated results). cal. = calibrated.

Figure 14 Long description
Plot 1. The horizontal axis label is SSA subscript N2BET left parenthesis m superscript 2 g superscript negative 1 right parenthesis. The horizontal axis range is 0 to 50. The vertical axis label is modal pore size left parenthesis nanometer right parenthesis. The vertical axis range is 0 to 70. Points span the full horizontal range, with modal pore size values from near 0 up to around 60. The point distribution shows values spread across the plot without a single line drawn through the points. Plot 2. The horizontal axis label is SSA subscript SS left parenthesis m superscript 2 g superscript negative 1 right parenthesis. The horizontal axis range is 0 to 50. The vertical axis label is cal. illite crystallinity left parenthesis 2 theta right parenthesis. The vertical axis range is 0.0 to 1.0. A dotted fitted line slopes upward. The text R superscript 2 equals 0.5 is printed inside the plot. Points lie mainly between about 0.4 and 0.8 on the vertical axis. Plot 3. The horizontal axis label is SSA subscript N2BET left parenthesis m superscript 2 g superscript negative 1 right parenthesis. The horizontal axis range is 0 to 40. The vertical axis label is T subscript max Rock Eval left parenthesis degree celsius right parenthesis. The vertical axis range is 0 to 160. A dotted fitted line slopes downward. The text R superscript 2 equals 0.6 is printed inside the plot. Points appear between about 60 and 140 on the vertical axis. Across the three plots, the same specific surface area variable appears on the horizontal axis in Plot 1 and Plot 3 and a different specific surface area variable appears on the horizontal axis in Plot 2. Multiple point styles are visible and a legend explaining the point grouping is not shown within the plots.
In Fig. 14a, the SSA is compared with the pore size. Samples with a small pore size are expected to have been buried deeper than others with larger pore sizes and should therefore, on average, have a lower smectitic layer content and lower SSA. Samples with pore sizes below 20 nm, however, show a wide SSA range (2–30 m2 g–1), indicating variable smectitic layer content. This can be explained by the fact that the samples are derived from different basins in which the claystone composition, including the initial smectitic layer content, was different. For three samples, an unusual porosity/pore size relation was observed (Fig. 7). These samples are rich in carbonates and therefore relatively poor in clay minerals, which explains their location in the plot (Fig. 14a). The IR (Supplement 2) showed a weak correlation with the SSA and CEC (with the latter both being highly correlated), hence it less accurately represents the smectitic layer content.
The decrease in smectitic layers with progressing illitization explains the observed moderate correlation (R 2 = 0.5) between SSA and IC (Fig. 14b). The scatter is probably due to compositional variations, such as differences in the initial content of smectitic layers or the carbonate to clay ratio. The apparent correlation between SSA and Rock-Eval palaeotemperature (Fig. 14c) can be explained similarly. Lower burial depths resulted in a reduced extent of illitization and, consequently, a greater smectitic layer content, corresponding to a greater SSA. Deeper burial depths, on the other hand, lead to increased illitization, which in turn reduces the smectitic layer content and the associated micropores (SSA). The parameters IC, smectitic layer content and palaeotemperature are evidently more closely related than pore size, which is assumed to be controlled by lithostatic pressure, effective stress and pore pressure.
Comparison of potential clay-bearing host rocks
For an optimal comparison of claystones and related lithologies as host rocks, ideally all relevant properties should be available for assessment. Even so, a decision must be made regarding which properties are more important. Assessing the relevance of these properties is, however, difficult because their impact on host-rock performance, which can be assessed based on the amount of radionuclides liberated after a certain time, is difficult to determine. In addition, some properties have only an indirect effect. As an example, the effect of T maxgeo on radionuclide release is harder to predict than that of porosity or permeability, as higher T maxgeo values may induce mineral reactions indirectly affecting porosity and permeability. Consequently, the relative relevance of T maxgeo with respect to radionuclide release is more challenging to assess. To compare the effects of different maximum temperatures of palaeoburial heating (T maxgeo), swelling clay mineral content and porosity/permeability models must provide quantitative estimates of their impact on radionuclide release. Such modelling is essential to determining how the relative relevance of various properties of claystones and related lithologies affects overall host-rock performance. Changing one of the parameters in such a model then allows for a quantitative assessment of host-rock performance. In a hypothetical example, increasing T maxgeo from 100°C to 120°C could result in 50% more radionuclides being released (due to increased smectite degradation), whereas a 10% increase in swelling clay minerals could reduce this amount by a similar proportion. Hence, two similar lithologies with different T maxgeo and swelling clay mineral contents could be considered equally relevant and suitable in this hypothetical scenario. Establishing such a reactive solute transport model, however, requires assumptions to be made because the coupled processes and their effects, such as self-sealing and swelling pressure, are not fully understood and hence cannot yet be assessed quantitatively.
The varying degrees of understanding regarding the effects of various properties on barrier performance complicates the identification of the most relevant properties to assess. However, permeability, which is largely controlled by porosity, appears better suited than other properties, such as self-sealing or the T maxgeo parameter, because its impact on radionuclide release is more straightforward to model. Differences in permeability can also compensate for variations in layer thickness. For example, a tighter 100 m-thick layer (i.e. with lower permeability) may be more effective at sealing radioactive waste than a 300 m-thick layer with higher permeability. Therefore, claystone or shale formations with different formation thicknesses and properties may exhibit comparable performance.
In practice, only limited information is available regarding these lithologies, with most such data originating from the upstream oil and gas industry (at least in the Federal Republic of Germany). Established relations as presented earlier in the current paper can be used to derive unknown properties. In addition, a number of properties show significant changes up to a burial depth of ∼2000 m (or ∼2500 m) but remain largely constant below this depth (Figs 2 & 3). Claystones and shales buried deeper than ∼2000 m generally exhibit pore sizes below 40 nm (Fig. 3), resulting in generally beneficial properties compared to less consolidated materials, except for ductility and adsorption capacity. Burial depths of >2000 m also correspond to porosities of <30% (Fig. 2), hydraulic conductivities of <10–12 m s–2 (Fig. 4) and VR0 values of >0.6%. Accordingly, sedimentary lithologies with modal pore diameters below 40 nm are preferable. Common compacted claystones with minor macroporosity would thus have been buried deeper than 2000 m, consequently resulting in favourable mechanical properties. However, pore diameters of <40 nm can also be reached in cases of very fine particles and low compaction, but those materials commonly show significant macroporosity. For common claystones, the pore size is therefore suggested as a further parameter for estimating burial depth because it is less affected by the thermal anomalies evident in VRo % or Rock-Eval data or the K availability required for illitization that influences IC. Figure 15a,b compares pore size with CEC and T maxgeo. Preferable host rocks are expected to fall within the top-left fields of these diagrams, using a cut-off pore size of 40 nm and sufficient smectite to achieve CEC values of >10 meq 100 g–1, which are beneficial for effective radionuclide retention, swelling and self-sealing.
Comparison of modal pore diameters with (a) CEC and (b) T maxgeo to compare claystone and shale lithologies. The greyscale areas represent the error of the various methods.

Figure 15 Long description
The first scatter plot shows the relationship between modal pore size in nanometers on the x-axis and CEC in milliequivalents per 100 grams on the y-axis, ranging from 0 to 80 nanometers and 0 to 20 milliequivalents per 100 grams, respectively. The second scatter plot displays modal pore size in nanometers on the x-axis and paleotemperature VRo in degrees Celsius on the y-axis, ranging from 0 to 80 nanometers and 0 to 180 degrees Celsius, respectively. Both plots use color-coded markers to represent different lithologies: Cretaceous, Germany; Mont Terri; Bure; Hilsumulde; and Eagleford. The plots indicate clusters and outliers, with notable points labeled TS1 and TS14. The greyscale areas represent the error of the various methods. The plots aim to compare claystone and shale lithologies, highlighting differences in pore size and related properties.
Of all of the samples studied, only one of the Mont Terri Opalinus claystone samples falls within both preferable fields. Other samples from this location show mixed properties, often with low CEC and borderline pore sizes. Samples from Bure, which have higher CEC values and smaller pores sizes, fall within the top-left field only in Fig. 15a due to their low palaeotemperatures (Fig. 15b).
This illustrates that quality-determining properties can be ranked according to their relevance, and that relying on a single parameter is insufficient. This comparison is only an example of how the various relevant properties could be ranked and used to distinguish between different host rocks according to their expected performance.
Summary and conclusions
This study evaluates the suitability of various claystones and related lithologies as potential host rocks for HLRW. Organic-rich sedimentary rocks are suggested to be excluded from consideration, as they are regarded as less suitable due to the potential development of secondary porosity, oil or gas generation and microbial activity. In addition, greater formation thickness and lithological homogeneity are considered favourable, although the latter is difficult to quantify. Beyond these general criteria, 10 key properties were identified, each influenced by maximum burial depth and the broader geological history.
The most favourable properties of claystones and related lithologies for hosting HLRW, assuming the rocks are organic-poor, thick and homogeneous, generally improve with increasing burial depth and compaction. However, properties that depend on smectite content, such as ductility, retention capacity and potential self-sealing behaviour, tend to deteriorate due to progressive illitization with increasing burial. The content of smectitic layers, however, depends more on the initial mineralogical composition then on burial depth if materials from different basins are compared.
The literature data indicate that below burial depths of ∼2 km properties such as mechanical strength, pore size and porosity, and therefore permeability, change to a lesser extent than above such depth. Accordingly, a pore size of ∼40 nm, corresponding to a burial depth of ∼2 km, was used as a cut-off value in the example discussed in the present study and Fig. 15. Burial depth is not the only factor controlling sedimentary rock properties. Variations in cementation and microstructure can account for differences between claystones and shales at similar burial depths. To enable an optimal comparison between lithologies, a comprehensive characterization of sedimentary rock properties is essential for assessing geotechnical relevance and suitability for the selection of potential HLRW sites. In practice, however, only limited data on potential target formations are typically available. In Germany, for example, most information on claystones and related lithologies has been generated by the upstream oil and gas industry. Consequently, typical organic petrological parameters such as VRo % and IC are generally available from these data. It is therefore important to extract as much information as possible from the available parameters. Comparison of the VRo %, IC and pore size values of the samples investigated in the present study indicated that:
• VRo % and/or T max (Rock-Eval pyrolysis) can be used to estimate the approximate T maxgeo of claystones and shales. Using both methods is recommended to ensure the robustness of the findings, as similar results can be regarded as reliable and cross-validated. The estimated maximum temperature of palaeoburial heating (T maxgeo) can help predict the thermal stability of the lithology, which is important when designing a repository.
• IC values, or related methods for characterizing illitization, may help to estimate the remaining smectite; however, CEC measurements or proxies such as SSA would also be sufficient and are probably even more accurate, although they are less widely available. For the comparison of barrier-relevant properties, the IC values are apparently less valuable.
• Pore-size measurements can reflect the burial history of organic-poor claystones better than total porosity, because total porosity can be reduced by, for example, cementation, as indicated by electron microscopic investigations. The low porosity of common claystones, therefore, does not necessarily indicate deep burial, whereas small pore sizes may do. Measuring pore size thus only allows validation of parameters such as VRo % if the thermal gradients (increase of temperature with burial depth) are comparable.
• Both Hg and Ar porosimetry were found to be suitable for pore-size characterization, but the absolute values were different, which has to be considered when comparing different datasets. Ar physisorption provides larger total porosity values, probably because of the limited accessibility of Hg in small pores.
In addition, this study presents an example comparison of claystones and related lithologies as potential host rocks for the storage of HLRW based on the assumption that low hydraulic conductivities, resulting from low porosity and small pore sizes, are the primary criterion of concern. The CEC, probably affecting ductility, retention capacity and, to some extent, self-sealing ability, was also considered alongside the maximum temperature of palaeoburial heating (T maxgeo), calculated from VRo % and Rock-Eval data (T max). A more accurate assessment would be possible based on quantitative information regarding how the various properties directly or indirectly affect the liberation of a certain amount of radioactivity after a certain time. A quantitative comparison of different claystones and related lithologies would require establishing a reactive solute transport model that couples multiple processes and simulates radionuclide release flux at specific timescales. Current research remains at the stage of multi-parameter comparison and has not provided a comprehensive, performance-based quantitative ranking of their importance with respect to barrier performance. Finally, research needs were identified in this study with respect to the effect of both illitization and burial depth on the swelling pressure/self-sealing properties of claystone barriers.
Supplementary material
The supplementary material for this article can be found at https://doi.org/10.1180/clm.2026.10043.
Competing interests
The authors declare none.
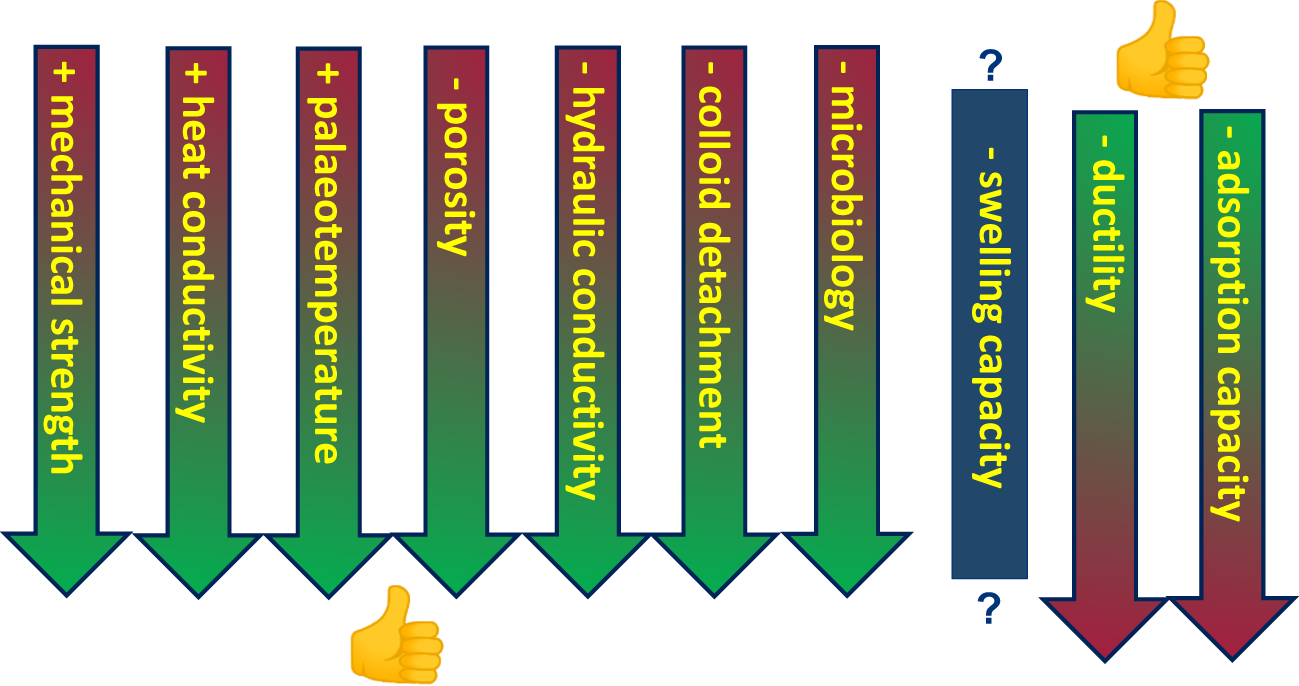
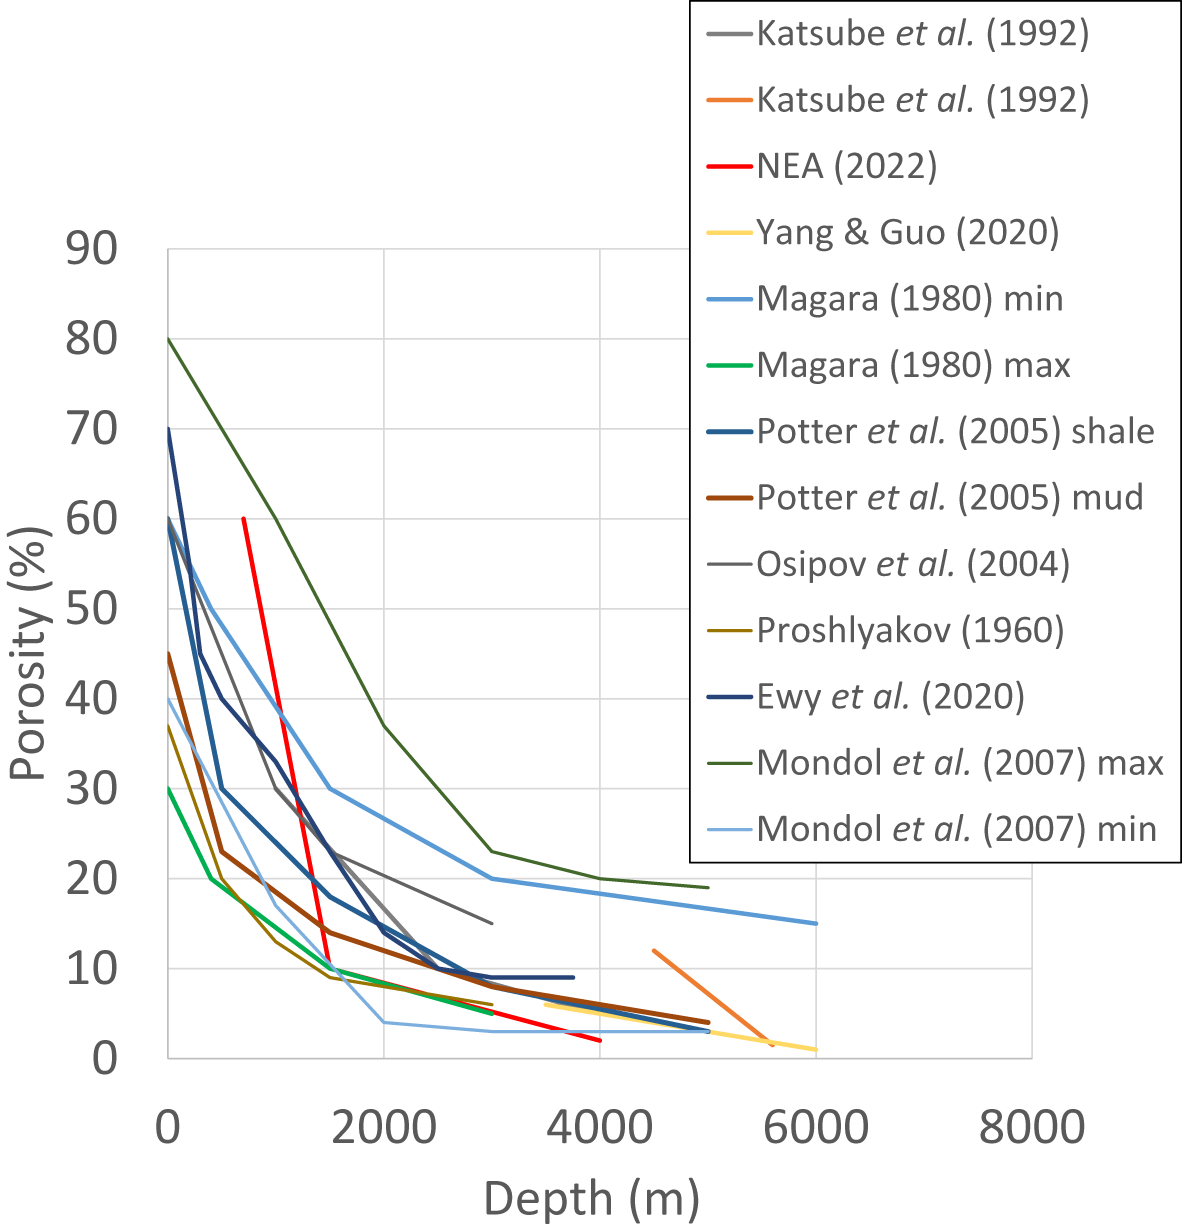
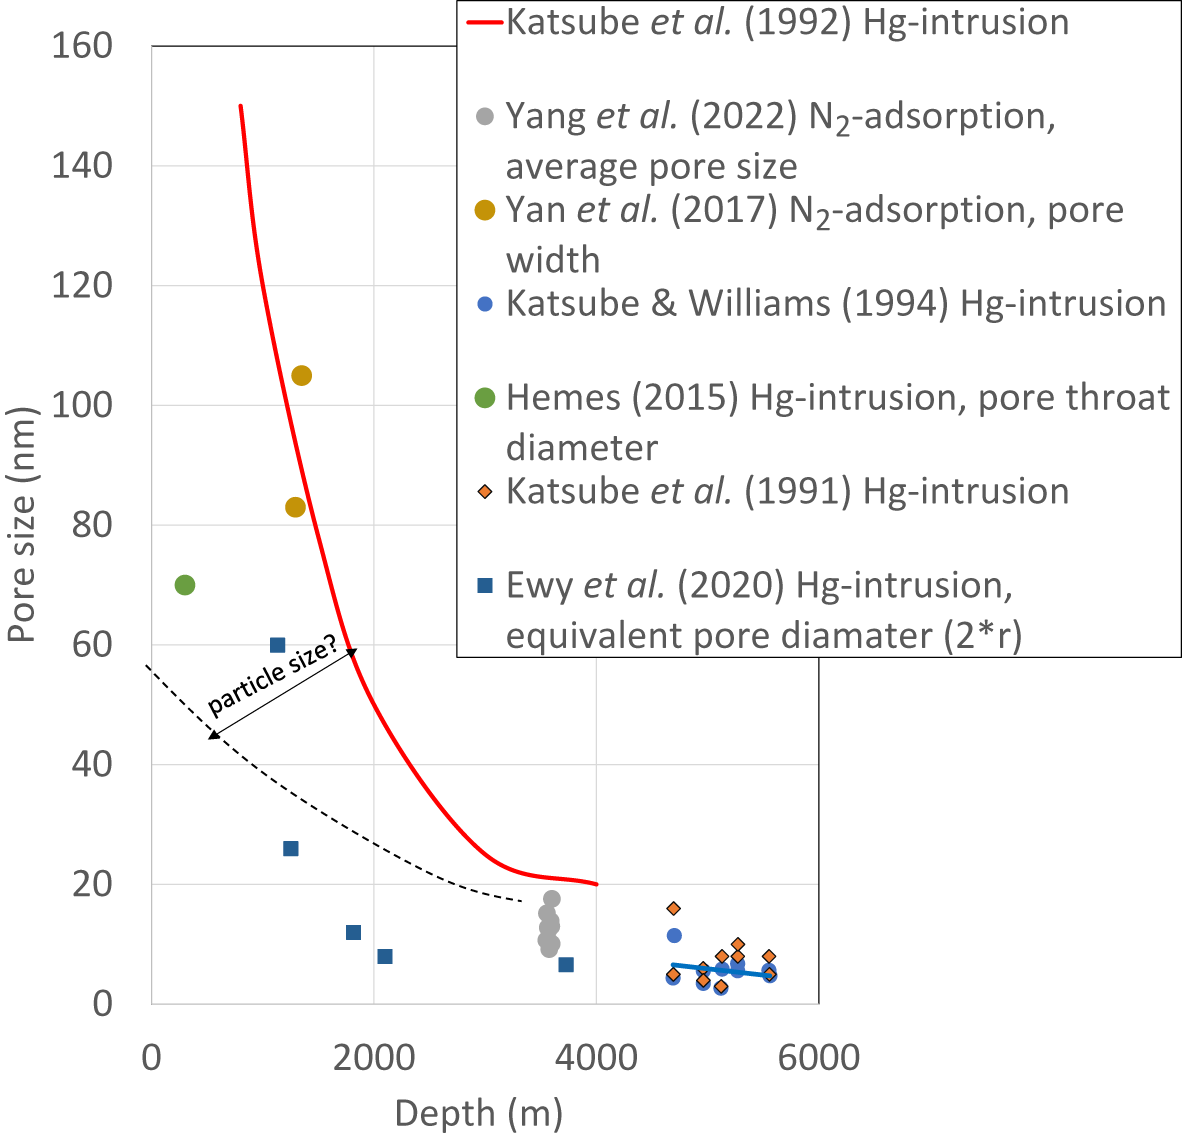
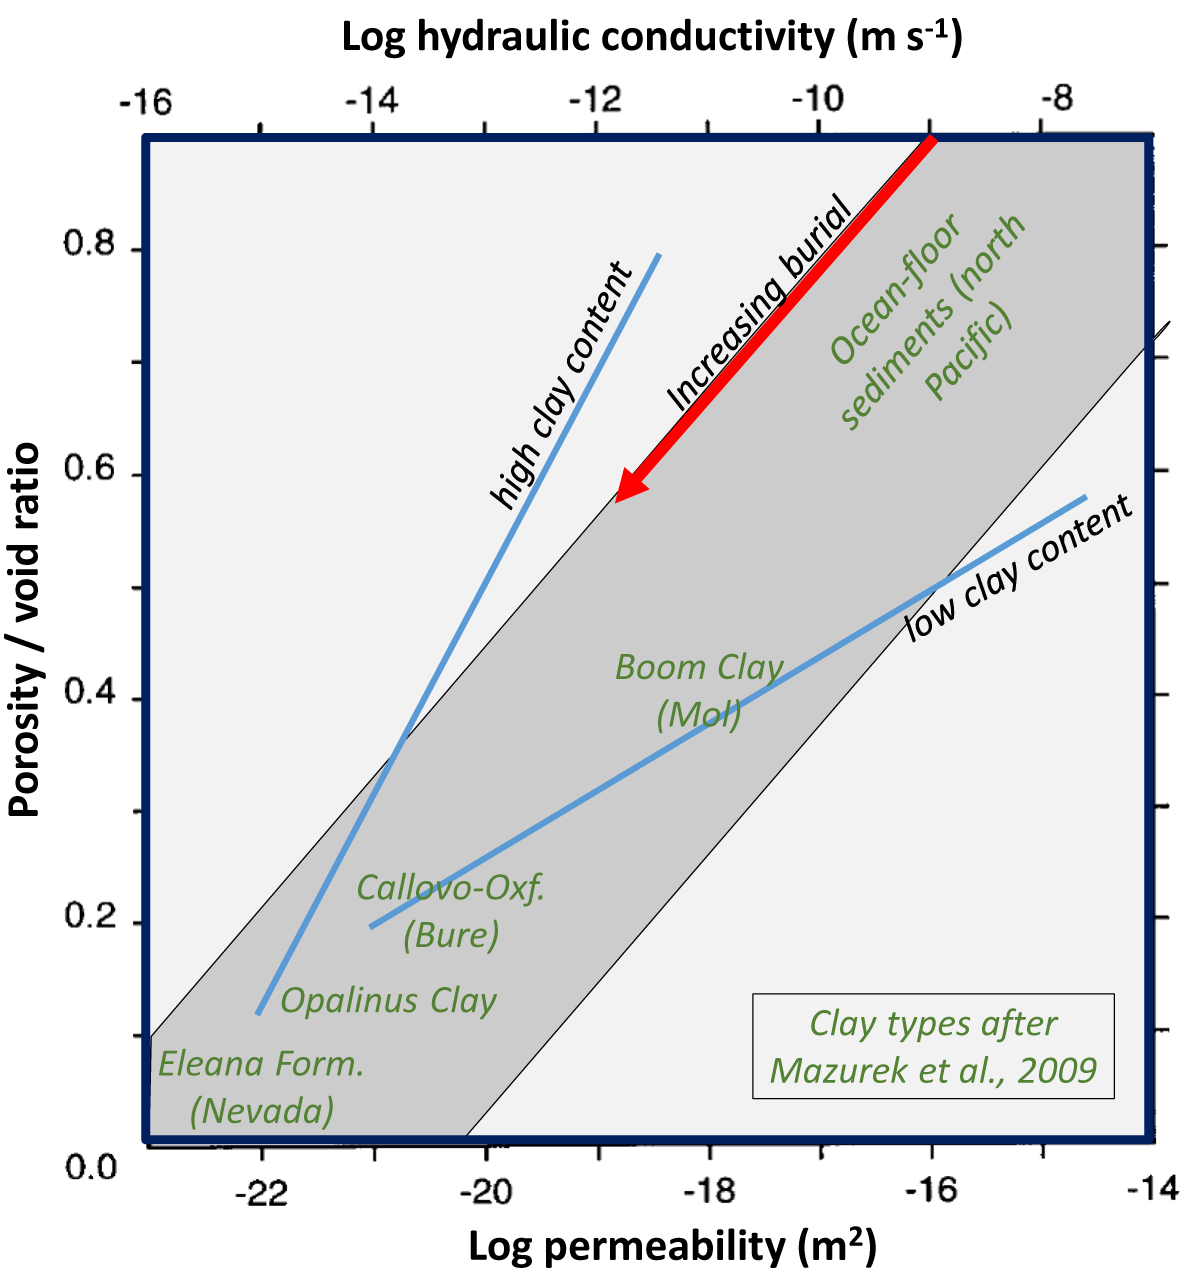
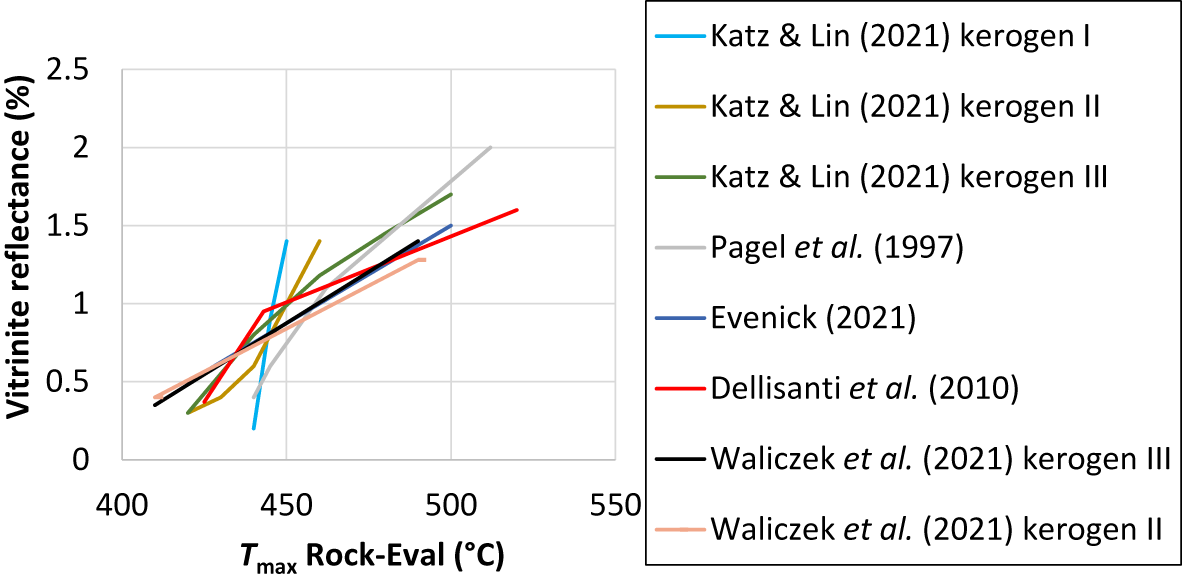
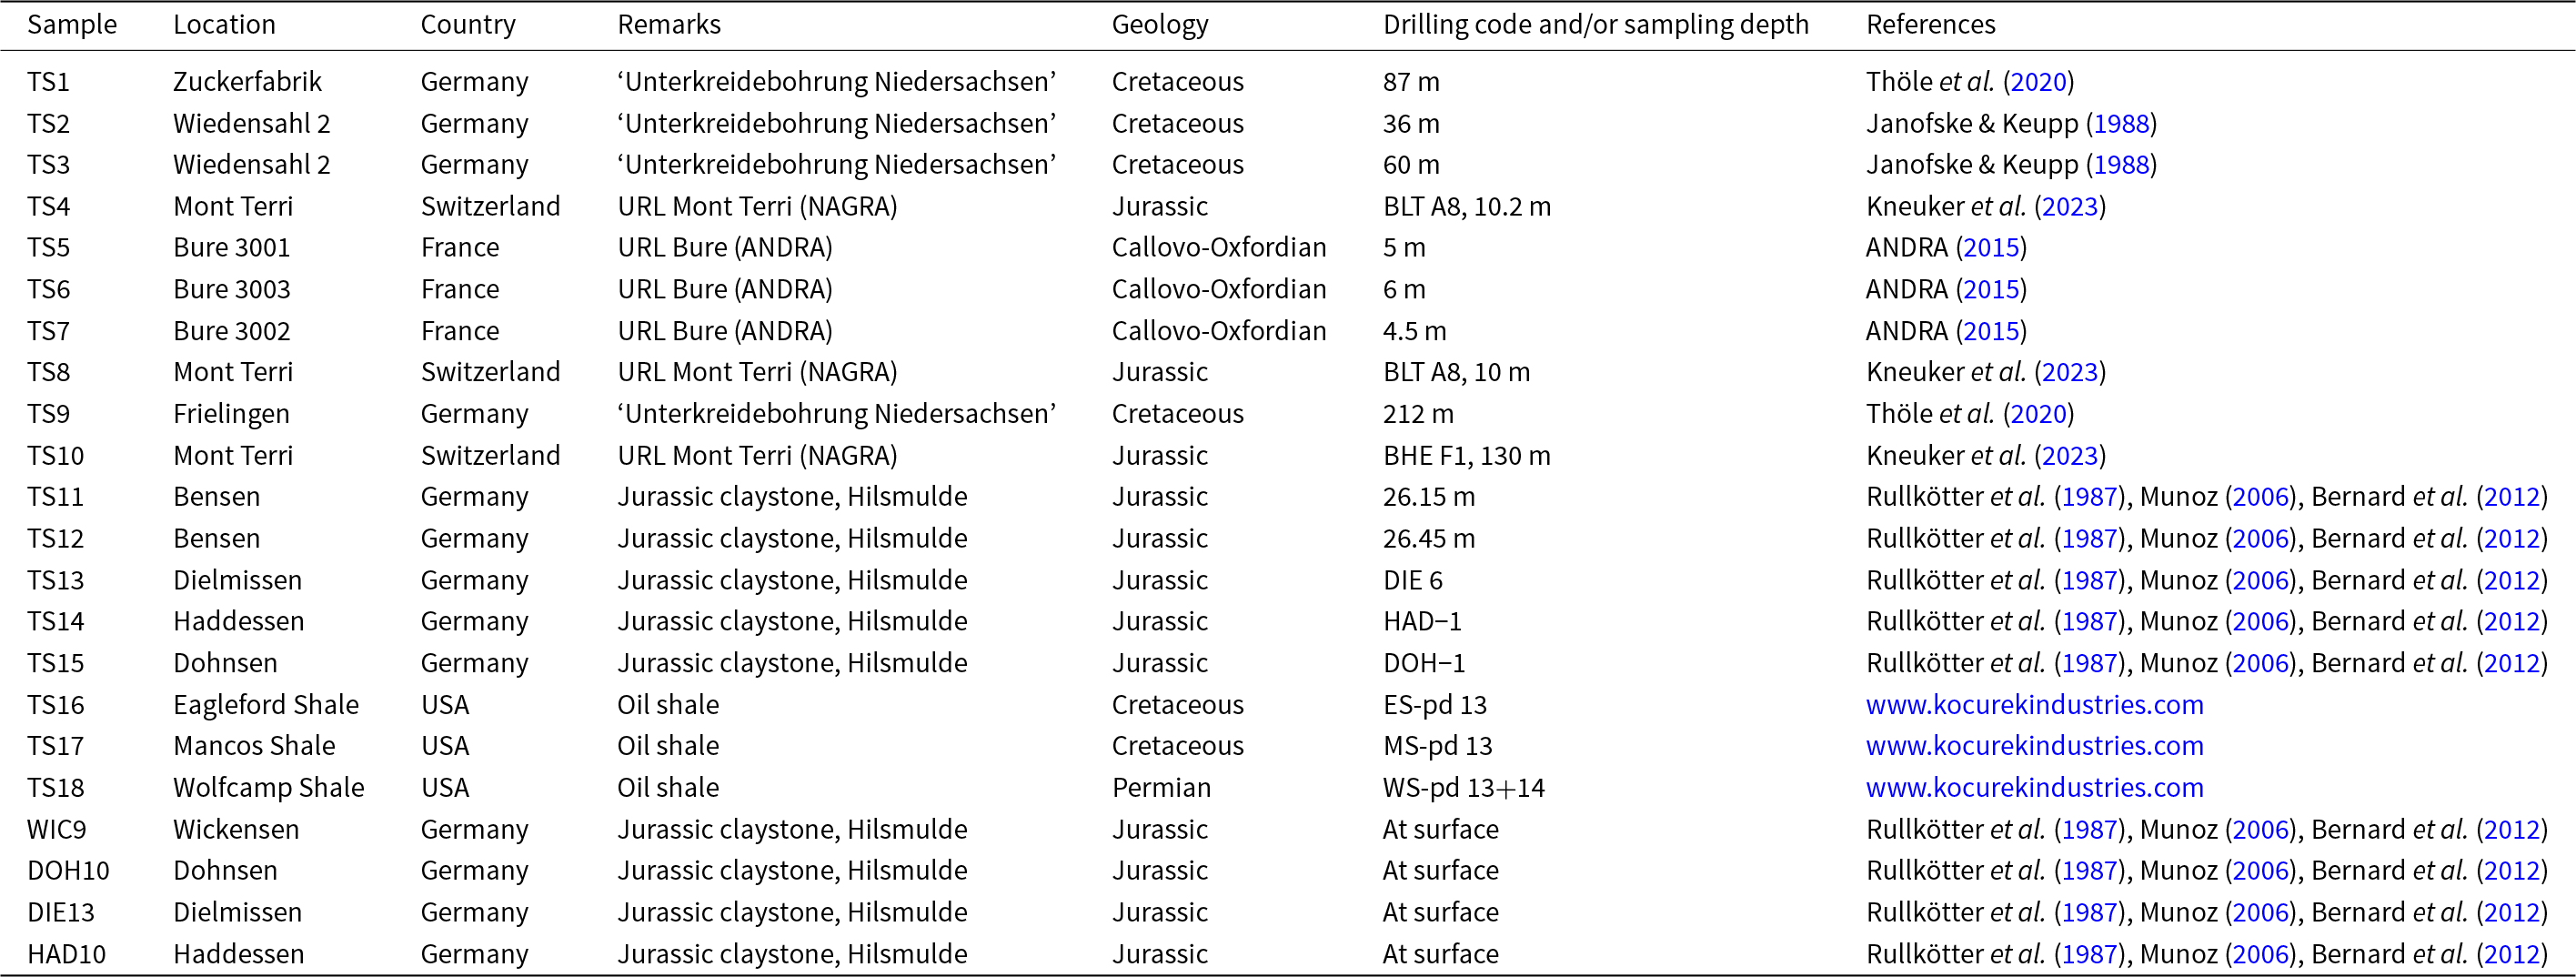
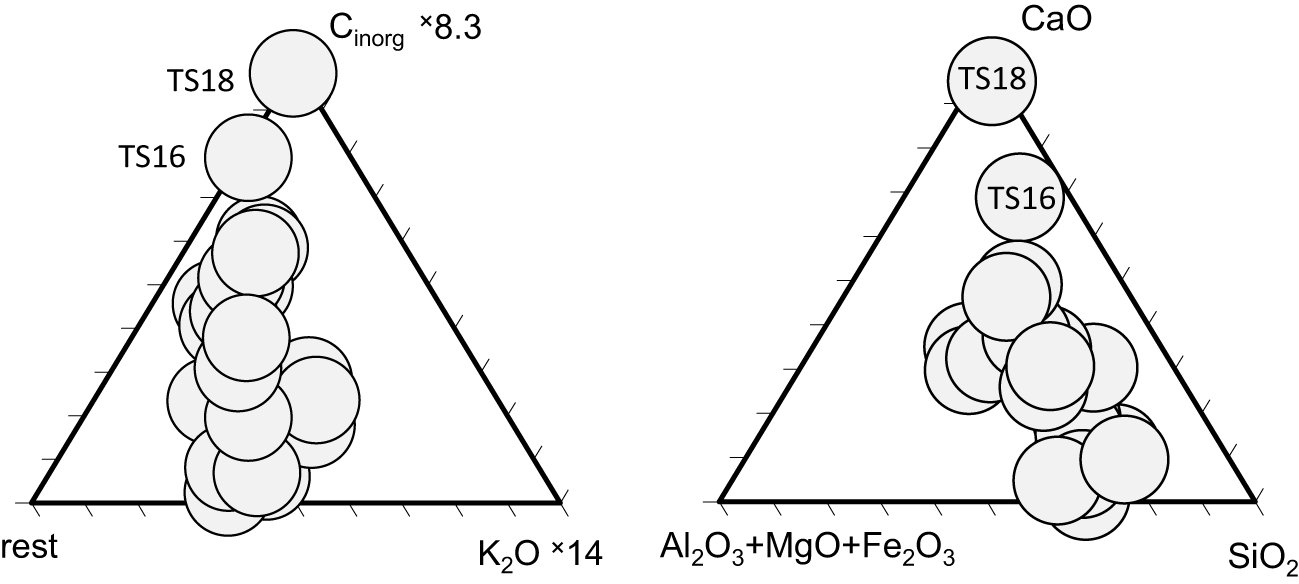
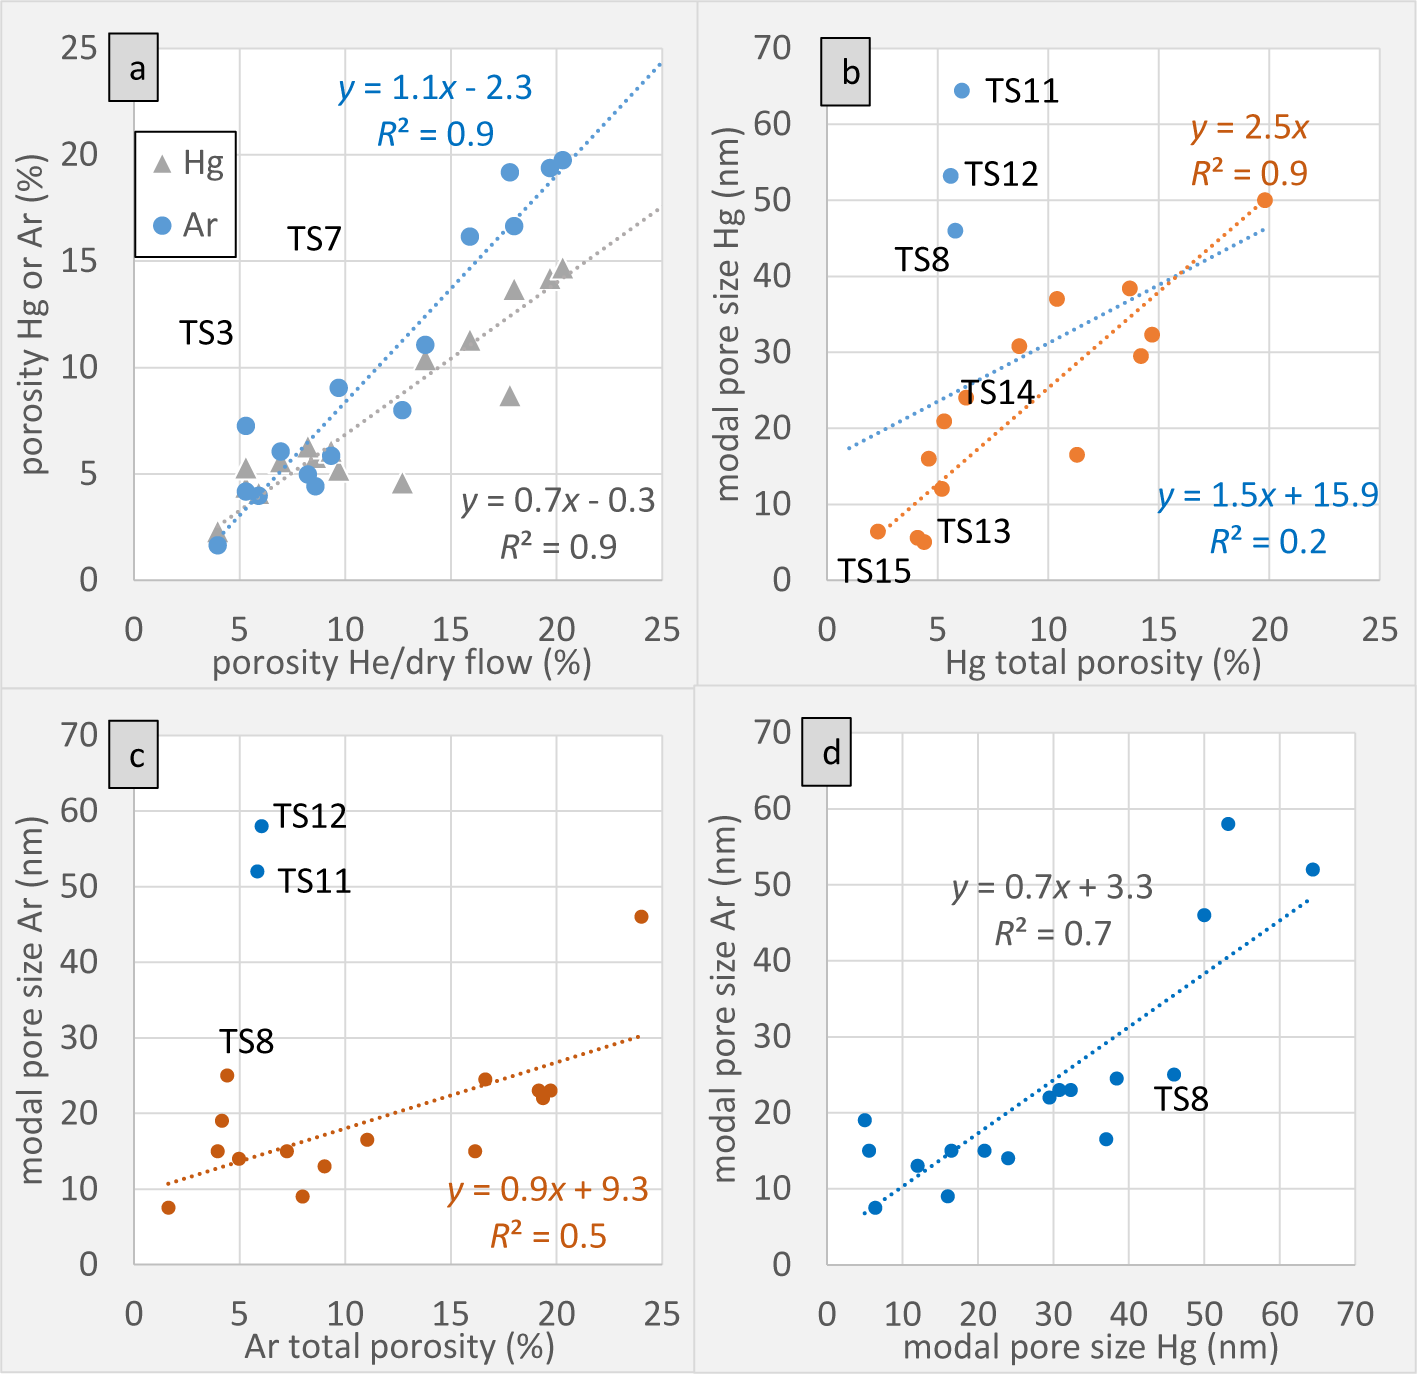
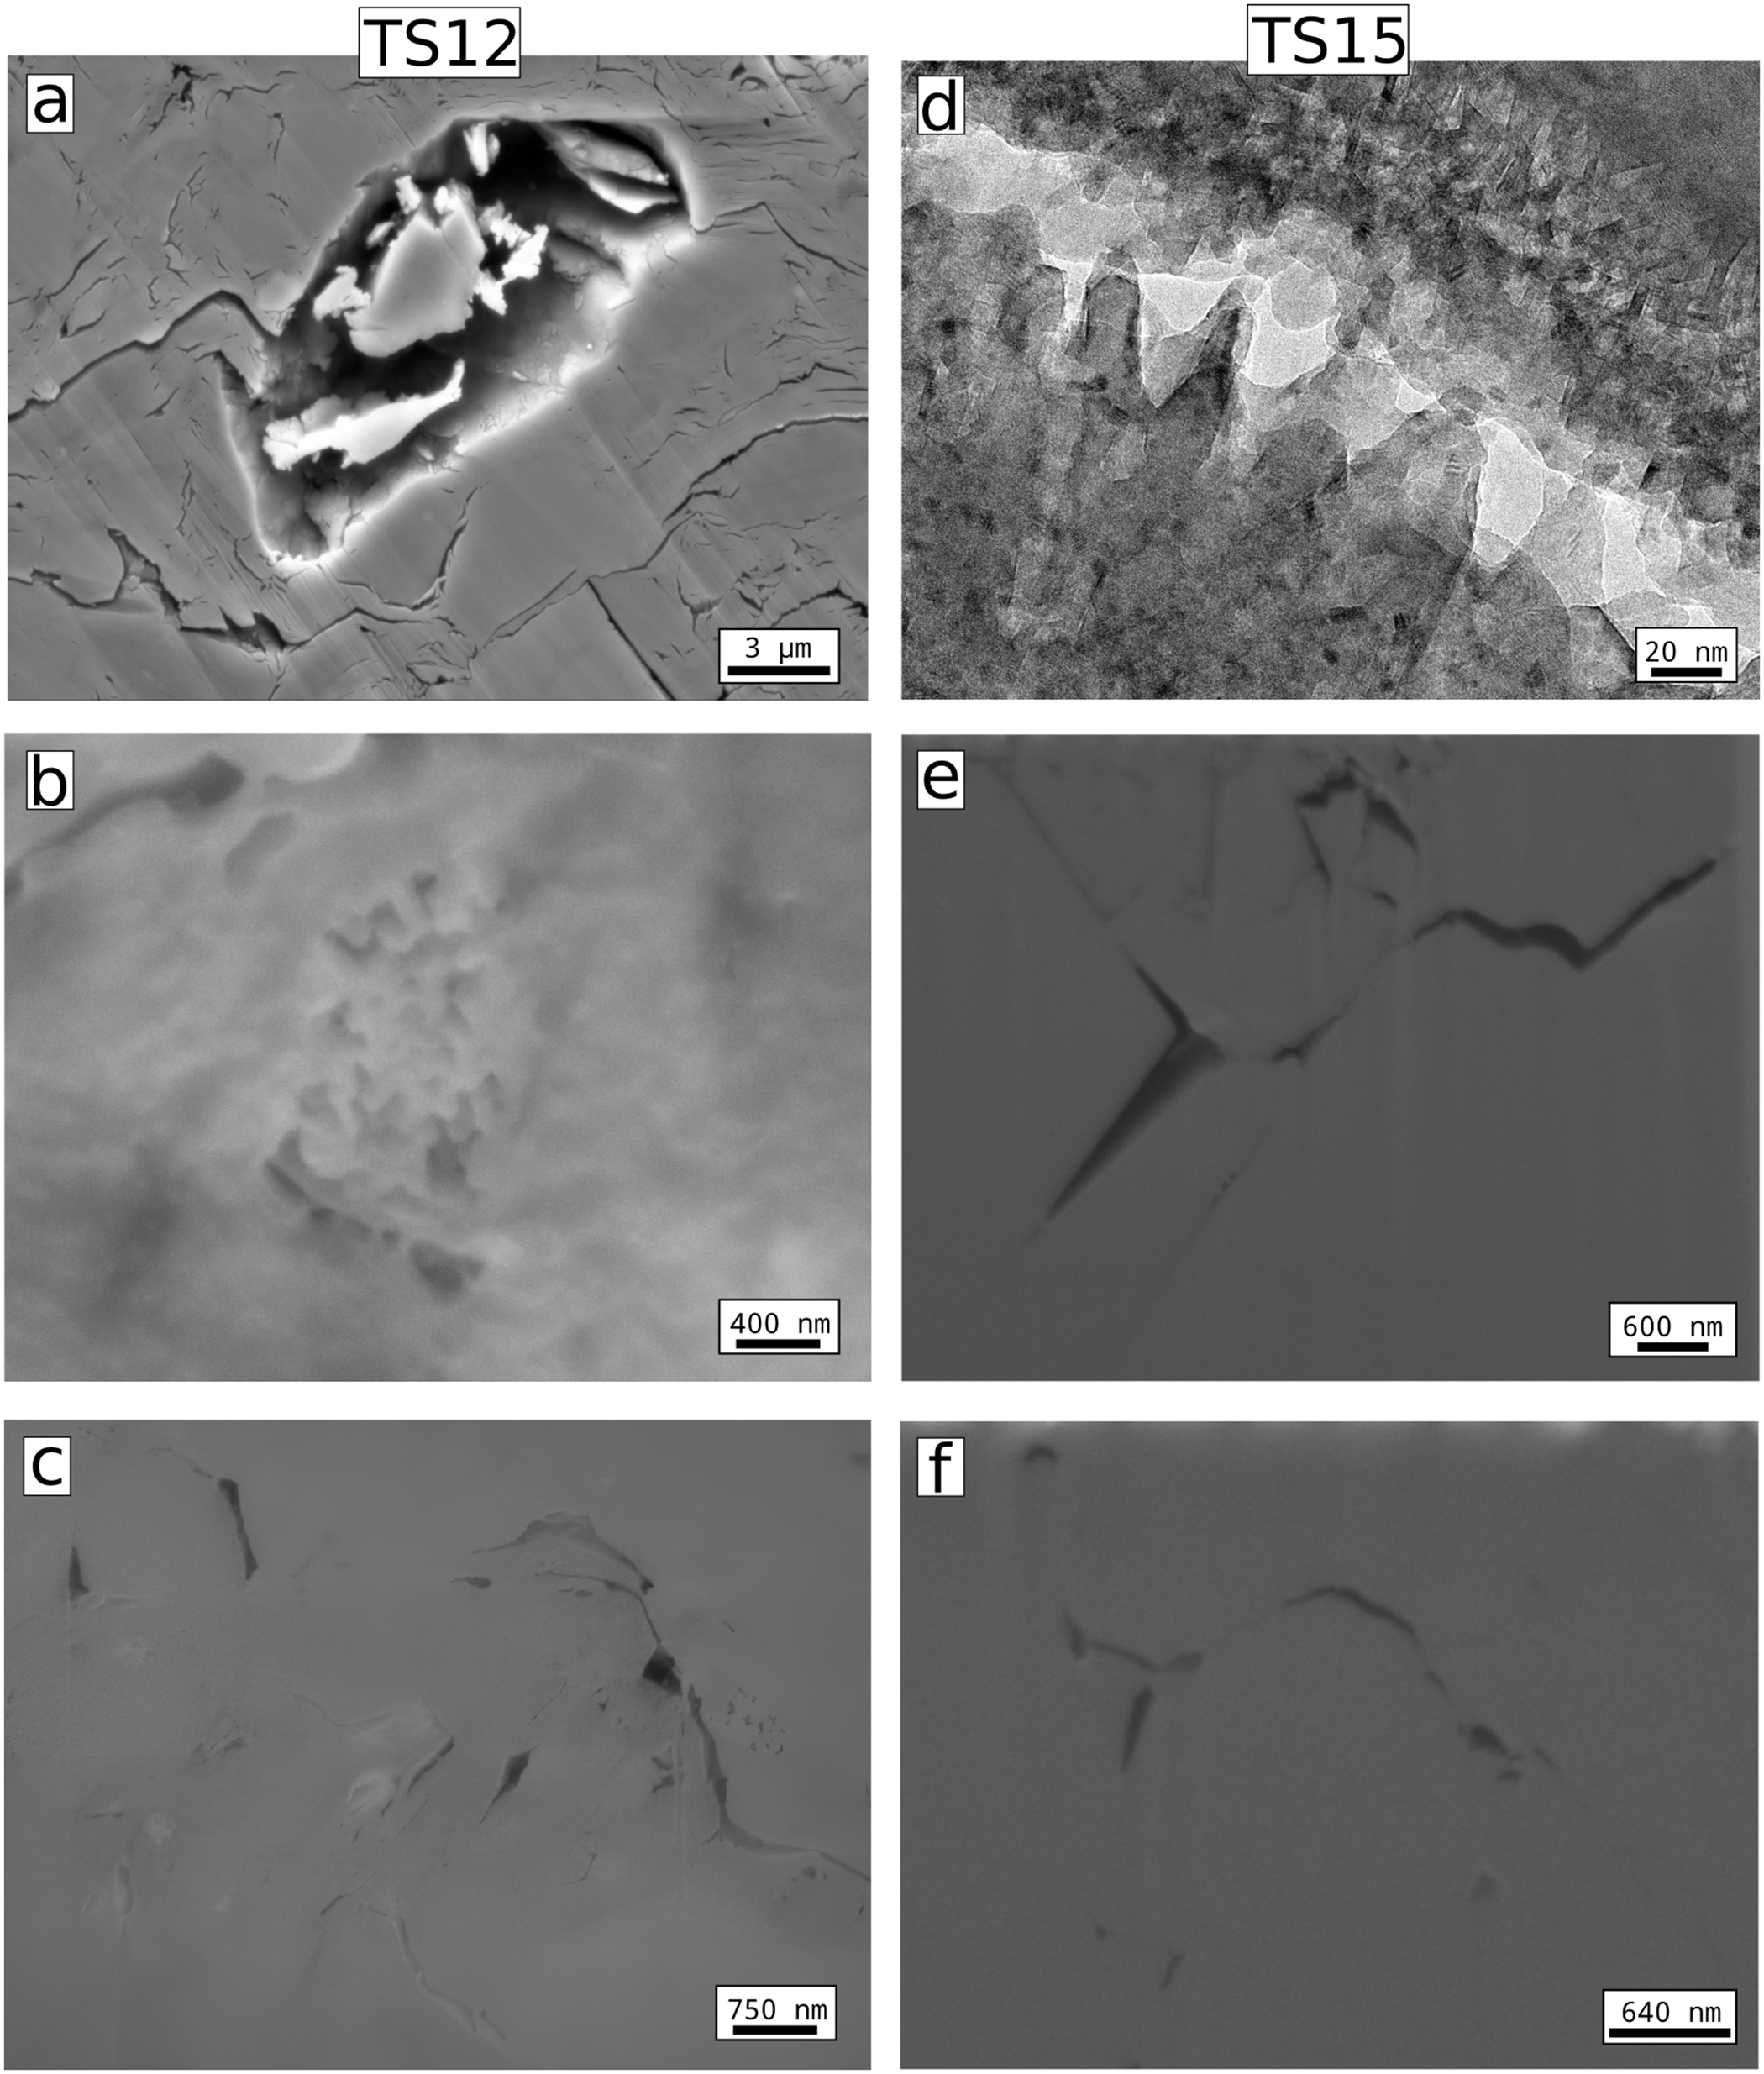
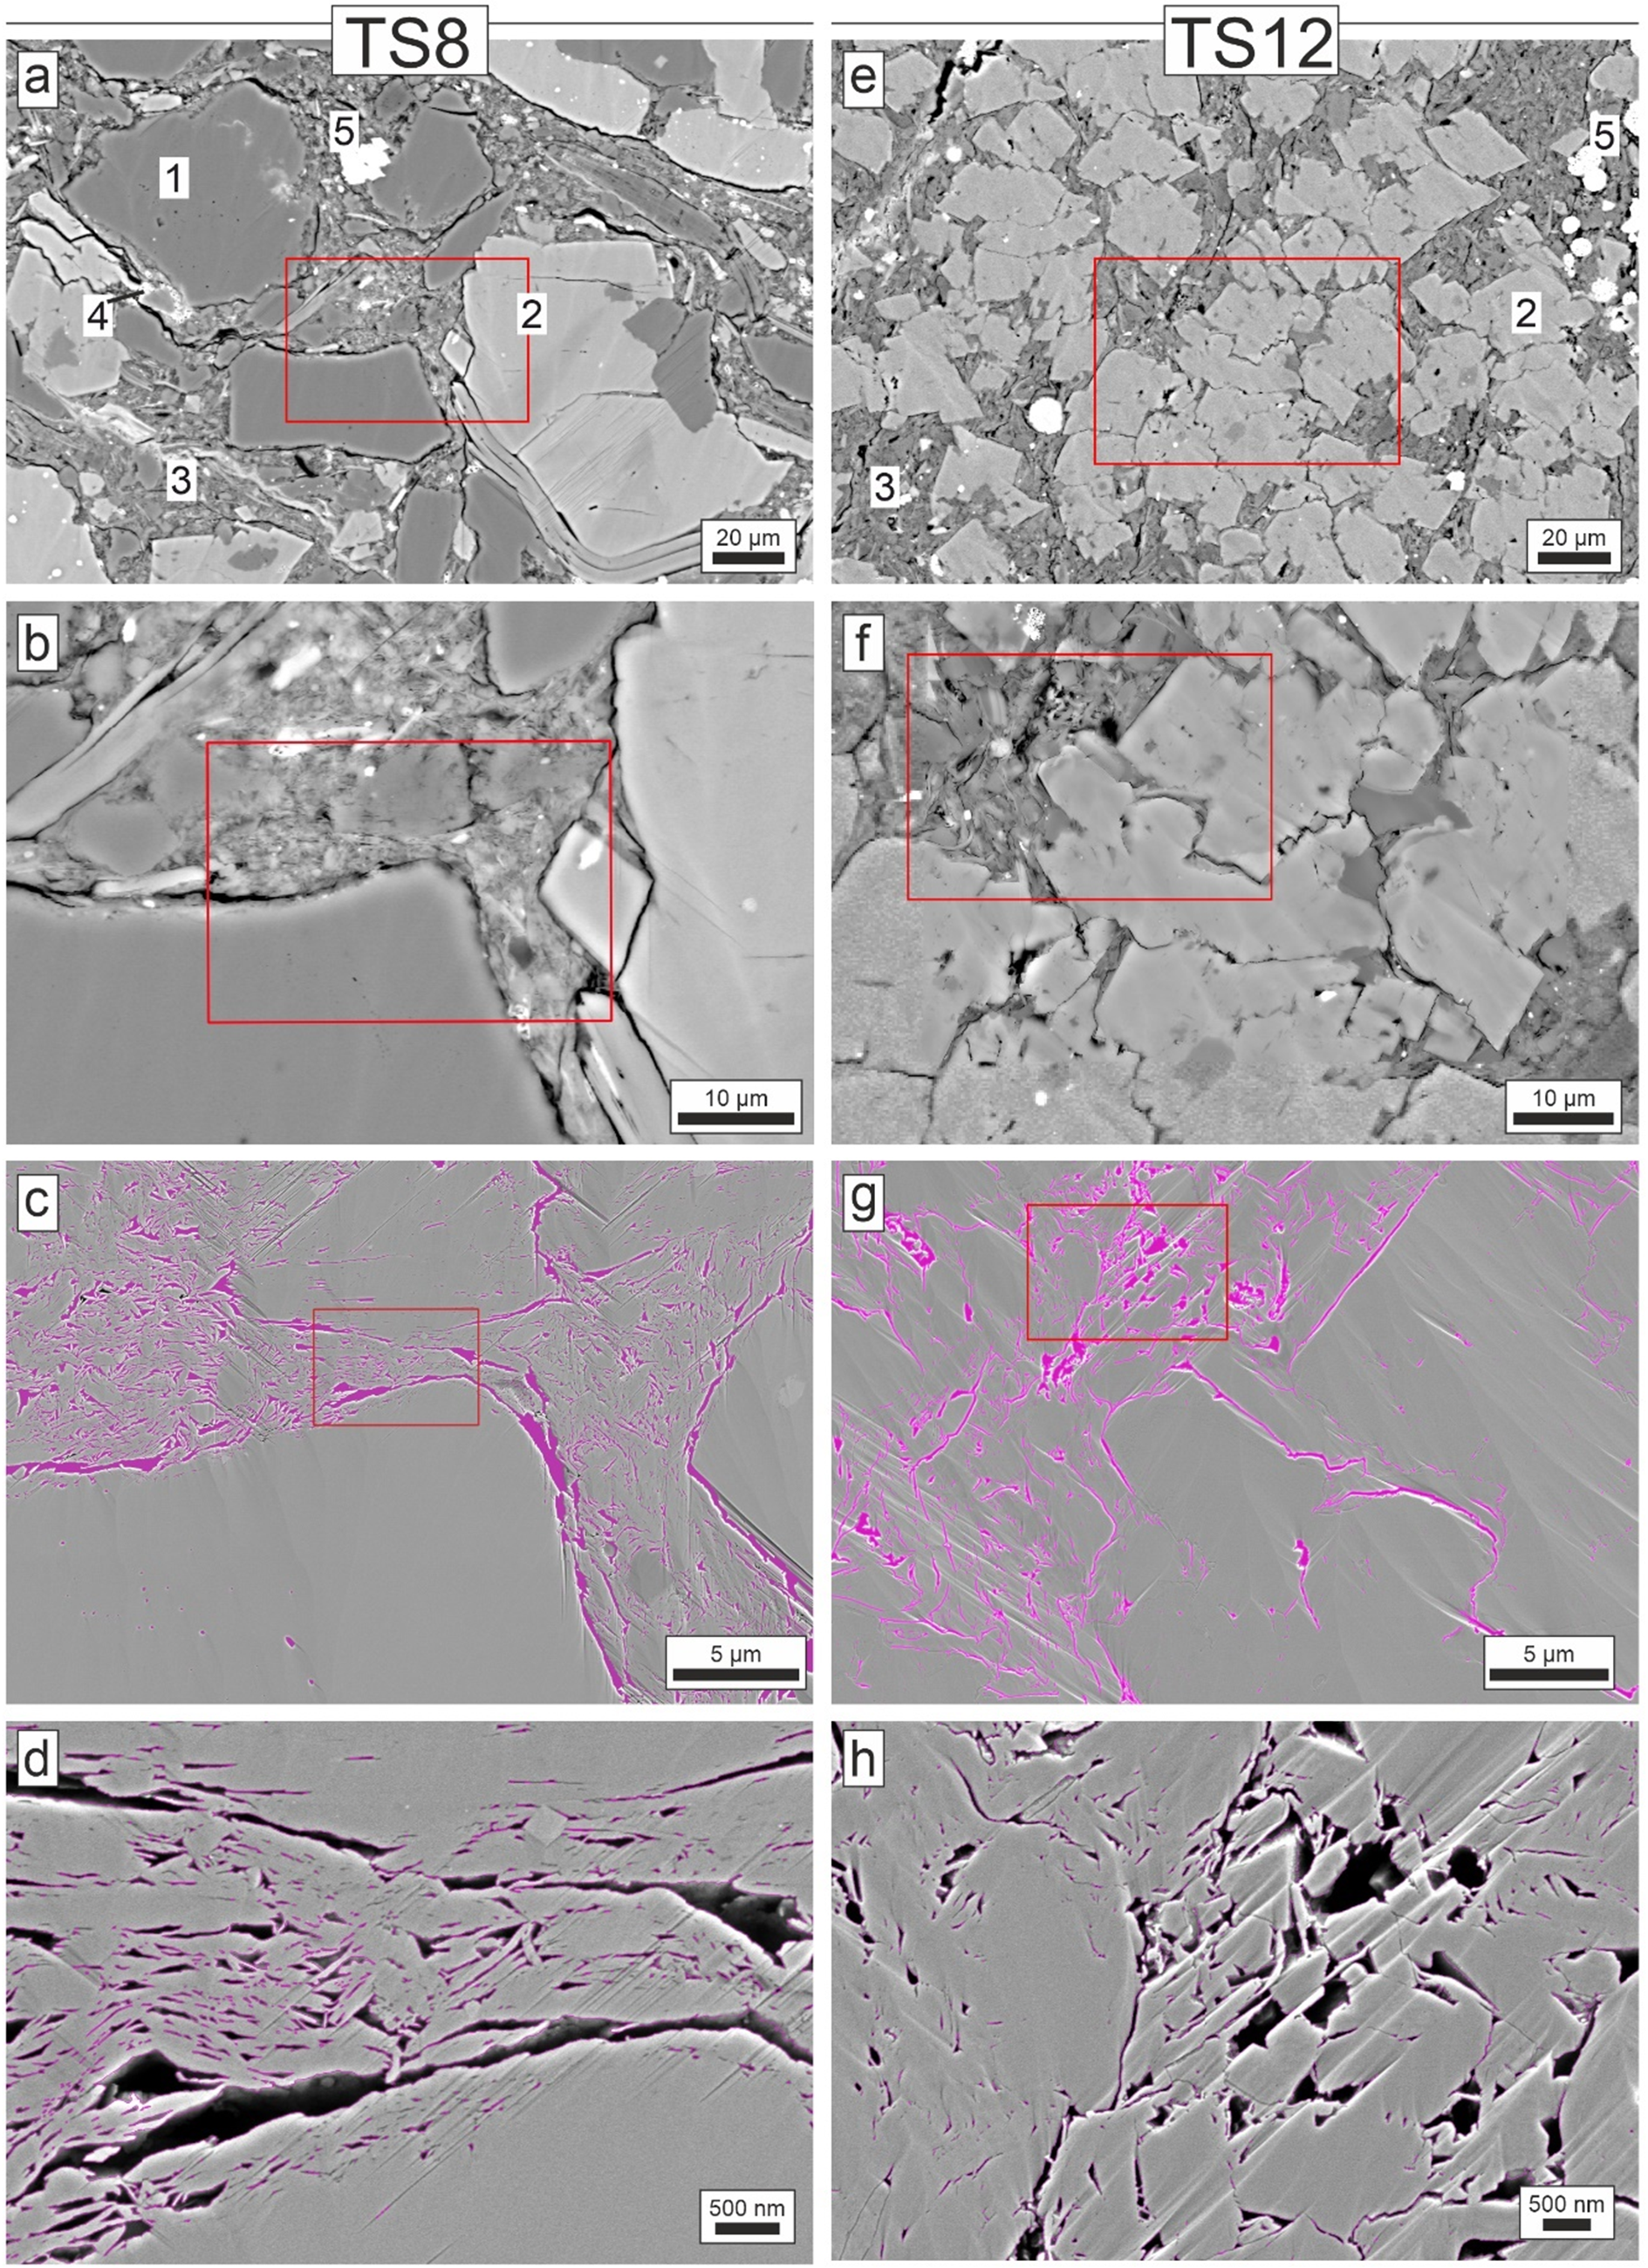
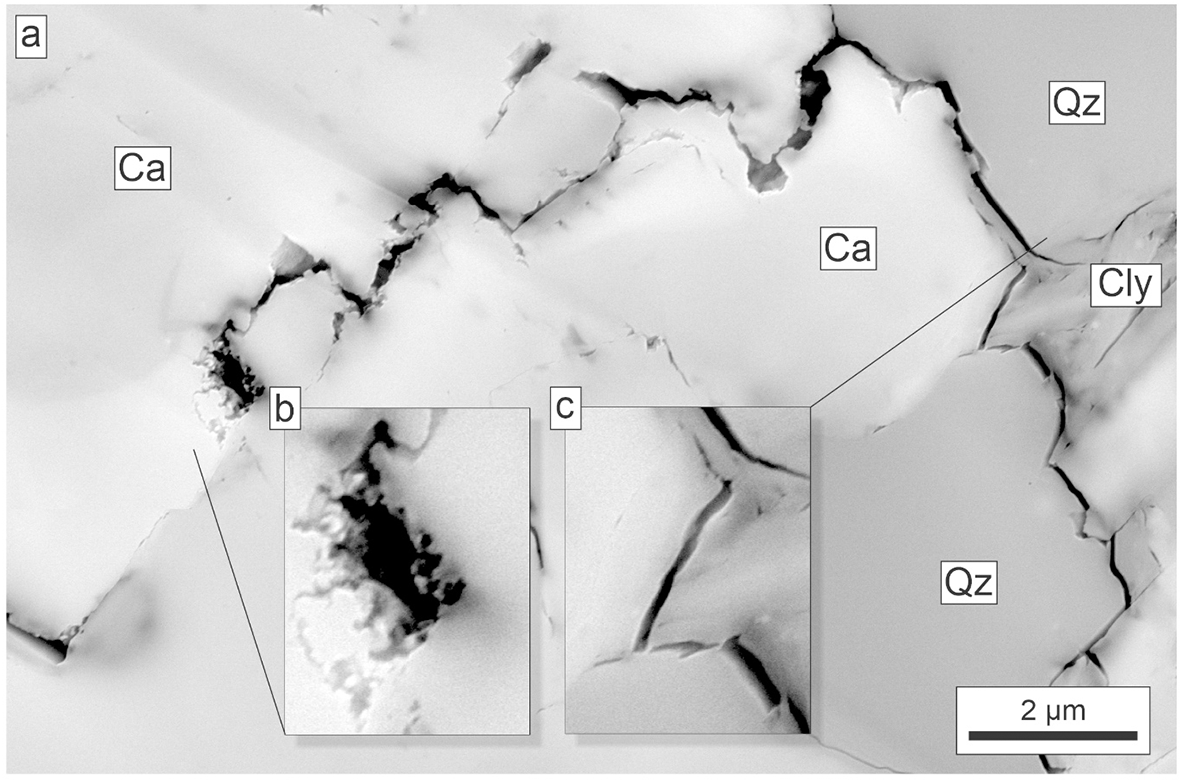
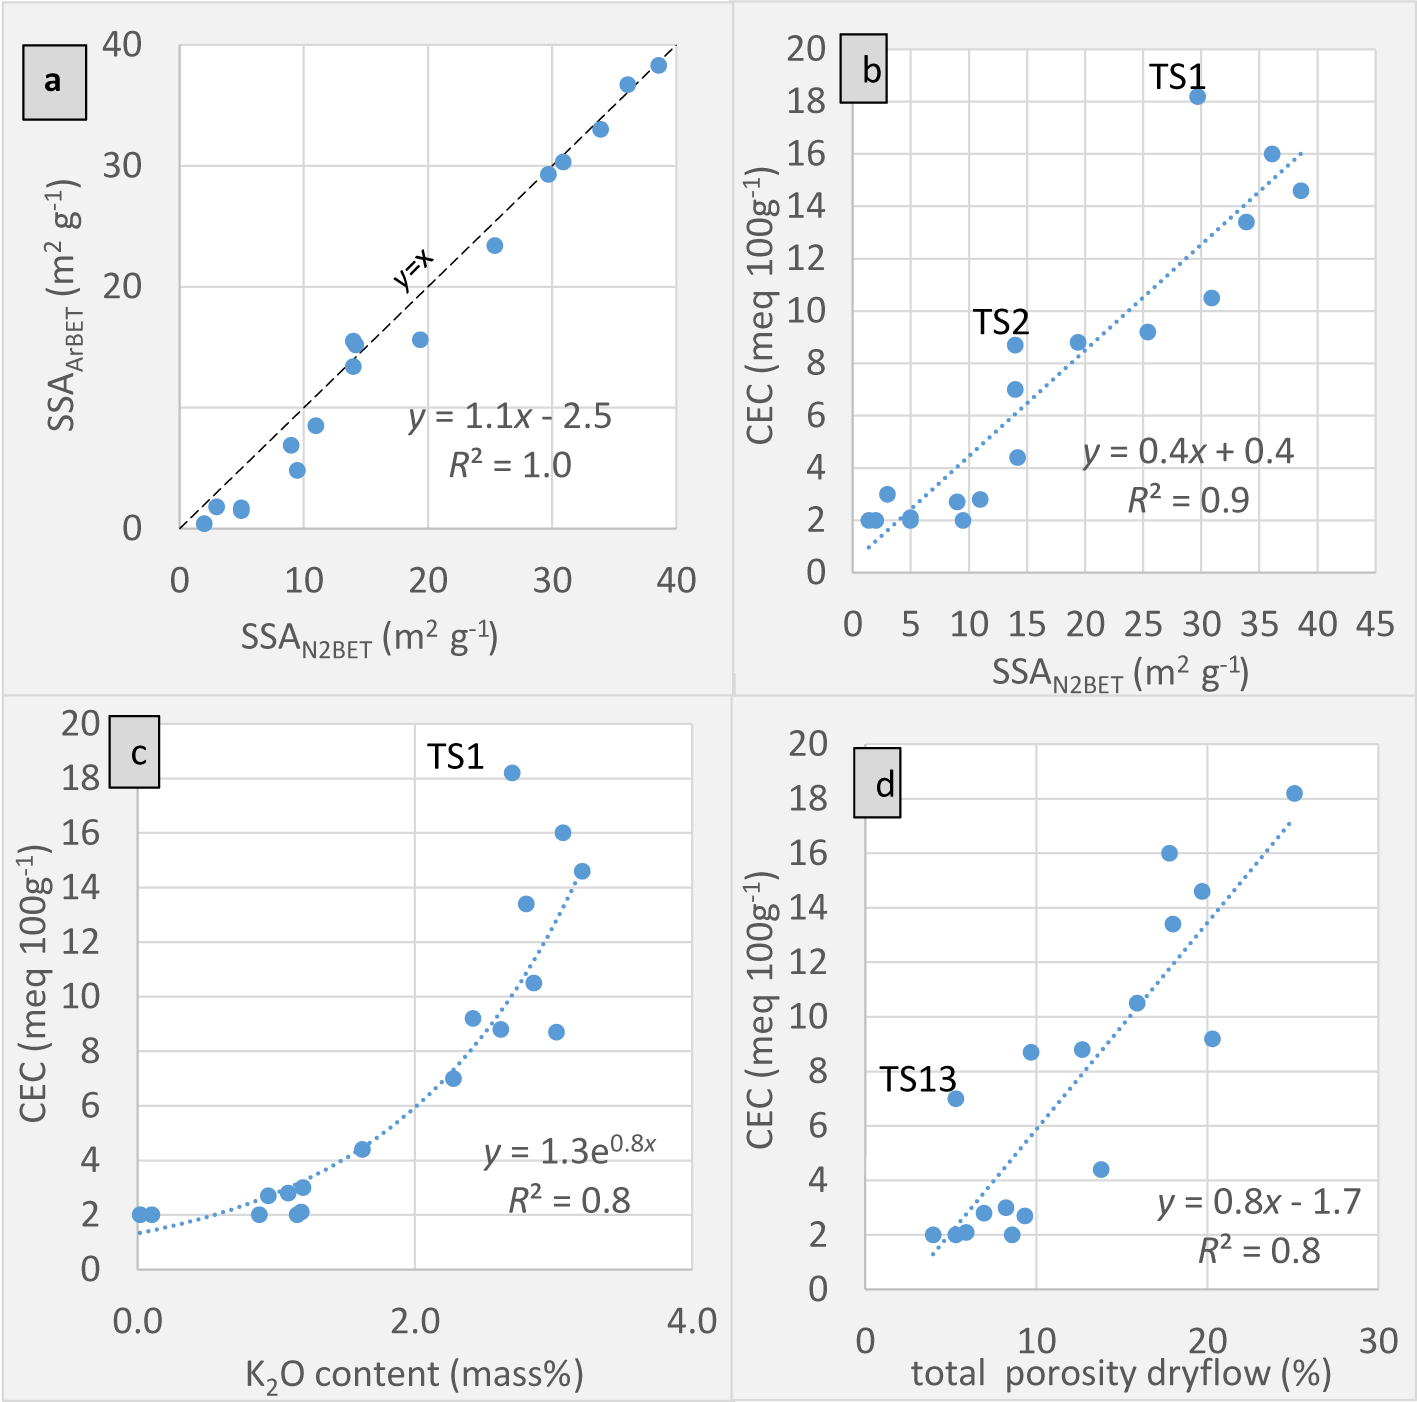
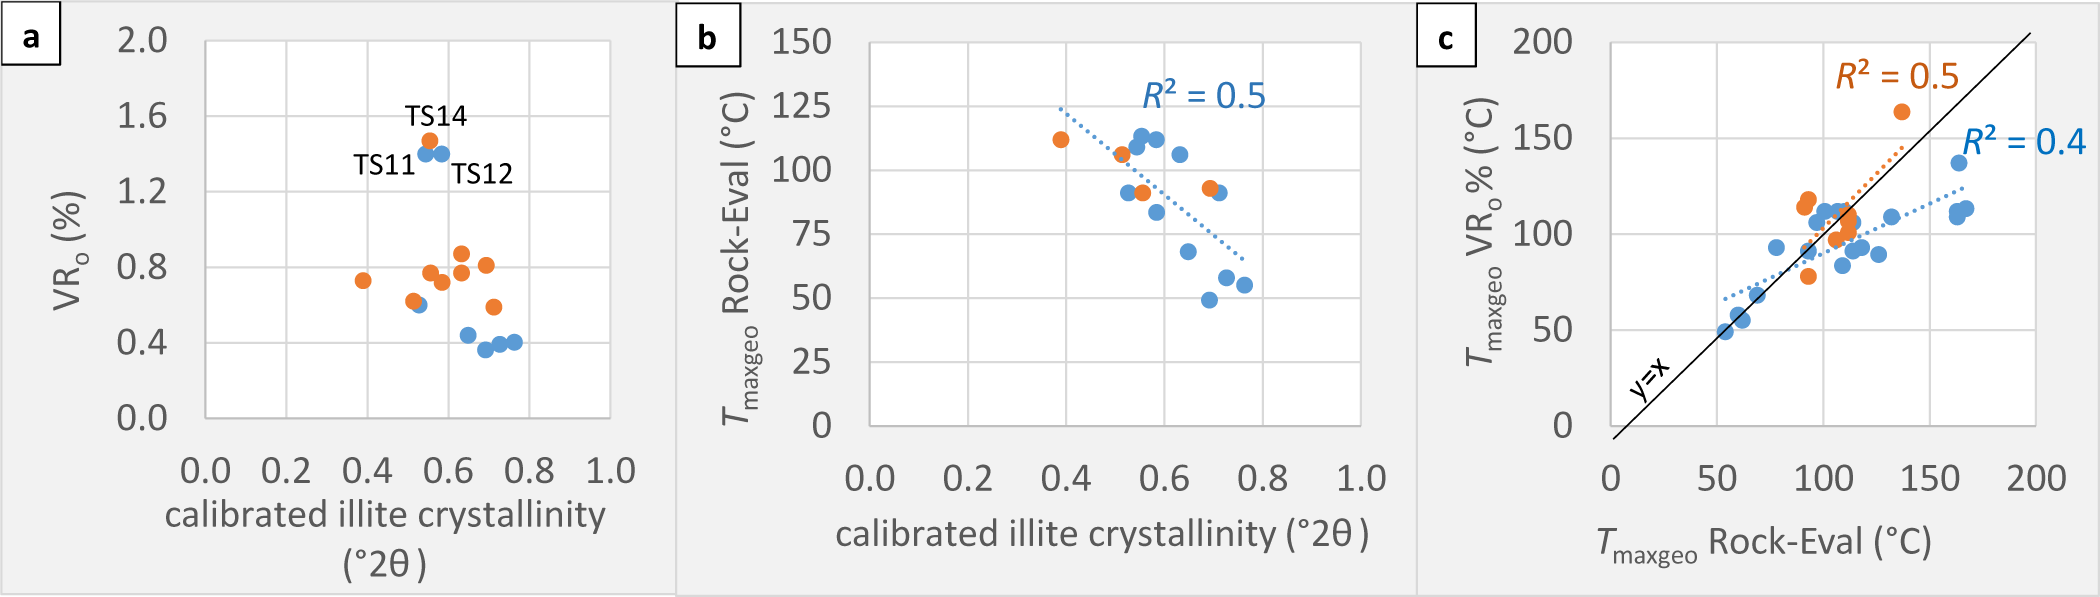
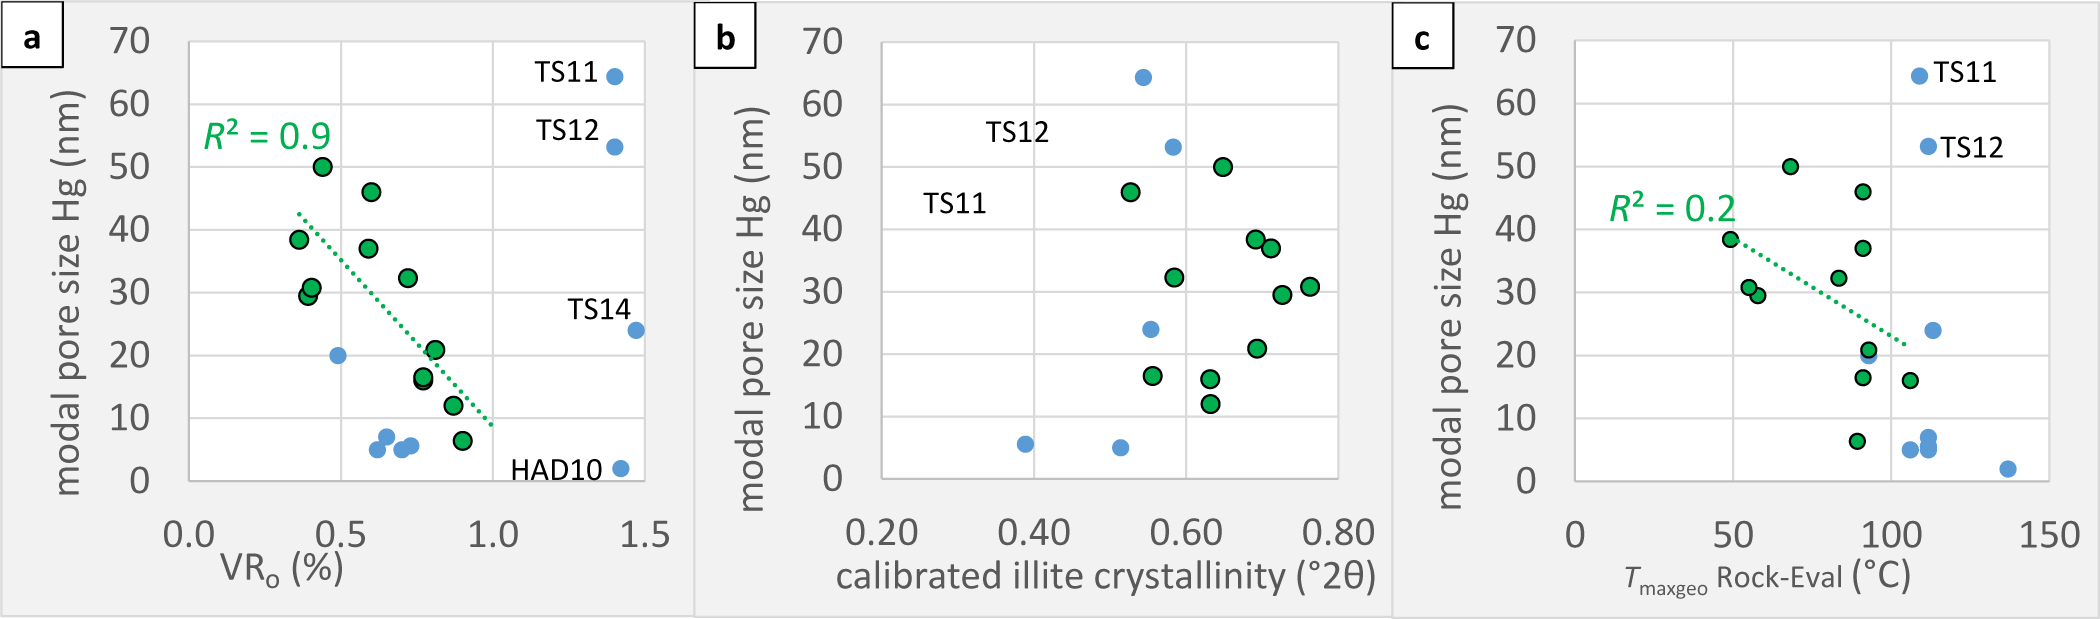
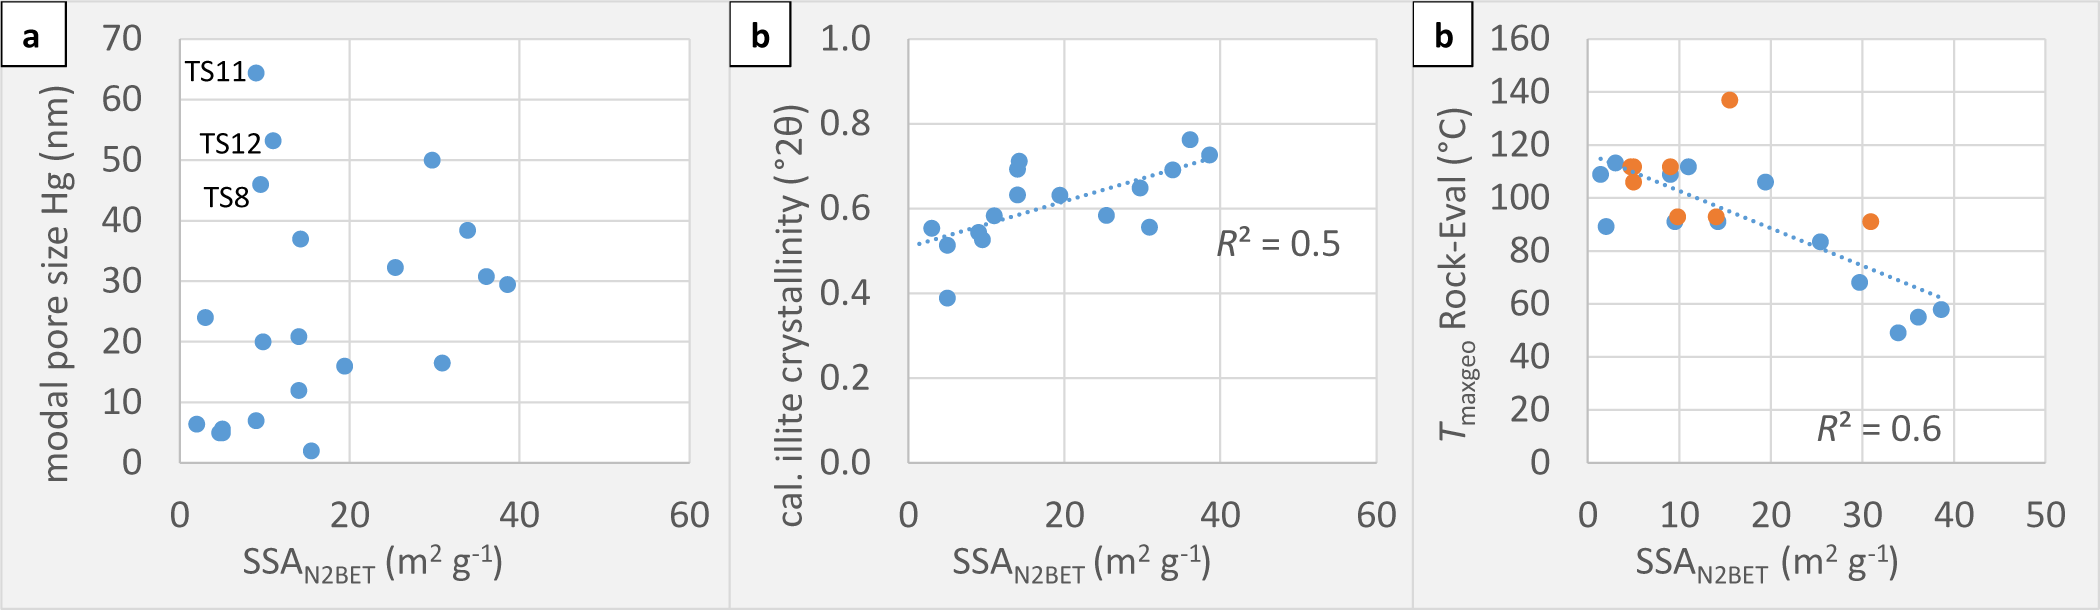
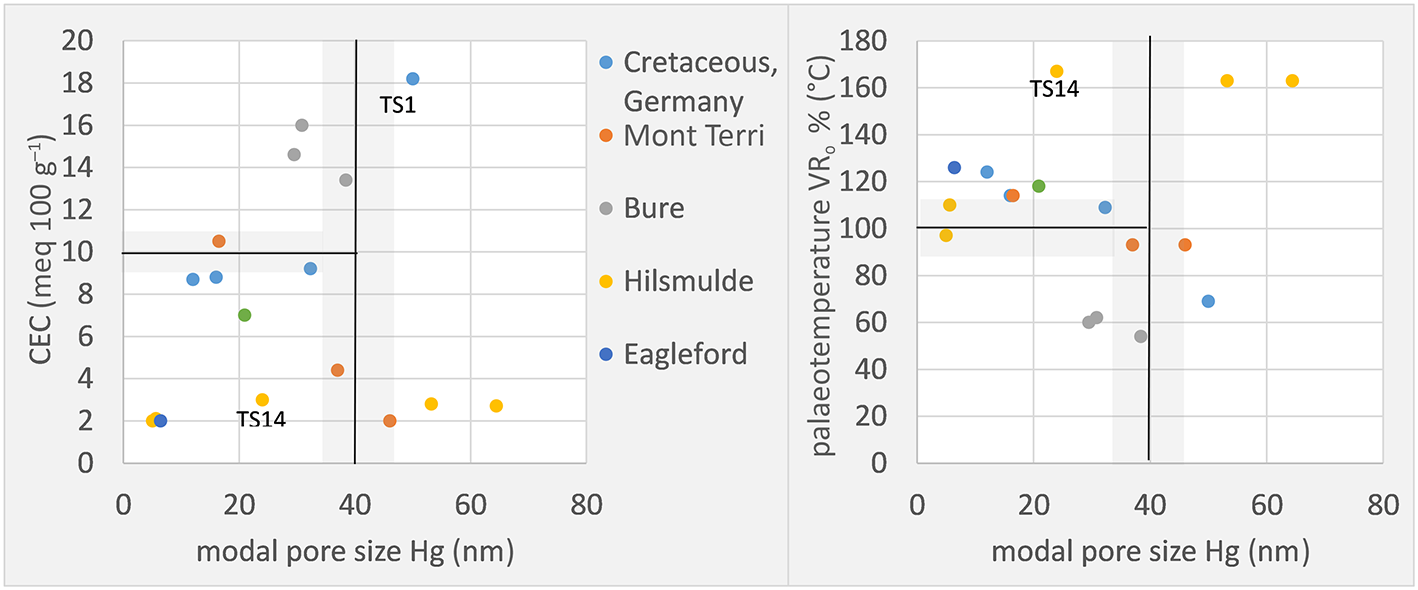


 Open access

