


1. Introduction
The Desert Andes (17.30–31°S) constitute a glacio-climatic region that stretches for ~1600 km in north-western Argentina and northern Chile (Lliboutry, Reference Lliboutry, Williams and Ferrigno1998, Fig. 1). The Andes at these latitudes are characterized by high elevations, with >260 summits over 5000 m above sea level (a.s.l.) and relatively low total annual precipitation values ranging between 0.1 and 0.5 m (Garreaud, Reference Garreaud2009; Viale and others, Reference Viale2019). The Desert Andes host a diverse cryosphere with large areas covered by seasonal snow, numerous small mountain glaciers and rock glaciers, and relatively few valley glaciers. In many cases, these larger glaciers have debris-covered ice tongues (Masiokas and others, Reference Masiokas2020). The most recent glacier inventories from this region (Chile and Argentina) identified over 4500 ice masses that cover ~410 km2 (Barcaza and others, Reference Barcaza2017; Zalazar and others, Reference Zalazar2020).
Glaciological mass-balance monitoring sites in the Dry Andes. ING, glaciers monitored in the Inventario Nacional de Glaciares program of Argentina.

Studies of recent glacier fluctuations have documented the persistent area loss of the glaciers of the Desert Andes in the last decades (Nicholson and others, Reference Nicholson2009; Rabatel and others, Reference Rabatel, Castelbrunet, Favier, Nicholson and Kinnard2011; Hess and others, Reference Hess, Schmidt, Nüsser, Zang and Dame2020). Together with longer-term studies conducted further south in the Central Andes (31–35°S, Fig. 1), the available evidence shows that the majority of the glaciers have retreated since their Little Age peak extent in the late 19th century and that the ice mass loss has accelerated in recent decades (Le Quesne and others, Reference Le Quesne, Acuña, Boninsegna, Rivera and Barichivich2009; Masiokas and others, Reference Masiokas2009; Espizua and Pitte, Reference Espizua and Pitte2009; Malmros and others, Reference Malmros, Mernild, Wilson, Yde and Fensholt2016; Farías-Barahona and others, Reference Farías-Barahona2020).
The Dry Andes have been severely affected by a recent extraordinary drought. The drought started in 2009 and was still ongoing in 2020 (Garreaud and others, Reference Garreaud2017). Although intense 1–2 year-long droughts are frequent in this region, the current decade-long event is the most persistent and severe since at least 1909 when hydrological measurements were initiated (Masiokas and others, Reference Masiokas, Villalba, Luckman, Le Quesne and Aravena2006, Reference Masiokas2019). Recent assessments have also shown substantial reduction in snow cover in the region, more rapid decline of the snowpack, an earlier termination of the snow season and a persistent warming anomaly of ~0.5–1.0°C over the past 30 years (Garreaud and others, Reference Garreaud2017, Reference Garreaud2019; Rivera and others, Reference Rivera, Bown, Napoleoni, Muñoz and Vuille2017a).
Seasonal glacier mass-balance measurements are crucial to analyze the relationship between glacier variations and climate, and allow the attribution of the observed glacier changes to specific accumulation or ablation processes (Ohmura, Reference Ohmura2006, Reference Ohmura2011). However, despite the great variety and number of ice masses located in the Desert Andes, so far only a handful of glaciers have been monitored in a regular and consistent basis using the glaciological method. A set of ice masses (Toro 1, Toro 2, Esperanza and Guanaco) are monitored since 2003 as part of the operation of major mining projects (Rabatel and others, Reference Rabatel, Castelbrunet, Favier, Nicholson and Kinnard2011), whereas Brown, Conconta Norte, Amarillo and Los Amarillos have been monitored since 2006 (WGMS, 2015). Isolated measurements are also available for Ortigas 1 and Estrecho glaciers (Favier and Nicholson, Reference Favier and Nicholson2008). In general, these ice masses show winter mass balances between 0.5 and 1.5 m w.e., summer mass balances between −0.5 and −3.0 m w.e. and −5 to −10 m w.e. cumulative values between 2003 and 2017. The annual mass balances were shown to be strongly dependent on winter mass balances, with summer mass balances playing a secondary role (Rabatel and others, Reference Rabatel, Castelbrunet, Favier, Nicholson and Kinnard2011; Kinnard and others, Reference Kinnard2020). Long-term, consistent in situ glaciological observations spanning more than two decades are critically missing for this region.
In 2010, Argentina's National Congress passed a glacier protection law (N°26.639) which designated IANIGLA-CONICET as the institution in charge of providing updated information on the country's glaciers through the creation of the National Glacier Inventory (Inventario Nacional de Glaciares, ING) as the official data repository. The first glacier inventory of Argentina was presented in 2018, identifying and classifying over 16 000 ice masses with a total area over 5700 km2 along the Andes (Zalazar and others, Reference Zalazar2020). Within the ING framework, a set of four reference glaciers located in different regions of the Andes were selected to initiate systematic glaciological mass-balance measurements: Agua Negra in the Desert Andes, Azufre in the Central Andes, Alerce in the North-Patagonia Andes (35–45.5°S) and Glaciar de los Tres in the South-Patagonia Andes (45.5–55.5°S).
The aim of this paper is to present the mass balance changes of the Agua Negra glacier using in situ measurements and satellite data. First, we show the longer-term areal and length changes of this glacier since 1959. Then, we assess the seasonal and annual glaciological measurements collected at this site for the period 2014–2021. We also compare these data with geodetic mass balances from three different remote-sensing sources: a site-specific SRTMX-Pléiades dataset derived for this study, and two regional scale datasets derived from ASTER images (ASTERIX; Dussaillant and others, Reference Dussaillant2019) and Synthetic Aperture Radar data (SAR; Braun and others, Reference Braun2019). Given its extensive spatial coverage, we also use the ASTER and SAR data to put the measurements from Agua Negra in the context of the larger Jáchal river basin. Finally, we compile and briefly assess the recent climatic variations in this region to discuss some of the possible drivers for the observed glacier mass loss.
1.1 Study area
The Agua Negra glacier is located in the extensive Jáchal river basin (Fig. 2a). This basin is ~25 500 km2 and spans over 365 km along the southeastern part of the Desert Andes. The Cuesta del Viento hydroelectric dam (1530 m a.s.l.) is fed by the Jáchal river, which has a mean annual streamflow of 14 m3 s−1. The upper Jáchal river basin is mountainous with steep slopes, thick talus, glacial valleys and several inactive volcanoes that reach over 6000 m a.s.l. Mean annual temperatures at 4750 m a.s.l. are −4.5°C, reaching 2°C in January and −10°C in June. The total annual precipitation in the basin ranges between 100 and 300 mm, falling mostly as snow between March and October (Viale and others, Reference Viale2019). One of the main inter-annual precipitation modulators in the region is the El Niño-Southern Oscillation (ENSO). Over-average accumulation is usually associated with warm El Niño events in the Tropical Pacific Ocean, whereas drier conditions tend to occur associated with cold La Niña events (Masiokas and others, Reference Masiokas, Villalba, Luckman, Le Quesne and Aravena2006, Reference Masiokas, Villalba, Luckman and Mauget2010). At the front of the Agua Negra glacier, the Capayán meteorological station (4750 m a.s.l., Fig. 2b) reports a mean annual relative humidity of ~30%, and global radiation values of ~430 W m2 d−1.
Study area. (a) Map of the Jáchal river basin showing different ice masses and the location of the Agua Negra basin (red outline). (b) Map of Agua Negra (AN) glacier. The position of the ablation stakes and the local automatic weather station Capayán are also shown. Background image: Pléiades 16 March 2019 (©CNES 2019, distribution Airbus D&S).

Agua Negra is a small (1.0 km2 in 2013) southeast-facing mountain glacier with a 500 m elevation range (4750–5250 m a.s.l.), a well-defined catchment area, and no contact with nearby glaciers (Fig. 2b). The debris cover of this glacier is low (<5%) and limited to a thin layer of fine sediments in the ablation zone, and some blocks that fall from the steep northern slopes. For most of the year, the glacier surface is completely covered with ice and snow penitentes, which can reach 3–5 m in summer but are usually snow-covered in winter. Some extensional crevasses are present in the upper reaches of the glacier (Fig. 2b). The valley has a well-preserved terminal moraine, which includes a section of 0.13 km2 of debris-covered and stagnant ice. The proglacial drainage is discontinuous and the water infiltrates rapidly in the sediments in front of the glacier. The debris-covered ice terminates at ~4650 m a.s.l., where the stream emerges from an ice cave.
2. Data and methods
2.1 Glacier area and length changes
We used remote-sensing data to measure Agua Negra areal and frontal changes for the 1959–2019 period. The information available included aerial photos and medium to high spatial resolution satellite imagery (Table 1). The aerial photos were obtained from the San Juan Province Government. Landsat images were obtained from the US Geological Survey Earth Resources Observation and Science (USGS-EROS), whereas the ALOS image was provided by Comisión Nacional de Actividades Espaciales (CONAE). The Pléiades images were provided by the Pléiades Glacier Observatory (PGO, Berthier and others, Reference Berthier2014). The satellite images were preprocessed (geocoded and orthorectified) by the distribution centers and the aerial photos were georeferenced in QGIS. The area and length along the main flowline of Agua Negra glacier were calculated in QGIS using the UTM 19S (WGS 84) projection.
Remote-sensing data used to study the recent changes of Agua Negra glacier

2.2 Glaciological mass balance
A monitoring program was initiated on Agua Negra glacier in spring 2014 to measure accumulation and ablation with the glaciological method (Cogley and others, Reference Cogley2011). The accumulation was measured by snow probing using skis in spring, sampling a range of 20–160 points in the accessible parts of the glacier. The snow density was also measured in spring, in snow pits and snow density was sampled vertically with a 500 cm3 steel corer and integrated throughout the vertical profile. The snow temperatures were measured in the pits every 0.50 m. The snow depth measured by probing was converted to water equivalent (w.e.) using the mean density measured in the pits. The ablation was measured in autumn with a network of 2–7 stakes distributed every 50 m of elevation along the main flowline of the glacier (Fig. 2b). The stakes were installed in spring, with the maximum amount of seasonal snow, and subsequently measured in autumn, at the end of the ablation season. Point measurements of accumulation and ablation were interpolated manually with 0.50 m w.e. contour lines, which were also extrapolated to the non-surveyed areas of the glacier (Østrem and Brugman, Reference Østrem and Brugman1991). The mass balances were calculated for the reference-surface derived from the 04 April 2013 Pléiades image and DEM. Seasonal mass balances were reported using the floating-date time system (Cogley and others, Reference Cogley2011), and the uncertainty in the stake and probing measurements was estimated to be ± 0.10 m w.e. The uncertainties due to the extrapolation of point to area values were estimated to be ± 0.50 m w.e., leading to an estimated Root Mean Square Error (RMSE) of 0.50 m w.e.
In the study area, the ablation measurements with stakes are complicated by the presence of penitentes on the glacier surface. Penitentes are snow and ice blades mainly formed by sublimation, a process that is very common in the region throughout the ablation season when low humidity, low temperatures and high solar radiation prevail at high elevations (Lliboutry, Reference Lliboutry1954; Naruse and Leiva, Reference Naruse and Leiva1997; Corripio and Purves, Reference Corripio, Purves, de Jong, Collins and Ranzi2005; Nicholson and others, Reference Nicholson, Pętlicki, Partan and MacDonell2016). Some authors proposed that making a series of extra field measurements can account for the variable geometry of the penitentes and provide a more robust stake reading (Rabatel and others, Reference Rabatel, Castelbrunet, Favier, Nicholson and Kinnard2011; Rivera and others, Reference Rivera, Bown, Napoleoni, Muñoz and Vuille2017a, Reference Rivera, Penalba, Villalba and Araneo2017b). In our work, we considered that approach to be impractical due to the severe weather and physical conditions faced by professionals in the field. Instead, we used the base of the penitentes as a reference surface for adjusting the stake measurements. The technique is simple and was combined with a similar approach for the winter snow probing, where the maximum snow depth was recorded (here it is assumed that the probing also reaches the base of the penitentes below the snow surface).
At Agua Negra the Equilibrium Line Altitude (ELA) could not be observed from the end-of-summer snowline because it was usually obscured by the presence of penitentes. Instead, the ELA was calculated from mass-balance gradients derived from the ablation stakes.
2.3 Geodetic mass balance
To assess the glacier surface elevation changes, we used the outlines of ING and two independent elevation change datasets. The ING contains the outlines of different types of ice masses classified as glaciers, perennial snowfields, debris-covered ice and rock glaciers. In the Jáchal basin, the ING was based on satellite images from 2009 and 2010 (Zalazar and others, Reference Zalazar2020). We manually adjusted the clean-ice units of this inventory to satellite images of the year 2000 (Table 1) and used the mean of the start and end area of the surveyed period for the volume change calculation of each ice mass. This adjustment matches the glacier outlines with the earliest elevation dataset (SRTM) used in our study. Then, we differenced two digital elevation models (DEM) derived from Pléiades (PLE) stereo-images (Gleyzes and others, Reference Gleyzes, Perret and Kubik2012) acquired in 16 March 2019 and 04 April 2013. We also differenced the 2013 Pléiades DEM with the SRTM, X-band DEM (Farr and others, Reference Farr2007), acquired in 20 February 2000 (hereafter SRTMX). The Pléiades DEMs were generated with NASA Ames Stereo Pipeline (Shean and others, Reference Shean2016; NASA, 2017) and adjusted with near synchronous differential GNSS ground control points. The processing included an automatic DEM extraction, smoothing and ortho-image generation (Berthier and others, Reference Berthier2014; Ruiz and others, Reference Ruiz, Berthier, Masiokas, Pitte and Villalba2015). The SRTMX was processed by the Deutsches Zentrum für Luft und Raumfahrt (DLR) and is a product with 1 arc second spatial resolution (~30 m) and 1° × 1° tiles. This DEM has a reported 20 m horizontal accuracy and 16 m vertical accuracy (DLR, 2018).
The PLE 2013 DEM was resampled to 30 m and co-registered to the SRTMX prior to the calculation of the elevation differences. The outliers were filtered with a 3 NMAD, 50 m altitude band filter and the remaining data were corrected for curvature effect (Gardelle and others, Reference Gardelle, Berthier and Arnaud2012; Ruiz and others, Reference Ruiz, Berthier, Viale, Pitte and Masiokas2017). The 50 m band values of the differenced DEMs were averaged and a glacier-wide density of 850 ± 60 kg m−3 was applied for the volume to mass conversion (Huss, Reference Huss2013). The spatial overlap of the SRTMX and PLE 2013–PLE 2019 DEMs also includes nine other ice masses located around Agua Negra: three glaciers (two with debris-covered sections), two snowfields and four rock glaciers (Fig. 2c). The mass changes of these nine ice masses were also computed. The elevation change error in the SRTMX-PLE dataset was calculated considering the rate of elevation changes over stable terrain (without glacier cover and slopes <30°). Missing data per 50 m elevation band and volume to mass conversion were also considered in this calculation (Berthier and others, Reference Berthier2014; Dussaillant and others, Reference Dussaillant2019; McNabb and others, Reference McNabb, Nuth, Kääb and Girod2019). Previous work has shown that the SRTMX signal can penetrate the glacier surface (Dehecq and others, Reference Dehecq2016). Therefore, we compared these results with the ‘ASTER monitoring of Ice towards eXtinction’ method (ASTERIX, Dussaillant and others, Reference Dussaillant2019). This dataset relies on the extensive and freely available archive of optical stereo images acquired by the Advanced Spaceborne Thermal Emission and Reflection Radiometer (ASTER). Here we used the annual elevation change maps (dh/dt) and the uncertainty maps for the 2000–2012 and 2012–2018 periods, recalculated for this region following the methods in Dussaillant and others (Reference Dussaillant2019). Both maps have a 30 m spatial resolution. We also compared these DEMs with a SAR dataset which integrates the SRTM and the German TanDEM-X digital elevation missions (Braun and others, Reference Braun2019). The SAR dataset covers the 2000–2012 period, has a 30 m spatial resolution and a reported uncertainty of 0.17 m a−1 for the Desert Andes.
2.4 Climatic records
Long-term multi-decade temperature series from ground stations are not available at high elevation sites in this region. The available records are usually from low elevation cities in coastal Chile (i.e. La Serena, Ovalle), and are known to capture a cooling pattern influenced by the Pacific ocean rather than the higher elevation climate of the Dry Andes (Falvey and Garreaud, Reference Falvey and Garreaud2009). Thus, to assess temperature changes around Agua Negra glacier over the last four decades, we used the mean monthly ERA5 reanalysis gridded surface air temperature data for the central point of Agua Negra glacier (30.16°S, 69.80°W). The ERA5 was generated by European Centre for Medium-Range Weather Forecasts (Hersbach and others, Reference Hersbach2019). The gridcell spatial resolution of this dataset is 30 km, and the record is available after 1979. We analyzed the April–September and October–March seasonal means, which roughly correspond to the accumulation and ablation seasons used in the glaciological mass-balance analysis. The temperature data collected by the Capayán automatic weather station (30.17°S, 69.80°W, 4750 m a.s.l., Fig. 2b) in front of Agua Negra glacier are used to validate the gridded data.
We also analyzed recent snowpack variations in the study area using maximum winter snow water equivalent data. For this we selected three stations that have been monitored by Chile's Dirección General de Aguas (DGA) in the vicinity of the Jáchal river basin: Quebrada Larga (30.72°S, 70.37°W, 3500 m a.s.l.), Cerro Vega Negra (30.92°S, 70.52°W, 3600 m a.s.l.) and Cerro Olivares (30.25°S, 69.95°W, 3600 m a.s.l.). Quebrada Larga is the only station with a complete record covering the 1979–2020 period.
3. Results
3.1 Area and length changes 1959–2019
The analysis of aerial photos and satellite imagery indicates that Agua Negra glacier shrank from an area of 1.28 km2 in 1959 to 0.98 km2 in 2019, a 23% reduction in 60 years (Figs 3a, b). Within this retreating trend, the Agua Negra area remained relatively stable until 1995 (a minor increase of 0.02 km2 or 2%), before a sharp decrease of 0.32 km2 (−25%) afterwards. This shrinking pattern was accompanied by an almost continuous frontal retreat of 0.49 km (−19%), and an increase in the elevation of the glacier front by 40 m over the same period (Fig. 3c). After 1999 the south-eastern portion of the glacier tongue disappeared, leaving an asymmetrical front with a lateral headwall up to 15 m high (Fig. 3a).
Agua Negra (AN) glacier fluctuations between 1959 and 2019. (a) Map of the glacier outlines in 1959, 1999 and 2019. Background: Pleiades 16 March 2019 (©CNES 2019, distribution Airbus D&S). (b and c) Area and cumulative length changes.

3.2 Glaciological mass balance 2014–2021
The glaciological measurements conducted at Agua Negra between 2014 and 2021 show that the surface mass balance of this glacier has been negative overall, with a cumulative value of −3.67 m w.e. and a mean of −0.52 m w.e. a−1 over this period (Fig. 4a, Table 2). The mean winter mass balance was 0.80 m w.e. a−1 (range: 0.39–1.37 m w.e. a−1), and the mean summer mass balance was −1.33 m w.e. a−1 (−0.82 to −2.10 m w.e. a−1). This sustained negative annual mass-balance trend was partially interrupted by a slightly positive value in the 2016–2017 glaciological year (0.33 m w.e., Table 2).
Glaciological mass balance of Agua Negra glacier during 2014–2021. Bw, winter mass balance; Bs, summer mass balance; Bc, cumulative annual mass balance. (b) Annual mass balance vs. ELA.

Glaciological mass balance of Agua Negra glacier during 2014–2021

Bw, winter mass balance; Bs, summer mass balance; Ba, annual mass balance; Bc, cumulative annual mass balance.
The winter (annual) mass-balance gradients at Agua Negra glacier are ~0.10 (0.50) m w.e. 100 m−1 (Fig. 5). It is worth noting, however, that some specific annual mass-balance gradients show notable breaks, which probably reflect local conditions such as slope, aspect and the presence of penitentes. In these cases (i.e. 2018, 2019 and 2020) the most negative mass-balance values can occur in the middle section of the glacier rather than in the front (Fig. 5b).
Mass-balance gradients of Agua Negra glacier. (a) Winter mass balance (Bw). (b) Annual mass balance (Ba). The year and month of the survey is indicated in the legend.
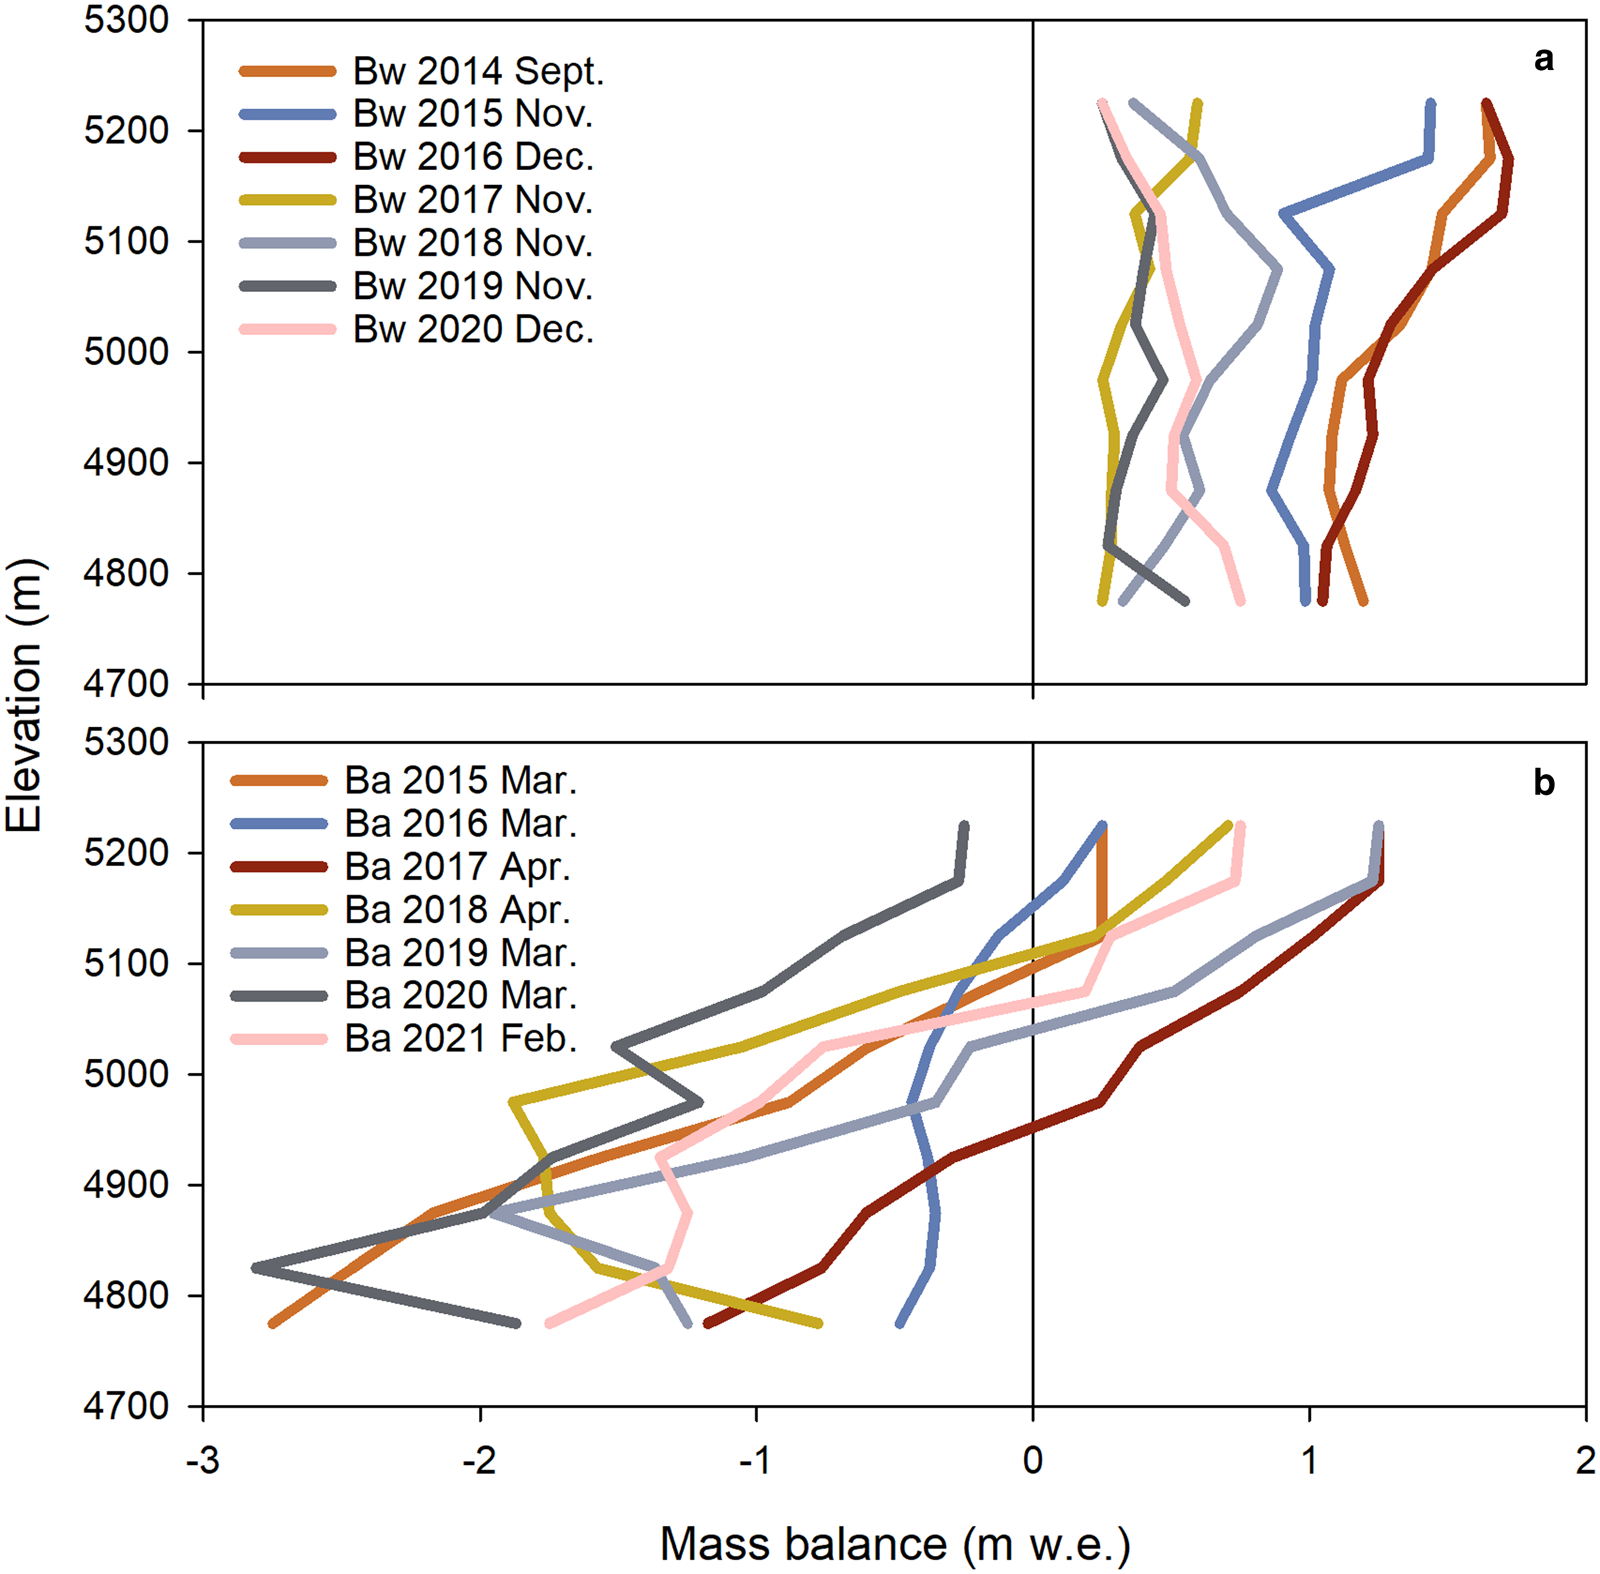
The ELA derived from the mass-balance gradients was estimated to be at 5100 ± 100 m a.s.l. (mean and std dev. for the 7 surveyed years). This parameter shows a clear relationship with the annual mass-balance series (Fig. 4b) and indicates an Accumulation Area Ratio (AAR) of 0.28 ± 0.20. Overall, these results suggest a strong imbalance between Agua Negra glacier and the local climate during the period of measurements.
3.3 Geodetic mass balances 2000–2019
The geodetic mass-balance calculations at Agua Negra glacier show persistent and accelerated ice mass loss over the last two decades. The overall 2000–2019 SRTMX-PLEIADES mass balance was −0.43 ± 0.04 m w.e. a−1, with −0.32 ± 0.03 m w.e. a−1 of ice mass loss between 2000 and 2013, and −0.66 ± 0.06 m w.e. a−1 between 2013 and 2019 (Figs 6a, b, and Table 3). A generalized thinning pattern can also be observed throughout the Agua Negra elevation range, with higher loss rates at lower elevations, and no clear areas of ice mass gain in the different time periods.
Maps of annual elevation change rate (dh/dt) at Agua Negra glacier and nearby ice masses. (a) SRTMX 2000–PLE 2013 DEM differences, (b) PLE-2013–2019, (c) ASTERIX 2000–2012, (d) ASTERIX 2012–2018 and (e) SAR 2000–2012. The glacier outlines are from the year 2000 and the maps have the same color code for dh/dt to highlight the increase in downwasting rates in the more recent periods.

Geodetic mass-balance results

Note: na: not available
The results using the SRTMX-PLEIADES and ASTERIX procedures show a good agreement. However, ASTERIX values tend to be slightly more negative than the SRTMX-PLEIADES. For example, the 2000–2018 AN mass balance derived from ASTERIX was −0.49 ± 0.15 m w.e. a−1 (Table 3). The loss was −0.34 ± 0.15 m w.e. a−1 in 2000–2012 and −0.85 ± 0.14 m w.e. a−1 in 2012–2018, which represents a 160% increase in the downwasting rate. The SAR data show a slightly more negative mass balance than ASTERIX for the 2000–2012 period: −0.46 ± 0.14 w.e a−1 (Fig. 6e).
3.4 Geodetic mass balance 2000–2018 at the Jáchal river basin
The ice mass losses observed in Agua Negra are part of a generalized pattern in the Jáchal river basin, which can be analyzed with the ASTERIX and SAR data. In 2000, there were 628 glaciers and perennial snowfields covering 116.18 km2 in the Jáchal basin. These different ice masses are distributed at progressively lower elevations, with glaciers and snowfields located mainly at 5750–5200, debris-covered ice at 4830–4640 and rock glaciers at 4730–4430 m a.s.l. (Fig. 7a).
(a) Hypsometry of the ice masses in the Jáchal basin compared to Agua Negra glacier. Glaciers and perennial snowfields in this basin are mostly located above 5000 m a.s.l., and rock glaciers and debris-covered ice (DC ice) surfaces are predominant at lower elevations. Note the different scales used for the areas of Agua Negra and Jáchal glaciers. (b) Elevation change rate of glaciers and snowfields in the Jáchal river basin and at AN as a function of elevation.
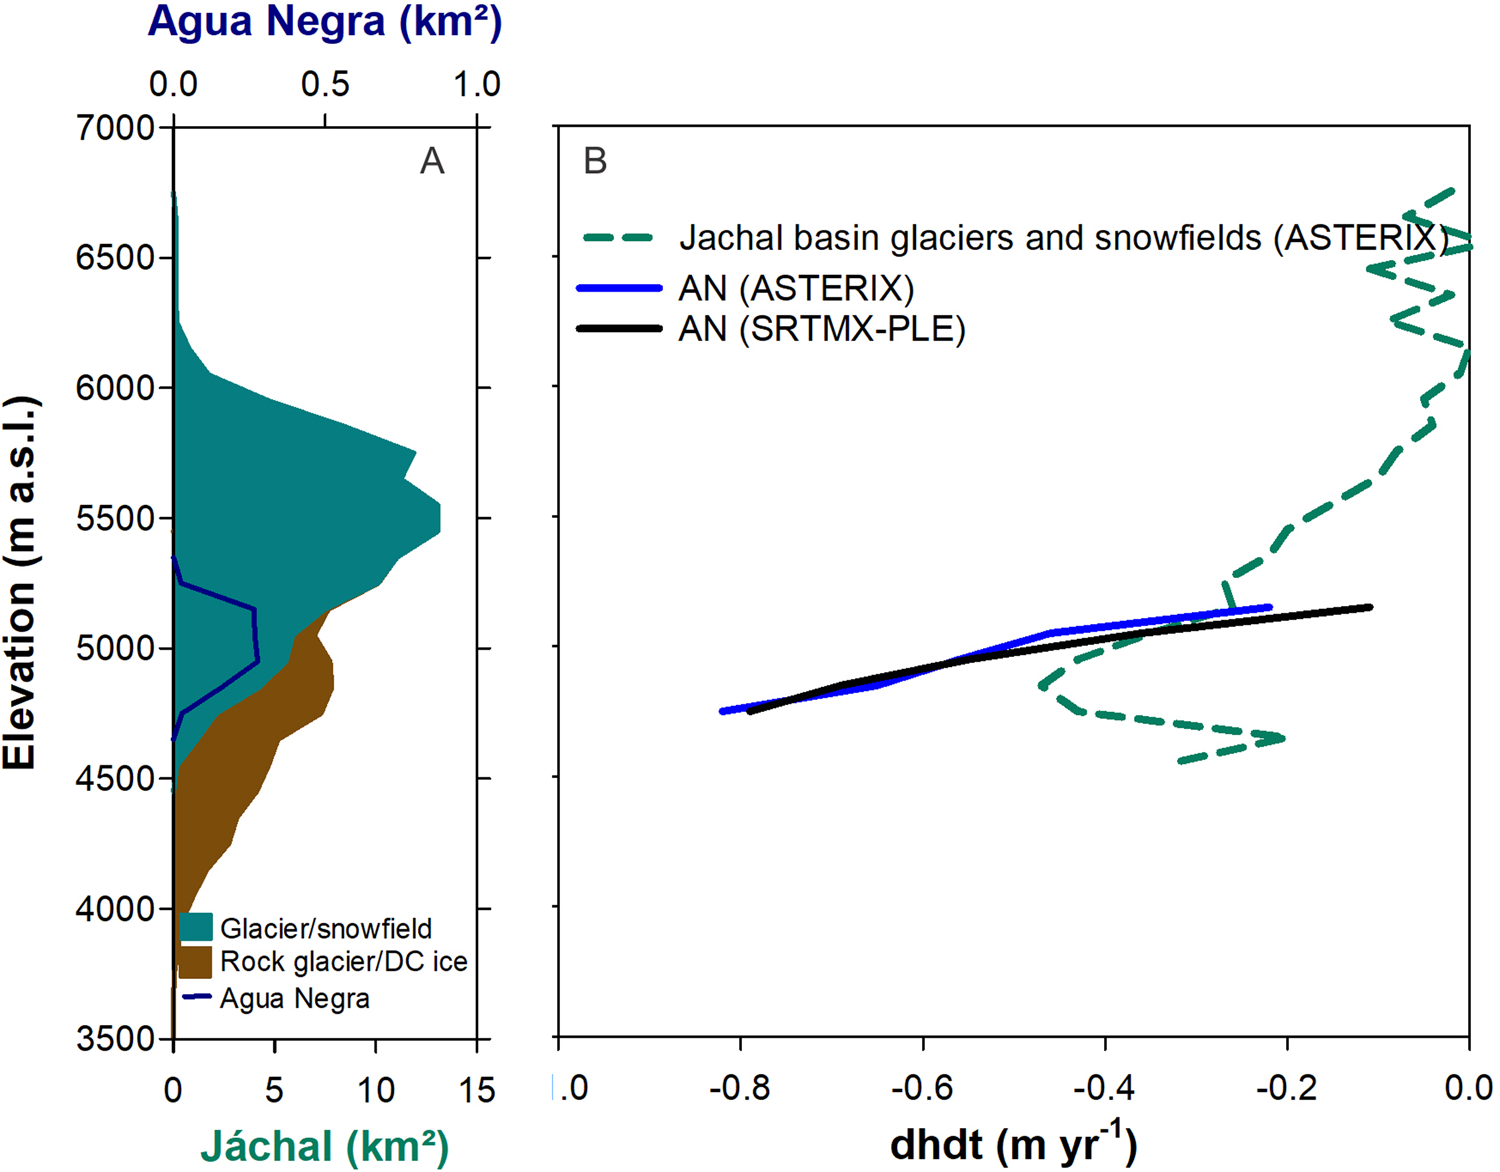
Between 2000 and 2018, the basin-wide rate of elevation change was −0.16 ± 0.13 m w.e. a−1, with rates becoming increasingly negative from −0.13 ± 0.16 in 2000–2012 to −0.23 ± 0.14 m w.e. a−1 in the 2012–2018 period. The SAR data show an almost balanced −0.01 ± 0.14 m w.e. a−1 for the 2000–2012 period (Table 3).
The ASTERIX elevation change rates above 6000 m a.s.l. at the Jáchal river basin average −0.1 m a−1 and decrease to −0.5 m a−1 at 4850 m a.s.l. before reversing to −0.3 at 4500 m a.s.l. (Fig. 7b). Agua Negra glacier elevation change rate is similar at 5000 m a.s.l. but increases to 0.8 m a−1 at the clean-ice glacier front (4750 m a.s.l.). This difference reflects the transition to debris-covered ice in the lower reaches of the glaciers of the basin (4500–5000 m a.s.l., Fig. 7a), which progressively reduces ablation.
The ASTERIX dataset also shows that the average thinning rate of clean ice in the Jáchal river basin for the 2000–2018 period was −0.19 ± 0.13 m w.e. a−1. In contrast, debris-covered ice showed mean values of −0.10 ± 0.08 m w.e. a−1, and rock glaciers remained close to equilibrium (−0.01 ± 0.08 m w.e. a−1). In terms of volume, 96% of the total ice mass loss corresponds to glaciers and snowfields, with debris-covered ice sections accounting for 3%, and rock glaciers for the remaining 1%.
3.5 Temperature and precipitation variations
The temperature data from the ERA5 reanalysis show a clear warning since 1979 in the study area. The October–March (ablation season) temperatures increased by ~0.5°C until 1995 and persistently reached values above the long-term average after 2002 (Fig. 8a). The April–September (accumulation season) temperatures also show an initial increase of ~1.0°C until 1996 and an additional rise of ~0.7°C after 2010. Accumulation season temperatures are persistently over the long-term average after 2012 (Fig. 8b).
Temperature and precipitation variations in the Agua Negra area. (a) October–March (ablation season) and (b) April–September (accumulation season) temperatures derived from ERA5 reanalysis data. (c) Snow water equivalent (SWE) recorded at the Quebrada Larga station. Annual values (thin line) are plotted together with 5-year moving averages (thick line). The 1979–2021 mean value is shown with a thin dashed line.

The comparison with the local Capayán station (installed by our team in front of Agua Negra glacier in 2014) suggests that the ERA5 surface temperature gridded data adequately represent the monthly temperature variations at Agua Negra (R 2 of the first differenced series = 0.83, albeit with a larger amplitude).
The Quebrada Larga snowpack record shows a 1979–2020 mean winter accumulation of 0.24 m w.e., with a large year-to-year variability ranging between 0 and 0.95 m w.e. (440% of the long-term mean, Fig. 8c). Below average accumulation occurred in 26 years (62% of the time) and a persistent deficit can be observed after 2009 except for the 2015 and 2016 winters. The Quebrada Larga station recorded no accumulation during winter (0 m w.e) four times since 1979, including the recent winter of the year 2020.
4. Discussion
4.1 Glacier changes
The areal decline observed at Agua Negra glacier is part of a generalized thinning and retreating trend, which has also been observed at other glaciers and snowfields monitored in the Desert Andes. Tapado glacier, 11 km to the west of Agua Negra, shrunk by 25% between 1956 and 2020, and the mass balance went from close to balance (−0.04 m w.e a−1) in 1956–1978 to moderate loss (−0.32 m w.e. a−1) in 2015–2020 (Robson and others, Reference Robson2022). At 29.35°S (~120 km to the north of AN), the ice masses larger than 1 km2 lost ~30% of their area between the 1950s and 2005. Several smaller ice masses lost up to 50% of their original areas. The largest areal recession was concentrated in the 4900–5200 m elevation band, while little or no changes were observed at elevations higher than 5200 m a.s.l. (Rabatel and others, Reference Rabatel, Castelbrunet, Favier, Nicholson and Kinnard2011; Pitte, Reference Pitte2013; Kinnard and others, Reference Kinnard2020).
This results from other ice masses in the Desert Andes, as well as data from the Central Andes further south are in general agreement with our measurements (Fig. 9). The glaciological mass-balance measurements, available for the Desert Andes since 2002–2003 (Rabatel and others, Reference Rabatel, Castelbrunet, Favier, Nicholson and Kinnard2011; Kinnard and others, Reference Kinnard2020), show an overall mass loss interrupted only by four positive mass-balance years (2002–2003, 2005–2006 and 2015–2017). Unfortunately, the direct glaciological observations from the Desert Andes still cover a short period of time, far from the recommended 30-year minimum for climatological studies (WGMS, 2020).
Location (a) and cumulative mass-balance series (b) of ice masses reported for the Dry Andes. Agua Negra glacier is shown in black (number 11) and the two long time series of the Central Andes (12 Piloto Este and 13 Echaurren Norte glaciers) are also shown for comparison.

Previous work in the glaciers of the Agua Negra region did not find a clear elevation gradient for accumulation nor ablation (Rabatel and others, Reference Rabatel, Castelbrunet, Favier, Nicholson and Kinnard2011; Kinnard and others, Reference Kinnard2020). This was anticipated by the pioneer work of Lliboutry and others (Reference Lliboutry, Gonzalez and Smiken1957) and Lliboutry (Reference Lliboutry1965), who introduced the concept of ‘reservoir glaciers’ to describe small ice masses located in desert mountain regions with little ice dynamics. He observed that, depending on the year, these ice masses could be entirely above or below the ELA without a clear distinction between the ablation and accumulation areas that are more common in temperate glaciers. This regime was attributed to the large interannual precipitation variability of this region, where glaciers are not preserved by balancing gain in the accumulation zone with loss in the ablation zone, but by compensating balances from successive years (Lliboutry and others, Reference Lliboutry, Gonzalez and Smiken1957). In such glaciers, the glaciological parameters such as the ELA should be used with caution. Our 7-year measurements from Agua Negra show mass-balance gradients can be detected but they are influenced by local factors such as slope and penitentes cover (Fig. 5). Additionally, the ELA position estimated from our mass-balance measurements at Agua Negra on the most negative balance year (2019–2020) was above the upper limit of the glacier (5250 m a.s.l.).
The Echaurren Norte glacier (33.57°S, Fig. 1) is located south of Agua Negra glacier in Central Chile and is the only reference site of the WGMS for the entire Dry Andes. This glacier has the longest ongoing mass-balance series for the Southern Hemisphere, and was initiated in 1975 by the DGA (Escobar and others, Reference Escobar, Casassa and Pozo1995). The Piloto Este glacier (32.59°S) is located on the eastern Argentinean side of the Central Andes and was monitored by IANIGLA-CONICET between 1979 and 2003 prior to its partial demise (Leiva and others, Reference Leiva, Cabrera and Lenzano2007). These glaciers show winter mass balances between 0.5 and 6.0 m w.e., summer mass balances between −1.5 and −5.0 m w.e., and −11 to −20.0 m w.e. cumulative mass balances for the past 40 years (Fig. 9). The annual balances have a strong dependency on the interannual variability of winter precipitation (Masiokas and others, Reference Masiokas2016).
The SRTMX-PLE geodetic data developed for Agua Negra glacier in this study are in general agreement with results from previously published datasets derived from ASTER (ASTERIX, Dussaillant and others, Reference Dussaillant2019) and SAR (Braun and others, Reference Braun2019) satellite images (Fig. 10; Table 3). The three datasets report similar uncertainties despite their slightly different survey periods. However, the SRTMX-PLE dataset is more up to date (reaching to 2019) and shows smaller uncertainties (0.04 m w.e. a−1, Table 3) than the other coarser spatial resolution datasets.
Mass-balance rates at Agua Negra glacier and the Jáchal river basin derived from different geodetic datasets. The SRTMX-PLE (black), ASTERIX (green) and SAR (blue) datasets are shown both for Agua Negra (solid lines) and the Jáchal river basin (dashed lines).

When the analysis is extended to all glaciers and snowfields in the Jáchal river basin, the ASTERIX data show a −0.16 m w.e. a−1 ice mass loss for the 2000–2018 period (Fig. 10, Table 3). This value is consistent with the long-term glacier decline observed in the area (Fig. 3). In contrast, SAR data indicate an almost balanced condition and −0.01 m w.e. a−1 for the 2000–2012 period. This is in line with the 0.03 m w.e. a−1 value reported for the entire Desert Andes by Braun and others (Reference Braun2019).
4.2 Uncertainties in glacier elevation change datasets
In this work, we used three elevation change datasets derived from optical and SAR sensors which were processed with different techniques. The sources of uncertainties and their quantification have been described in Section 2. A more thorough analysis with the corresponding error bars and error grids can be found in the original publications, i.e. PLE (Berthier and others, Reference Berthier2014), ASTERIX (Dussaillant and others, Reference Dussaillant2019) and SAR (Braun and others, Reference Braun2019).
We started the glaciological monitoring at Agua Negra in 2014 and the SRTM-PLE dataset combined X-band SAR and optical data allowed us to obtain information since the year 2000. The high spatial resolution of the optical Pléiades DEM (4 m) provided a very accurate elevation change dataset for 2013–2019 with reduced uncertainties (±0.04 m w.e. a−1, Table 3). We resampled the Pléiades DEM to 30 m to reduce the spatial resolution effect and facilitate the comparison with other coarser resolution datasets. When combined with the 30 m resolution X-band SRTM, the spatial resolution and possible penetration of the SAR X-band into dry snow should be considered. Although the SRTM X-band penetration is poorly quantified, an estimation of ~0.8 m was made for the Desert Andes (Dussaillant and others, Reference Dussaillant2019). This represents 9% of the mean elevation change observed at AN between 2000 and 2019 (−9.5 m) and 16% of the mean elevation change during 2000–2013 (−4.9 m).
The ASTERIX dataset provides 30 m gridded results and extensive regional coverage, particularly for a relatively cloud-free region as the Desert Andes (99% coverage of the ice masses in the Jáchal basin). The volume change estimates derived from ASTERIX are consistent with information from other sources, even for small glaciers such as Agua Negra. Although the uncertainty bars in this dataset are relatively large (−0.16 ± 0.13 m w.e. a−1, Table 3), the glacier thinning in the AN area is clearly discernible (Figs 6c, d). A new version of this dataset, updated to 2020 and with a revised processing method, has been recently released (Hugonnet and others, Reference Hugonnet2021). We did not analyze it further because its 100 m spatial resolution makes it less suitable than the 30 m ASTERIX for the small ice masses of the Desert Andes.
The SAR-derived dataset combines SRTM C-band data with TanDEM-X X-band data for the whole Andes. SAR data are not affected by the frequent cloudiness of some mountain areas but the signal surface penetration has to be considered for reliable assessments of ice elevation changes (Braun and others, Reference Braun2019). For AN we found the results of SAR data to be consistent with the other datasets. At the basin or regional scale, the SAR data show a mass balance of −0.01 ± 0.15 m w.e. a−1 (Table 3) for the 2000–2012 period. This balanced mass budget is not consistent with the long-term recession of glaciers observed in the area (Fig. 3). Overestimation of the mass balance by SAR data was also found in the nearby Tapado Glacier. Above 4910 m, SAR data show values ~1 m a−1 more positive than other datasets (Robson and others, Reference Robson2022).
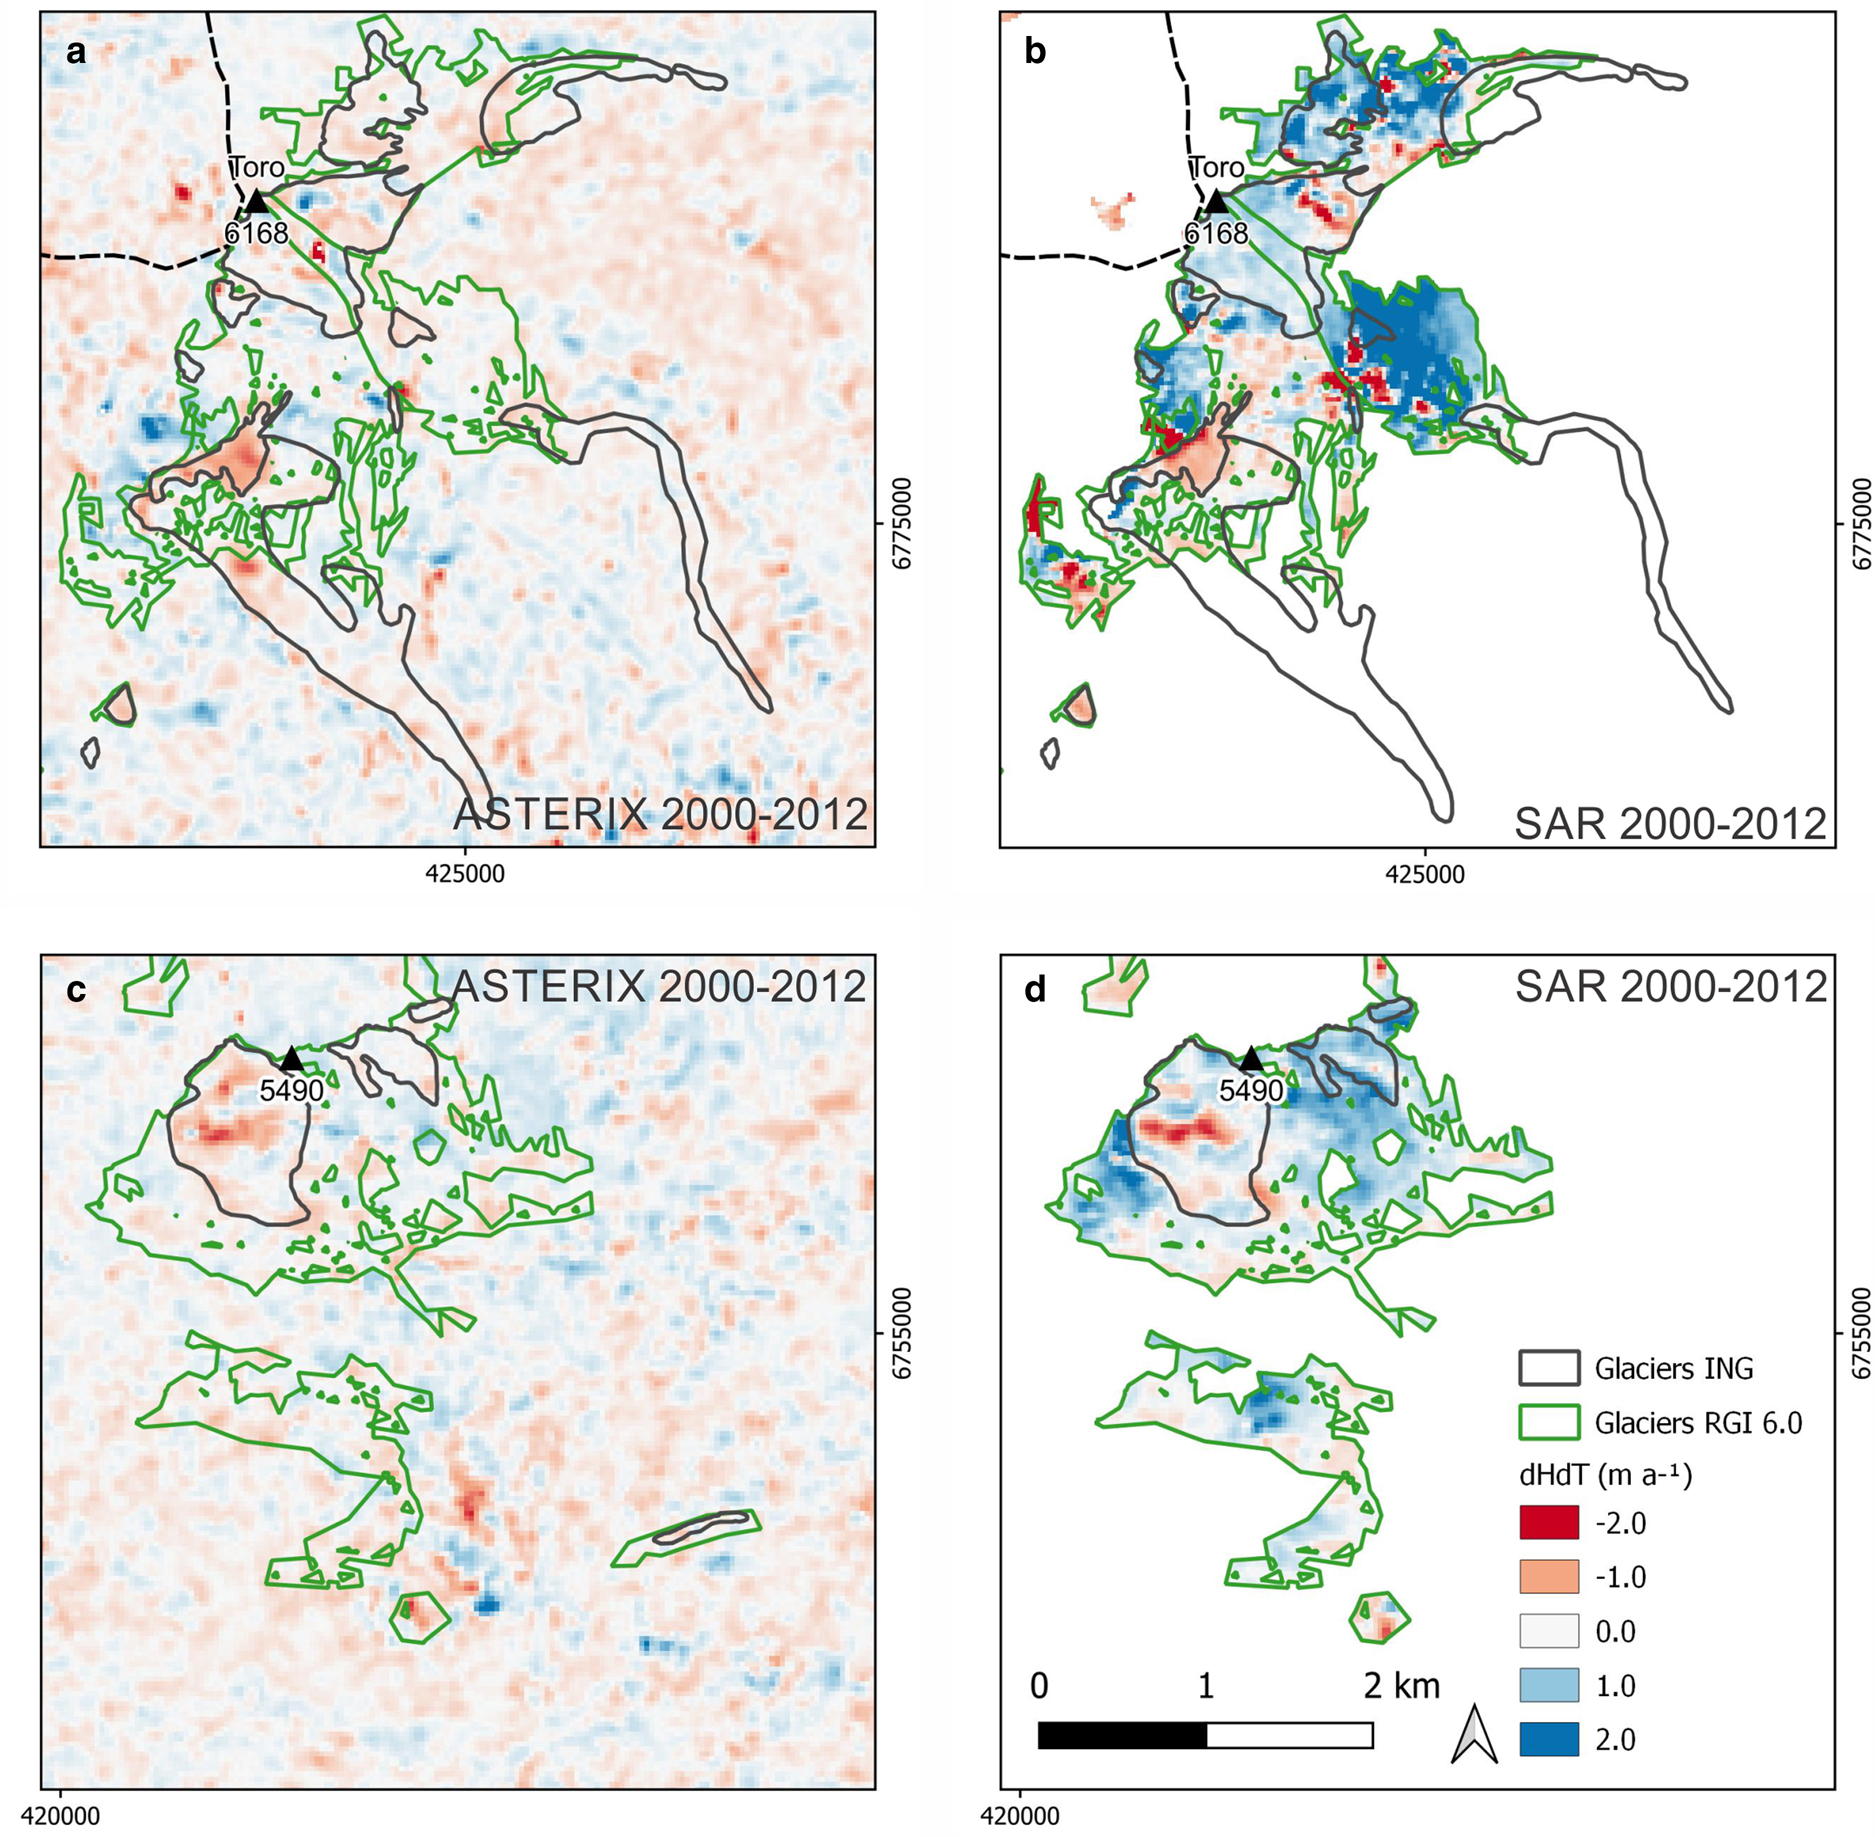
Possible causes for this discrepancy may be associated with the fact that the available SAR grids are provided after clipping the maps with the Randolph Glacier Inventory (RGI) 6.0. The RGI 6.0 does not include 11% of the glacier and snowfield area, 75% of the debris-covered ice area, and 96% of the rock glacier area identified in the Jáchal basin (illustrated for ice masses around Agua Negra in Fig. 6e). In the Desert Andes, the RGI 6.0 also includes some portions with seasonal snow cover (Fig. 11). The RGI was developed for global and regional assessments (Pfeffer and others, Reference Pfeffer2014) and is the standard dataset for most regional geodetic studies including ASTERIX and SAR used here. But the RGI 6.0 has been shown to poorly represent smaller glaciers in the Southern Andes where more detailed national glacier inventories are available (Ferri Hidalgo and others, Reference Ferri Hidalgo2020; Zalazar and others, Reference Zalazar2020). The clipped grids of SAR data also preclude the analysis over stable non-glaciated areas and the calculation of the mass balance using an improved glacier inventory. The analysis of elevation change residuals in non-glaciated areas is a key component of the uncertainty assessment in geodetic mass-balance studies (i.e., Berthier and others, Reference Berthier2014; Braun and others, Reference Braun2019; Dussaillant and others, Reference Dussaillant2019). The penetration of the SAR signal into snow and ice and its difficult correction seem to result in anomalous mass gain at high elevation sites (Fig. 11 and Dussaillant and others, Reference Dussaillant2019: Fig. S12). It may also explain some of the differences observed between SAR and the other datasets from the small glaciers in the Jáchal basin or for the nearby Tapado Glacier (Robson and others, Reference Robson2022).
Comparison between ASTERIX (a and c) and SAR (b and d) elevation change maps for two selected sites in the Jáchal basin: Cerro Toro (a and b) and southern Cordón de Ortigas (c and d). The grids correspond to the 2000–2012 period. The ING outlines are shown in black, and the RGI 6.0 used in the ASTERIX and SAR original publications are shown in green. Note the more positive values in ice elevation changes in the SAR dataset extend to non-glacier area.
4.3 Climate
The large interannual variability and the strong interdecadal variations of precipitation in the study area are relatively well documented (Masiokas and others, Reference Masiokas, Villalba, Luckman, Le Quesne and Aravena2006, Reference Masiokas and Pielke2013). Precipitations can reach 3.5–4.5 times the mean value during wet years and decrease to virtually nothing during the driest winters. The precipitation variability is replicated by the winter balance of the glaciers monitored in the region (Rabatel and others, Reference Rabatel, Castelbrunet, Favier, Nicholson and Kinnard2011; Kinnard and others, Reference Kinnard2020). Also, this large interannual variability hampers the detection of long-term climatic trends. Interestingly, the exceptional nature of the recent precipitation deficit is clearly discernible in the local and regional ice mass loss estimates after 2009 (Table 3). The severe drought that started in 2009–2010 and is still ongoing in 2020 appears to be the most severe multi-year event in the historical record and probably one of the three most severe in the past millennium (Garreaud and others, Reference Garreaud2019). The reduced snow accumulation has been accompanied by a negative trend in snow cover duration (−2 to −5 d a−1) together with an increase in the elevation of the snowline (10–30 m a−1) for the 2000–2016 period (Saavedra and others, Reference Saavedra, Kampf, Fassnacht and Sibold2018).
The warming observed in the ERA 5 record (Fig. 8) is similar to the 0.25°C per decade reported for the Andes of Central and Northern Chile (17–37°S) as well as for the eastern side of the Andes (Falvey and Garreaud, Reference Falvey and Garreaud2009). This observed warming is also consistent with the 0°C isotherm rise derived from radiosonde observations at the Quintero (33.44°S) and Antofagasta (23.65°S) stations, which show a 13 and 38 m rise per decade, respectively, for the 1973–2018 periods (DMC, 2019). In the more recent 2000–2018 period, the 0°C isotherm increased by 58 and 50 m per decade, respectively. It should be noted, however, that different modeling studies suggest that ablation in the Dry Andes is mainly driven by variations in net shortwave radiation, with temperature probably playing a lesser role in explaining the mass balance of glaciers (MacDonell and others, Reference MacDonell, Kinnard, Mölg, Nicholson and Abermann2013; Schaefer and others, Reference Schaefer, Fonseca-Gallardo, Farías-Barahona and Casassa2020). Following this hypothesis, precipitation variability could be a significant factor in explaining the interannual variations in glacier mass balance and the recent decline observed after 2009–2010 in the region (Rabatel and others, Reference Rabatel, Castelbrunet, Favier, Nicholson and Kinnard2011; Masiokas and others, Reference Masiokas2016; Kinnard and others, Reference Kinnard2020; Robson and others, Reference Robson2022).
5. Conclusions
Agua Negra and the other glaciers assessed in the Jáchal basin have shown an overall, persistent areal loss since the late 1950s. More specifically, the geodetic mass balance of Agua Negra between 2000 and 2013 was −0.32 ± 0.03 m w.e. a−1 and dropped to −0.66 ± 0.06 m w.e. a−1 during the 2013–2019 period. These results are consistent with most of the available information indicating a moderate yet accelerating downwasting of ice masses in the Desert Andes in the last two decades.
The results from the ice mass change analysis and the climate variations suggest that precipitation probably plays an enhanced role in the mass balance of glaciers in the Dry Andes. Recent trends of snow water equivalent from ground stations, snow cover duration, and snowline elevation measured with satellite data all point to an abnormally dry period since 2009 (Saavedra and others, Reference Saavedra, Kampf, Fassnacht and Sibold2018), which coincides with a marked increase in ice mass loss in the last decade. This dry period has been accompanied with a temperature rise, which is observed both in surface stations and radiosonde data for the past 40 years. This combined scenario of decreasing accumulation with increasing temperatures puts the ice masses and the seasonal snow cover of this arid region in an alarming situation, highlighting the urgent need for further multi-disciplinary research to better understand the local glaciological, climatological and hydrological processes that dominate the Desert Andes.
The lack of field measurements, especially long-term time series from well-distributed study areas, remains a crucial limiting factor to improve our understanding and reduce the uncertainties in these glaciological assessments in the Desert Andes. The work presented here provides quantitative glacier mass loss estimates from direct measurements and remote-sensing data which are part of a national-scale glaciological program that covers several sites along the Andes. The efforts are intended to improve our understanding of the current state of the glaciers in Argentina, their relationship with the regional climate, and their hydrological contribution along the Andes.
Data
Data reported in this manuscript are available on request to the corresponding author. The glaciological mass-balance data are available from the World Glacier Monitoring Service (WGMS DOI 10.5904/wgms-fog-2021-05).
Acknowledgements
We thank both anonymous reviewers and the editors, Joseph Shea and Nicholas Cullen, for their comments that improved the manuscript. The research was supported by Consejo Nacional de Investigaciones Científicas y Técnicas (CONICET) and Secretaría de Ambiente y Desarrollo Sustentable de Nación (SAyDS). The Pléiades images were provided and processed by the Pléiades Glacier Observatory (PGO, https://www.legos.omp.eu/pgo/). The monitoring program benefited from a bilateral Argentina-France, MINCYT-ECOS PA17A02 project which funded the exchange of scientists between the two countries. Additional funding was provided by the PICT 2018-03211 project. We thank the many field collaborators that made the mass-balance measurements possible, in particular Omar del Castillo and Zulma Menna of the Universidad Nacional de San Juan. We also extend our gratitude to the Gendarmería Nacional Argentina who supported us in the early campaigns and are always of assistance. EB acknowledges support from the French Space Agency (CNES).


 Open access