

1. Introduction
The main goal of this study is to explore the added value of simulation modelling for testing archaeological hypotheses by using a two-step approach. The first step is to quantify Roman and early-medieval population numbers in the Rhine–Meuse delta. The second is to determine the general impact of palaeodemographic fluctuations on past land use and whether or not these exceeded the limits of the natural landscape in this area. This was done by testing the feasibility of three archaeological hypotheses, two of which have dominated the archaeological debate during the last decade (Table 1, hypotheses 2 and 3). Although the term (palaeo)demography traditionally may encompass a multitude of demographic elements (e.g. population size, composition, age or origin), (palaeo)demography in this study is defined solely as the size of the population during a specific archaeological period.
Archaeological hypotheses (including main references stating these claims) regarding Roman and early-medieval demography and land use in the study area.

The essential role of palaeodemographic studies for archaeological-interpretative frameworks has already been put forward in several archaeological studies (e.g. Hassan, Reference Hassan1981; Theuws, Reference Theuws1988; Shennan, Reference Shennan1998; Chamberlain, Reference Chamberlain2006; De Moor, Reference De Moor, Matthijs, Hin, Kok and Matsuo2016; Verhagen et al., Reference Verhagen, Joyce and Groenhuijzen2016a). Chamberlain (Reference Chamberlain2006, p. 177) stated that demographic studies might contribute significantly to archaeology since they can: (1) help to place constraints on the kinds of populations that could have existed in the past; and (2) assist in evaluating the nature of the demographic processes that contributed to observed patterning in the archaeological record. Since the archaeological record per definition is fragmented and incomplete due to depositional and post-depositional processes (Schiffer, Reference Schiffer1976, Reference Schiffer1987), palaeodemographic studies can provide valuable additional spatiotemporal frameworks for interpreting the archaeological record. Moreover, recent developments in, among others, digital infrastructures and techniques, such as Geographical Information Systems (GIS), for the first time provide digital data and tools with which to reconstruct and quantify large-scale population sizes and to determine the impact of population fluctuations on past land use.
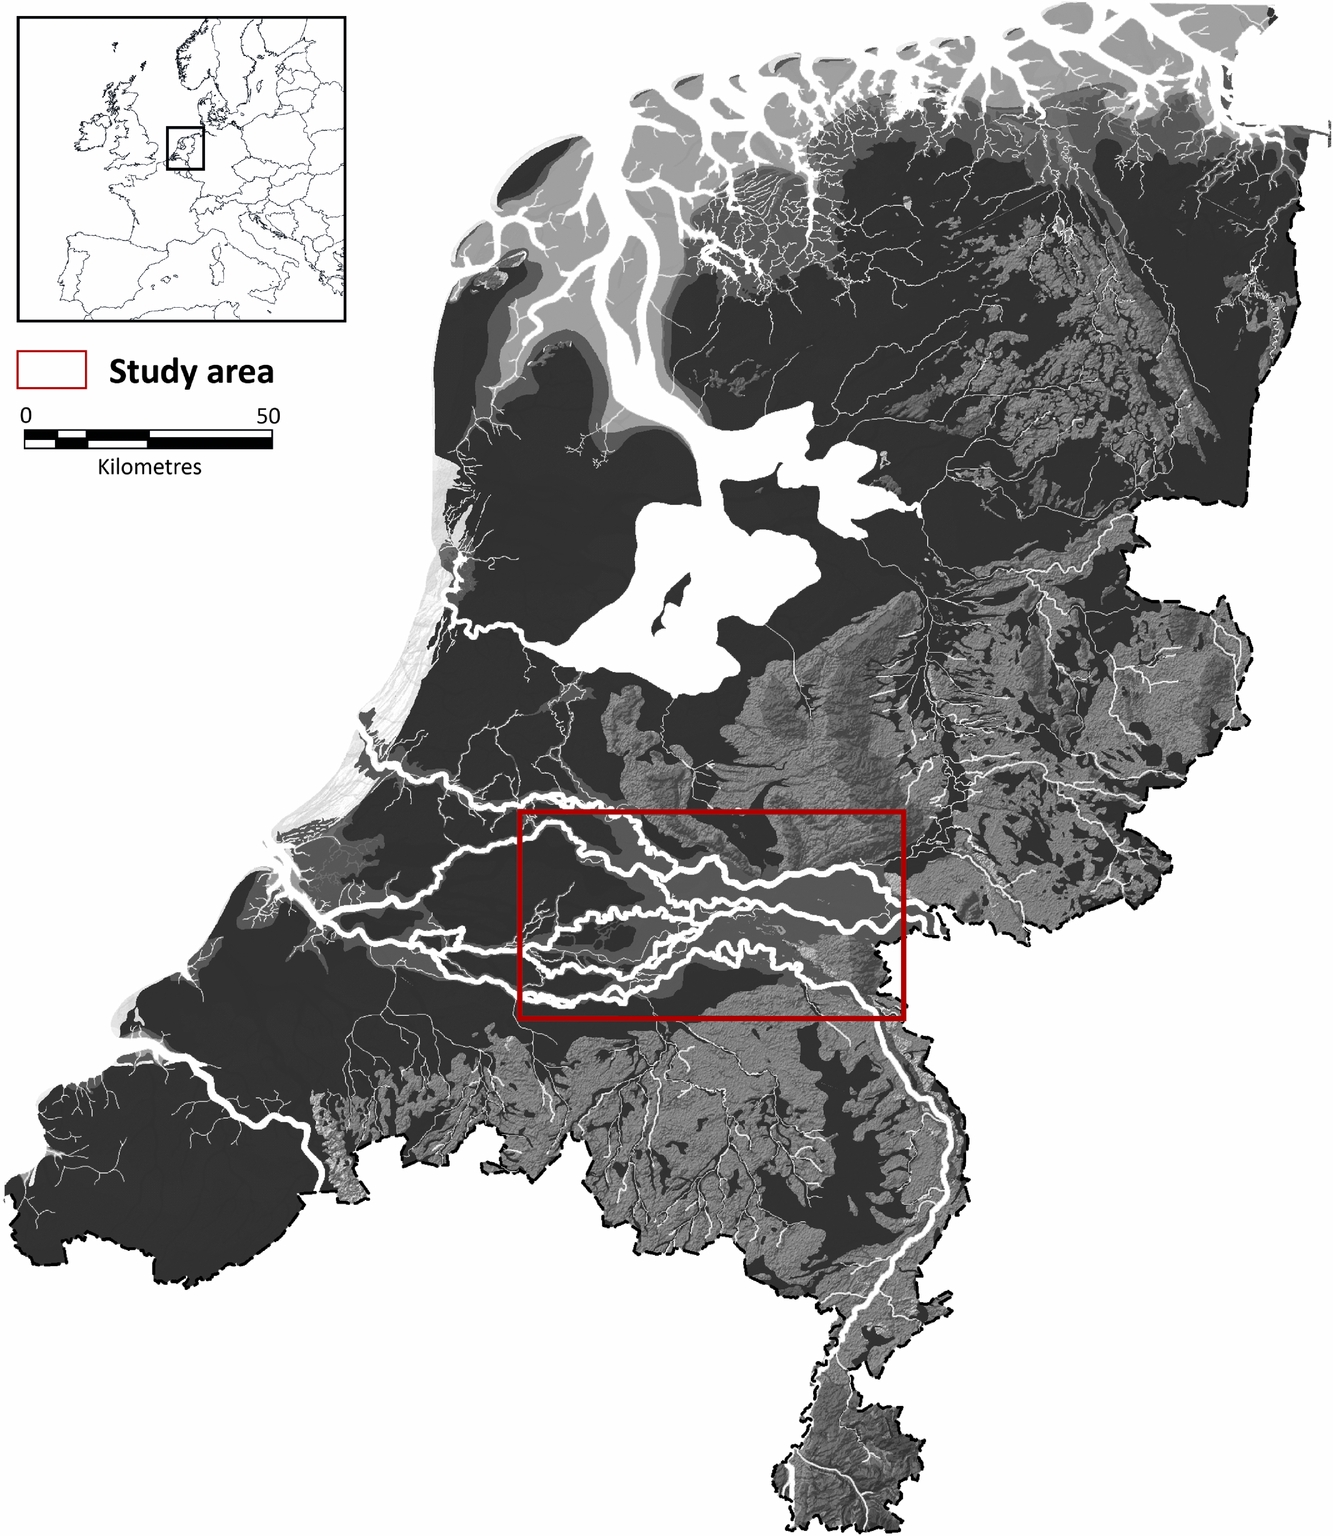
The study area is the fluvial-dominated part of the Rhine–Meuse delta, located in the heart of the present-day Netherlands (Fig. 1). This region was densely populated, especially from the Bronze Age onwards, because of its fertile substrates (2000–800 BC; Louwe Kooijmans, Reference Louwe Kooijmans1974; Arnoldussen, Reference Arnoldussen2008). Its high level of (long-distance) connectivity to central Europe and to the British Isles provided abundant long-distance transport options (e.g. Cunliffe, Reference Cunliffe2004; McCormick, Reference McCormick2007). During the first millennium AD the delta was characterised by large-scale cultural and natural changes (e.g. Henderikx, Reference Henderikx1983; Willems, Reference Willems1986; Van Es and Verwers, Reference Van Es and Verwers2010; Jansma et al., Reference Jansma, Gouw-Bouman, Van Lanen, Pierik, Cohen, Groenewoudt, Hoek, Stouthamer and Middelkoop2014; Pierik & Van Lanen, Reference Pierik and Van Lanen2017; Van Dinter et al., Reference Van Dinter, Cohen, Hoek, Stouthamer, Jansma and Middelkoop2017; Van Lanen & Pierik, Reference Van Lanen and Pierik2017). As was the case in many other parts of Europe, Roman occupation during the first centuries of this millennium generated an unprecedented (as yet unquantified) demographic and economic growth. The collapse of the Roman frontier (limes) around AD 270, however, led to large-scale depopulation, economic decline and political instability (e.g. Alföldi, Reference Alföldi1967; Willems, Reference Willems1986; Cheyette, Reference Cheyette2008; Van Dinter, Reference Van Dinter2013; Heeren, Reference Heeren, Roymans, Derks and Hiddink2015). This decline continued for centuries and only started to reverse during the 6th century AD, when also long-distance transport by water increased again (Van Es & Verwers, Reference Van Es and Verwers2010). By the 7th century the major rivers in the Netherlands had regained much of their transport-geographical importance, heralding a new period of economic and demographic growth. The impact of economic and demographic fluctuations on the natural (abiotic) landscape is unclear for the first millennium AD, and research quantifying these changes and their impact on land use is rare.
The location of the research area (red) in the Netherlands. This location is overlain on the palaeogeographical situation of c. AD 100, adapted from Vos & De Vries (2013).
Two recent studies have stressed the need for more research focusing on past human–landscape interactions in the present-day Netherlands (including quantitative population-size and land-use reconstructions; cf. Pierik & Van Lanen, Reference Pierik and Van Lanen2017; Van Lanen & Pierik, Reference Van Lanen and Pierik2017). These studies, focused on reconstructing the impact of natural setting and forcing on settlement patterns and route networks in the Rhine–Meuse delta during the first millennium AD, demonstrate the complexity of the interactions and interrelationships between large-scale cultural and natural factors such as settlement dynamics, route networks, floods and avulsions. The findings of these studies show the necessity of integrating population-size and land-use reconstructions when studying human–landscape interactions and connectivity patterns during this time interval (cf. Section 2).
2. Theoretical background: palaeodemographics, land use and connectivity patterns
Demographic reconstructions pertaining to the Rhine–Meuse delta have mainly focused on (parts of) the early-Roman and middle-Roman periods (12 BC–AD 270). In older studies by Bloemers (Reference Bloemers1978) and Willems (Reference Willems1986) and more recent studies by Vossen (Reference Vossen, Grünewald and Seibel2003), Vos (Reference Vos2009) and Verhagen et al. (Reference Verhagen, Joyce and Groenhuijzen2016a), Roman population estimates for the Dutch limes zone are calculated based on a variety of methods. Mostly two types of models have been applied: (1) the so-called recruitment model (RM), which determines palaeodemographics based on Roman military-requirement numbers known from historical sources (Bloemers, Reference Bloemers1978; Willems, Reference Willems1986); and (2) the settlement-density model (SDM), which calculates palaeodemographics based on settlement numbers, the average number of houses per settlement, and average household size (Bloemers, Reference Bloemers1978; Willems, Reference Willems1986; Vossen, Reference Vossen, Grünewald and Seibel2003; Vos, Reference Vos2009; Dijkstra, Reference Dijkstra2011). Recently, it has been suggested that many of these estimates are based on an insufficient understanding and incorporation of processes such as natural-population growth, migration, military recruitment, and effects of low-level urbanisation in many of these models (Verhagen et al., Reference Verhagen, Joyce and Groenhuijzen2016a). Against this background we apply a newly developed SDM to the Rhine–Meuse delta because: (1) the majority of the first-millennium population must have lived in rural settlements; (2) high-quality settlement data are available for this area, allowing an evidence-based approach when reconstructing population dynamics; (3) it is impossible to verify the reliability of historical sources mentioning Roman army-recruitment numbers; (4) this model allows calculation of the relative contribution of low-level urbanisation through the analysis of individual large settlements (>5 ha).
The dynamic relationship between people and their environment is reflected, among others, in changing land use. Since the 1970s, archaeologists have been developing (computer) models in order to study the complex interplay between demographic fluctuations and land-use changes. Especially in landscape archaeology, simulation models designed for this specific purpose have gained increasing attention (Lake, Reference Lake2014). However, it is commonly recognised that many archaeological simulation models underrepresent processes of social complexity and natural-landscape dynamics. Although a growing number of studies recognise the necessity of integrating complex cultural and sociological factors in archaeological (simulation) modelling (e.g. Van der Leeuw & McGlade, Reference Van der Leeuw and McGlade1997; Goodchild & Witcher, Reference Goodchild, Witcher, Carlsen and Lo Cascio2010; Whitley et al., Reference Whitley, Moore, Goel, Jackson, Frischer, Crawford and Kollers2010), this remains one of the major challenges (Lake, Reference Lake2014). A simulation-modelling framework introduced by De Kleijn et al. (in press) was designed to incorporate cultural factors in order to model the competition between different types of land use. We used this modelled framework in order to test the feasibility of archaeological hypotheses. The presented model explicitly does not reconstruct first-millennium land use, but only tests the capacity of the natural landscape to cope with demographic fluctuations. By adapting the PLUS model to specific variables hypothetically reflecting Roman and early-medieval conditions, we were able to simulate the probable impact of palaeodemographic fluctuations on the contemporary landscape. Data on first-millennium land use, such as the average amount of calories per delta inhabitant/soldier and average yield per land unit, were derived from studies focused on Roman land use in the western Netherlands (Kooistra et. al., Reference Kooistra, Van Dinter, Dütting, Van Rijn and Cavallo2013; Van Dinter et al., Reference Van Dinter, Kooistra, Dütting, Van Rijn and Cavallo2014).
Recent research of Roman and early-medieval settlement patterns and route networks in the Rhine–Meuse delta has demonstrated multi-scale variability in cultural and natural processes, among others showing that settlements were spatially dynamic and clearly influenced by natural forcings such as flooding, whereas route zones in this area were characterised by a high level of persistence (Van Lanen & Pierik, Reference Van Lanen and Pierik2017). The implication is that throughout the first millennium, processes of persistence and change coincided. Based on the findings it was concluded that cultural processes such as the development of settlement patterns and route networks are part of larger complex networks of cultural manifestations that are closely intertwined and continuously influence each other. Van Lanen & Pierik (Reference Van Lanen and Pierik2017) defined this complex network as ‘connectivity patterns’, which they regard as the dynamic spatial and social interrelations of, and interactions between, the following landscape-influencing factors: settlement patterns, land use, demography, route networks, long-distance transport routes and physical landscape-formation processes. Within connectivity patterns, changes in one factor (e.g. demography or land use), can lead to far-reaching ripple effects within the system. They concluded that these combined connectivity-pattern factors (CPFs) are key for studying large-scale human–landscape interactions. Population size and land use are the next two CPFs which are analysed in the current study.
3. Material
In order to calculate palaeodemographics and its corresponding impact on land use we used recently developed archaeological datasets, geomorphological reconstructions and GIS-simulation modelling.
3.1. Archaeology
Rural population numbers were reconstructed based on Roman and early-medieval settlement data derived from the Archaeological Information System of the Netherlands (ARCHIS). ARCHIS contains a continuously updated supraregional overview of known archaeological finds (Roorda & Wiemer, Reference Roorda, Wiemer and Larsen1992; Wiemer, Reference Wiemer, García Sanjuan and Wheatley2002). We expanded this dataset with detailed published (meta)data from regional overview studies (Bechert & Willems, Reference Bechert and Willems1995; Verwers, Reference Verwers1998). Data on Roman military structures were derived from the LGL World Heritage database (Reference Bödecker and Van Marrewijk2010). Specifics on larger settlements were collected through the Electronic Archiving System (EASY) and from published overview studies (for a full overview of used publications see Appendix A (available online at https://doi.org/10.1017/njg.2018.3) and the references at the end of this paper). EASY is an online archiving system for archaeological excavation data, such as figures, GIS files, photos and research reports. Chronological diversification within the model was based on the Archaeological Basic Register (ABR). On archaeological and historical grounds the ABR differentiates three Roman and four early-medieval periods (Table 2). These periods roughly cover, on average, 100–200 years. We chose these short time intervals to calculate population-size fluctuations using the highest possible chronological resolution. Consequently, roughly dated settlements, i.e. dating to only the Roman or early-medieval period as a whole, were excluded from the analysis since their chronological resolution is too low to yield reliable population-size fluctuations. Continuously inhabited settlements are extremely rare in the study area but were individually included in the dataset when classified as such in archaeological publications (overview studies and excavation reports).
Periods and subperiods as specified by the Archaeological Basic Register (ABR).

3.2. Palaeographical reconstructions
Input criteria for land-use suitability were derived from newly developed, high-resolution geomorphological reconstructions for AD 100, 500 and 900, and from a palaeo-digital elevation model (palaeoDEM) compiled by Pierik et al. (Reference Pierik, Stouthamer and Cohen2017). Based on these datasets also the lithology of the study area was reconstructed (Section 4.2).
Geomorphological reconstructions
The geomorphological maps for AD 100, 500 and 900 developed by Pierik et al. (Reference Pierik, Stouthamer and Cohen2017) show landscape elements from which differences in land-use suitability in the delta were deduced for each of these time slices (Fig. 2). These maps in unprecedented detail outline the spatial extent, distribution and orientation of alluvial ridges, including channel belts, natural levees, crevasse splays and floodbasins. These geomorphological elements were mapped using lithological and geomorphological criteria following the methodology developed by Berendsen & Stouthamer (Reference Berendsen and Stouthamer2000), Van Dinter (Reference Van Dinter2013), Vos (Reference Vos2015) and Pierik et al. (Reference Pierik, Cohen and Stouthamer2016). Lithological information was obtained from an extensive borehole database maintained by Utrecht University, and modern elevation data were derived from lidar images (Berendsen & Volleberg, Reference Berendsen and Volleberg2007). The dating of the mapped elements is based on 14C dates, archaeology and relative dating (Berendsen & Stouthamer, Reference Berendsen and Stouthamer2000; Cohen et al., Reference Cohen, Stouthamer, Pierik and Geurts2012). The geomorphological reconstructions expand on existing regional studies (e.g. Willems, Reference Willems1986; Van Dinter, Reference Van Dinter2013; Van Dinter et al., Reference Van Dinter, Cohen, Hoek, Stouthamer, Jansma and Middelkoop2017). They have a higher resolution than previous delta-wide and national reconstructions, are more accurate and show more landscape elements.
Geomorphological reconstructions of the Rhine–Meuse delta around AD 100, 500 and 900 (adapted from Pierik et al., Reference Pierik, Stouthamer and Cohen2017).

Palaeo Digital-elevation Model (palaeoDEM)
Within the mapped geomorphological units, elevation influences terrain wetness and thus land-use potential. Pierik et al. (Reference Pierik, Stouthamer and Cohen2017) developed a palaeo-surface reconstruction distinguishing higher and lower areas in the delta around AD 100 using a 100 × 100 m grid-cell resolution (Fig. 3). Higher areas in this dataset were assigned a higher suitability than the lower areas (Appendix B, available online at https://doi.org/10.1017/njg.2018.3). This palaeo-surface topography (palaeoDEM) was compiled by interpolating the vertical position of the top of the typical natural-levee lithology dating to the Roman period (e.g. loams, sandy clays) derived from the lithological-borehole data (Pierik et al., Reference Pierik, Stouthamer and Cohen2017). This dataset has been corrected for younger clay sedimentation on abandoned levees and normalised for the delta-plain gradient (around +8 m OD in the east to around −1 m OD in the west). This normalisation was performed by subtracting groundwater-level reconstructions dated to 2000 years BP (Cohen, Reference Cohen2005; Koster et al., Reference Koster, Stafleu and Cohen2016) from the palaeo-surface reconstruction. The resulting map shows the elevation of the landscape relative to the reconstructed past groundwater level in the delta, and therefore allows different regions within the delta to be compared to each other. Actively forming levees, dike-breach deposits of post-Roman active rivers, and embanked floodplains were omitted from the palaeoDEM, because they hamper the reconstruction of past landscape elevation and only make up a very small percentage of the total surface area.
Palaeo-elevation model of the Rhine–Meuse delta during the first millennium (adapted from Pierik et al., Reference Pierik, Stouthamer and Cohen2017).

3.3. Past land-use scanner (PLUS)
The PLUS modelling framework integrates cultural and natural factors in order to simulate past land use on a regional level and was developed for the western Netherlands (De Kleijn et al., in press). This approach has its roots in economic theory and is derived from a contemporary land-use scanner which originally was developed in order to predict land-use development in the near future based on policy maps (Hilferink & Rietveld, Reference Hilferink and Rietveld1999; Koomen & Borsboom-van Beurden, Reference Koomen and Borsboom-Van Beurden2011). The PLUS model simulates the allocation of land use by mimicking the spatial competition between different land-use types, combining the estimated regional demand with the suitability for various land-use types. For each land-use type the suitability is determined based on a combination of physical-landscape characteristics, economic-distance relations, political factors and sociological aspects. This suitability is confronted with a demand for land use which can be derived from, for instance, palaeodemographic reconstructions (cf. this study). Combining the two, the PLUS allocates the required land to the most suitable location (De Kleijn et al., in press).
4. Method
The relative impact of population fluctuations on past land use was modelled through the simulation of various land-use scenarios (Fig. 4). The number of simulated scenarios was determined by testing the feasibility of the archaeological hypotheses outlined above (Table 1).
Flowchart of the PLUS land-use simulation model. Land-use suitability maps were compiled for AD 100, 500 and 900. Land-use suitability is based on elevation classes derived from the palaeo-elevation model (A; palaeo-DEM) and on geomorphology-based lithological reconstructions (C). Geomorphological data were refined using palaeo-elevation data (A) and soil data (B). Twenty land-use scenarios testing three archaeological hypotheses (Table 1) were calculated by combining the land-use suitability maps with detailed reconstructions of Roman and early-medieval population numbers (see Appendix A (available online at https://doi.org/10.1017/njg.2018.3) for details).

4.1. Palaeodemographic modelling
In order to determine population numbers and fluctuations, palaeodemographics were reconstructed for each ABR subperiod (see Appendix A (available online at https://doi.org/10.1017/njg.2018.3) for a detailed description). Total population numbers were determined by calculating the size of the rural population and adding the number of people living in exceptionally large settlements or in a military context.
Rural population
Both during the Roman period and the Early Middle Ages the majority of people in the Rhine–Meuse delta lived in rural settlements. Larger settlements, in some cases very large, were exceptional. Rural population numbers per ABR subperiod were calculated by applying the following SDM to the study area:
 $$\begin{equation}
{\rm{Rp}} = ({S_{\rm{v}}} + {S_{\rm{u}}}){\rm{\ }} \times \delta \times \alpha
\end{equation}$$
$$\begin{equation}
{\rm{Rp}} = ({S_{\rm{v}}} + {S_{\rm{u}}}){\rm{\ }} \times \delta \times \alpha
\end{equation}$$
Rp rural population
S v number of verified settlements
S u number of (probable) undiscovered settlements
δ average number of houses per settlement (constant)
α average number of individuals per house (constant)
In this equation rural population (Rp) is calculated by multiplying the number of verified and (probable) undiscovered settlements (S v and S u) in an area by the average number of houses per settlement (δ), and by household size (α). The total number of settlements is derived from both excavated and undiscovered settlement data, since archaeological research has demonstrated that in the Netherlands on average at least 50% of settlements are not (yet) discovered (Bult, Reference Bult1983; Deuben et al., Reference Deeben, Groenewoudt, Hallewas, Van Rooijen and Zoetbrood2006). In the calculations we included only settlement data with a high chronological resolution, i.e. dating to a specific ABR subperiod. The average number of houses per settlement and the average household size per ABR subperiod were determined based on estimates published in archaeological excavation reports and overview studies (Table 3; see Appendix A (available online at https://doi.org/10.1017/njg.2018.3) for a more detailed description of the archaeological data underlying these and other demographic estimates).
Average number of houses and household size per ABR subperiod based on (published) archaeological-excavation data. Sources were selected for sites and regions within and in direct vicinity of the study area.

Large settlements
Large settlements were classified based on a settlement size of >5 ha. We based population numbers for these large settlements on settlement size, building density of houses and average household size. Quantitative data from well-researched and -documented large settlements, such as Roman Nijmegen and early-medieval Dorestad, were used as a reference frame for reconstructing population numbers in other, less-known, contemporary large settlements.
Military presence
During the Roman period the study area bordered on, and in part constituted, the northern frontier of the Roman Empire, and therefore was characterised by a substantial military presence (e.g. Van Es, Reference Van Es1981; Polak Reference Polak, Morillo, Hanel and Martín2009). The estimates of the number of troops during the ERP, MRP and LRP are based on historical sources (e.g. containing information about size of Roman legions and fortresses) and archaeological studies (e.g. publications about excavated fortresses in the study region; see Appendix A, available online at https://doi.org/10.1017/njg.2018.3). We used well-documented military sites as a frame of reference for less-known fortresses (Table 6, further below). Military presence in the palaeodemographic modelling includes Roman fortresses (castella and castra) and the associated civilian settlements (vici and canabae legionis). Based on research by Van Dinter et al. (Reference Van Dinter, Kooistra, Dütting, Van Rijn and Cavallo2014) we have set the average size of military presence in the castella at 350 soldiers. Much less is known about the corresponding vici. Some have suggested that the number of people living in a vicus may have been twice the number of soldiers in the corresponding castellum (e.g. Sommer, Reference Sommer1984, Reference Sommer, Maxfield and Dobson1991). Judging by the size and building-density of vici in the study area (e.g. Hazenberg, Reference Hazenberg2000; Ploegaert, Reference Ploegaert2006; Blom & Vos, Reference Blom and Vos2007; Vos et al., Reference Vos, Van der Linden and Voormolen2012; Waasdorp & Van Zoolingen, Reference Waasdorp and Van Zoolingen2015), this estimate must be too high. Van Dinter et al. (Reference Van Dinter, Kooistra, Dütting, Van Rijn and Cavallo2014, p. 29) for the western part of the Dutch limes have concluded that their assumption of 350 soldiers per fort and an equal number of people living in the associated vicus could well be a maximum estimate. Therefore, we applied a 1 : 1 ratio in the palaeodemographic modelling. The exceptionally large Roman castra and canabae legionis at Nijmegen (c. AD 70–104) were modelled separately. Although both, according to most literature, date to the very beginning of the MRP, the Roman military presence in Nijmegen was a direct consequence of a preceding ERP event (the revolt of the Batavi in AD 69–70), and was not characteristic of the MRP. Subsequently we included these numbers in the ERP-population reconstruction.
4.2. Land-use suitability
A map of the suitability of the landscape for specific types of land use was separately reconstructed for AD 100, 500 and 900. Land-use suitability was determined for each geomorphological unit based on the ecological preferences of different vegetation types (Westhoff et al., Reference Westhoff, Bakker, Van Leeuwen and Van der Voo1970a,Reference Westhoff, Bakker, Van Leeuwen and Van der Voob,Reference Westhoff, Bakker, Van Leeuwen and Van der Vooc; Weeda et al., Reference Weeda, Westra, Westra and Westra1985, Reference Weeda, Westra, Westra and Westra1987, Reference Weeda, Westra, Westra and Westra1988, Reference Weeda, Westra, Westra and Westra1991, Reference Weeda, Westra, Westra and Westra1994, Reference Weeda, Schaminée and Van Duuren2000, Reference Weeda, Schaminée and Van Duuren2003, Reference Weeda, Schaminée and Van Duuren2005). Allocation factors were ascertained based on a combination of geomorphological units, palaeo-surface elevation data and lithological data (see Appendix B (available online at https://doi.org/10.1017/njg.2018.3) for a detailed description). Based on the predefined archaeological hypotheses (Table 1) and in line with Kooistra et al. (Reference Kooistra, Van Dinter, Dütting, Van Rijn and Cavallo2013) and Van Dinter et al. (Reference Van Dinter, Kooistra, Dütting, Van Rijn and Cavallo2014) we have differentiated between three specific land-use types: arable farming, pasture and meadow (Appendix B, available online at https://doi.org/10.1017/njg.2018.3). Each geomorphological unit was given a value ranging from 0 to 5, with a value of 0 reflecting no potential and 5 reflecting the highest potential for a specific type of land use. The current model exclusively focused on reconstructing the impact of palaeodemographics on arable farming, pastures and meadows. Therefore it excludes processes such as logging and woodland regeneration and we kept the amount of woodland constant for all scenarios.
4.3. Land-use modelling
The land-use suitability data and palaeodemographic data were integrated in a newly adapted PLUS for the fluvial-dominated part of the Rhine–Meuse delta.
Integrating cultural and environmental data
Land-use scenarios were modelled using the geomorphological reconstructions for AD 100, 500 and 900 (Section 3.2). Settlement data per ABR subperiod (Table 2) were integrated by converting them to fit the chronological resolution of the geomorphological time slices (Fig. 5). We applied the same ‘ABR subperiod to geomorphological time slice’ conversion as Van Lanen & Pierik (Reference Van Lanen and Pierik2017) already performed for the same research area, with the AD 100 time slice reflecting the ERP and MRP, the AD 500 time slice the LRP, EMPA and EMPB and the AD 900 time slice the EMPC and EMPD.
Chronological division of subperiods based on the Archaeological Basic Register: early-Roman period (ERP), middle-Roman period (MRP), late-Roman period (LRP), early-medieval period A (EMPA), early-medieval period B (EMPB), early-medieval period C (EMPC) and early-medieval period D (EMPD). Each subperiod was linked to a single geomorphological-landscape reconstruction representing the situation in c. AD 100, 500 or 900.

The PLUS model
Originally the PLUS modelling framework was developed for the Lower Rhine delta in the western Netherlands (De Kleijn et al., in press). This initial PLUS has integrated calculations derived from a conceptual model which reconstructs whether or not the local population could have supplied the Roman army in this region with food (Kooistra et al., Reference Kooistra, Van Dinter, Dütting, Van Rijn and Cavallo2013; Van Dinter et al., Reference Van Dinter, Kooistra, Dütting, Van Rijn and Cavallo2014). By integrating data from this conceptual model in this initial PLUS the applicability of the modelling framework for calculating past land use was demonstrated.
In the present study we apply a similar PLUS to the central and upstream parts of the Rhine–Meuse delta, chronologically expanding it to cover the whole of the first millennium, and adapting it to further explore its potential to test the feasibility of archaeological hypotheses (Table 1). The model uses the grid-cell resolution (100 × 100 m), software and land-use modelling ‘rules’ on energy intake, average yield, and distance relations defined by De Kleijn et al. (in press; Appendices B and C, available online at https://doi.org/10.1017/njg.2018.3). The PLUS applied in this paper is based on the assumption that the land-use modelling ‘rules’ are valid for the whole of the first millennium AD. The model was designed to simulate 20 land-use scenarios fully testing the feasibility of the archaeological hypotheses under investigation (Table 8, further below; Appendix D, available online at https://doi.org/10.1017/njg.2018.3). Following the three hypotheses, scenarios 1–14 calculate the possibility of the natural landscape providing sufficient arable land, meadows and pastures in order to remain self-sufficient during the first millennium. Scenarios 15–18 specifically focus on the impact of Roman military population numbers, and scenarios 19 and 20 deal with the influence of early-medieval Dorestad, which was an exceptionally large trade centre. As already stated, archaeological research indicates that (at least) 50% of the first-millennium settlements in the present-day Netherlands are still undiscovered (Section 4.1). To compensate for this discrepancy, we calculated land-use scenarios based on two settlement settings: (1) using excavated settlements only; and (2) using excavated settlements plus the same amount of undiscovered settlements (Table 8, further below). Additionally, scenarios 17–20 include the impact of possibly imported food on local landscape-based production requirements.
5. Results
5.1. Demographic reconstructions
During the Roman period major shifts in rural population size occurred, consisting of a strong rise towards the MRP and an equally strong decline during the LRP (Table 4). The same trend holds for the end of the Early Middle Ages, during the EMPC and EMPD. Most notable is the population decline between the MRP and LRP, when rural population in the Rhine–Meuse delta decreased by 79.5%. Rural population remained low until the EMPC, after which a steady rise occurred which continued during the remainder of the Early Middle Ages.
Estimated rural population in the study area based on archaeological data, building density and household size.

Large settlements
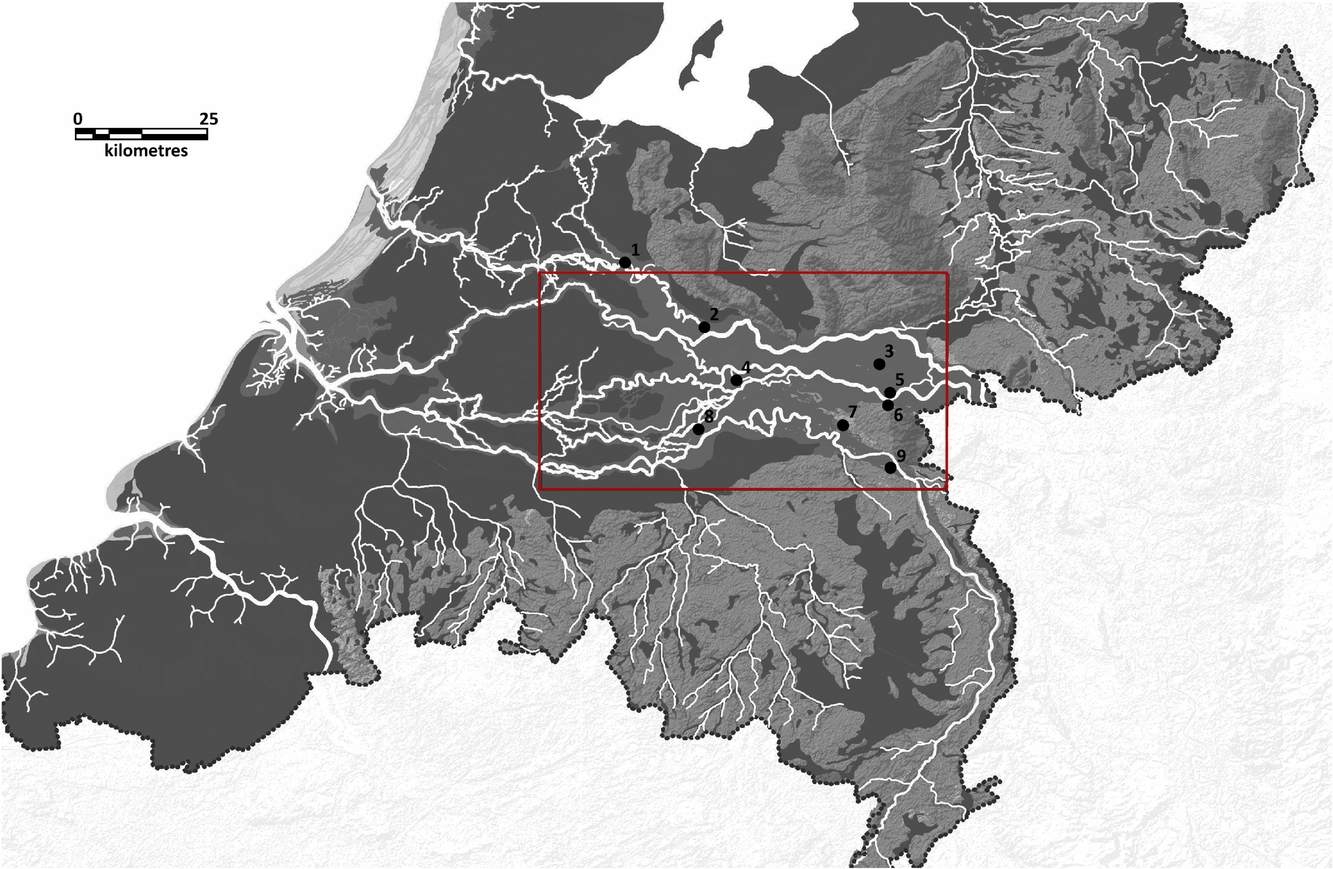
Large settlements were rare during the first millennium AD and only few could be identified for the MRP, EMPB, EMPC and EMPD (Table 5; Fig. 6; Appendix A, available online at https://doi.org/10.1017/njg.2018.3). During the MRP the first signs of low-level urbanisation occurred, with rural centres developing at Elst, Cuijk, Rossum and Wijchen. The largest settlement during the MRP however developed at Nijmegen, consisting of the Roman town Ulpia Noviomagus Batavorum (c. 5000 inhabitants). In line with the drop in rural population, no large settlements are known in the following LRP. The first post-Roman large settlements, clearly smaller than their Roman predecessors, appeared again in the eastern part of the study area during the EMPB at the present towns of Nijmegen and Lent. The most notable influx of people living in large settlements occurred during the EMPC with the development of Dorestad. As already stated, this early-medieval emporium was exceptionally large.
Overview of Roman and early-medieval large settlements located in the study area.

Large settlements in and near the study area: 1 = Utrecht, 2 = Dorestad, 3 = Elst, 4 = Tiel, 5 = Lent, 6 = Nijmegen, 7 = Wijchen, 8 = Rossum and 9 = Cuijk. Data are overlain on the palaeogeographic reconstruction of AD 100, adapted from Vos & De Vries (2013).
Military presence
Archaeological data about military presence are only available for the Roman period. During the ERP and MRP 15 Roman fortresses, consisting of 14 castella and 1 castra accompanied by an equal number of vici and canabae legionis, were located in (the direct vicinity of) the study area (Table 6; Fig. 7; Appendix A, available online at https://doi.org/10.1017/njg.2018.3). During the (end of the) ERP, military numbers were much higher than during the MRP, which was mainly due to the short presence of the 10th legion at the castra in Nijmegen (Appendix A, available online at https://doi.org/10.1017/njg.2018.3).
Military presence in the study area during the Roman period. Calculations are based on historical sources, archaeological data and (for the LRP) on oral communication of Dr S. Heeren. See Appendix A (available online at https://doi.org/10.1017/njg.2018.3) for a complete list of castella and castra names including corresponding population numbers.

Roman military sites in and near the study area: 1 = Woerden, 2 = Utrecht: De Meern, 3 = Utrecht: Domplein, 4 = Vechten, 5 = Rijswijk, 6 = Maurik, 7 = Kesteren, 8 = Randwijk, 9 = Driel, 10 = Arnhem, 11 = Huissen, 12 = Duiven, 13 = Herwen, 14 = Nijmegen and 15 = Rossum. Certain locations are depicted in black (circles), uncertain and approximate locations in white (circles). Data are overlain on the palaeogeographic reconstruction of AD 100, adapted from Vos & De Vries (2013).

After the collapse of the Roman limes around AD 270, Roman military presence in the Rhine–Meuse delta declined significantly. Due to several changes in Roman defence policy, such as the introduction of the limitanei (e.g. Van Daele, Reference Van Daele2003) and declining Roman influence in the area, the number of military sites after AD 270 was significantly lower than during the ERP and MRP (Table 6; Appendix A, available online at https://doi.org/10.1017/njg.2018.3).
Total-population estimates, Rhine–Meuse delta
Palaeodemographics were reconstructed based on rural population numbers, large settlements, and military presence (Table 7; Fig. 8). Calculated total estimates show the same trend as the rural population fluctuations, underlining the dominant influence of rural population numbers on first-millennium palaeodemographics. A strong population increase occurred during the MRP (43.2%), mainly facilitated by a growth of rural population numbers as well as by an increase of large settlements. A significant population decline occurred during the LRP (by 78.7%), mainly due to an overall decrease of rural population numbers and large settlements, and a decreased military presence. Significant demographic growth occurred from the EMPC onwards. During the heydays of Roman occupation, the MRP, Roman military presence was relatively low and the level of urbanisation was high (Table 7). However, the highest level of urbanisation occurred during the EMPC, mainly due to the development of a trade centre at Dorestad (26.5%).
Estimated total population in the study area based on archaeological data, settlement size, structure and density. For each ABR subperiod the relative contribution of military presence (i.e. active soldiers) and urbanisation on total population numbers is provided.

Reconstructed palaeodemographic trends in the Rhine–Meuse delta during the first millennium AD. For each of the ABR subperiods the total population size, the number of rural inhabitants, the number of large-settlement inhabitants and the number of the military population are given.

5.2. Land-use scenario modelling
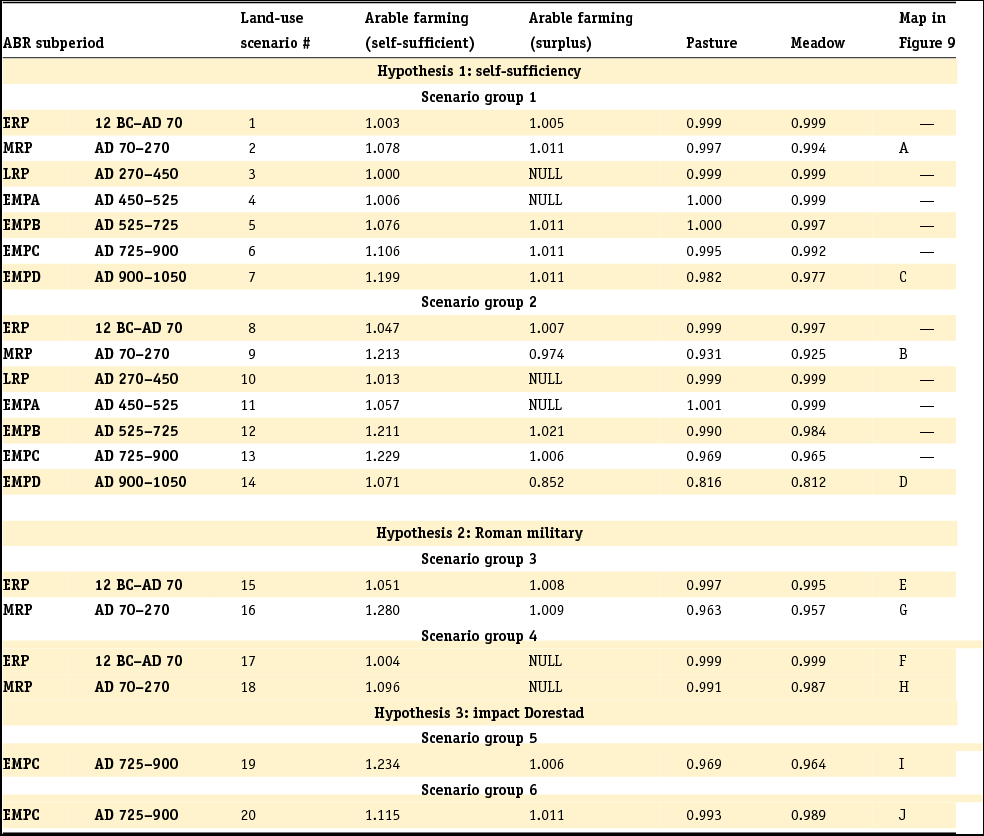
The tested archaeological hypotheses are (Table 1): (1) inhabitants of the study area were self-sufficient in terms of food supply during the whole of the first millennium AD (Section 5.2.1); (2) during the first centuries of this millennium Roman military presence had major consequences in terms of food supply and landscape (Section 5.2.2); and (3) the development of Dorestad had major consequences in terms of food supply and landscape during the Early Middle Ages (Section 5.2.3).
5.2.1. Hypothesis 1: self-sufficient food supply during the first millennium AD
The possibility of self-sufficiency in terms of food supply during the first millennium AD was tested in scenarios 1–14, scenario groups (SGs) 1 and 2 (Table 8; Fig. 9). In SG 1 the options for self-sufficiency were simulated per ABR subperiod based on the minimum numbers of settlements, i.e. only using the number of excavated sites. In SG 2 these same options were simulated, but now assuming that 50% of the settlements are not yet discovered (i.e. using the maximum number of settlements; Section 4.1). Results show that in 13 of the 14 tested scenarios self-sufficiency for rural and large settlements was not a problem in the study area (Table 8; Fig. 9). Even with the maximum number of settlements, during most ABR subperiods the landscape provided abundant space for arable land, meadows and pastures. Only in scenario 14 (SG 2) did population impact result in such a high demand that the models’ boundary conditions for the EMPD were exceeded. Within the defined model settings (Section 4.3; Appendices B and C) the high demand resulted in a situation in which the natural landscape provided insufficient land-use options. In this scenario, the model simulates the specific challenge of producing sufficient surplus to also provide for the larger settlements during this period. This is also demonstrated by the fact that all grid cells were designated for a specific type of land use (unused land = null), suggesting that the landscape within the model settings was used to its full potential (Fig. 9A–D).
Land-use scenario calculations based on the predefined hypotheses (Table 1). Hypothesis 1 = scenarios 1–14, hypothesis 2 = scenarios 15–18, and hypothesis 3 = scenarios 19 and 20. The calculated numbers depict the degree of realisation, i.e. the extent to which the demand could be met (1 = 100% and 0 = 0%), and ‘NULL’ indicates no grid cells containing this type of land use. See Appendices B, C and D (available online at https://doi.org/10.1017/njg.2018.3) for a detailed description of the applied methods, the calculated numbers and each scenario.
Selected land-use scenarios calculated by PLUS. Hypothesis 1 (Table 1): selection of ABR subperiods MRP (A and B) and EMPD (C and D). MRP: (A) = scenario type: self-sufficiency simulation based on minimum number of settlements, (B) = scenario type: self-sufficiency simulation based on maximum number of settlements. EMPD: C = scenario type: self-sufficiency simulation based on minimum number of settlements, (D) = scenario type: self-sufficiency simulation based on maximum number of settlements. The scenarios depicted in B and D show that the landscape was used to its full potential and that self-sufficiency was hard to obtain (B) or even unobtainable (D). Hypothesis 2 (Table 1): impact of the Roman army during the ERP and MRP in the four simulated scenarios (E–H). ERP: (E) = scenario type: maximum number of settlements locally provided food for both military sites and large settlements, (F) = scenario type: minimum number of settlements locally provided food for only military sites, and large settlements depended on imported food. MRP: (G) = scenario type: maximum number of settlements locally provided food for both military sites and large settlements, (H) = scenario type: minimum number of settlements locally provided food for only military sites, and large settlements depended on imported food. Hypothesis 3 (Table 1): impact of Dorestad on the natural landscape (through an increasing food demand) during the EMPC in the two simulated scenarios (I and J). EMPC: (I) = scenario type: the maximum number of settlements were self-sufficient and provided 50% of the food demand of Dorestad, (J) = scenario type: the maximum number of settlements were self-sufficient and Dorestad was provided with 100% imported food. The corresponding land-use scenarios (Sc) are (Table 8): A = Sc2, B = Sc9, C = Sc7, D = Sc14, E = Sc15, F = Sc17, G = Sc16, H = Sc18, I = Sc19, and J = Sc20. Please note: Since the model does not include processes such as logging or woodland regeneration we have kept the amount of woodland constant for all scenarios. Consequently this landscape unit equals unused land and does not influence the modelling outcome.

5.2.2. Hypothesis 2: the impact of Roman military presence
The impact of Roman military presence was calculated for the ERP and MRP in land-use scenarios 15–18 (SGs 3 and 4; Table 8). First, we analysed the hypothetical situation in which the study area contained the maximum number of settlements, and in which the Roman army and large settlements were supplied exclusively using locally produced food. Second, we calculated the impact of Roman military presence for the situation in which the study area contained the minimum number of settlements and in which the large settlements were supplied with food through import. The results show that in all four scenarios despite major impact differences, the landscape in the delta provided sufficient opportunities to produce food for the Roman military occupation and was not a limiting factor (Table 8; Fig. 9E–H).
5.2.3. Hypothesis 3: the impact of early-medieval Dorestad
In order to determine the impact of the estimated 10,000 inhabitants of early-medieval Dorestad we calculated two scenarios, 19 and 20 (SGs 5 and 6; Appendix D, available online at https://doi.org/10.1017/njg.2018.3). In combination with scenario 13, these scenarios depict the maximum number of settlements in the study area and calculate the claim on the natural landscape in the hypothetical situations that Dorestad was supplied locally (zero food import), by 50% food import outside the study area, and by 100% food import outside the study area. The results of these scenarios show a limited impact of the 10,000 inhabitants of Dorestad on the natural landscape (Table 8; Fig. 9I–J), which implies that even during the more densely populated EMPC, abundant options for arable farming, meadows and pastures were available in the study area. The different scale of impact between scenarios 19 and 20 underlines the relatively large impact of import on the natural-landscape demand. Despite this clear difference, the amount of import was not a decisive factor as the natural was not a limiting factor in either of the simulations.
6. Discussion
6.1. Scenario modelling
Thirteen of the 14 tested scenarios for hypothesis 1 indicate that the natural landscape in the study region during the first millennium AD was not a limiting factor for self-sufficiency in terms of food supply. This implies that in general the landscape of the Rhine–Meuse delta provided sufficient options for arable farming, meadows and pastures during the first millennium AD (Section 5.2; Table 8). The results additionally demonstrate that the PLUS modelling framework, which was initially designed for predicting land-use development in the future, is useful for reconstructing bandwidths of past cultural-landscape change. Only one of the simulations, scenario 14, showed that self-sufficiency during the EMPD was hard to obtain. In addition, scenario 9 showed that obtaining self-sufficiency during this period required the full use of the landscape (Table 8). These deviating results are caused by the fact that these scenarios used the maximum number of settlements (Section 4.1). This might indicate that the assumed maximum number of undiscovered settlements (equal to the number of known settlements) is too high for this particular region and should be reassessed, or food was obtained from regions outside of the study area.
The PLUS applied in this paper is a first exploration of the applicability of simulation modelling as a means of testing existing archaeological hypotheses regarding past land use in the Netherlands. The applied model was derived from a similar PLUS developed for the Lower Rhine region during the ERP and MRP in the western Netherlands (De Kleijn et al., in press; also see this paper for a more detailed discussion on the full application potential of the PLUS framework). In the PLUS presented in the current study we assume that distance relations such as the maximum travel time from settlement to field, pasture or meadow remained relatively constant throughout the first millennium. Although the model primarily has a hypothesis-testing purpose, increasing the differentiation in land-use rules between the Roman and early-medieval periods (e.g. including socio-economic differences) might allow for a more in-depth assessment of the full reconstructive potential of the PLUS framework.
The current model exclusively focuses on reconstructing the impact of palaeodemographics on arable farming, pastures and meadows. As such we kept the areal extent of woodland constant for all scenarios. As an artefact of this assumption, the maps now suggest that wood was preferentially present on levees, whereas meadows and pastures occurred in the adjacent floodbasins. This causes woodland on levees to be overestimated in the model results compared to results from palynological studies, which show that levees were the first parts in the river area to be deforested; often these areas were already deforested in the ERP (Teunissen, Reference Teunissen1990; Kooistra, Reference Kooistra1996; Kalis et al., Reference Kalis, Karg, Meurers-Balke, Teunissen-van Oorschot and Traiana2008; Van Dinter et al., Reference Van Dinter, Cohen, Hoek, Stouthamer, Jansma and Middelkoop2017). This is supported by archaeological records that show a shift in the origin of the used wood to wetter localities (Kooistra, Reference Kooistra1996). It should be noted that it would probably only slightly influence present modelling results in terms of carrying capacity for arable land, pasture and meadow since it would mean that more suitable land is available. However, since timber is the primary building material in the Netherlands during the first millennium and often was used as a source for fuel, the model could be expanded to also include woodland as a fourth type of land use. This class can additionally be subdivided into dry forest and a wet forest (alder carr), which would have been located on the levees and in the floodbasins respectively.
6.2. Palaeodemography
Only settlements dating to specific ABR subperiods such as the ERP, MPR or LRP were included in the palaeodemographic reconstructions (Table 2; Section 4.1). Settlements dating to overarching ABR periods (Table 2) were excluded from the analyses since these do not provide high-resolution chronological data, and since their documentation often reflects inconsistencies in data administration. The reconstructed rural population numbers therefore might be a conservative estimate. However, the reliability of the presented results is supported by previous population estimates for the civitas Batavorum during the MRP (a region largely corresponding to our study area) by Vossen (Reference Vossen, Grünewald and Seibel2003) and by Willems et al. (Reference Willems, Enckevort, Haalebos and Thijssen2005), which derive between a minimum of 50,000 and an absolute maximum of 120,000 inhabitants. Nonetheless, the current demographic reconstructions might benefit from a more detailed analysis of settlement data per ABR (sub)period. Generally, the Roman period provides the highest chronological resolution in settlement data. This is mainly due to: (1) the general recognisability of Roman material culture in our study area, facilitating well-developed typologies and precise dating; and (2) this recognisable Roman-period division being built up out of relatively short time intervals. However, since our analyses cover a relatively large study area and long time period (over 1000 years), the least accurately dated sites constitute the bottleneck. A recent study by Verhagen et al. (Reference Verhagen, Vossen, Groenhuijzen and Joyce2016b) presents a potentially promising detailed and statistical approach for increasing the chronological resolution of settlements in parts of the Rhine–Meuse delta. Such, or other, approaches might increase the chronological resolution of the dataset and also might help to determine the added value of including merely ABR-period dated settlements in palaeodemographic reconstructions.
Low-level urbanisation appears to have been of limited influence on total population numbers (rural and military numbers) during the Roman and early-medieval periods (Table 7). Increases of rural population numbers and large settlements occurred synchronously during the whole of the first millennium and there are no signs of large settlements extracting people from the countryside. During the MRP, only 11.1% of the total population lived in large settlements (Section 5.1; Fig. 8; Table 7). Additionally, with the exception of the Roman town at Nijmegen (Ulpia Noviomagus Batavorum), none of the larger settlements were officially designated as Roman towns (Municipia) and most were characterised by a few urban features only (e.g. monumental buildings, stone works). If we take this into account and only include the Municipia in the calculations, the percentage of people living in an urbanised context drops even further to 5.9%. This low percentage is in line with urbanisation levels during the EMPB and EPMD. A major ‘urbanised’ exception is the EMPC, when 26.5% of the total population lived in large settlements (of which 86.8% inhabited the emporium of Dorestad; Table 5). However, if we assume that these extremely high percentages may reflect an overestimation by Van Es & Verwers (Reference Van Es and Verwers2015) of the number of people simultaneously living in Dorestad, and recalculate the urbanisation percentage using older demographic estimations for Dorestad (i.e. c. 2500–4000 inhabitants; Van Es, Reference Van Es, Besteman, Bos and Heidinga1990), the results still imply that 10.4% of the total population at this time lived in an urbanised context. This is almost twice as much as urban population numbers during the remaining subperiods of the Early Middle Ages. It should be noted that the effects of these urbanised regions on rural settlements probably differed per ABR subperiod and deserve further investigation. Nonetheless, even though our estimates of rural population numbers most likely are conservative, the effects of urbanisation (the large settlements only) during the first millennium appear to have been limited in terms of food production capacity.
Military presence fluctuated throughout the Roman period (Fig. 8; Table 7). During the transition from ERP to MRP the relative contribution of Roman military numbers to the total population was highest, reaching 24.9%. During the heyday of Roman occupation, the MRP, the relative contribution of the Roman military was lowest, which is best explained by the strong increase of rural population numbers and by the political stability during this period. Although total Roman military numbers decreased during the LRP, the relative contribution of military presence in the total population rose to 14.0%, mainly due to synchronous rural population decline.
Population numbers for the EMPD are difficult to calculate because of changing settlement types and instability caused by Viking raids. During the largest part of the Early Middle Ages, settlements contained an average of three houses. However, during the EMPD, settlements generally became larger, more fixed in space and more nucleated, and contained an average of five houses (e.g. Hamerow, Reference Hamerow2002; Van der Velde, Reference Van der Velde2011; Van Beek et al., Reference Van Beek, Gouw-Bouman and Bos2015; Table 3). Additionally, the number of individual settlements appears to have decreased. It has been suggested that because of these changes in settlement size, the total number of archaeologically traceable settlement sites dating from this period decreased significantly (Van Beek et al., Reference Van Beek, Gouw-Bouman and Bos2015). However, this reduction in settlement numbers has also been explained by social unrest caused by increasingly frequent Viking raids (Henderikx, Reference Henderikx1986). Additionally, it is highly likely that the EMPD is underrepresented in the archaeological datasets because until recently material from this period was hard to identify (Bartels et al., Reference Bartels, Oudhof and Dijkstra1997). A more detailed analysis of settlement development during the transition period from the Early to High Middle Ages is needed to increase our understanding of EMPD palaeodemographics.
A main assumption of this study is that around 50% of Roman and early-medieval rural settlements in the study area are undiscovered (Section 4.1). However, the archaeological visibility of settlements varies per period and region, mainly due to period-specific differences in the manner in which these settlements manifest themselves in the archaeological record. The layout, recognisability, quantity and density of archaeological finds and features are crucial for the chronological interpretation of settlements. Consequently, these differences directly influence the archaeological visibility of settlements (Groenewoudt, Reference Groenewoudt1994; Groenewoudt & Smit, Reference Groenewoudt, Smit, Lauwerier, Eerden, Groenewoudt, Lascaris, Rensink, Smit, Speleers and Van Doesburg2017). By further studying differences in material manifestations through time, visibility parameters can be determined for each ABR subperiod, enhancing the accuracy of past-population estimates, land-use simulations and settlement-location predictions (Hey & Lacey, Reference Hey and Lacey2001; Tol et al., Reference Tol, Verhagen, Borsboom and Verbruggen2004; Rensink et al., Reference Rensink, De Kort, Van Doesburg, Theunissen, Bouwmeester, Lauwerier, Eerden, Groenewoudt, Lascaris, Rensink, Smit, Speleers and Van Doesburg2017).
6.3. Methodological considerations
This study is a first exploration of evidence-based modelling of first-millennium population development and of using these quantitative demographic data to test archaeological hypotheses about past land use. By using high-resolution (bio)archaeological data we were able to reconstruct past population numbers and to calculate their corresponding impact on land use and the limits of the natural landscape in the Rhine–Meuse delta. The presented calculations and simulations are primarily based on general high-resolution estimates of food consumption during the Roman period by Kooistra et al. (Reference Kooistra, Van Dinter, Dütting, Van Rijn and Cavallo2013) and Van Dinter et al. (Reference Van Dinter, Kooistra, Dütting, Van Rijn and Cavallo2014). The PLUS modelling framework however is designed to incorporate, and to base calculations on, a multitude of cultural variables (De Kleijn et al., in press). The model could therefore be expanded to include, among others, more detailed (quantified) data representing socio-cultural variables such as property rights, organisation structures, political boundaries, and technological innovations. The same holds true for more detailed land-use and natural-landscape variables such as crop changes, crop rotations and the impact of flooding. Adding such high-resolution data surely will further enhance the accuracy of the modelling results.
Palaeodemographic and land-use dynamics occurred on a variety of scales, ranging from local self-sufficiency to more large-scale patterns of long-distance transport. Van Lanen & Pierik (Reference Van Lanen and Pierik2017) already concluded that these spatial-social manifestations are part of a larger system, which they termed ‘connectivity patterns’. Researching phenomena such as palaeodemographics and land use requires methods and techniques equally reflecting this multi-scale variability. For example, palaeodemographic research can encompass studying past DNA and isotope data, both of which are very useful for reconstructing local-population variables such as diet, disease, mortality and mobility. However, these data currently still are restricted to mainly local overviews and lack large-scale data coverage. Consequently, at present they are less suited for large-scale population reconstructions. The challenge for palaeodemographic modelling in the near future is to bridge the gap between these scale differences. The new PLUS modelling framework has proven to be very promising in this respect, since it facilitates the combination, extrapolation and interpolation of data on multiple scale levels.
Although in the study area low-level urbanisation appears to have been of limited influence on population development (Section 6.2; Fig. 8; Table 7), further research into the exact influence of specific demographic and urbanisation processes, such as the percentage of people moving from the countryside to urban centres, average mortality, diseases, and fertility, might improve our understanding of past-population development. Verhagen et al. (Reference Verhagen, Joyce and Groenhuijzen2016a) already propagated the use of agent-based modelling (ABM) incorporating such processes for past-population reconstructions (Section 2). However, although ABM shows great promise in reconstructing such specific palaeodemographic processes, the accuracy of its results largely depend on the amount of available data. Therefore at present this approach is less suited for large-scale, evidence-based population reconstructions. To overcome this challenge, when reconstructing palaeodemography we propose the use of a combination of different (simulation-)modelling techniques facilitating a multi-proxy and multidisciplinary approach which incorporates a wide range of socio-cultural variables such as we have explored in this study.
6.4. Outlook
The PLUS simulation modelling applied in this study shows great promise regarding the integration of cultural and natural variables. However, it would be interesting to subject the model to a more extreme stress test in order to determine the current frameworks’ computational limitations. By adding increasing numbers of cultural and/or natural variables into the calculations, the models’ limits can be determined. In addition, the presented PLUS was developed for specific hypotheses-testing purposes in the Rhine–Meuse delta. It would be interesting to further test its applicability on other study regions, time intervals and landscape settings. The current PLUS proves itself very useful for at least delta regions and could easily be adapted for other similar regions in the world; however, applicability of this simulation framework should also be possible for non-delta regions both inside and outside the Netherlands. Furthermore, it would be interesting to adapt the PLUS to not only have a hypothesis-testing function, but also to investigate the reconstructive potential of this modelling framework. This can be achieved by further testing the models’ outcomes with high-resolution archaeological reconstructions. This, however, would require either larger amounts of high-resolution archaeological data, or working on much smaller spatial scales.
An important next step is to explore and validate our results by comparison with: (1) potential vegetation overviews which are based on the link between geomorphological units and vegetation preferences (Section 4.2); and (2) highly detailed vegetation reconstructions in line with Van Beek et al. (Reference Van Beek, Gouw-Bouman and Bos2015). Most vegetation reconstruction models and methods focus on the reconstruction of forest cover; since our approach did not include forest comparisons, vegetation reconstructions of this type are at the moment not possible. Additionally, it could prove most interesting to further analyse the impact of population trends and land-use changes on the natural-landscape development and identify relevant feedback mechanisms. Such analyses might provide more insight into how, for example, certain landscape dynamics trigger specific land-use systems or how regional water systems or avulsion processes influence first-millennium water management policies (e.g. the construction of dikes, culverts or sluices). Therefore, combining more high-resolution archaeological, palynological and geomorphological data in the future certainly will improve the resolution of the suitability map (underlying the present land-use model) and equally its reconstructive potential.
The current study shows that population-size fluctuations directly influenced past land use, but also vice versa. Van Lanen (Reference Van Lanen2017) and Van Lanen & Pierik (Reference Van Lanen and Pierik2017) have already addressed the multi-scale complexity of connectivity patterns, which clearly contain factors such as land use and palaeodemography. By using simulation modelling such as the PLUS it has proved possible to (partly) quantify and integrate traditionally qualitative data such as population trends with corresponding impact on the natural landscape. In turn this allows for (1) more detailed and objectified tests of traditional hypotheses and (2) the further unravelling of the relative contribution of individual CPFs within specific cultural developments. Future research into the interaction between these CPFs and the added value of simulation modelling such as the PLUS framework in unravelling these complex interrelationships should show the full potential of the exploration presented in this paper.
7. Conclusion
In this study we reconstructed first-millennium palaeodemographics with a high temporal resolution, using an evidence-based approach. By integrating high-resolution archaeological and historical data, we were able to reconstruct Roman and early-medieval habitation on an ABR-subperiod level for the whole of the fluvial-dominated part of the Rhine–Meuse delta. The presented modelling approach has proven to be highly promising for demographic reconstructions, since: (1) the modelling outcomes correspond with other (single-period) population reconstructions (Section 6.2); and (2) the results are based on a quantitative and integrated approach using sizable archaeological datasets.
Through the presented palaeodemographic modelling we were able to quantify past population numbers and, as a result, determine the impact of changing population numbers on past land use and reconstruct the potential limits of the natural landscape. The results demonstrate that the adapted PLUS is very useful for testing the feasibility of general archaeological hypotheses regarding past palaeodemographics and human–landscape interactions. Despite major population-size fluctuations during the first millennium AD, the impact of population dynamics never exceeded the limitations of the natural landscape in the study area. A significant finding is that the impact of Roman military population numbers on the landscape in this area appears to have been limited and that all food during this period could have been supplied from local sources. The same conclusion was reached for Dorestad during the Early Middle Ages. Although the impact of imports in both SGs should not be underestimated, these were never a crucial factor since the natural landscape was never a limiting factor. In addition, the multi-scenario approach of the PLUS model is crucial for reconstructing bandwidths of cultural-landscape change, allowing the identification of possible tipping points when the impact on the landscape became too severe (Section 6.1).
The PLUS modelling framework facilitates a multidisciplinary approach allowing us to combine demographic and land-use reconstructions. Such an integrated approach is essential since palaeodemographic and past land-use dynamics occurred on multiple scales (Section 6.3). The results of the presented PLUS show the high capacity of this model to integrate cultural and natural variables, which is essential for reconstructing spatiotemporal frameworks of past cultural-landscape changes, such as varying population densities on the natural landscape and changing land-use systems.
Acknowledgements
This study is part of the research programme ‘The Dark Age of the Lowlands in an interdisciplinary light: people, landscape and climate in the Netherlands between AD 300 and 1000’ (www.darkagesproject.com) funded by the Netherlands Organisation for Scientific Research (NWO, section Humanities; 2012–2019: 360-60-110). The development of the PLUS received funding from the European Union's Seventh Framework Programme for research, technological development and demonstration under grant agreement nr. 603447 (FP7, Collaborative Project: HERCULES http://www.hercules-landscapes.eu/). The authors would like to thank Prof. Dr E. Jansma (Cultural Heritage Agency of the Netherlands and Utrecht University), Prof. Dr T. Spek (University of Groningen) and Dr B.J. Groenewoudt (Cultural Heritage Agency of the Netherlands) for their comments on earlier drafts of the paper. Special thanks go to Drs T. de Groot Cultural Heritage Agency of the Netherlands, Dr S. Heeren (Vrije Universiteit), Drs J. van Doesburg (Cultural Heritage Agency of the Netherlands), Dr H. van Enckevort (municipality of Nijmegen) and Drs C. van Rooijen (Cultural Heritage Agency of the Netherlands) for their invaluable help with the demographic reconstructions for the Roman and early-medieval periods and to Dr Eric Koomen (Vrije Universiteit) and Frank Beijaard, MA (Vrije Universiteit) for the development of the PLUS.
Supplementary material
To view supplementary material for this article, please visit https://doi.org/10.1017/njg.2018.3



