

1. INTRODUCTION
Roughly 200 million people around the globe live within 1 m of the current sea level (Stern, Reference Stern2006; Milne and others, Reference Milne, Gehrels, Hughes and Tamisiea2009), making improved projections of the rate of sea-level rise an international priority. The largest source of uncertainty in global sea level change projections comes from poor bounds on the rate of mass loss from the Greenland and Antarctic ice sheets (Shepherd and others, Reference Shepherd2012). Over the last two decades, the mass loss rate from Greenland ice sheet (GrIS) has increased rapidly from 1 to 6 cm equivalent global sea-level rise per 100 years (Vaughan and others, Reference Vaughan2013), with the greatest loss occurring at marine-terminating outlet glaciers (Straneo and others, Reference Straneo2013). This loss has been attributed to increased oceanic heat flux to the Greenland's glaciated margins (Holland and others, Reference Holland, Thomas, de Young, Ribergaard and Lyberth2008; Joughin and others, Reference Joughin, Alley and Holland2012; Straneo and Heimbach, Reference Straneo and Heimbach2013), which has been linked to increased calving rates including collapse of ice shelves and retreat of grounding lines (Pritchard and others, Reference Pritchard, Arthern, Vaughan and Edwards2009; Pollard and others, Reference Pollard, DeConto and Alley2015). The transfer of ocean heat to a glacier front depends on small-scale physical processes including exchange at fjord mouths, flow over sills and ice-ocean boundary layer physics. A better quantitative understanding of these processes is needed for improved estimates of the contribution of GrIS mass loss to projected sea-level rise (Bindschadler and others, Reference Bindschadler2013).
Petermann Gletscher (Fig. 1) drains 4% of the GrIS (Rignot and Kanagaratnam, Reference Rignot and Kanagaratnam2006) and is one of only five Greenland glaciers with a large floating ice shelf remaining today (Münchow and others, Reference Münchow, Washam, Padman and Nicholls2016). The discharge of ice across the grounding line is ~12 Gt a−1 (Rignot and Steffen, Reference Rignot and Steffen2008). Flow speeds average ~1 km a−1 but are 10–20% higher in summer than in winter (Nick and others, Reference Nick2012; Ahlstrøm and others, Reference Ahlstrøm2013). About 80% of the mass flux across the grounding line is lost through basal melting of the Petermann Gletscher ice shelf (PGIS) (Rignot and Steffen, Reference Rignot and Steffen2008), the remainder being lost through intermittent calving events (Münchow and others, Reference Münchow, Padman and Fricker2014) and through surface sublimation in winter and meltwater runoff in summer. The PGIS has evidently been relatively stable since the late 1800s, but large calving events in 2010 and 2012 dramatically reduced its length from 85 km in 2010 to ~50 km today (Münchow and others, Reference Münchow, Padman and Fricker2014).
(a) Surface imagery (MODIS Aqua, 30 April 2015) with the Nares Strait model domain (white box) and bathymetry (black contours show the 250, 500, 750 and 1000 m isobaths), showing the sea-ice arch at the transition between open water and sea-ice cover at Smith Sound.

The sensitivity of glaciers to large-scale climate variability depends on the details of the environment around their termini (Straneo and others, Reference Straneo2013). Petermann Gletscher terminates in Petermann Fjord which, in turn, opens into Nares Strait, the ~500 km long passageway separating Ellesmere Island and northwest Greenland, at Hall Basin (Fig. 1). Hall Basin is bounded to the north and south by Robeson and Kennedy channels (each ~30–35 km wide), respectively. The fjord has a maximum depth near 1100 m with a sill at its mouth that is 440 m deep (Johnson and others, Reference Johnson, Münchow, Falkner and Melling2011).
Nares Strait is an important conduit for freshwater (as ice and liquid) and heat between the Arctic Ocean and the western sub-arctic North Atlantic seas (Kwok, Reference Kwok2005; Münchow, Reference Münchow2016). Annual volume flux through Nares Strait varies between 0.7 and 1.1 Sv (1 Sv = 106 m3 s−1) while the liquid freshwater flux, relative to a salinity of 34.8 g kg−1, varies between 32 and 54 mSv on annual timescales (Münchow, Reference Münchow2016). The strait's steep terrain channels typically strong southward winds (Samelson and Barbour, Reference Samelson and Barbour2008). However, exchanges of buoyancy and momentum between the atmosphere and ocean are also affected by sea-ice cover within the strait. The sea-ice cover in Nares Strait regularly transitions from a mobile state during July–October when the sea-ice flux is southward out of the Arctic to a landfast state in winter when a lateral sea-ice arch (Fig. 1) forms across Smith Sound (Kwok, Reference Kwok2005). In some years, sea-ice arches may also form farther north in Robeson and Kennedy Channels (Preußer and others, Reference Preußer, Heinemann, Willmes and Paul2015).
The structural mechanics of sea-ice arches depend on internal stresses within the sea ice; these features have been modeled using both discrete and elastic-visco-plastic formulations (Sodhi, Reference Sodhi1977; Hibler and others, Reference Hibler, Hutchings and Ip2006; Dumont and others, Reference Dumont, Gratton and Arbetter2009). When present in Nares Strait, sea-ice arches block the southward flow of sea ice and typically result in landfast ice northward of the arch and polynyas southward of the arch (Fig. 1). Occasionally, ice arches do not form across Nares Strait, and sea ice remains mobile throughout the winter (e.g., in 2007, 2009, 2010). Without an ice arch the annual mean liquid freshwater transport increases by a factor of 2–3 (Münchow and others, Reference Münchow, Washam, Padman and Nicholls2016), while sea-ice flux increases by a factor of 5–10 compared with years with an ice arch (Kwok and others, Reference Kwok, Pedersen, Gudmandsen and Pang2010; P. Ryan and A. Münchow, unpublished information).
Shroyer and others (Reference Shroyer, Samelson, Padman and Münchow2015) used a high-resolution ocean model coupled to idealized sea-ice states to identify the processes by which winter landfast sea-ice cover affect the ocean circulation within Nares Strait. That study did not include Petermann Fjord, but it did suggest ways in which processes within Nares Strait might influence the flux of ocean heat into the fjord as a source of melting for PGIS. Here, we use an improved, fully coupled ocean and sea-ice regional model augmented by a fixed-geometry thermodynamically coupled ice shelf to show how the ocean's response to sea-ice conditions in Nares Strait seasonally modulates basal melting of PGIS.
2. METHODS
We used the MIT general circulation model (Marshall and others, Reference Marshall, Adcroft, Hill and Perelman1997) to configure a regional ocean model of Nares Strait and Petermann Fjord (Fig. 1) coupled to a dynamic/thermodynamic sea-ice model (Losch and others, Reference Losch, Menemenlis, Campin, Heimbach and Hill2010) and a thermodynamic ice shelf with fixed geometry (Losch, Reference Losch2008). The 240 × 560 × 60 model cells were configured into a variable grid resolution that ranged from sub-kilometer in the vicinity of Petermann Fjord to ~1.5 km near the model boundaries with 10 m vertical resolution in the upper 500 m smoothly varying to 50 m resolution below 750 m depth. The model bathymetry merged data from the International Bathymetric Chart of the Arctic Ocean (IBCAO) version 3.0 (Jakobsson and others, Reference Jakobsson2012) with recent multibeam data from the outer portion of Petermann Fjord (Personal communication from M. Jakobsson, L. Mayer, and A. Mix, 2015). Model boundary conditions, surface forcing, spin-up, and horizontal and vertical mixing schemes follow directly from Shroyer and others (Reference Shroyer, Samelson, Padman and Münchow2015) with the exception that all atmospheric fields varied spatially over the domain in the simulation presented here.
Relative to the previous model implementation (Shroyer and others, Reference Shroyer, Samelson, Padman and Münchow2015), the present model includes a more realistic representation of Petermann Fjord based on the new multibeam data, a sea-ice state that transitions from landfast to mobile over the simulation year and a thermodynamically coupled ice shelf. The ice shelf geometry is uniform in the across-fjord direction with an along-fjord profile based on the pre-2010 geometry (Münchow and others, Reference Münchow, Padman and Fricker2014), with ice draft = − 450 m × {1 + tanh{(x − 80 km) /35 km}} − 35 m. The ice shelf is smooth and lacks the small-scale basal topography and channels that have been previously reported (Rignot and Steffen, Reference Rignot and Steffen2008; Münchow and others, Reference Münchow, Padman and Fricker2014). Thermodynamic coupling relies on a two equation model of interactions between the ocean and ice shelf (Holland and Jenkins, Reference Holland and Jenkins1999) with a heat transfer coefficient of 4 × 10⁻⁵ m s−1.
The ice-shelf model outputs the heat flux (J q , W m−2) between the ocean and the ice shelf. Heat fluxes were converted to melt rates (q, m a−1) using the density of ice (ρ ice = 930 kg m−3) and the latent heat of fusion (L = 3.34 × 10⁵ J kg−1) according to
 $$q = \displaystyle{{J_q} \over {\rho _{ice} L}}.$$
The total net melt of the ice shelf was calculated as the weighted integral over the modeled ice-shelf area,
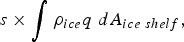 $s \times \mathop \int \rho _{ice} q\; dA_{ice\; shelf}, $
where s = 0.78 is the ratio of the area of the physical ice shelf (1250 km2) to the modeled ice shelf (1608 km2). The difference in ice-shelf area can be attributed to the idealized ice-shelf geometry combined with the smoothing of the bathymetry and coastlines in the merged IBCAO/multibeam product.
$s \times \mathop \int \rho _{ice} q\; dA_{ice\; shelf}, $
where s = 0.78 is the ratio of the area of the physical ice shelf (1250 km2) to the modeled ice shelf (1608 km2). The difference in ice-shelf area can be attributed to the idealized ice-shelf geometry combined with the smoothing of the bathymetry and coastlines in the merged IBCAO/multibeam product.
Fjord heat budget terms (given in the text as percentages relative to one another) were calculated relative to the average temperature in time and space
 $(\bar T)$
. The volume-integrated heat tendency within the fjord is
$(\bar T)$
. The volume-integrated heat tendency within the fjord is
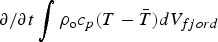 $\partial /\partial t\mathop \int \rho _{\rm o} c_p (T - \bar T)dV_{fjord} $
where ρ
o
is the reference ocean density, c
p
the heat capacity, T the model temperature and V
fjord
extends from the sill to the grounding line. Heat transported over the sill is
$\partial /\partial t\mathop \int \rho _{\rm o} c_p (T - \bar T)dV_{fjord} $
where ρ
o
is the reference ocean density, c
p
the heat capacity, T the model temperature and V
fjord
extends from the sill to the grounding line. Heat transported over the sill is
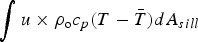 $\mathop \int u \times \rho _{\rm o} c_p (T - \bar T)dA_{sill} $
where u is the model across-strait velocity and A
sill
the vertical cross-sectional area across the sill. The heat exchange between the ocean and the ice shelf
$\mathop \int u \times \rho _{\rm o} c_p (T - \bar T)dA_{sill} $
where u is the model across-strait velocity and A
sill
the vertical cross-sectional area across the sill. The heat exchange between the ocean and the ice shelf
 $(\mathop \int J_q dA_{ice} )$
uses heat flux (J
q
) output from the model integrated over the ice-shelf area (A
ice
).
$(\mathop \int J_q dA_{ice} )$
uses heat flux (J
q
) output from the model integrated over the ice-shelf area (A
ice
).
3. OCEAN RESPONSE TO SEA-ICE COVER IN NARES STRAIT
Observations indicate that ocean circulation within Nares Strait shifts seasonally in response to the establishment and breakdown of the Smith Sound sea-ice arch (Rabe and others, Reference Rabe, Münchow, Johnson and Melling2012). Our model reproduces this observed seasonal shift in ocean structure as a result of a simple Ekman adjustment to the different surface stresses (Shroyer and others, Reference Shroyer, Samelson, Padman and Münchow2015), which change from a mean northward sea-ice drag in winter to a mean southward wind stress in summer. Under landfast sea ice (Fig. 2a), the northward sea-ice drag causes eastward Ekman transport of relatively fresh, cool near-surface waters and reduces near-surface flow, resulting in a subsurface maximum in the southward flow of relatively warm and salty intermediate-depth water that is offset toward the western side of the strait. Under mobile sea-ice conditions (Fig. 2b), the southward wind stress causes westward surface Ekman transport that displaces the fresh, cool layer to the west, which drives upwelling of relatively warm, salty deep water along the eastern side of the strait and results in a mean southward flow that is generally surface intensified and distributed across the center of the strait (Shroyer and others, Reference Shroyer, Samelson, Padman and Münchow2015). Thus, the distribution of heat and salt within Nares Strait shifts in response to the prevailing sea-ice conditions and winds.
Time mean salinity (color shading), temperature (white contours plotted every 0.2°C with zero shown in bold) and southward velocity (black contours plotted every 2 cm sec−1 with zero shown in bold) at Kennedy Channel over (a) winter and (b) summer periods (as defined in Fig. 4b).

Under mobile sea ice, the ocean circulation also develops meanders and eddies south of Robeson Channel (Fig. 3a, b). At the mouth of Petermann Fjord, these eddies appear to stabilize temporarily before propagating farther south through Nares Strait. An eddy similar to the simulated features has been observed previously in opportunistic field sampling and coincident remote sensing (Johnson and others, Reference Johnson, Münchow, Falkner and Melling2011). In our model, the strong cyclonic flow associated with these eddies leads to enhanced exchange at the mouth to Petermann Fjord during summer (Fig. 3c, d).
Model fields on (a) day 50 (landfast sea ice) and (b) day 250 (mobile sea ice). (a, b) Salinity at 15 m (color shading), ice-shelf thickness (grey scale shading) and ocean currents at 45 m (vectors). (c) Fjord exchange timescale calculated by dividing the volume glacier-ward of the sill at ~122 km by the eastward volume transport averaged between the sill and shelf front (black and grey lines in panel (d) and smoothed over 15 days. (d) Eastward volume transport as a function of time and east-west distance. Sill and shelf front locations are indicated. The mean ice-shelf draft is shown to the right of panel (d).

4. SEASONAL CHANGES IN THE CONNECTION BETWEEN NARES STRAIT AND PETERMANN FJORD
The seasonal changes in the model temperature and salinity at the mouth of Petermann Fjord penetrate into the fjord. The volume averaged temperature and salinity within the fjord are, respectively, 0.05°C and 0.20 g kg−1 higher in summer than in winter, reflecting seasonality in the distribution of water properties in Nares Strait. The flow at the fjord mouth in summer is primarily characterized by a lateral inflow and outflow on opposing sides of the fjord in the direction of Kelvin wave propagation, while in winter the lateral and vertical structure of the inflow and outflow is more complex, with multiple reversals across the mouth. In both seasons, the inflow temperature and salinity are almost always greater than the outflow temperature and salinity, with the inflow of warm, salty deep water being balanced by outflow of cooler, fresher water higher in the water column, consistent with observations reported by Johnson and others (Reference Johnson, Münchow, Falkner and Melling2011). In winter, the inflow is 0.3°C warmer and 0.15 g kg−1 saltier than the outflow. In summer, the inflow is 0.4°C warmer and 0.25 g kg−1 saltier than the outflow. Seasonality in temperature and salinity is pronounced above 200 m, with summertime means ~0.4°C warmer and ~0.5 saltier than wintertime means (Fig. 4c, d). Since data from the fjord are only available for summer, the seasonal change within Petermann Fjord has not been verified observationally. However, seasonality in the simulated conditions is consistent with the ocean circulation observed from several years of moorings farther downstream within Nares Strait (Münchow, Reference Münchow2016).
(a) Average sea-ice concentration (grey) and sea-ice speed (black) in northern Nares Strait. (b) Total net melt (black), net melt for ice-shelf thickness <200 m (light grey) and net melt for ice-shelf thickness >200 m (dark grey). Time series of (c) temperature and (d) salinity averaged within Petermann Fjord.

Our simulation also suggests an enhanced exchange in summer due to eddy-induced circulation at the mouth of Petermann Fjord. Strongly pulsed inflow events propagate from Nares Strait deep into the fjord. While these events occur in both winter and summer, they happen more often in summer, extending under the ice shelf (Fig. 3d), consistent with the modeled seasonality of eddies at the mouth of Petermann Fjord. Consequently, the glacierward transport into the fjord is larger in summer than in winter (Fig. 3d), implying that water entering the fjord is recirculated back to Nares Strait more quickly in summer. We estimate an exchange timescale by dividing fjord water volume by the glacier-ward transport at the sill and find that it takes ~60 days in summer and ~100 days in winter to flush the fjord (Fig. 3c). These short timescales suggest that seasonal changes in Nares Strait water property distributions can propagate into Petermann Fjord to affect PGIS within the same season.
5. BASAL MELT RATES FOR PETERMANN GLETSCHER ICE SHELF
The simulated, seasonally-varying sea-ice conditions outside of the fjord alter oceanic heat transport into Petermann Fjord, leading to enhanced basal melt of the PGIS in summer. The summer average of the modeled melt rate averaged over the entire base of PGIS is 16.6 m a−1, ~20% greater than the winter average of 13.8 m a−1 (Fig. 4b). The seasonal change is primarily restricted to the outer portion of PGIS where its ice draft is <200 m; in this region the summertime median melt rate of 13.5 m a−1 is almost twice that of the wintertime value of 7.3 m a−1. For PGIS draft <100 m, the melt rates are typically >10 m a−1 in summer and <5 m a−1 in winter.
On timescales less than a few weeks, changes in heat content within the fjord are almost balanced by flow over the sill. However, over longer timescales the heat transported across the sill is within 10–20% of the heat lost to the ice shelf, with an excess of heat transported into the fjord over that lost to PGIS in winter, and an excess lost to PGIS in summer. Seasonal changes within the fjord occur concurrently with the reduction in sea-ice area and transition to a mobile sea-ice state within Robeson Channel and Hall Basin (Fig. 4a). Sea-ice motion in this region follows the breakup of the lateral sea-ice arch across Smith Sound.
The model's scaled integrated mass loss is 18 Gt a−1 in the annual mean (Fig. 4b). This value is ~30% higher than the total observed integrated melt of 14 Gt a−1 that combines a steady state integrated melt of ~10 Gt a−1 (i.e., ice flux crossing the grounding line minus net surface mass loss and calving flux) with a non-steady thinning of ~4 Gt a−1 (Münchow and others, Reference Münchow, Padman and Fricker2014). The modeled melt rates, which in the annual mean range from 1 to 33 m a−1 with a median of 13 m a−1, are similar to point estimates of the steady-state melt rate given by Rignot and Steffen (Reference Rignot and Steffen2008), which range from ~0 to 30 m a−1, and the net melt rate of 13 m a−1 estimated by Münchow and others (Reference Münchow, Padman and Fricker2014). Two potential sources of discrepancies between the modeled and observed integrated melt are our simplified parameterization of ocean/ice thermodynamic exchanges and the model's idealized ice-shelf geometry, which lacks the basal channels and crevasses that may have a significant influence on net basal melt.
6. DISCUSSION: IMPLICATIONS FOR LONG-TERM STABILITY OF PGIS
The summertime increase in PGIS basal melting arises in the model through a transition in ocean circulation associated with the collapse of the sea-ice arch across Smith Sound that facilitates the transition from landfast to mobile sea ice throughout Nares Strait. The underlying physical mechanism, oceanic heat advection by the Ekman response to different surface stresses (the southward winds and northward ice drag), is robust and should be relatively independent of the details of model implementation. Although the fixed-geometry ice-shelf representation used here does not allow direct modeling of the quasi-equilibrium balances that determine the large-scale structure of the ice shelf, the results nonetheless suggest that the long-term stability of the PGIS may relate to the regular establishment of landfast sea ice within Nares Strait. For ~8 months of a typical year, the stress exerted by landfast ice on the ocean will displace relatively cool, fresh water in Nares Strait to the east and into the fjord. Melting of the shallow-draft outer portions of the ice shelf is reduced, both by the lack of inflowing ocean heat at that depth and by the buoyant plume flow originating from rapid basal melting under deeper ice closer to the grounding line.
These results also suggest a role for this mechanism in preconditioning PGIS for large calving events, such as those observed in 2010 and 2012 (Fig. 5b). Sea ice in the Hall Basin region of Nares Strait experienced extended periods of low summer ice concentration in preceding years (Fig. 5b). Our simulations suggest that these sea-ice anomalies would be associated with penetration of warmer upper-ocean waters into the fjord over a longer time period. In turn, this would cause increased thinning of PGIS. We hypothesize that this thinning could weaken the ice shelf, increasing the probability for calving events in the following years after the winter sea ice was removed from the fjord (e.g., Fig. 5a).
(a) Sequence of MODIS images showing the 2012 Petermann Gletscher calving event that occurred coincident with clearing of sea ice from the fjord and strait. (b) Sea-ice area (black shading, upper and left axes) and Petermann ice-shelf extent (green diamonds, lower and right axes from (Münchow and others, Reference Münchow, Padman and Fricker2014)). Sea-ice area is calculated from 12.5 km gridded AMSR-E sea-ice concentration within Hall Basin. Note that time series for sea-ice area and ice-shelf extent are shifted by 1 year. Low sea-ice concentration occurred in 2009 and 2011, i.e., years preceding large calving events in 2010 and 2012.

If Arctic sea-ice volume continues to decline as climate models predict (Wang and Overland, Reference Wang and Overland2012), thinner ice entering Nares Strait may be less likely to arch, lengthening the mobile ice season and increasing the period of elevated basal melt. Unless this increase is offset by a larger ice flux across the grounding line, PGIS will thin and calving may occur more frequently (e.g., as suggested by Fig. 5 and similar to changes underway in Antarctica (Rignot and others, Reference Rignot, Mouginot, Morlighem, Seroussi and Scheuchl2014)). Our results indicate that increased melt by this mechanism will be limited to regions with ice-shelf draft <~200 m, suggesting that PGIS may reach a new quasi-equilibrium length ~40–45 km from the terminus where the PGIS draft is on average 200 m thick. Other changes, such as a continuation of the observed warming of the deep water in Nares Strait and Petermann Fjord (Johnson and others, Reference Johnson, Münchow, Falkner and Melling2011; Münchow and others, Reference Münchow, Falkner, Melling, Rabe and Johnson2011), could increase melt rates under thicker portions of PGIS to the point where the calving front retreats to the grounding line, as already seen for other Greenland glaciers (Motyka and others, Reference Motyka2011; Mouginot and others, Reference Mouginot2015).
The modeled seasonality demonstrates the close ties between the multiple components (atmosphere, sea ice, ocean and ice sheet) of the climate system. This example also highlights the challenges in forecasting GrIS mass balance associated with ocean/ice interactions at the marine margins, in that forecasts require sea-ice dynamics, exterior to the fjord and ocean instabilities under variable surface forcing to be reasonably represented or parameterized. Models need to accurately represent tightly coupled changes in all system components at the small length scales characteristic of fjords, and the short timescales of ocean instabilities that provide heat to fjords, tidewater glacier faces and the remaining glacial ice shelves.
ACKNOWLEDGEMENTS
This work was supported by the National Science Foundation (Grant ARC-1108463) and the National Aeronautics and Space Administration (grant No. NNX15AL77 G and NNX13AP60G). We acknowledge high-performance computing support from Yellowstone (ark:/85065/d7wd3xhc) provided by NCAR's Computational and Information Systems Laboratory, sponsored by the National Science Foundation. We thank Martin Jakobsson (Stockholm University), Larry Mayer (University of New Hampshire) and Alan Mix (Oregon State University) for use of the multibeam dataset for bathymetry in the vicinity of Petermann Fjord. R.M.S. is grateful to Prof. O. T. Gudmestad and the Universitet i Stavanger for their hospitality during a sabbatical visit. We also acknowledge the helpful comments from two anonymous reviewers.


 Open access