


Introduction
Seeds are crucial to protect and nourish the developing embryos that represent the next sporophytic generation in flowering plants (Pradhan et al., Reference Pradhan, Bandhiwal, Shah, Kant, Gaur and Bhatia2014). Seed quality is usually measured by germination ability or physicochemical attributes of seeds which is gaining greater importance in agriculture field due to its critical and fundamental role in plant breeding and production. High-quality seeds have been reported to initiate successful plant growth which results in abundant yield/production (Feng et al., Reference Feng, Zhu, Liu, He, Bao and Zhang2019). High quality and high yield have always been the main goals of seed production, and only by deeply understanding the dynamic changes of seed development can this goal be better achieved. Generally, seed development consists of three stages: embryogenesis, seed formation, maturation and desiccation (Garg et al., Reference Garg, Singh, Rajkumar, Kumar and Jain2017). A series of complex and dynamic developmental, biochemical and metabolic processes are involved in seed development including cell division and differentiation, carbohydrate, protein, cell wall, lipid, amino acid, hormone and secondary metabolite biosynthesis (Baud et al., Reference Baud, Boutin, Miquel, Lepiniec and Rochat2002). Starch is the main energy storage substance in seed development, and sucrose is one of the main sources of energy (Aguirre et al., Reference Aguirre, Kiegle, Leo and Ezquer2018). Sucrose hydrolysis affects starch synthesis and thus seed filling and size (Weber et al., Reference Weber, Borisjuk and Wobus2005).
Understanding the regulatory mechanisms of seed formation is essential to identify the molecular basis of seed development. Transcript profiling of developing seeds has become a popular method to identify key candidate genes and their associated regulatory pathways that can be used as breeding tools to improve seed quality traits. Previously, storage compound synthesis and expression pattern of responsible genes have been reported in Arabidopsis thaliana during seed development (Baud et al., Reference Baud, Boutin, Miquel, Lepiniec and Rochat2002; Peng and Weselake, Reference Peng and Weselake2011). In A. thaliana ecotype Wassilewskija, starch accumulates during the morphogenesis stage of seed development, with a subsequent decrease coinciding with sucrose accumulation during late maturation (Baud et al., Reference Baud, Boutin, Miquel, Lepiniec and Rochat2002). Transcription factors (TFs), such as LEAFY COTYLEDON 1 (LEC1), LEC2, ABSCISIC ACID-INSENSITIVE 3 (ABI3), FUSCA 3 (FUS3) and others from the CCAAT, bZIP (basic leucine zipper) and bHLH (basic helix-loop-helix) families, form a complex regulatory network essential for Arabidopsis seed development (Le et al., Reference Le, Cheng, Bui, Wagmaister, Henry, Pelletier, Kwong, Belmonte, Kirkbride, Horvath, Drews, Fischer, Okamuro, Harada and Goldberg2010; Verma et al., Reference Verma, Attuluri and Robert2022). Similarly, these seed-specific TFs were also reported in Oryza sativa which are involved in hormone response, cellular organization processes and metabolism regulation (Xue et al., Reference Xue, Zhang and Xue2012). In Triticum aestivum, the overexpression of TaNAC100 increased starch content, seed size and 1000-grain weight. In the meanwhile, key starch synthesis-related genes TaGBSSI (GRANULE BOUND STARCH SYNTHASE I) and TaSUS2 (SUCROSE SYNTHASE 2) respond to TaNAC100 expression (Li et al., Reference Li, Xie, Tian, Liu, Xu, Jin, Song, Dong, Zhao, Li, Li, Zhang, Zhang, Xia, He and Cao2021). Barley is also an important source of carbohydrates in the diet. The known genes NUCLEAR FACTOR-YB (NF-YBs) are also found in Hordeum vulgare. AGPase (Hvulgare_GLEAN_10033640 and Hvulgare_GLEAN_10056301), as well as SBE2b (Hvulgare_GLEAN_10018352) may specifically participate in starch biosynthesis during seed development (Tang et al., Reference Tang, Zeng, Wang, Bai, Xu, Wei, Yuan and Nyima2017). Studies on the molecular mechanism of seed development have also been carried out in a few forage grasses. In a study to alter the nutritional value of legume forage seeds, it was found that enzymes involved in methionine biosynthesis were significantly compartmentalized between seed tissues in Medicago truncatula (Gallardo et al., Reference Gallardo, Firnhaber, Zuber, Hericher, Belghazi, Henry, Kuster and Thompson2007). By performing transcriptome sequencing on Leymus chinensis seeds at 14, 28 and 42 days after pollination, a total of 18,927 differentially expressed genes (DEGs) and TFs NAC48, WRKY80 and C3H14 were involved in L. chinensis seed development, and thereby appeared to influence germination rate (Li et al., Reference Li, Liu, Yuan, Zhao, Yang, Jia, Cheng, Qi, Chen and Liu2019). The molecular regulatory mechanisms and accumulation patterns of oils and fatty acids of Artemisia sphaerocephala seeds at seven different development stages after flowering were revealed by RNA-seq, and FUS3 and bHLH family TFs played a vital role in this process (Nan et al., Reference Nan, Zhang, Hu, Miao, Han and Fu2021). There are few studies on genes involved in starch and sucrose metabolism during forage seed development.
Elymus sibiricus (Siberian wild rye) is an economically significant, perennial, cold-season, self-pollinating and allotetraploid forage grass, indigenous to northern Asia and integral to Qinghai-Tibetan Plateau's agriculture due to its high protein content and robust adaptability (Xie et al., Reference Xie, Zhao, Zhang, Wang and Liu2015; Zhao et al., Reference Zhao, Xie, Zhang, Zhang and Wang2017). In this context, E. sibiricus can be widely employed in establishing sown grasslands to develop stock raising and participate in ecological restoration (Yan et al., Reference Yan, Bai, Ma, Gan and Zhang2007). Despite its agricultural value, E. sibiricus faces challenges in seed shattering and variety development, hindering its cultivation and application. Moreover, there is a lack of comprehensive molecular studies connecting transcriptomic profiles to seed developmental stages in E. sibiricus (Lei et al., Reference Lei, Zhao, Yu, Li and Dou2014; Zhao et al., Reference Zhao, Zhang, Zhang and Xie2019). Previous studies only focused on the morphological changes, physiological mechanisms and biochemical processes during seed development in E. sibiricus (Zhao et al., Reference Zhao, Xie, Zhang, Zhang and Wang2017; Lei et al., Reference Lei, Liu, Zhao, You, Xiong, Xiong, Xiong, Yu, Bai and Ma2020). Meanwhile, the transcript profiling was mainly reported in relation to seed shattering and flowering time (Xie et al., Reference Xie, Zhang, Zhao, Zhang and Wang2017; Zhang et al., Reference Zhang, Xie, Zhao, Zhang, Wang, Ntakirutimana, Yan and Wang2019; Zheng et al., Reference Zheng, Wang, Zhang, Liu and Xie2022). There are no studies showing a connecting transcript gene expression profiles to seed developmental stages in E. sibiricus. To address this, we have utilized an integrated sequencing approach that combines next-generation sequencing (NGS) with advanced long-read sequencing technologies to construct a comprehensive transcriptome for E. sibiricus. In absence of a published E. sibiricus genome annotation, our study performs full-length transcriptome sequencing across different seed developmental stages. By constructing a weighted gene co-expression network analysis (WGCNA), we aim to uncover the genes and molecular mechanisms that regulate seed development in E. sibiricus, providing novel insights and a valuable resource for future breeding efforts.
Materials and methods
Sample collection and physiological indices measurement
The wild E. sibiricus germplasm LQ06 was used for this study, which was collected from Luqu, Gansu province of China (latitude 34°05′39′′ N, longitude 102°37′55′′ E, elevation 3,380 m). The seeds were germinated on two layers of filter paper and placed in a controlled environment chamber set at 25°C and 8 h in the dark/16 h in the light. Thirty healthy seedlings were grown in a greenhouse and were transplanted to the experimental field at the Yuzhong campus of Lanzhou University, Gansu, China (latitude 35°34′ N, longitude 103°34′ E, elevation 1,720 m) when two tillering buds have developed. Spikelets that flowered simultaneously were tagged at full bloom, and the flowering date was recorded. Seeds from spikelets with comparable developmental stages were collected at 5, 9, 15, 20 and 25 days post-anthesis (DPA), hereinafter referred to as S5, S9, S15, S20 and S25, respectively. Each sample was collected in triplicate, flash-frozen in liquid nitrogen and stored at −80°C for further analysis. Immediately after harvest, samples were analysed for starch and soluble sugar content using Suzhou Comin Biochemical Test Kits according to the manufacturer's protocol.
RNA isolation, PacBio and Illumina library construction and sequencing
Total RNA was isolated using TRIzol® Reagent (Invitrogen® Thermo Fisher Scientific, Waltham, MA, USA). The purity and integrity of RNA were assessed by using a Nanodrop and 2100 Bioanalyzer (Agilent Technologies®, Santa Clara, CA, USA). Agarose gel electrophoresis was used to detect genomic DNA contamination. The purified RNA samples from the collected tissues were used for PacBio and Illumina library construction and sequencing.
Procedure of full-length transcriptome sequencing: (1) Full-length cDNA of mRNA was synthesized using SMARTer™ PCR cDNA Synthesis Kit (Clontech, Mountain View, CA, USA). (2) Amplification of full-length cDNA by PCR. (3) End repair of full-length cDNA. (4) Connect SMRT dumbbell connector. (5) Exonuclease digestion was performed to obtain sequencing library. (6) Library quality control. (7) After passing the on-machine sequencing library check, full-length transcriptome sequencing was performed using PacBio (Sequel II) instrument according to the target on-machine data volume. In this study, all samples were mixed for full-length transcriptome sequencing without replicate for comparative analysis.
Procedure of second-generation transcriptome sequencing: (1) Enrichment of eukaryotic mRNA with magnetic beads with Oligo (dT). (2) mRNA was randomly interrupted by Fragmentation Buffer. (3) mRNA was used as template to synthesize the first cDNA strand with six-base random hexamers, and then the second cDNA strand was synthesized by adding buffer, dNTPs, RNase H and DNA polymerase I. cDNA was purified by AMPure XP beads. (4) The purified double-stranded cDNA was then end-repaired, A-tail was added and sequencing joints were connected, and AMPure XP beads were used for fragment size selection. (5) cDNA library was obtained by PCR enrichment. (6) Library quality control. (7) After the on-machine sequencing library is checked, different libraries are pooled according to the target on-machine data amount and sequenced by Illumina NovaSeq 6000 platform. In this study, samples of five stages were used for second-generation transcriptome sequencing with three replicates.
PacBio Iso-Seq data processing and read correction
Raw sequencing data were processed using the SMRTlink4.0 software through the standard Iso-Seq protocol. The full-length non-chimeric and non-full-length (nFL) reads were obtained by filtering, polishing and sorting. Error correction was performed using an Illumina RNA-seq dataset (Chen et al., Reference Chen, Li, Wang, Zhong, Tang, Zhou, Liu, Zhan, Zheng, Chen and Chen2019). Considering the limitation of the construction of the cDNA library, the consensus sequence screened may be an nFL sequence due to the deletion of the 5′end sequence. Therefore, we merged the sequences where only 5′end exons differ, and the other exons are consistent. The longest sequence is taken as the final transcript sequence, and second-generation data are used to quantify and differentiate new transcript sequences.
Mapping reads from the PacBio library and annotation analysis
After sequencing quality control checks, low-quality conforming sequences were corrected using Illumina high-throughput sequencing results. Clean reads were separated from the raw data by removing adapter sequences and low-quality reads, the high-quality clean reads were then used as a reference for further transcriptome data analysis, and PacBio data were applied to modify the reference genome using Bowtie (v2.2.3). The gene expression levels were quantified by the RSEM software package (v1.3.1) (Li and Dewey, Reference Li and Dewey2011) and were normalized by the FPKM method (Trapnell et al., Reference Trapnell, Williams, Pertea, Mortazavi, Kwan, van Baren, Salzberg, Wold and Pachter2010). All expressed transcript functions were annotated to eight public databases using BLAST software (v2.2.26): the NCBI non-redundant (Nr) protein, Protein Family (Pfam), SwissProt (which contains manually annotated and reviewed protein sequences), Clusters of Orthologous Groups of proteins (KOG/COG/eggNOG), GO and KEGG databases.
Identification of differentially expressed genes (DEGs) and transcription factors (TFs)
The expression level of transcripts was calculated by quantifying the reads according to the fragments per kilobase of transcript per million mapped reads (FPKM) values (Mortazavi et al., Reference Mortazavi, Williams, McCue, Schaeffer and Wold2008). The transcript fold change was calculated by the formula of log2(FPKM treatment/FPKM control) using an MA plot-based method with the random sampling model via the R package DEGseq (Wang et al., Reference Wang, Feng, Wang, Wang and Zhang2010). The DEGs that conformed to both |fold change| ≥ 2 and a false discovery rate < 0.01 conditions were used for subsequent analysis. Cluster analysis was performed and DEG expression patterns were assessed using the Biomarker (BMK) Cloud platform (Chang et al., Reference Chang, Nguyen, Xie, Xiao, Tang, Zhu, Mou and Xiong2017). The expression level (FPKM) of mutually expressed genes among different treatments was analysed using TBtools (Chen et al., Reference Chen, Chen, Zhang, Thomas, Frank, He and Xia2020). Venn diagrams were generated using the Venny 2.1 tool (https://bioinfogp.cnb.csic.es/tools/venny/index.html). GO and KEGG pathway enrichment analyses of the DEGs were performed via the OmicShare Tools online platform. The potential TFs were identified by the PlantTFDB database with the default parameters (https://planttfdb.gao-lab.org/blast.php).
Establishment of the gene co-expression network
WGCNA was conducted using the R packages (Langfelder and Horvath Reference Langfelder and Horvath2008). Expression correlation coefficients were calculated for gene networks using the scale-free topology model (Wang et al., Reference Wang, Wang, Wang and Chen2018). Then, the WGCNA modules (co-expression network) of eigengenes were identified and the networks correlated with physiological indices were identified with the criterion of stability correlation P ≤ 0.05. The resulting networks were visualized with Cytoscape(v3.7.1) and MCODE (Bader and Hogue, Reference Bader and Hogue2003).
Real-time quantitative PCR (qRT-PCR) analysis
cDNA was synthesized from 500 ng of total RNA using ReverTra Ace® qPCR RT Master Mix (with DNase) (Toyobo Biotech Co., Ltd., Shanghai, China) according to the manufacturer's instructions. Ten sequences of hub genes derived from WGCNA were used to synthesize primers via a tool on the NCBI website (https://www.ncbi.nlm.nih.gov/tools/primer-blast/). The qRT-PCR analysis was performed on a CFX 96 Real-Time PCR system (Bio-Rad) using 2xSG Fast qPCR Master Mix (Sangon Biotech, Shanghai, China). The qRT-PCR analyses were performed in three biological replicates with three technical replicates in 96-well plates. The thermal cycling conditions were as follows: 95°C for 3 min, followed by 40 cycles of 3 s at 95°C and 30 s at 60°C. The relative gene expression levels were calculated according to the 2−ΔΔCt method (Arocho et al., Reference Arocho, Chen, Ladanyi and Pan2006).
Results
Morphological changes at different seed development stages
Morphological changes in developing seeds were monitored from 5 DPA (S5) to 25 DPA (S25) (Fig. 1). After 5 days of flowering (S5), the seeds were short, shrivelled and bright green. After 9 days (S9), the seeds grew longer, bright green and gradually full. At 15 DPA (S15), the seed colour changed from green to yellow, the middle of the seed appeared brown and the seed became wide and full. At 20 DPA (S20), most of the seeds became reddish-brown in colour, while the seeds extended and the seed-coat wrinkled. At 25 DPA (S25), seeds turned brown and gradually lost water content. These results indicate that the seed colour of E. sibiricus transitions from bright green to brown as they mature, with a noticeable increase in size up until S25. In addition, the seed coat changed from crinkled to full to crinkled.
Seed tissues at five different developmental stages (S5, S9, S15, S20 and S25 represent corresponding days of post-anthesis).

Change in sugar content at different seed development stages
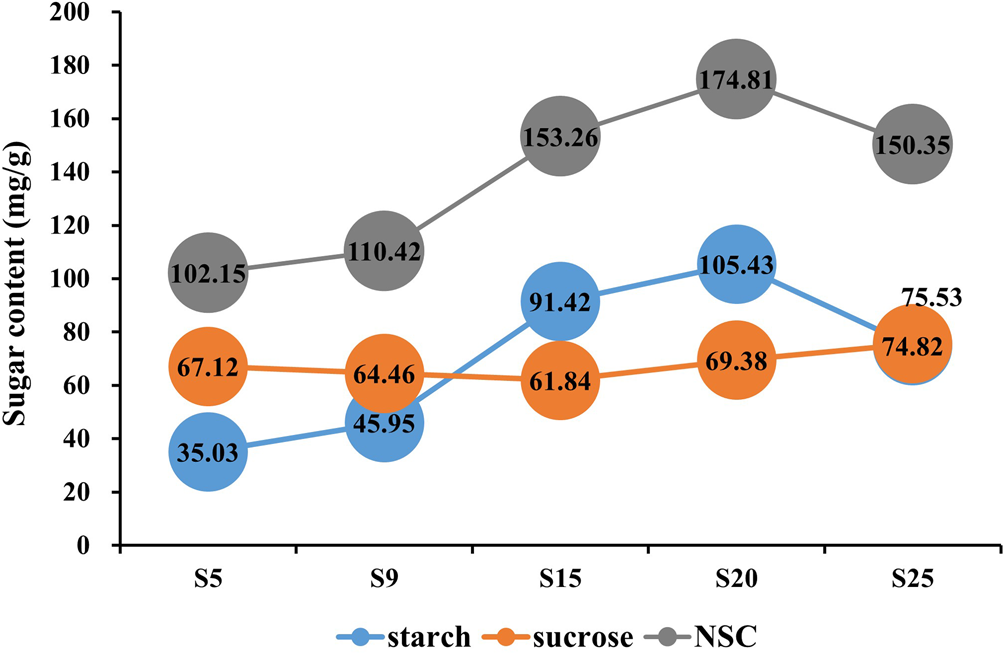
In this study, the starch and sucrose content were determined by the standard curve method at five seed development stages. Non-structural carbohydrate (NSC) content was obtained by calculating the sum of starch and soluble sugar concentration. The sucrose content significantly decreased from 67.12 mg/g at 5 DPA (S5) to 61.84 mg/g at 15 DPA (S15), then remained relatively stable from 15 to 25 DPA (S15–S25). Starch content increased from 35.03 mg/g at 5 DPA (S5) to 105.43 mg/g at 20 DPA (S20), with the most rapid accumulation occurring between 9 and 15 DPA. After 20 DPA (S20), the starch content declined. The trend in NSC content mirrored that of the starch content (Fig. 2), suggesting that the period between 9 and 15 DPA is critical for seed development, characterized by sucrose decomposition and rapid starch accumulation in E. sibiricus.
Sugar content of different development stages.
High-throughput RNA-seq and global analysis of gene expression
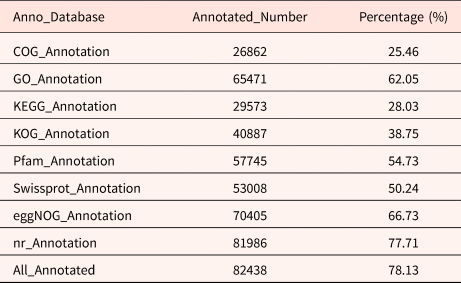
A total of 105,508 full-length transcripts were generated from a library of 1–6 kb in length (Supplementary Fig. S1). The Illumina results were mapped to the PacBio library, and mapping ratios were calculated, as shown in Table 1. Among them, the Q30 values of the sequences in the 15 libraries reached 90%, and all of the total mapping ratios were greater than 60% (Table 1). In total, 82,438 redundant transcripts were annotated against eight public databases (the Nr, SwissProt, eggNOG, COG, KOG, Pfam, GO and KEGG databases) (Table 2). Among them, 78.13% of transcripts from SMRT were annotated in at least one database. The number of transcripts annotated in the eight databases ranged from 26,862 (25.46%, COG) to 81,986 (77.71%, Nr).
The Illumina high-throughput sequencing results and mapping ratio

The transcripts functional annotation results
Differentially expressed genes (DEGs) during seed development
A total of 13,205 DEGs were identified at five stages of seed development. Among them, 6,196 (2,923 up, 3,273 down), 4,853 (3,423 up, 1,430 down), 746 (440 up, 306 down) and 1,410 (685 up, 725 down) DEGs were identified in S5 vs S9, S9 vs S15, S15 vs S20 and S20 vs S25, respectively (Fig. 3A–D). It appeared that transcription events of seed development occurred actively during S5–S15 and S20–S25. The Venn result showed nine overlap DEGs expressed in the overall comparison sets. The specific DEGs were 5,352 (48.3%), 3,906 (35.3%), 441(4%), 273(2.5%) in S5 vs S9, S9 vs S15, S15 vs S20 and S20 vs S25, respectively (Fig. 3E).
Volcano plot and Venn diagram of DEGs in E. sibiricus seed embryos. (A) S5 vs S9. (B) S9 244 vs S15. (C) S15 vs S20. (D) S20 vs S25. (E) Venn diagram represents the number of overlapping DEGs 245 between S5, S9, S15, S20, S25.
Hierarchical clustering of all 13,205 DEGs was performed, using the Pearson correlation method associated with average linkage clustering. As a result, eight clusters were identified for expression pattern analysis, namely cluster 1–8 (Fig. 4). On the whole, each cluster showed a peak in a certain stage. Cluster 1 and 6 contained high-expressed DEGs at S5. Cluster 3 contained high-expressed DEGs at S9. Cluster 2 contained high-expressed DEGs at S15. Cluster 4, 7 and 8 contained high-expressed DEGs at S20. Cluster 5 and 7 contained high-expressed DEGs at S25. The classification results were beneficial to the study of genes with the same expression pattern in seed development.
The DEGs expression pattern analysis of five E. sibiricus developing stages

GO and KEGG enrichment analysis of DEGs
Gene ontology (GO) assignments were used to classify functions of the predicted seed developing DEGs in E. sibiricus. Among them, DEGs were categorized into three main divisions (biological process, cellular components and molecular functions). The top 20 enriched GO terms during the five seed development stages were identified (Fig. 5). All these terms were directly or indirectly related to seed development and starch and sucrose metabolism of E. sibiricus. The term ‘vacuole’ contained 335 DEGs belonging to cellular components. Vacuoles store carbohydrates, proteins and fats needed for growth, providing a source of nutrients for seed development (Shimada et al., Reference Shimada, Takagi, Ichino, Shirakawa and Hara-Nishimura2018). The term ‘xylan catabolic process’ contained 55 DEGs belonging to biological process which is the chemical reactions and pathways resulting in the breakdown of xylan, a polymer containing a beta-1,4-linked D-xylose backbone. These DEGs of ‘xylan catabolic process’ were involved in seed maturation (Shen et al., Reference Shen, Xu, Huang, Li, Xu, Lin and Huang2022). The beta-amylase activity reaction was the hydrolysis of 1,4-alpha-glucosidic linkages in polysaccharides so as to remove successive maltose units from the non-reducing ends of the chains. This term involves in seed germination and maturation process (Gong et al., Reference Gong, Westcott, Zhang, Yan, Lance, Zhang, Sun and Li2013). The term ‘beta-amylase activity’ contained 56 DEGs belonging to molecular functions and the expression values are shown in Fig. 6. The annotation results of the Pfam dataset indicated that these DEGs were from the GLYCOSYL HYDROLASE FAMILY 14, and BETA-AMYLASE 1 (BMY1) was a representative gene in this family. The homologs of BMY1, F01_transcript_191270 and F01_transcript_98193 were down-regulation from S5 to S25. However, F01_transcript_128398, F01_transcript_150576, F01_transcript_180023, F01_transcript_8657, F01_transcript_90591 and F01_transcript_97370 were up-regulated.
The GO enrichment analysis of DEGs. The colour from the light pink to dark red module represents –log10 (P-value), the number on the module represents the number of genes enriched in the pathway and the number on the purple module represents the number of genes in the pathway. And the fan length on the pathway represents the enrichment factor.

The expression heatmap of DEGs involved in beta-amylase activity

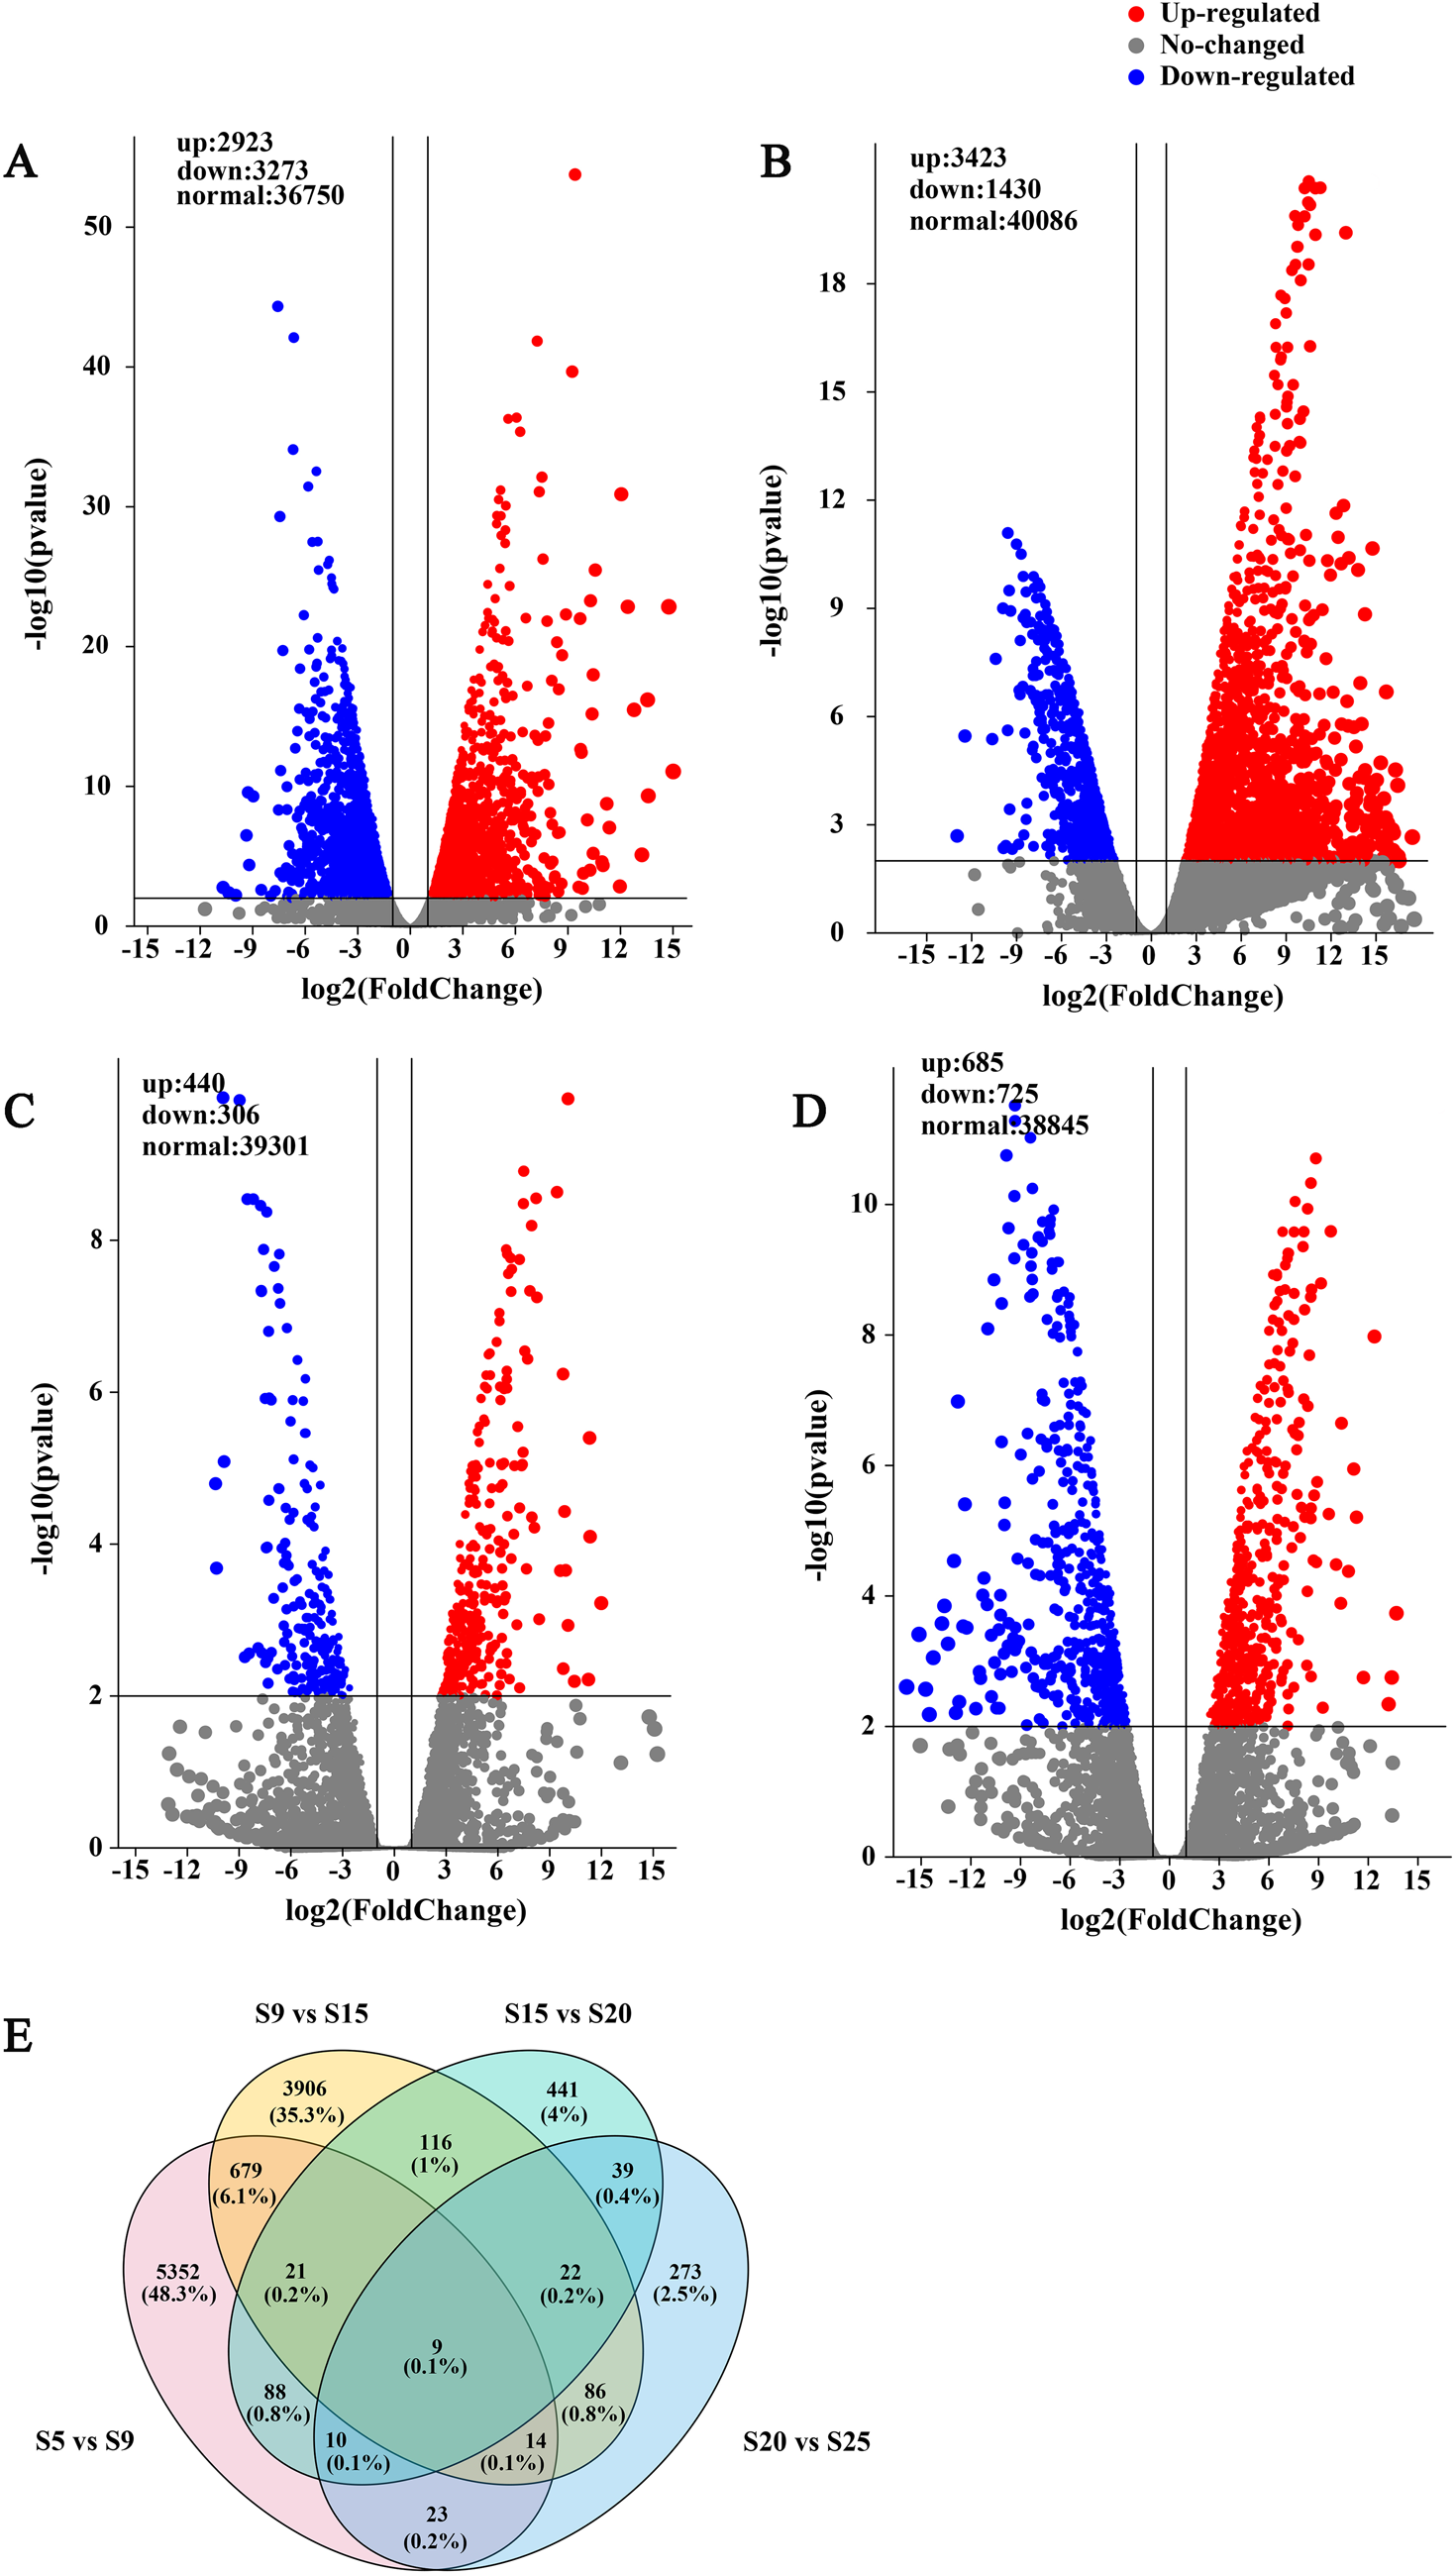
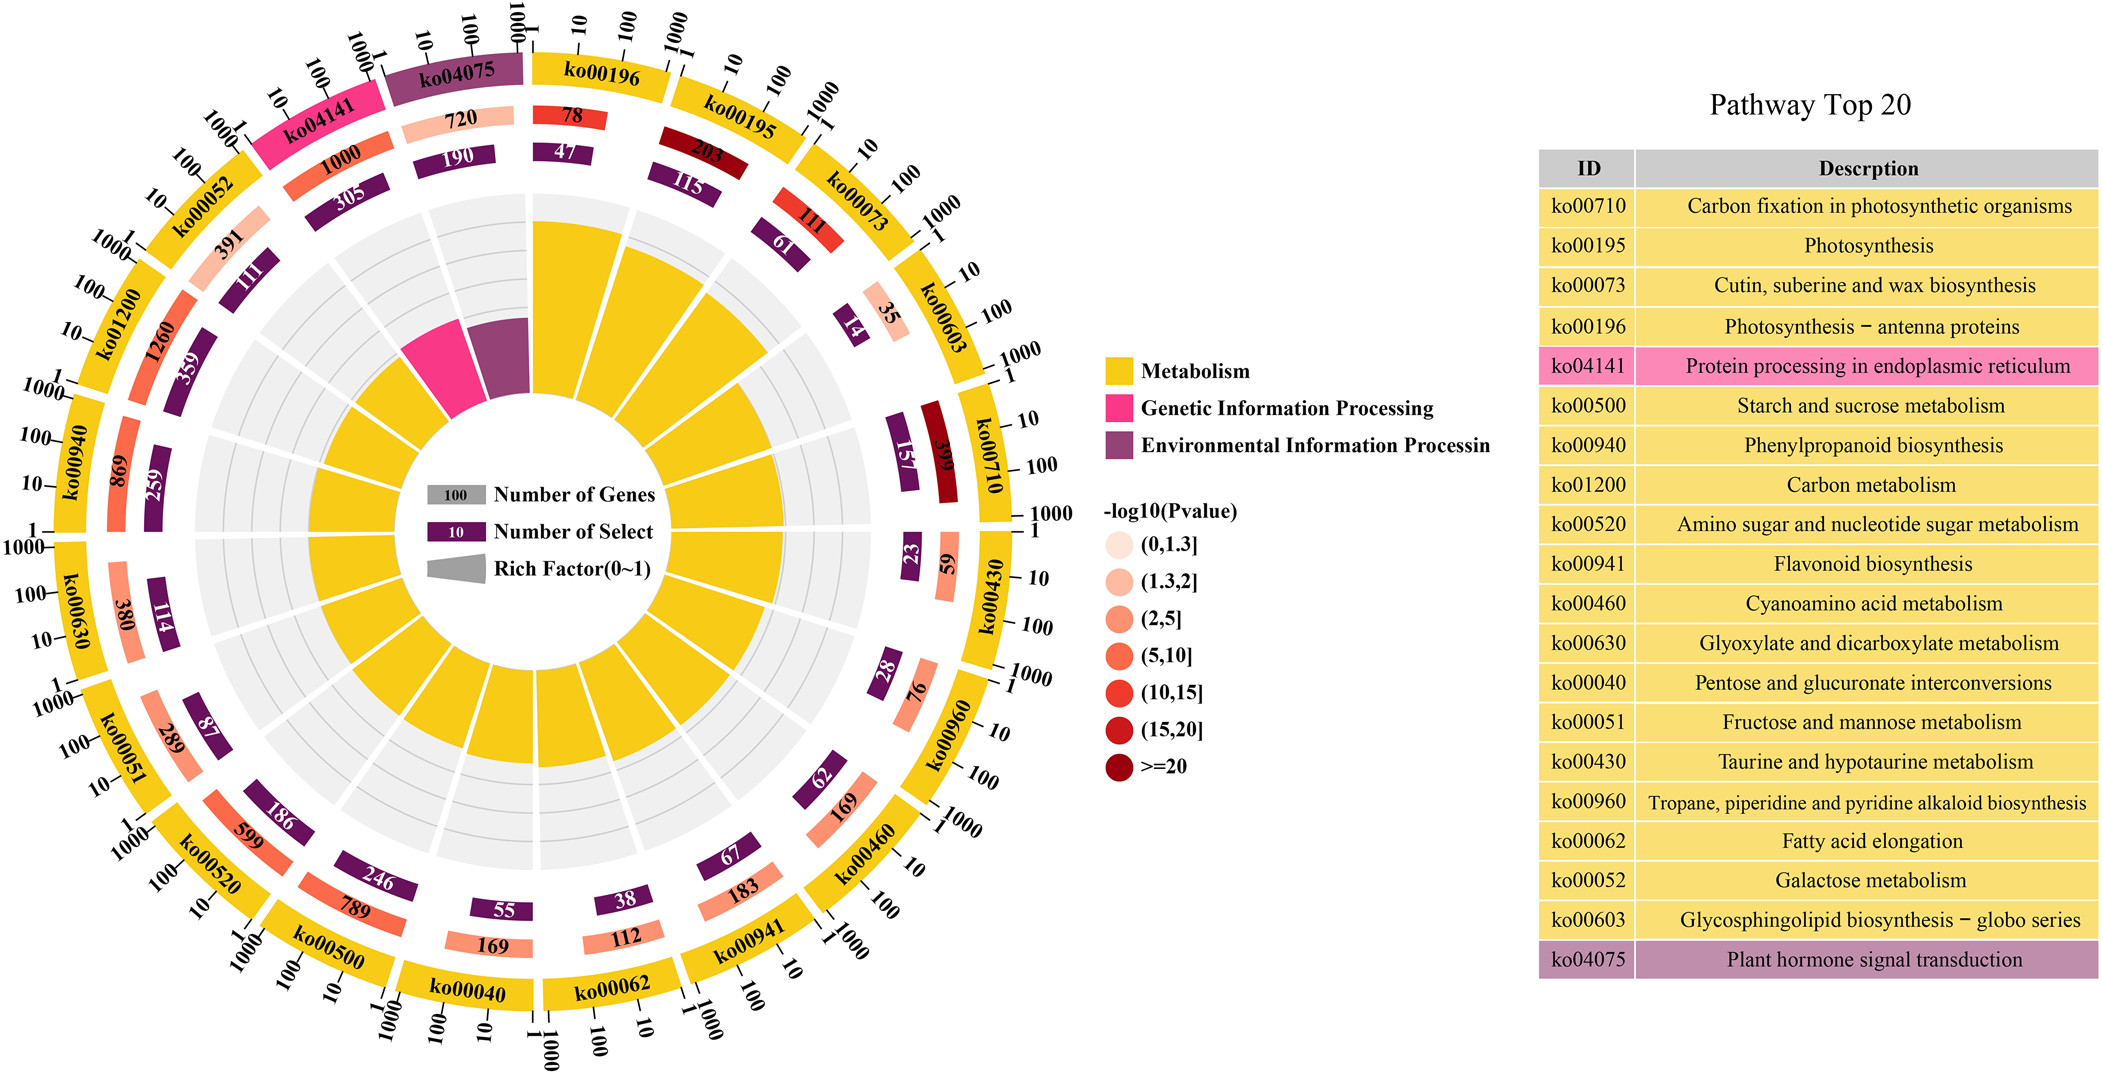
From the identified differential developmental stages of the seeds and the associated DEGs group, further annotation was done by utilizing KEGG database. As a result, DEGs were categorized into three main divisions (metabolism, genetic information processing and environmental information processing). Similarly, the top 20 enriched KEGG pathways during the five seed developmental stages were identified (Fig. 7). In top 20 enriched KEGG pathways, the ‘photosynthesis’ pathway contained 115 DEGs. In the process of seed maturation, the genes involved in photosynthesis were down-regulated, photosynthesis in the seeds was inhibited, and the seeds turned yellow (Shen et al., Reference Shen, Xu, Huang, Li, Xu, Lin and Huang2022). The ‘plant hormone signal transduction’ pathway contained 190 DEGs. Many plant hormones are involved in the regulation of seed dormancy and germination, of which abscisic acid (ABA) and gibberellin are the two most important regulation hormones (Kozaki and Aoyanagi, Reference Kozaki and Aoyanagi2022). The ‘starch and sucrose metabolism’ pathway contained 246 DEGs. According to annotation results, DEGs related with sucrose synthase, alpha-amylase, UDP-glucose 6-dehydrogenase, UDP-glucuronate 4-epimerase, UDP-glucuronic acid decarboxylase, starch synthase and beta-glucosidase were selected and the expression values are shown in Fig. 8.
The KEGG enrichment analysis of DEGs. The colour from the light pink to dark red module represents –log10 (P-value), the number on the module represents the number of genes enriched in the pathway and the number on the purple module represents the number of genes in the pathway. And the fan length on the pathway represents the enrichment factor.
The expression heatmap of DEGs involved in starch and sucrose metabolism

Transcriptional networks controlling seed development
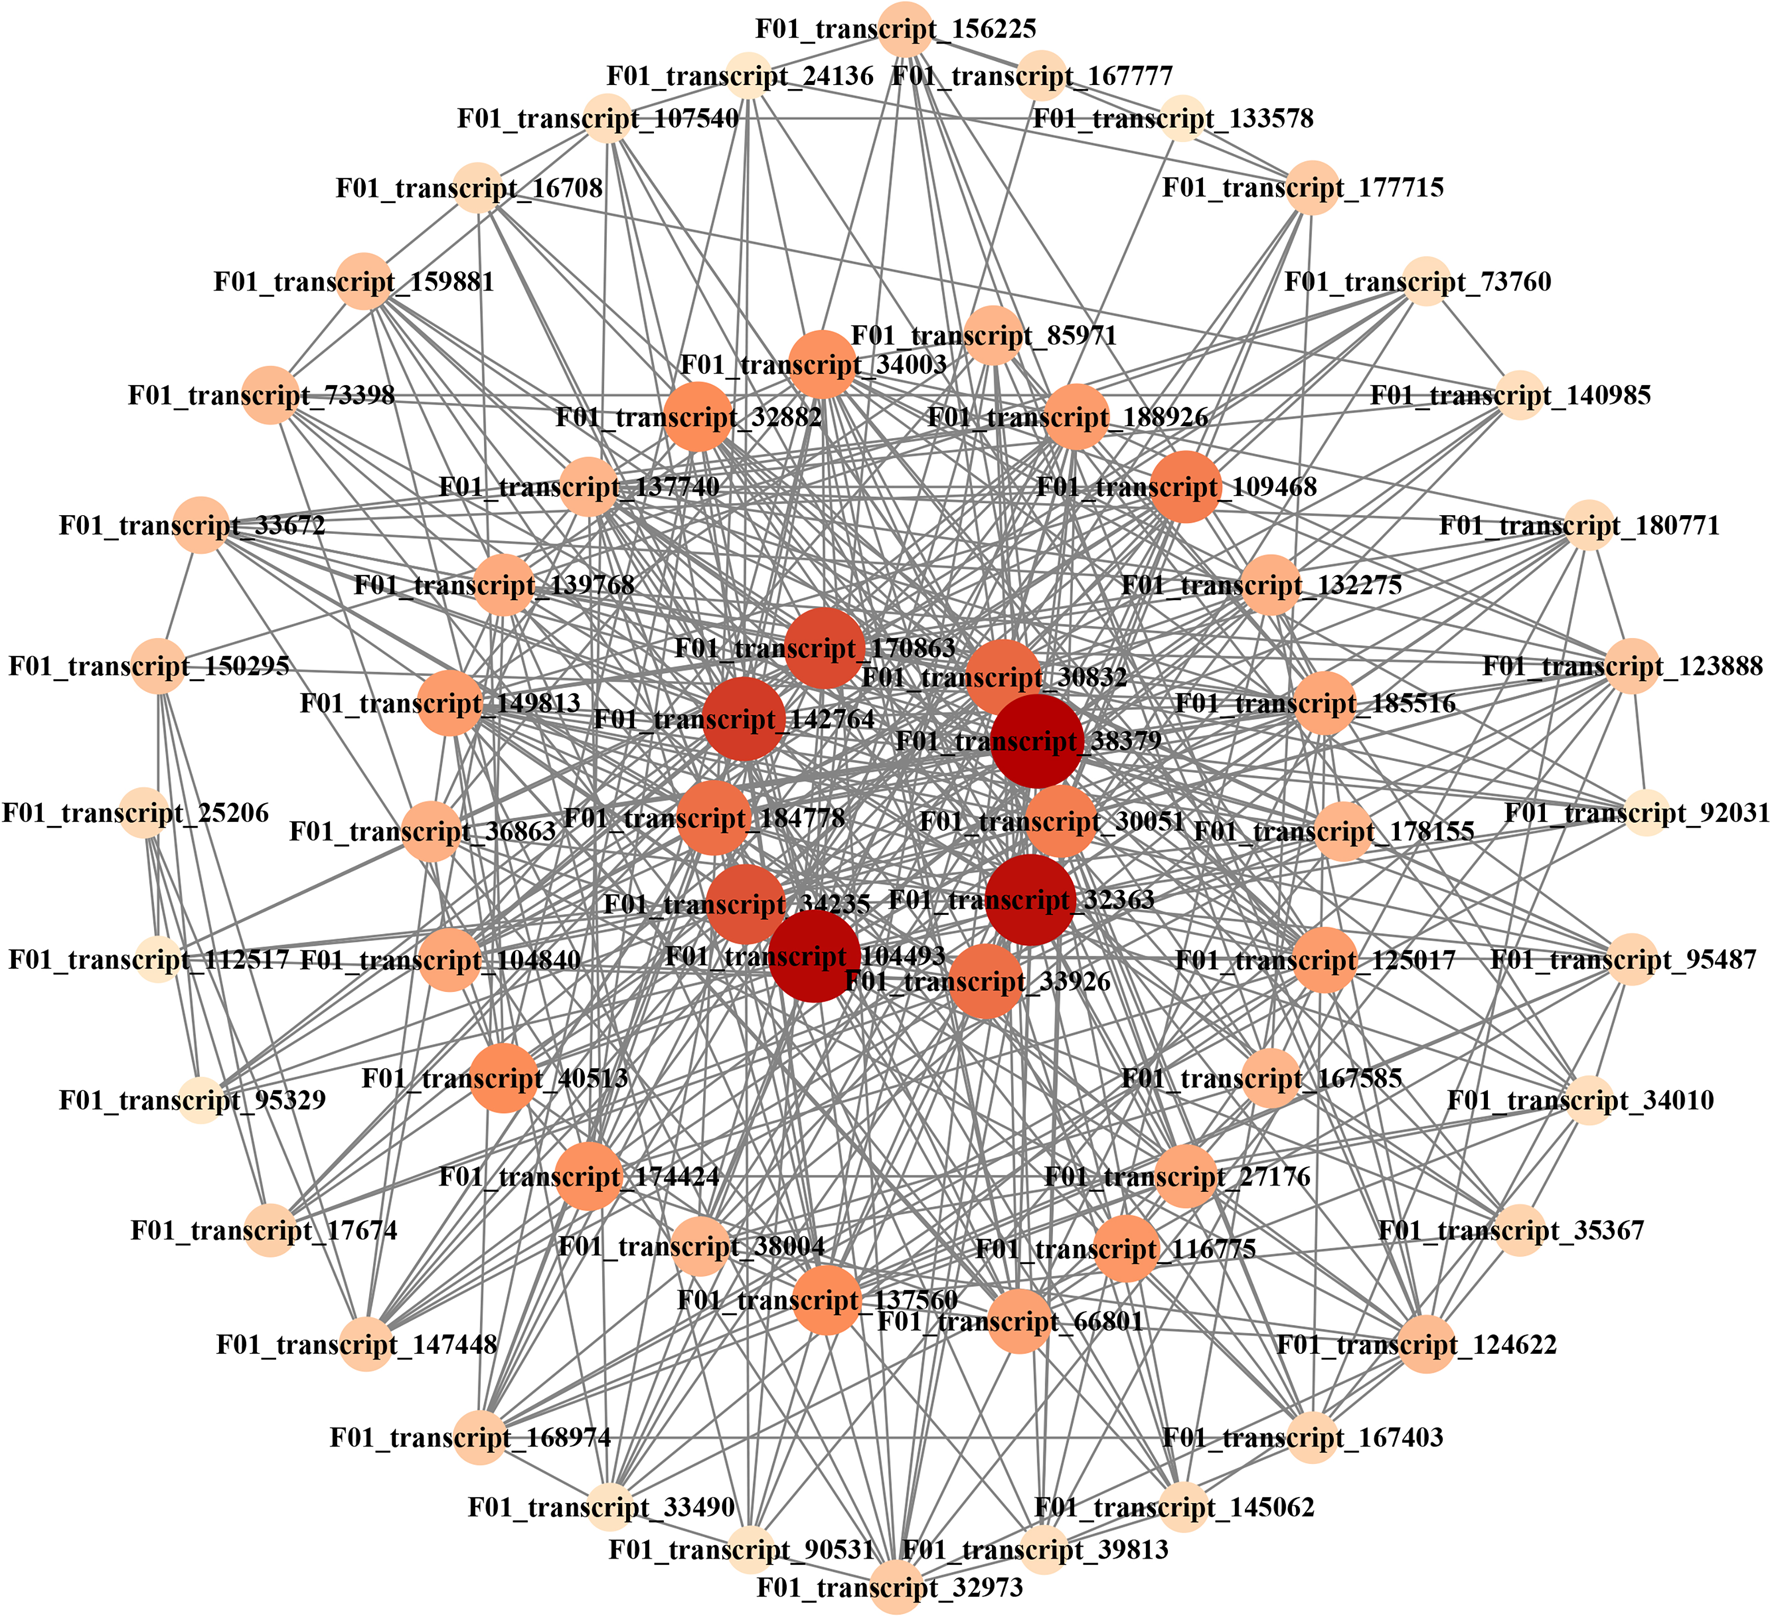
To identify the different co-expressed modules in seed development, a WGCNA with the DEGs was constructed. The minimum number of genes in each module was set to 100, and a 0.85 threshold was used to merge similar modules. In total, 19 distinct modules with various colours were ultimately identified (Fig. 9A). To identify the modules that were significantly associated with sugar content, each module was subjected to a correlation interaction analysis based on the P-value, the midnight blue module had a positive correlation with total starch (r = 0.87, P = 0.0004) and NSC content (r = 0.88, P = 0.0004) (Fig. 9B). The midnight blue module contained 1159 DEGs. For visualization, 64 hub genes interaction networks with scores >10 were obtained through MCODE (Supplementary Table S1). The colour and size of the circle were related to the score of the hub genes. Darker colours and larger circles indicated that the gene is strongly involved in sugar regulation (Fig. 10). The top ten hub genes were detected closely related to the sugar metabolism of seed development in E. sibiricus, including RING-H2 finger protein ATL8 (F01_transcript_104493), a member of SCP-2 sterol transfer family (F01_transcript_142764), protein TIFY 10A (F01_transcript_170863), ubiquitin-conjugating enzyme E2 34 (F01_transcript_184778), transmembrane emp24 domain-containing protein p24beta2 (F01_transcript_30051), ras-related protein Rab7 (F01_transcript_30832), ubiquitin-conjugating enzyme E2 11 (F01_transcript_32363), multiprotein-bridging factor 1a (F01_transcript_33926), eukaryotic translation initiation factor 5A-2 (F01_transcript_34235) and 60S acidic ribosomal protein P2B (F01_transcript_38379) (Table 3). In the meanwhile, the ten hub genes were used for qRT-PCR to validate their expression levels at five stages of seed development in E. sibiricus. The expression levels of the hub genes were generally consistent with the FPKM value by transcription sequencing, suggesting relative rationality and accuracy of the transcriptome analysis in this study (Fig. 11). The expression levels of F01_transcript_170863, F01_transcript_184778, F01_transcript_30051 and F01_transcript_33926 were gradually rising during S5–S10 and decreasing during S20–S25. The expression of other hub genes increased during the whole experiment stage.
Weighted gene co-expression network analysis (WGCNA). (A) Clustering dendrograms of genes. (B) Module correlations and corresponding P-values (in parentheses) of starch, sucrose and NSC. The colour scale on the right shows module–trait correlation from –1 (blue) to 1 (red).

Hub genes co-expression network analysis in midnight blue module
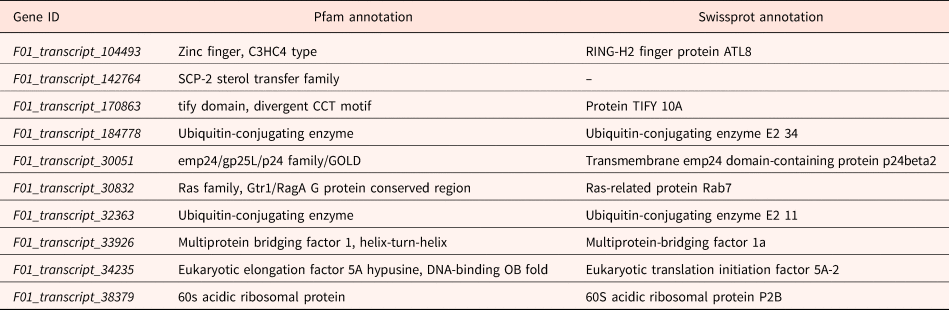
The annotation information of ten hub genes in midnight blue module based on database
qRT-PCR confirmation of ten hub genes

Identification of transcription factors (TFs) associated with seed development
TFs are powerful regulators in controlling gene expression in every aspect of plant growth and development (Riechmann and Ratcliffe, Reference Riechmann and Ratcliffe2000; Franco-Zorrilla et al., Reference Franco-Zorrilla, Lopez-Vidriero, Carrasco, Godoy, Vera and Solano2014). To gain insight into the involvement of TFs and to determine how they regulate seed development in E. sibiricus, all the differentially expressed TF-encoding genes were identified. In total, 54 TF families were identified in the process of seed development, and the top 21 families were filtered out, including NAM, ATAF1/2, CUC1/2 (NAC (63)), APETALA2/ethylene responsive factor (AP2/ERF (51), bZIP (43), v-myb avian myeloblastosis viral oncogene homolog (MYB, 43), bHLH (38)) and C2H2 zinc finger proteins (C2H2, 37), WRKY (37), MYB-related (22), GAI, RGA, SCR (GRAS, 18), C3H zinc finger proteins (C3H, 17) and NF-YB (7) (Fig. 12). In plants, bZIP TFs regulate processes such as pathogen defence, light and stress signalling, seed maturation and flower development (Jakoby et al., Reference Jakoby, Weisshaar, Dröge-Laser, Vicente-Carbajosa, Tiedemann, Kroj and Parcy2002). According to annotation results, TFs involved in seed dormancy control and the homologs of ABI5 in the bZIP family. In addition, TFs from C2C2-Dof and NF-YB also were concerned and the expression patterns are shown in Fig. 13.
Distribution of the top 21 TF families involved in seed development of E. sibiricus

The expression heatmap of TFs from bZIP, C2C2-Dof and NF-YB families.

Discussion
Full-length transcriptome sequencing is a useful tool for genes selecting
Full-length transcriptome sequencing has the advantages of comprehensively identifying alternative splicing, discovering more new genes and identifying more lncRNAs (Grabherr et al., Reference Grabherr, Haas, Yassour, Levin, Thompson, Amit, Adiconis, Fan, Raychowdhury, Zeng, Chen, Mauceli, Hacohen, Gnirke, Rhind, di Palma, Birren, Nusbaum, Lindblad-Toh, Friedman and Regev2011). In this study, we provided a comprehensive transcriptomic profile of the seed-developing network in different stages and identified a total of 105,508 full-length transcripts in 15 sample libraries and 13,205 DEGs at five stages. Among these transcripts, more than 78% were significantly similar (in terms of their sequence) to genes in public databases, the percentage of which was lower than drought research in E. sibiricus using full-length sequencing (96.75%) (Yu et al., Reference Yu, Xiong, Su, Xiong, Dong, Zhao, Shu, Bai, Lei, Yan and Ma2023), but greater than a previous study in E. sibiricus using NGS (46.69%) (Xie et al., Reference Xie, Zhang, Zhao, Zhang and Wang2017). For forage grasses, full-length transcriptomics has been widely used in recent years. A first full-length transcriptome database under 300 mM NaCl treatment at different time points was constructed for Bromus inermis L. revealing the molecular regulation response to salt stress (Li et al., Reference Li, Song, Zhou, Chen, Zhang, Pang and Zhang2022). In Trifolium ambiguum M., DEGs were identified in five tissues using full-length and NGS to provide insight in its growth and development (Yin et al., Reference Yin, Yi, Zhao, Hu, Li, He, Liu and Cui2020). In Pennisetum giganteum, leaf and root tissues under room and chilling temperature were used for comprehensive full-length transcriptome analysis to explore the cold stress response mechanism (Li et al., Reference Li, Xiang, Xu, Cui, Fu, Chen, Yang, Wang, Xie, Wei and Wang2020). However, there are no studies on the use of full-length sequencing to explore forage grass seed development. Our research opened a new horizon for the study of forage seeds.
Key stage determination of seed development in E. sibiricus
According to morphological observations, three key seed developmental stages could be determined: embryogenesis before 5 DPA, seed formation between 5 and 15 DPA, followed by maturation and desiccation around 20 DPA. In rice seeds, cellularization of endosperm was completed before 6 DPA, seeds were formed at 6–10 DPA and embryos matured at 11–20 DPA (Xue et al., Reference Xue, Zhang and Xue2012). The seeds of soybean mature and increase dry weight at 20–30 DPA (Yao et al., Reference Yao, Xiong, Qu, Li, Liu, Quan, Lu, Zhu, Chen, Li, Chen, Lian, Lu, Zhang, Zhou, Chu and Jiao2023). In addition, seed shattering is a sign that seed development has entered the maturity stage. Our previous study found that seed shattering occurred at 28 days after heading in E. sibiricus (Xie et al., Reference Xie, Zhang, Zhao, Zhang and Wang2017). In the current study, the DEGs linked to development and cell death such as F01_transcript_110107, F01_transcript_18619 reached maximum expression at S20. Above all, the seed development time differences were due to the developmental difference of the species itself, the seed maturity stage of E. sibiricus was S20.
Key GO term and KEGG pathway involving in seed development
A key term ‘beta-amylase activity’ was obtained by GO enrichment. Beta-amylase activity increased with seed development to improve grain quality, and BETA-AMYLASE 1 (BMY1) was a representative gene in this term (Gong et al., Reference Gong, Westcott, Zhang, Yan, Lance, Zhang, Sun and Li2013). In this study, the homologs of BMY1, F01_transcript_191270 and F01_transcript_98193 were down-regulated between S5 and S25. However, F01_transcript_128398, F01_transcript_150576, F01_transcript_180023, F01_transcript_8657, F01_transcript_90591 and F01_transcript_97370 were up-regulated. Most transcripts were up-regulated, which is consistent with a previous study in barley. Vinje et al. analysed the expression of the BMY1 gene in barley, which rose sharply between 5 and 17 DPA, peaking at 25 DPA (Vinje et al., Reference Vinje, Walling, Henson and Duke2019). The down-regulated expression trends of F01_transcript_191270 and F01_transcript_98193 may be related to intron polymorphism. Wu et al. found that intron 3 of BMY1 was polymorphic, and the presence of three alleles had different effects on beta-amylase activity (Wu et al., Reference Wu, Yue, Cai, Wang, Zeng and Wang2022).
Photosynthesis and hormone signal transduction pathways play significant roles in seed development of E. sibiricus. In this study, the annotation results of DEGs contained photosystem I reaction centre, photosystem II reaction centre and oxygen-evolving enhancer protein. Photosynthesis is a basic biological process that requires energy for plant growth and development. Seeds as non-foliar green tissues also can contribute energy (Simkin et al., Reference Simkin, Faralli, Ramamoorthy and Lawson2020). In soybean, photosynthesis of the pod and seed can provide 13–14% of the energy for seed maturation (Cho et al., Reference Cho, Stutz, Jones, Wang, Pelech and Ort2023). In T. aestivum, the contribution of seed photosynthesis to yield ranged from 12 to 42% (Maydup et al., Reference Maydup, Antonietta, Guiamet, Graciano, Lopez and Tambussi2010). However, photosynthesis is not necessary in the final stage of seed maturation. If chlorophyll degradation is not complete, it will lead to ‘green seed problems’ and affect the yield (Smolikova and Medvedev, Reference Smolikova and Medvedev2016). In Chenopodium quinoa, the ‘photosynthesis’ pathway also was identified during seed maturation using proteomic analysis (Shen et al., Reference Shen, Xu, Huang, Li, Xu, Lin and Huang2022).
In hormone signal transduction, ABA is the main hormone regulating seed development. The accumulation of ABA occurred in two stages, the early stage and the middle stage of seed development (Kozaki and Aoyanagi, Reference Kozaki and Aoyanagi2022). The key gene ABI3 is expressed during seed development and interacts with ABI5 in relation to ABA signalling (Collin et al., Reference Collin, Daszkowska-Golec and Szarejko2021). In this study, the homologs of ABI3 and ABI5 were identified and the putative flow chart of ABI3 and ABI5 participating in the ABA signalling pathway is shown in Fig. 14. Expression of the homologs of ABI3, F01_transcript_170113, F01_transcript_96236, F01_transcript_23598 and F01_transcript_62821, was up-regulated. The homologs of ABI5 divided into two groups, up-regulated and down-regulated. Expression of ABI3 and ABI5 inhibits seed germination, while mutation of ABI3 may reduce seed dormancy (Verma et al., Reference Verma, Attuluri and Robert2022). ABI3 was up-regulated in E. sibiricus, and the seeds may mature into dormancy. The function of these two genes can be studied by seed dormancy and germination experiments in the future.
The putative flow chart of ABI3 and ABI5 participated in ABA signalling pathway

Transcript factors regulating seed development of E. sibiricus
In our dataset, about 50% of the TFs were found to be differentially expressed between different developmental stages. The TFs from the bZIP, C2C2-Dof and NF-YB families were found to be related with seed development in E. sibiricus. In the bZIP family, TFs involved in seed dormancy control and the homologs of ABI5 were identified. The homologs of ABI5 were consistent with what was identified in the ABA signalling pathway. TFs involved in seed dormancy control contained the homologs of HISTONE BINDING PROTEIN-1B (HBP-1b) and TGACG-SEQUENCE-SPECIFIC DNA-BINDING PROTEIN (TGA). In this study, the expression of HBP-1b homologs F01_transcript_1184177 peaked at S20 and F01_transcript_152704 peaked at S25. Studies on HBP-1b are scarce, the transcript and protein abundance of HBP-1b were significantly increased during embryo germination in rice (Sano et al., Reference Sano, Lounifi, Cueff, Collet, Clément, Balzergue, Huguet, Valot, Galland and Rajjou2022). TGA plays an important role in plant defence but other functions have not been studied (Ullah et al., Reference Ullah, Magdy, Wang, Liu and Li2019). TGAs were also identified in studies of wheat seed storage protein gene regulators, but their functions were not verified (Luo et al., Reference Luo, Shen, Zhao, Li, Song, Song, Yu, Yang, Li, Sun, Wang, Gao, Liu and Zhang2021).
Ten TFs were identified from the C2C2-dof family, five of which were down-regulated and five TFs were down-regulated after up-regulation. In rice, 30 Dof TFs were divided into four groups based on their expression pattern during seed development (Gaur et al., Reference Gaur, Singh and Kumar2011). In the NF-YB family, the expression of F01_transcript_119377 (NF-YB3) peaked at S5 and F01_transcript_38918 (NF-YB1) peaked at S9. OsNF-YB1 was shown to be involved in the regulation of seed size and also affected seed starch characteristics and grain filling rate in rice (Xu et al., Reference Xu, Zhang and Xue2016). Combined with physiological results, the content of starch in seeds increased rapidly in S9–S15, and F01_transcript_38918 may be involved in regulation.
The mechanisms of starch and sucrose during seed development in E. sibiricus
During this study, starch and sucrose were the focus of attention. Starch is the main polysaccharide stored in seeds (Aguirre et al., Reference Aguirre, Kiegle, Leo and Ezquer2018). Sucrose is the main product of photosynthesis, and the accumulation of storage compounds in seeds depends on their ability to import sucrose from their parent tissues (Weber et al., Reference Weber, Borisjuk and Wobus2005). Sugar contents determination implied that starch content increased from S5 to S20 and then decreased at S25, and sucrose content decreased from S5 to S15 and then increased. The variation range of sucrose content increased after an initial decline. In T. aestivum, the accumulation of starch was reported to gradually increase in the later stages of seed development, while sucrose is gradually consumed with the progress of seed development (Shewry et al., Reference Shewry, Underwood, Wan, Lovegrove, Bhandari, Toole, Mills, Denyer and Mitchell2009; Weichert et al., Reference Weichert, Saalbach, Weichert, Kohl, Erban, Kopka, Hause, Varshney, Sreenivasulu, Strickert, Kumlehn, Weschke and Weber2010). In this study, the change of sugar content from S5 to S20 was consistent with T. aestivum, but the change at S25 was different. This may be due to a slower rate of starch accumulation or a blockage of sucrose conversion. In triticale (x Triticosecale Wittmack), the endosperm underwent programmed cell death at 21 DPA with a decrease in starch accumulation (Li et al., Reference Li, Li, Li, Gaudet, Laroche, Cao and Lu2010). We also found the expression of genes that cause cell death at S20. In H. vulgare, programmed cell death was affected, resulting in impaired sucrose distribution and less starch accumulation (Radchuk et al., Reference Radchuk, Tran, Hilo, Muszynska, Gündel, Wagner, Fuchs, Hensel, Ortleb, Munz, Rolletschek and Borisjuk2021).
Based on the result of ‘starch and sucrose metabolism’ pathway, we constructed a putative mechanistic model of starch and sucrose metabolism in E. sibiricus (Fig. 15). In this model, 14 DEGs are involved, including two DEGs regulating the hydrolysis of sucrose to D-fructose, one DEG regulating the conversion of D-glucose-6P and α-D-glucose-1P, one DEG regulating the production of ADP-glucose, six genes regulating starch synthesis, two genes regulating the production of α-D-glucose-1P from starch and two genes regulating the production of UDP-glucose. Many studies have shown that ADP-glucose pyrophosphorylase mediates key control steps in the starch synthesis pathway through SOLUBLE STARCH SYNTHASE (SS) and STARCH BRANCHING ENZYME (SBE) genes (Wei et al., Reference Wei, Jiao, Lin, Sheng, Shao, Xie, Tang, Xu and Hu2017; Ferrero et al., Reference Ferrero, Piattoni, Asencion Diez, Rojas, Hartman, Ballicora and Iglesias2020; Prathap and Tyagi, Reference Prathap and Tyagi2020). In this study, F01_transcript_147469, F01_transcript_112197 and F01_transcript_1665467, which are homologs of WHEAT STARCH SYNTHASE I (SSI) (Fujita et al., Reference Fujita, Satoh, Hayashi, Kodama, Itoh, Aihara and Nakamura2011), were highly expressed at S9–S15. F01_transcript_113004 was highly expressed at S9 and F01_transcript_1146147 was highly expressed at S15. Both are homologs of STARCH BRANCHING ENZYME I (SBEI) (Utsumi et al., Reference Utsumi, Utsumi, Tanaka, Takahashi, Okamoto, Ono, Nakamura and Seki2022). The homolog of SBEII, F01_transcript_116926, was highly expressed at S9. It can be seen that S9–S15 is the stage of rapid starch accumulation. The pattern of gene expression corresponds to physiological results. Ten hub genes related with change of starch and sucrose were identified by WGCNA (Table 3). The highest correlation genes are F01_transcript_104493, F01_transcript_142764, F01_transcript_32 363 and F01_transcript_38379. F01_transcript_104493 is a homolog of RING-H2 FINGER PROTEIN ATL8. ATL8 plays a role in the embryonic development of rice and Arabidopsis (Serrano et al., Reference Serrano, Parra, Alcaraz and Guzmán2006). F01_transcript_142764 is a member of the SCP-2 STEROL TRANSFER family. F01_transcript_32363 is related to UBIQUITIN-CONJUGATING ENZYME E2 11. F01_transcript_38 379 may be the homolog of 60S ACIDIC RIBOSOMAL PROTEIN P2B. However, none of these have been reported to be related to seed development. In this study, qRT-PCR was used to verify expression patterns of ten hub genes and, subsequently, these genes could be verified by overexpression, knockout and gene editing in E. sibiricus to confirm that sugar accumulation and metabolism in seeds is affected.
The putative mechanism of starch and sucrose metabolism pathway

Conclusion
This study aimed to investigate the molecular mechanisms underlying seed development, with a focus on differences in starch and sucrose content. We utilized full-length transcriptome sequencing on E. sibiricus seeds from five developmental stages. Key Go term ‘Beta-amylase activity’, and Key pathways such as ‘Starch and sucrose metabolism’, ‘photosynthetic-related’ and ‘hormone signal transduction’ were identified. Additionally, specific genes including F01_transcript_104493, F01_transcript_142764, F01_tr anscript_32363, F01_transcript_38379, F01_transcript_170113, F01_transcript_119377 and F01_transcript_147469 were found to be potentially involved in seed development and sugar content accumulation. These pathways and genes were identified as potentially significant through annotation and WGCNA, and their roles were further supported by additional analyses. These findings not only advance our understanding of seed development in E. sibiricus, but also provide valuable information for future seed production and breeding programmes, potentially leading to improved crop yields and quality.
Supplementary material
The supplementary material for this article can be found at https://doi.org/10.1017/S0960258524000084.
Data availability statement
The E. sibiricus transcriptome sequencing data have been deposited in the National Center for Biotechnology Information (NCBI), under accession number SRP471113: SRX22478183–SRX22478198.
Funding statement
This work was supported by earmarked fund for CARS (CARS-34), Chinese National Natural Science Foundation (32271748, 31971751), the Leading Scientist Project of Qinghai Province (2023-NK-147), Leading Scientist Project of Gansu Province (23ZDAK013), Gansu Provincial Science and Technology Major Projects (22ZD6NA007) and the Fundamental Research Fund for the Central Universities (lzujbky-2021-ct21).
Author contributions
W. X. Liu and W. G. Xie designed and managed the experiments and reviewed the manuscript. Y. Y. Zheng and X. S. Lin performed the experiments, analysed the data, made the figures and drafted the manuscript. All authors read and approved the final manuscript.
Competing interests
The authors declare that there is no conflict of interest.


 Open access