





Introduction
Major depressive disorder is one of the leading causes of disability worldwide and prevalence appears to have increased substantially since the COVID-19 pandemic (Santomauro et al., Reference Santomauro, Mantilla Herrera, Shadid, Zheng, Ashbaugh, Pigott, Abbafati, Adolph, Amlag, Aravkin, Bang-Jensen, Bertolacci, Bloom, Castellano, Castro, Chakrabarti, Chattopadhyay, Cogen, Collins and Ferrari2021). Depression is typically defined by two core symptoms (American Psychiatric Association, 2013); low mood or sadness, and anhedonia, the loss of interest or pleasure in most daily activities (often described as feeling ‘flat’ or ‘blunted’ or lacking positive affect; Heininga et al., Reference Heininga, Van Roekel, Ahles, Oldehinkel and Mezulis2017). Many evidence-based treatments for depression, including the majority of antidepressants and psychological therapies, are thought to particularly target low mood, and it has been argued that they inadequately target anhedonia (Craske et al., Reference Craske, Meuret, Ritz, Treanor and Dour2016; Dunn et al., Reference Dunn, Widnall, Warbrick, Warner, Reed, Price, Kock, Courboin, Stevens, Wright, Moberly, Geschwind, Owens, Spencer, Campbell and Kuyken2023; Pizzagalli, Reference Pizzagalli2022).
This matters because patients undergoing depression treatment commonly identify amelioration of anhedonia symptoms as their personal priority (Zimmerman et al., Reference Zimmerman, McGlinchey, Posternak, Friedman, Attiullah and Boerescu2006). In one study on recovery priorities using a 51-item questionnaire, seven of the ten items ranked most important were related to anhedonia (Demyttenaere et al., Reference Demyttenaere, Donneau, Albert, Ansseau, Constant and van Heeringen2015). Furthermore, anhedonia is associated with worse treatment outcomes, including poorer psychosocial functioning and longer time to remission (Khazanov et al., Reference Khazanov, Xu, Dunn, Cohen, DeRubeis and Hollon2020; Vinckier, Gourion, & Mouchabac, Reference Vinckier, Gourion and Mouchabac2017). Anhedonia symptoms are also more likely to persist following treatment (Alsayednasser et al., Reference Alsayednasser, Widnall, O’Mahen, Wright, Warren, Ladwa, Khazanov, Byford, Kuyken, Watkins, Ekers, Reed, Fletcher, McMillan, Farrand, Richards and Dunn2022; Dunn et al., Reference Dunn, German, Khazanov, Xu, Hollon and DeRubeis2020), and those with residual symptoms after treatment are at greater risk of experiencing relapse or recurrent depressive episodes (Buckman et al., Reference Buckman, Underwood, Clarke, Saunders, Hollon, Fearon and Pilling2018). This raises questions about how anhedonia symptoms evolve during therapy, and for whom current interventions are most effective.
Several recent studies have investigated adapted or novel psychotherapeutic treatments for depression specifically designed to address anhedonia (Craske et al., Reference Craske, Meuret, Ritz, Treanor, Dour and Rosenfield2019; Dunn et al., Reference Dunn, Widnall, Reed, Owens, Campbell and Kuyken2019). Although promising, their effectiveness in real-world settings remains variable, with individual differences in symptom progression and treatment response requiring further investigation. In practice, treatment preferences and symptom profiles can shift rapidly, requiring flexible approaches to intervention (Carlier et al., Reference Carlier, van Eeden, de Jong, Giltay, van Noorden, van der Feltz-Cornelis, Zitman, Kelderman and van Hemert2019; Fokkema, Smits, Kelderman, & Cuijpers, Reference Fokkema, Smits, Kelderman and Cuijpers2013). Emerging evidence using ecological momentary assessment suggests that anhedonia is highly dynamic, fluctuating over short timescales and exhibiting patterns of instability and change (Gallagher et al., Reference Gallagher, Collins, Lekkas, Nemesure, Griffin, Price, Heinz, Pillai, Nepal, Mackin, Campbell, Winer and Jacobson2025). Understanding of how anhedonia responds over the course of therapy might therefore support development of more tailored and responsive treatment pathways.
Sessional outcome data from large routine datasets (such as those collected in England by NHS Talking Therapies for Anxiety and Depression [TTad]) offer a valuable opportunity to gain that understanding. Symptom trajectories can be modeled over time, including whether changes are consistent across different groups or treatments (Brookes et al., Reference Brookes, Whitley, Peters, Mulheran, Egger and Davey Smith2001; Ioannidis, Reference Ioannidis2005). This can clarify when baseline anhedonia severity is a barrier to treatment, and help in the early detection of indicators of poor response. Patients classified as “off-track,” who fail to show expected early improvements, are at heightened risk of non-response or deterioration (Lambert, Reference Lambert2007; Schilling et al., Reference Schilling, Zimmermann, Rubel, Boyle and Lutz2021). Recognizing these patterns can help clinicians modify care, such as by intensifying interventions, altering therapeutic approaches, or integrating adjunctive treatments.
Growth Mixture Modeling (GMM) provides a framework to capture this complexity by uncovering distinct symptom trajectories within heterogeneous populations (Saunders, Buckman, & Pilling, Reference Saunders, Buckman and Pilling2020a). Researchers can classify patients into distinct change trajectories and examine associations between treatment and those trajectories of change. This improves our understanding of how effective treatments are, who benefits most, and by when improvement might be (Saunders, Buckman, & Pilling, Reference Saunders, Buckman and Pilling2020a). Applying this approach to anhedonia can provide novel insights into how responsive current treatments are and how outcomes might be improved when anhedonia is a key barrier to recovery.
Aims
This study aimed to determine: if there were distinct trajectories of change in anhedonia for people who receive psychological treatments for depression (Aim 1); whether pre-treatment patient characteristics were associated with following different anhedonia trajectories (Aim 2); and whether the type of psychological treatment received impacted the likelihood of following different anhedonia trajectories (Aim 3).
Method
Analyses were conducted according to a pre-registered protocol (osf.io/s6bjp; Pugh, Buckman, & Saunders, Reference Pugh, Buckman and Saunders2024).
Participants
Participants were adults treated for depression with high-intensity psychological therapies from four of the nine TTad services that contributed data as part of the North and Central East London NHS TTad Service Improvement and Research Network (NCEL NHS TTad SIRN; Saunders et al., Reference Saunders, Cape, Leibowitz, Aguirre, Jena, Cirkovic, Wheatley, Main, Pilling and Buckman2020b). TTad (formerly IAPT) is a nationally implemented primary care program in England that provides evidence-based psychological therapies, such as CBT and counselling, for common mental health problems. The completion of pre-post-treatment outcomes in TTad is over 99% (Clark, Reference Clark2018), with most patients completing measures on a sessional basis, providing the opportunity to use trajectory modeling to understand the forms of change in anhedonia symptoms during therapy. Pseudonymized individual patient data were used from patients seen between August 2008 and September 2024.
Inclusion criteria
-
• Scored above caseness for depression (i.e. score of 10 or higher on Patient Health Questionnaire-9 [PHQ-9]) at baseline
-
• Had a problem descriptor (ICD-10 diagnosis that is the agreed focus of treatment) of ‘depression’ or ‘recurrent depression’ (World Health Organization, 2016)
-
• Aged 18 years or above at referral
-
• At least three PHQ-9 measurement points taken during high-intensity psychological therapy (within TTad the following therapies are considered “high-intensity”: Cognitive Behavioral Therapy [CBT], Behavioral Activation [BA], Behavioral Couples Therapy, Brief Psychodynamic Psychotherapy, Collaborative Care, Counselling for Depression [CfD/Counselling], Dynamic Interpersonal Therapy [DIT], Interpersonal Psychotherapy [IPT], and Eye Movement Desensitization and Reprocessing [EMDR], Clark, Reference Clark2018)
-
• Had individual item data from the PHQ-9
Patients receiving treatment for something other than depression were excluded, as well as patients who received low-intensity treatments only. Individuals who received one session of low-intensity treatment and then three or more sessions of high-intensity treatment were included.
Measures
Anhedonia
The PHQ-9 is a self-report measure of depressive symptoms consisting of 9 items, whereby patients are required to state how often in the last two weeks they were bothered by the items outlined in the questionnaire. The response options are as follows: Not at all (0), Several days (1), More than half the days (2), and Nearly every day (3). This study used item 1, “Little interest or pleasure in doing things,” as a measure of anhedonia.
Other measures
In addition, the Generalized Anxiety Disorder Scale (GAD-7) (Spitzer, Kroenke, Williams, & Löwe, Reference Spitzer, Kroenke, Williams and Löwe2006) and Work and Social Adjustment Scale (WSAS) (Mundt, Marks, Shear, & Greist, Reference Mundt, Marks, Shear and Greist2002) are self-report measures for generalized anxiety and impaired functioning, which were used to consider the associations between patient characteristics and the different trajectories of change in anhedonia. All domains of the WSAS other than “work” were included at the item level, as this is collinear with employment status.
Variables
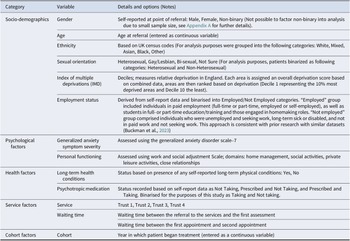
See Table 1 for the list of independent variables for Research Aim 2.
Independent variables for patient data analysis (Research Aim 2)
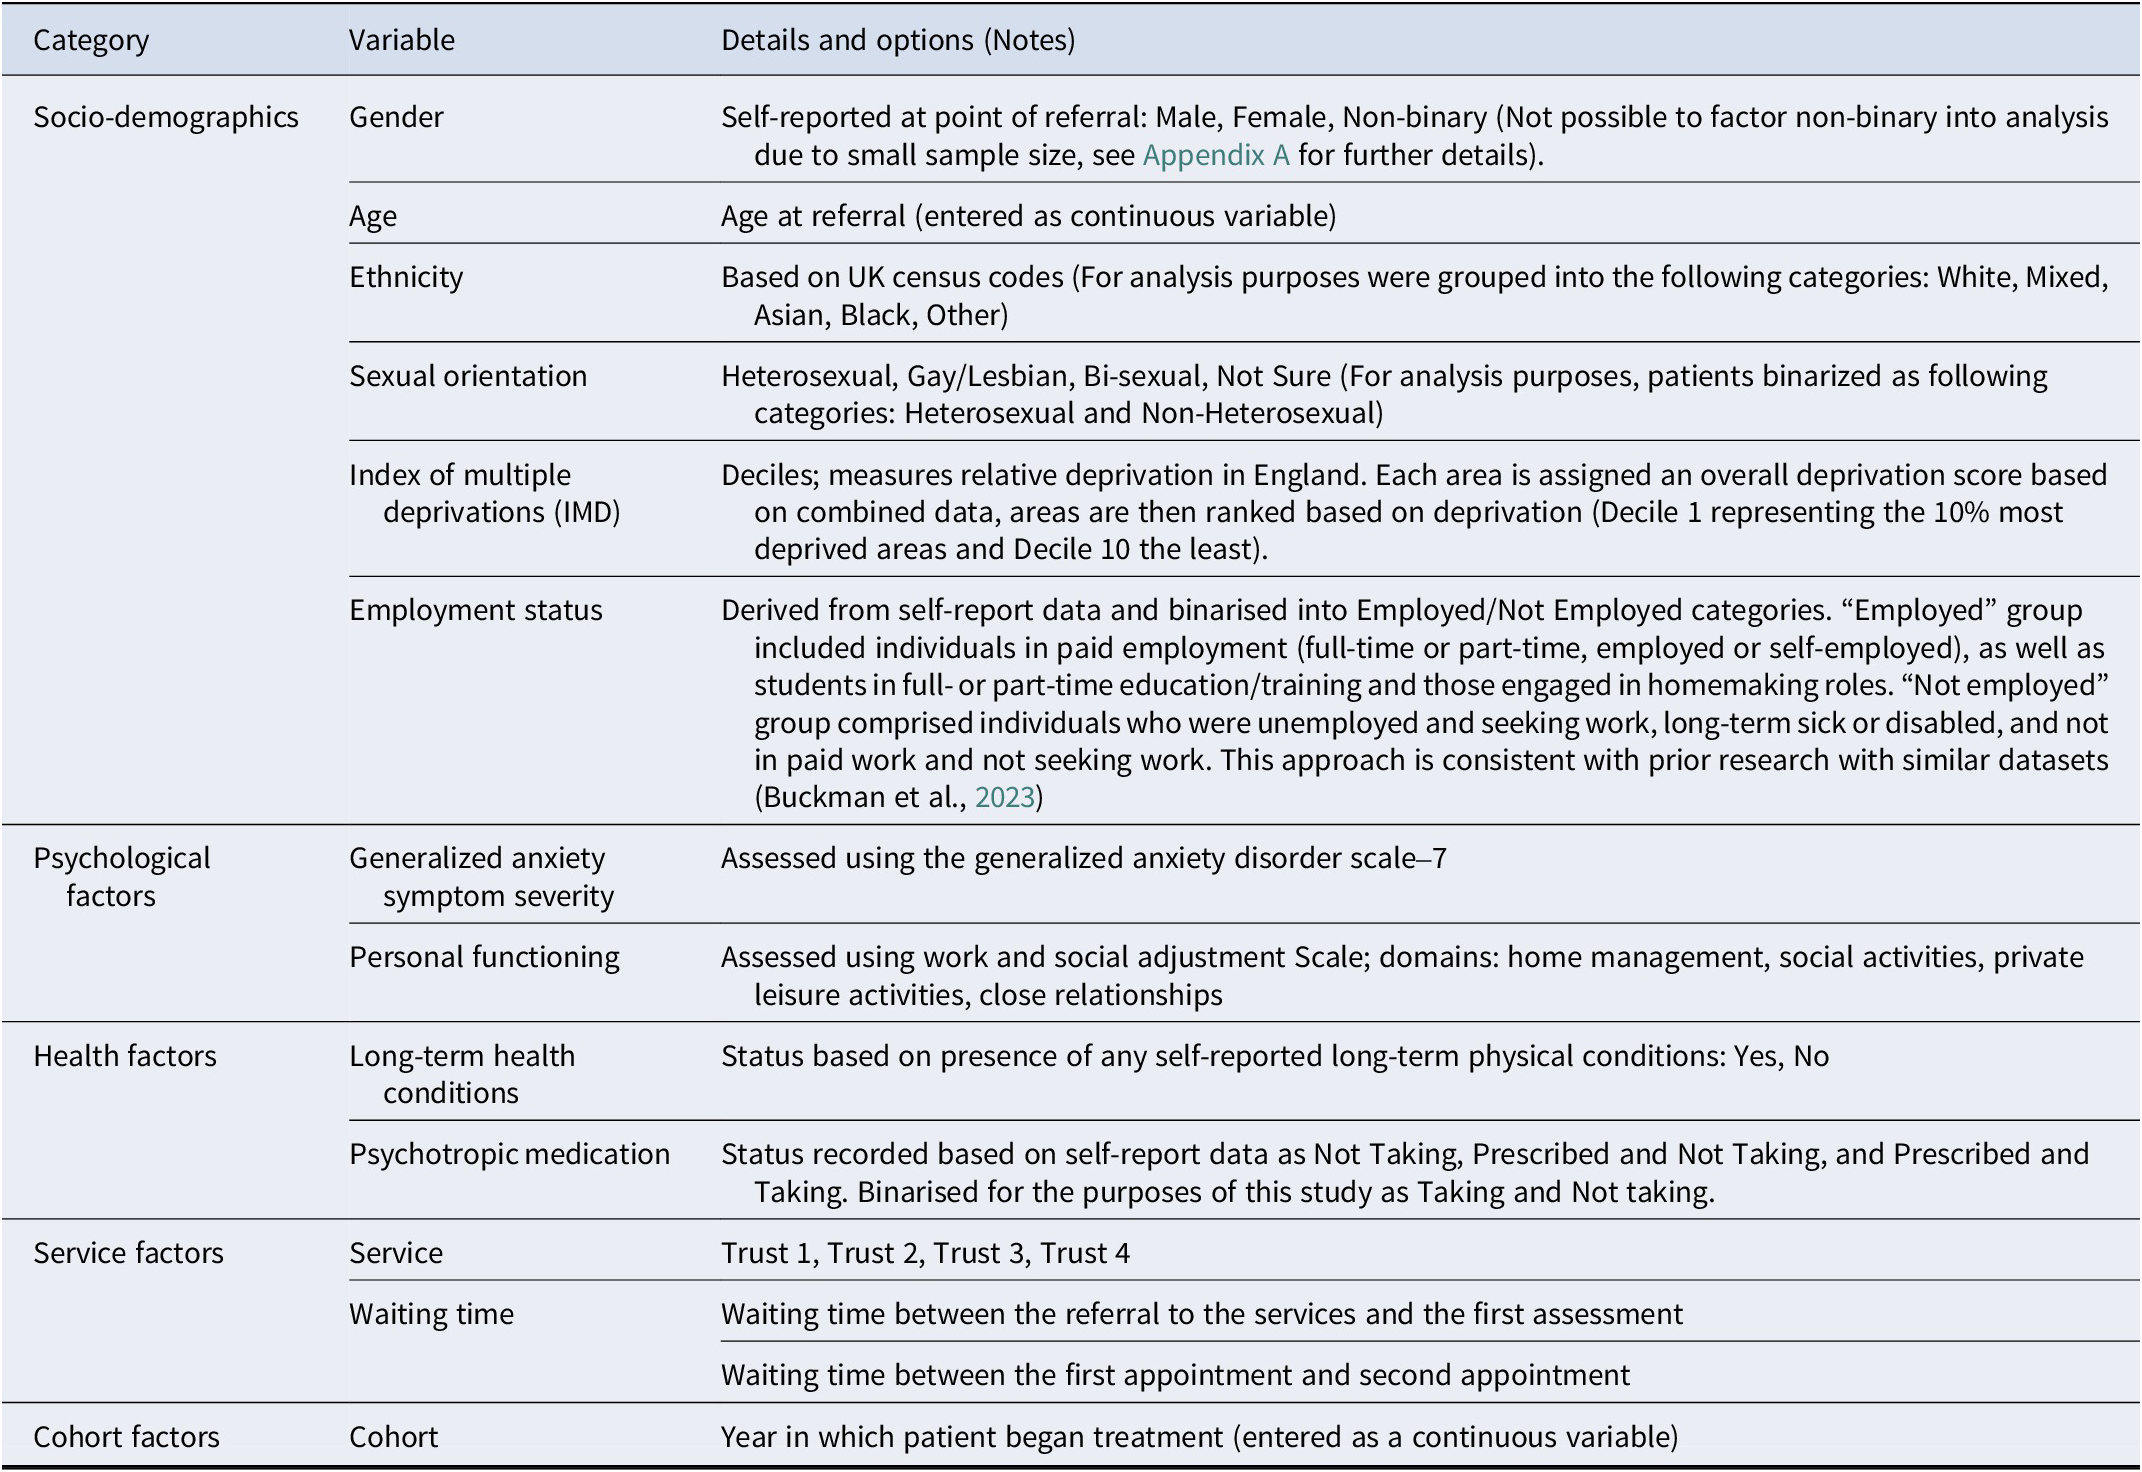
Table 1. Long description
The table consists of three columns: Category, Variable, and Details and options (Notes).
1. Socio-demographics category includes:
- Gender: Self-reported as Male, Female, or Non-binary.
- Age: Continuous variable at referral.
- Ethnicity: Grouped into White, Mixed, Asian, Black, or Other.
- Sexual orientation: Binarized as Heterosexual or Non-Heterosexual.
- Index of multiple deprivations (I M D): Deciles 1 to 10 measuring relative deprivation in England.
- Employment status: Binarized as Employed (including students and homemakers) or Not Employed.
2. Psychological factors category includes:
- Generalized anxiety symptom severity: Assessed via G A D-7 scale.
- Personal functioning: Assessed via Work and Social Adjustment Scale.
3. Health factors category includes:
- Long-term health conditions: Self-reported as Yes or No.
- Psychotropic medication: Binarized as Taking or Not taking.
4. Service factors category includes:
- Service: Categorized by Trust 1, Trust 2, Trust 3, or Trust 4.
- Waiting time: Measured between referral and first assessment, and between first and second appointments.
5. Cohort factors category includes:
- Cohort: The year treatment began, entered as a continuous variable.
To consider the degree to which treatment type was associated with trajectory classes, multinomial regression models were expanded to include treatment type as an independent variable. As patients may receive more than one treatment type, analyses focused on the main treatment received, i.e. identified treatment type for >50% of sessions.
Statistical analysis
This study used existing sessional anhedonia (PHQ-9 item-1) data from individuals receiving high-intensity psychological treatment. Data from the first 12 sessions of treatment were modeled. A 12-session model was selected to maximize data inclusion without excessive missingness, in line with previous depression trajectory modeling studies using similar datasets, which have typically examined change over 10–13 sessions (Saunders et al., Reference Saunders, Buckman, Cape, Fearon, Leibowitz and Pilling2019; Skelton et al., Reference Skelton, Carr, Buckman, Davies, Goldsmith, Hirsch, Peel, Rayner, Rimes, Saunders, Wingrove, Breen and Eley2023).
Research Aim 1
To understand if there are distinct trajectories of change in anhedonia, latent growth curve analysis (LGC) first estimated the expected response curve over 12 sessions. The model was tested using linear, quadratic, and cubic factors, following the standard modeling approach using polynomial growth functions and acknowledging that change during psychological therapy is typically non-linear (Saunders et al., Reference Saunders, Buckman, Cape, Fearon, Leibowitz and Pilling2019). There are no fixed a priori sample size requirements for LGC modeling, however guidance from structural equation modeling literature suggests that samples of approximately 200 or more are typically sufficient for stable estimation, with larger samples recommended for more complex models (Kline, Reference Kline2016). We expected the present sample to substantially exceed this recommendation. Model fit was assessed using the following metrics: the Comparative Fit Index (CFI), Tucker-Lewis Index (TLI), and Root Mean Squared Error of Approximation (RMSEA). CFI and TLI scores above 0.9 and 0.95 indicate good and excellent fit, whereas RMSEA scores <0.08 and <0.05 indicate reasonable and close/good-fit (Kline, Reference Kline2016).
Growth mixture odeling (GMM) was then used to identify subgroups based on sessional trajectories of symptom-change (Saunders et al., Reference Saunders, Buckman, Cape, Fearon, Leibowitz and Pilling2019; Vittengl, Clark, Thase, & Jarrett, Reference Vittengl, Clark, Thase and Jarrett2013). Similarly, for LGC, seeking as large a sample as possible is recommended, with simulation studies recommending larger samples (1000+) as this improves class detection and parameter stability (Kim, Reference Kim2012; Nylund, Asparouhov, & Muthén, Reference Nylund, Asparouhov and Muthén2007). As there were no specific hypotheses about class number, models were estimated from two classes upwards with fit assessed sequentially. GMM models were compared using the Vuong-Lo-Medell-Rubin Likelihood Ratio Test (VLMR-LRT), Akaike Information Criterion (AIC), and Bayesian Information Criterion (BIC). P-values >0.05 indicate the present model does not significantly improve fit over a simpler model with one fewer class, whilst lower AIC and BIC values indicate better fit (Nylund, Asparouhov, & Muthén, Reference Nylund, Asparouhov and Muthén2007). Decisions about the optimal model solution were made in line with best practice. The smallest class should represent at least 5% of the sample to ensure clinical utility (Bauer & Curran, Reference Bauer and Curran2003; Spinhoven et al., Reference Spinhoven, Batelaan, Rhebergen, van Balkom, Schoevers and Penninx2016). When in conflict with other indices of model fit (including VLMR-LRT and AIC), the BIC is generally prioritized when dealing with large sample sizes due to greater penalization of model complexity (Chen et al., Reference Chen, Luo, Palardy, Glaman and McEnturff2017; Sen & Cohen, Reference Sen and Cohen2024), consistency in model selection (Vrieze, Reference Vrieze2012), and robust performance across different simulation scenarios (McNeish & Harring, Reference McNeish and Harring2017).
There are no universally agreed a priori sample size requirements for LGC or GMM; seeking as large a sample is typically recommended, however, for both approaches. Guidance from structural equation modeling literature suggests approximately 200 or more are needed for stable estimation in LGC, and greater needed for more complex models (Kline, Reference Kline2016), while simulation studies in mixture modeling suggest that larger samples (1000+) improve class detection and parameter stability, especially if a large number of classes might be identified (Kim, Reference Kim2012; Nylund, Asparouhov, & Muthén, Reference Nylund, Asparouhov and Muthén2007). All available cases were therefore sought, and we expected the present sample to substantially exceed these recommendations.
Research Aim 2
R3STEP was used to examine the associations between baseline patient characteristics and anhedonia trajectory class membership. R3STEP is a three-step Mplus procedure that estimates the latent class model, then assigns individuals to classes while accounting for classification uncertainty, and finally uses class assignments in a multinomial logistic regression wherein all predictors are entered simultaneously (Asparouhov & Muthén, Reference Asparouhov and Muthén2014). This retains variance in class membership likelihood and reduces bias in estimating associations relative to conducting analyses in separate steps.
Research Aim 3
For the third research question, examining the association between treatment type and trajectory class membership, R3STEP was also used. To ensure statistical power and reliable estimates for logistic regression (Bujang, Sa’at, Tg Abu Bakar Sidik, & Chien Joo, Reference Bujang, Sa’at, Tg Abu Bakar Sidik and Chien Joo2018), only treatment types with a sufficient sample size, as determined by the formula n=100 + 50(𝑖), were included (𝑖 referring to the number of independent variables in the model). Only CfD and CBT, therefore, were compared, as the third most popular treatment type, IPT (n=223), did not meet the necessary participant threshold of n = 250.
Missing data, software, and packages
LGC and GMM modeling was performed using Mplus(v8). Missing sessional PHQ-9 item −1 data was handled using Full Information Maximum Likelihood (FIML) as standard (Geiser, Reference Geiser2012). Multiple imputation was also used for handling missing data for the independent variables listed in Table 1 (Asparouhov & Muthén, Reference Asparouhov and Muthén2022).
Results
Descriptive statistics
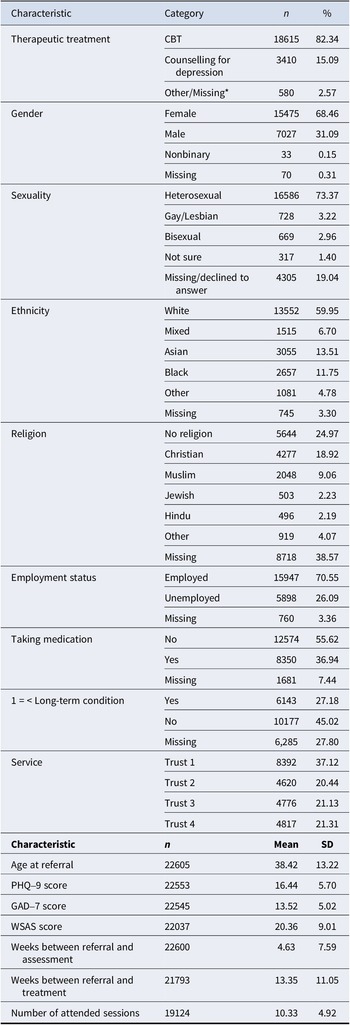
A total of 22,605 patients met the inclusion criteria and attended an average of 10.32 sessions. Table 2 presents baseline characteristics and demographic data.
Baseline characteristics and demographic data
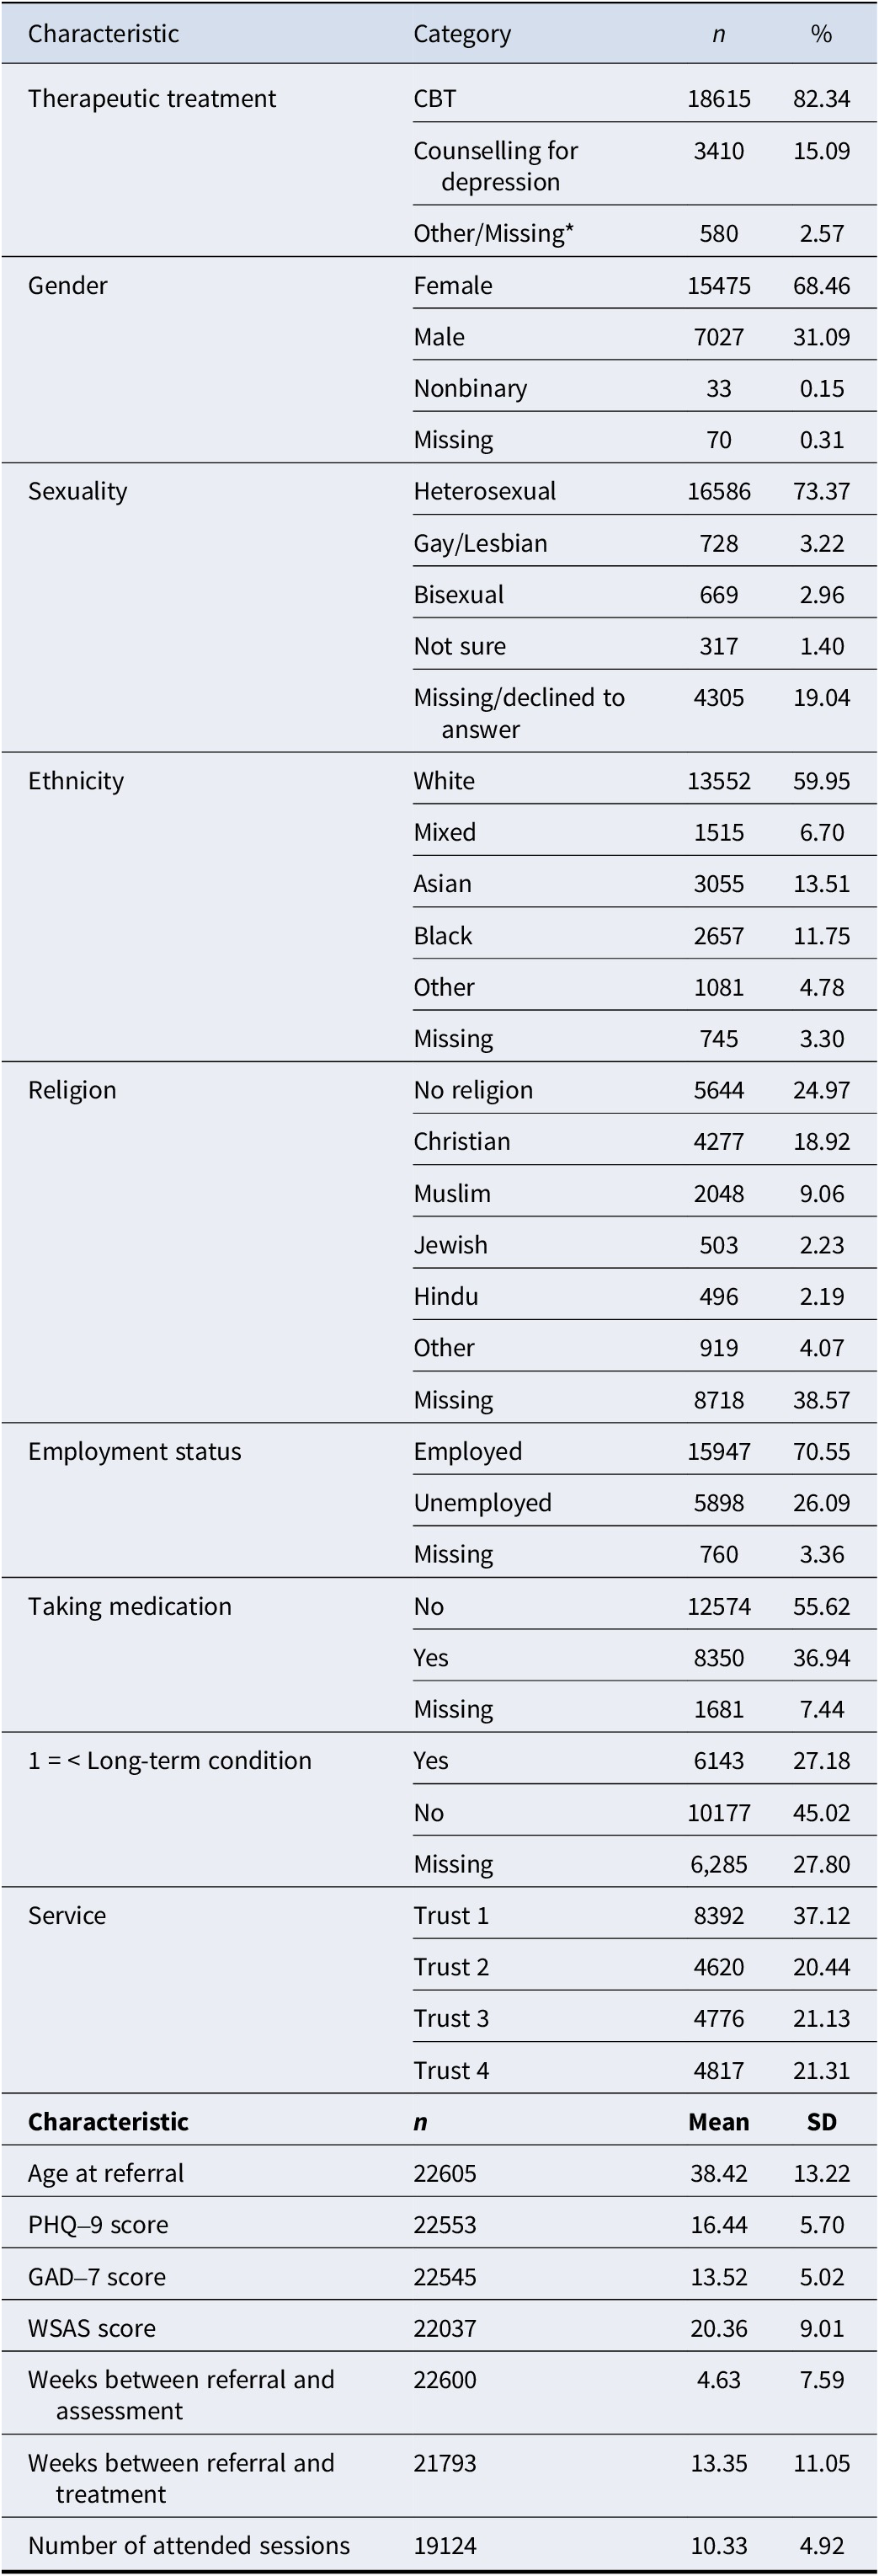
Table 2. Long description
The table is divided into categorical demographics and continuous clinical characteristics.
Categorical Data (Characteristic, Category, n, percentage):
- Therapeutic treatment: C B T (18615, 82.34%), Counselling for depression (3410, 15.09%), Other/Missing (580, 2.57%).
- Gender: Female (15475, 68.46%), Male (7027, 31.09%), Nonbinary (33, 0.15%), Missing (70, 0.31%).
- Sexuality: Heterosexual (16586, 73.37%), Gay/Lesbian (728, 3.22%), Bisexual (669, 2.96%), Not sure (317, 1.40%), Missing/declined (4305, 19.04%).
- Ethnicity: White (13552, 59.95%), Mixed (1515, 6.70%), Asian (3055, 13.51%), Black (2657, 11.75%), Other (1081, 4.78%), Missing (745, 3.30%).
- Religion: No religion (5644, 24.97%), Christian (4277, 18.92%), Muslim (2048, 9.06%), Jewish (503, 2.23%), Hindu (496, 2.19%), Other (919, 4.07%), Missing (8718, 38.57%).
- Employment status: Employed (15947, 70.55%), Unemployed (5898, 26.09%), Missing (760, 3.36%).
- Taking medication: No (12574, 55.62%), Yes (8350, 36.94%), Missing (1681, 7.44%).
- Long-term condition: Yes (6143, 27.18%), No (10177, 45.02%), Missing (6285, 27.80%).
- Service: Trust 1 (8392, 37.12%), Trust 2 (4620, 20.44%), Trust 3 (4776, 21.13%), Trust 4 (4817, 21.31%).
Continuous Data (Characteristic, n, Mean, S D):
- Age at referral: 22605, 38.42, 13.22.
- P H Q 9 score: 22553, 16.44, 5.70.
- G A D 7 score: 22545, 13.52, 5.02.
- W S A S score: 22037, 20.36, 9.01.
- Weeks between referral and assessment: 22600, 4.63, 7.59.
- Weeks between referral and treatment: 21793, 13.35, 11.05.
- Number of attended sessions: 19124, 10.33, 4.92.
Note: CBT, Cognitive Behavioral Therapy; PHQ-9, Patient Health Questionnaire-9; GAD-7, Generalized Anxiety Disorder Scale-7; WSAS, Work and Social Adjustment Scale. All column headers in each section of the table are bolded.
*No specified therapeutic treatment other than CBT or Counselling was delivered to >1% of participants (Interpersonal Therapy/IPT was the third-most delivered, to 223 participants/0.98% of the sample), so all other treatments were grouped into the “Other” category.
Research Aim 1
Latent growth curve modeling
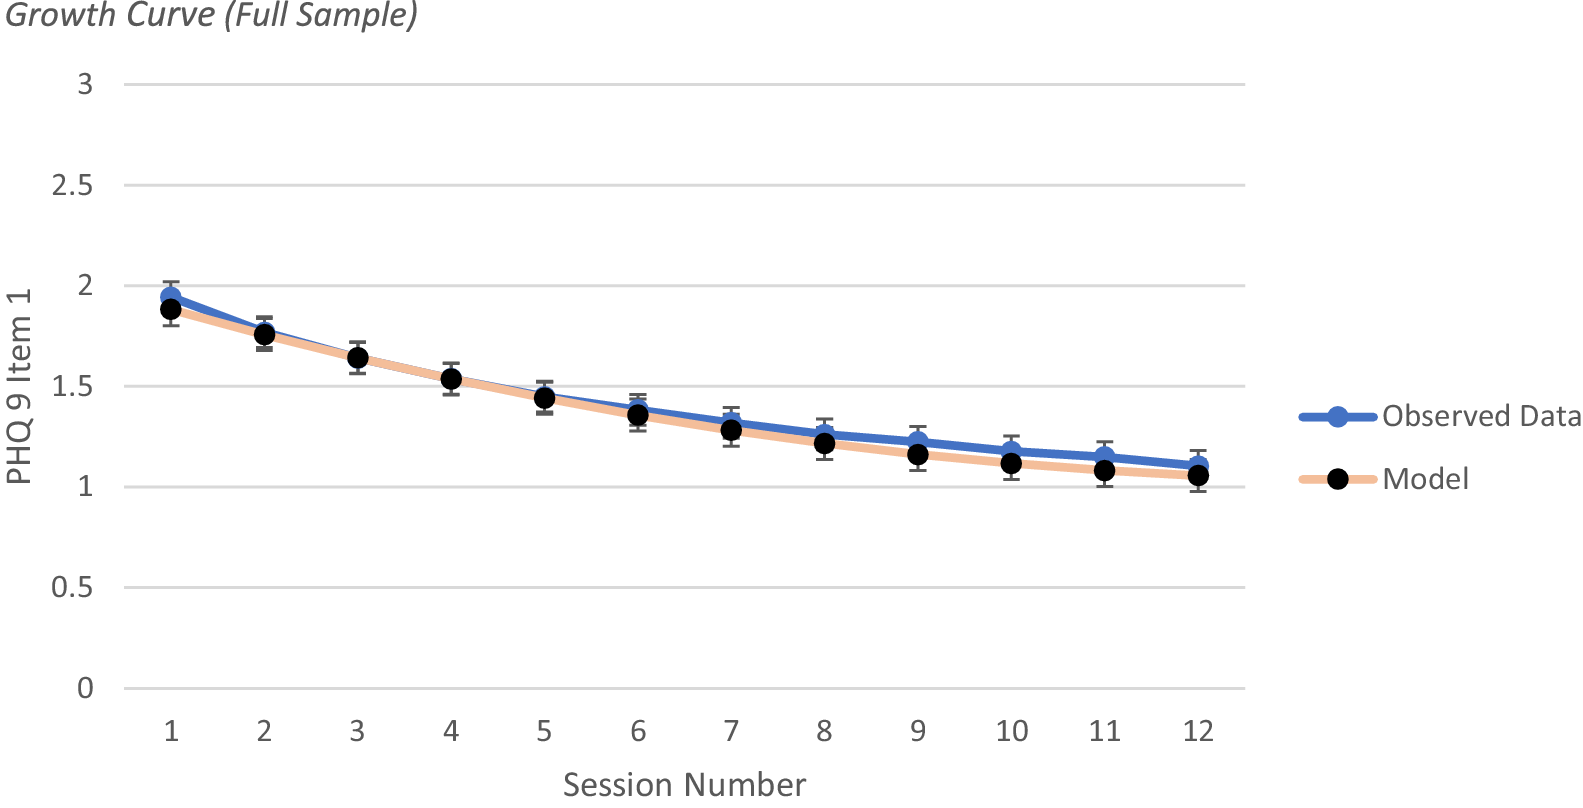
To understand if there are distinct trajectories of change in anhedonia, the first best fit for the data was obtained using a quadratic model, which is presented in Figure 1, displaying a decrease in anhedonia scores before levelling out. Fit and growth parameter statistics are displayed in Appendix A.
Growth curve (full sample).
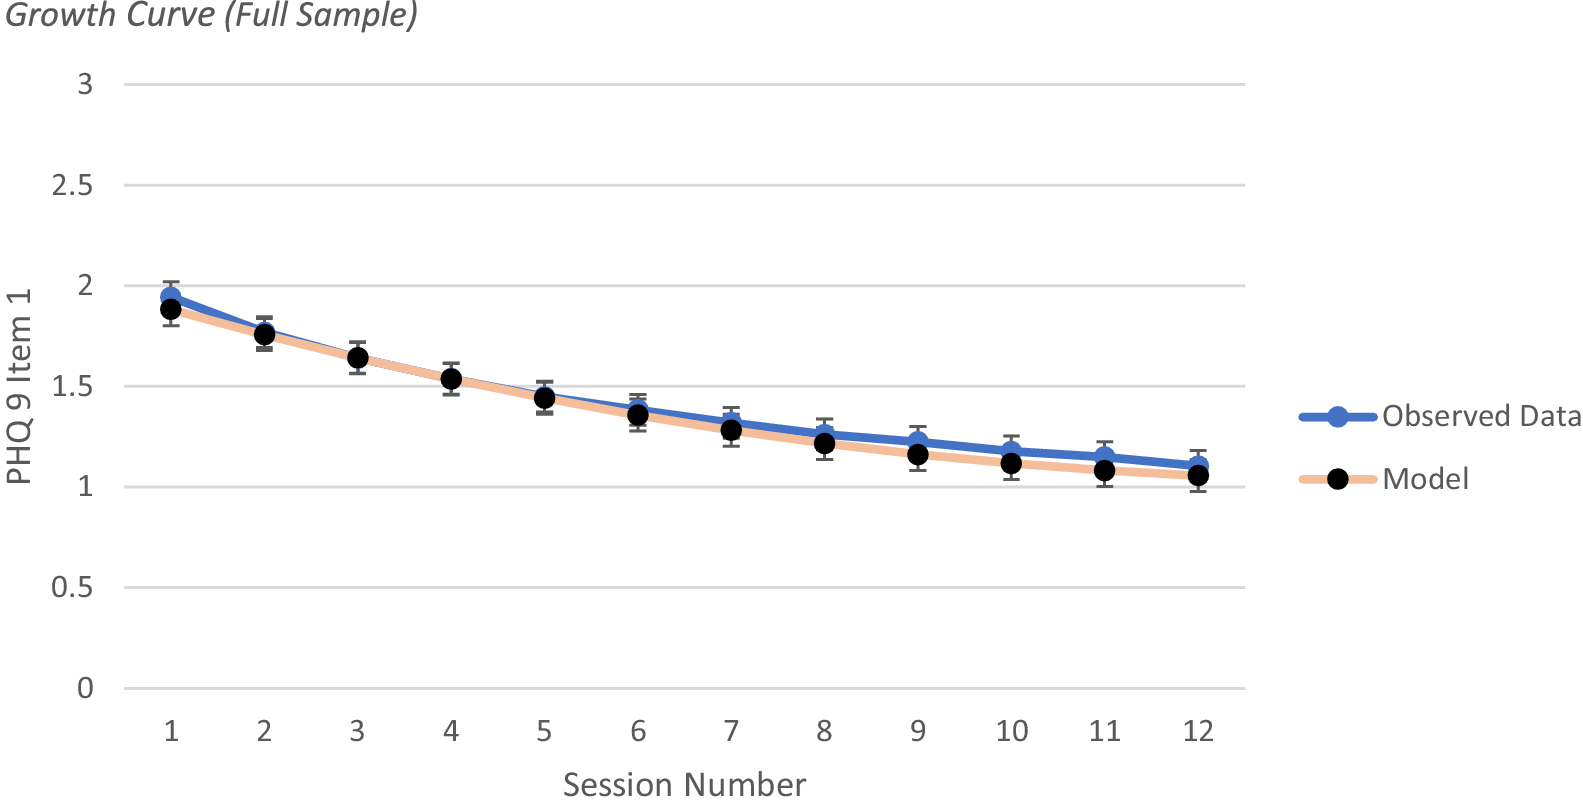
Figure 1. Long description
The x-axis is labeled Session Number and ranges from 1 to 12. The y-axis is labeled P H Q 9 Item 1 and ranges from 0 to 3 in increments of 0.5. Two lines are plotted. The first line, representing Observed Data, is blue with circular markers and vertical error bars. It starts at approximately 1.95 at session 1 and follows a steady, slightly curved downward trend to approximately 1.1 at session 12. The second line, representing the Model, is light orange with black circular markers and vertical error bars. It starts slightly lower than the observed data at session 1, around 1.9, and follows a nearly identical downward trajectory, ending at approximately 1.05 at session 12. The two lines overlap significantly throughout the duration of the twelve sessions. A legend to the right of the plot identifies the blue line as Observed Data and the orange line with black dots as Model.
Growth mixture modeling
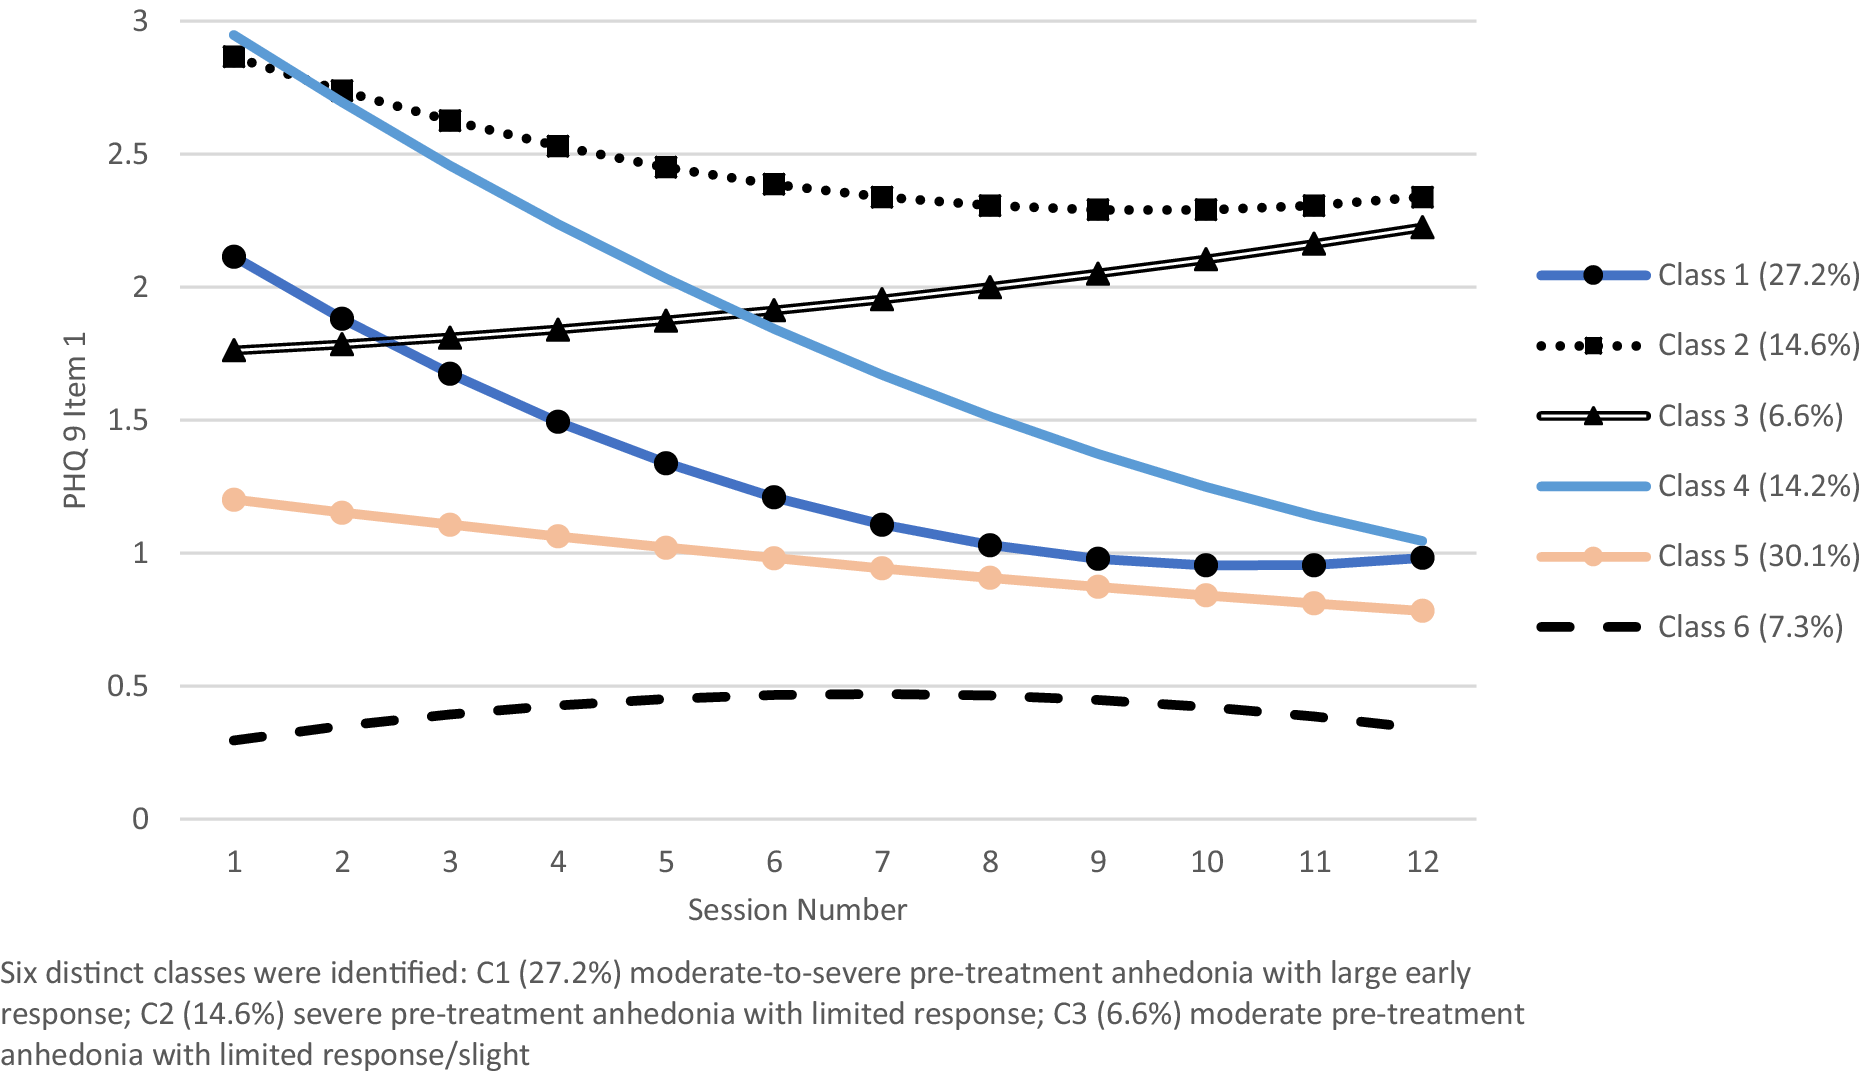
GMM was performed on anhedonia scores using quadratic models, with a six-class solution preferred (model fit statistics in Appendix B). The identified trajectories are displayed in Figure 2, with class labels assigned based on visual interpretation of trajectory shape intended as descriptive summaries rather than formal classifications of change, with growth parameter statistics presented in Appendix B.
Trajectory classes of anhedonia over time.
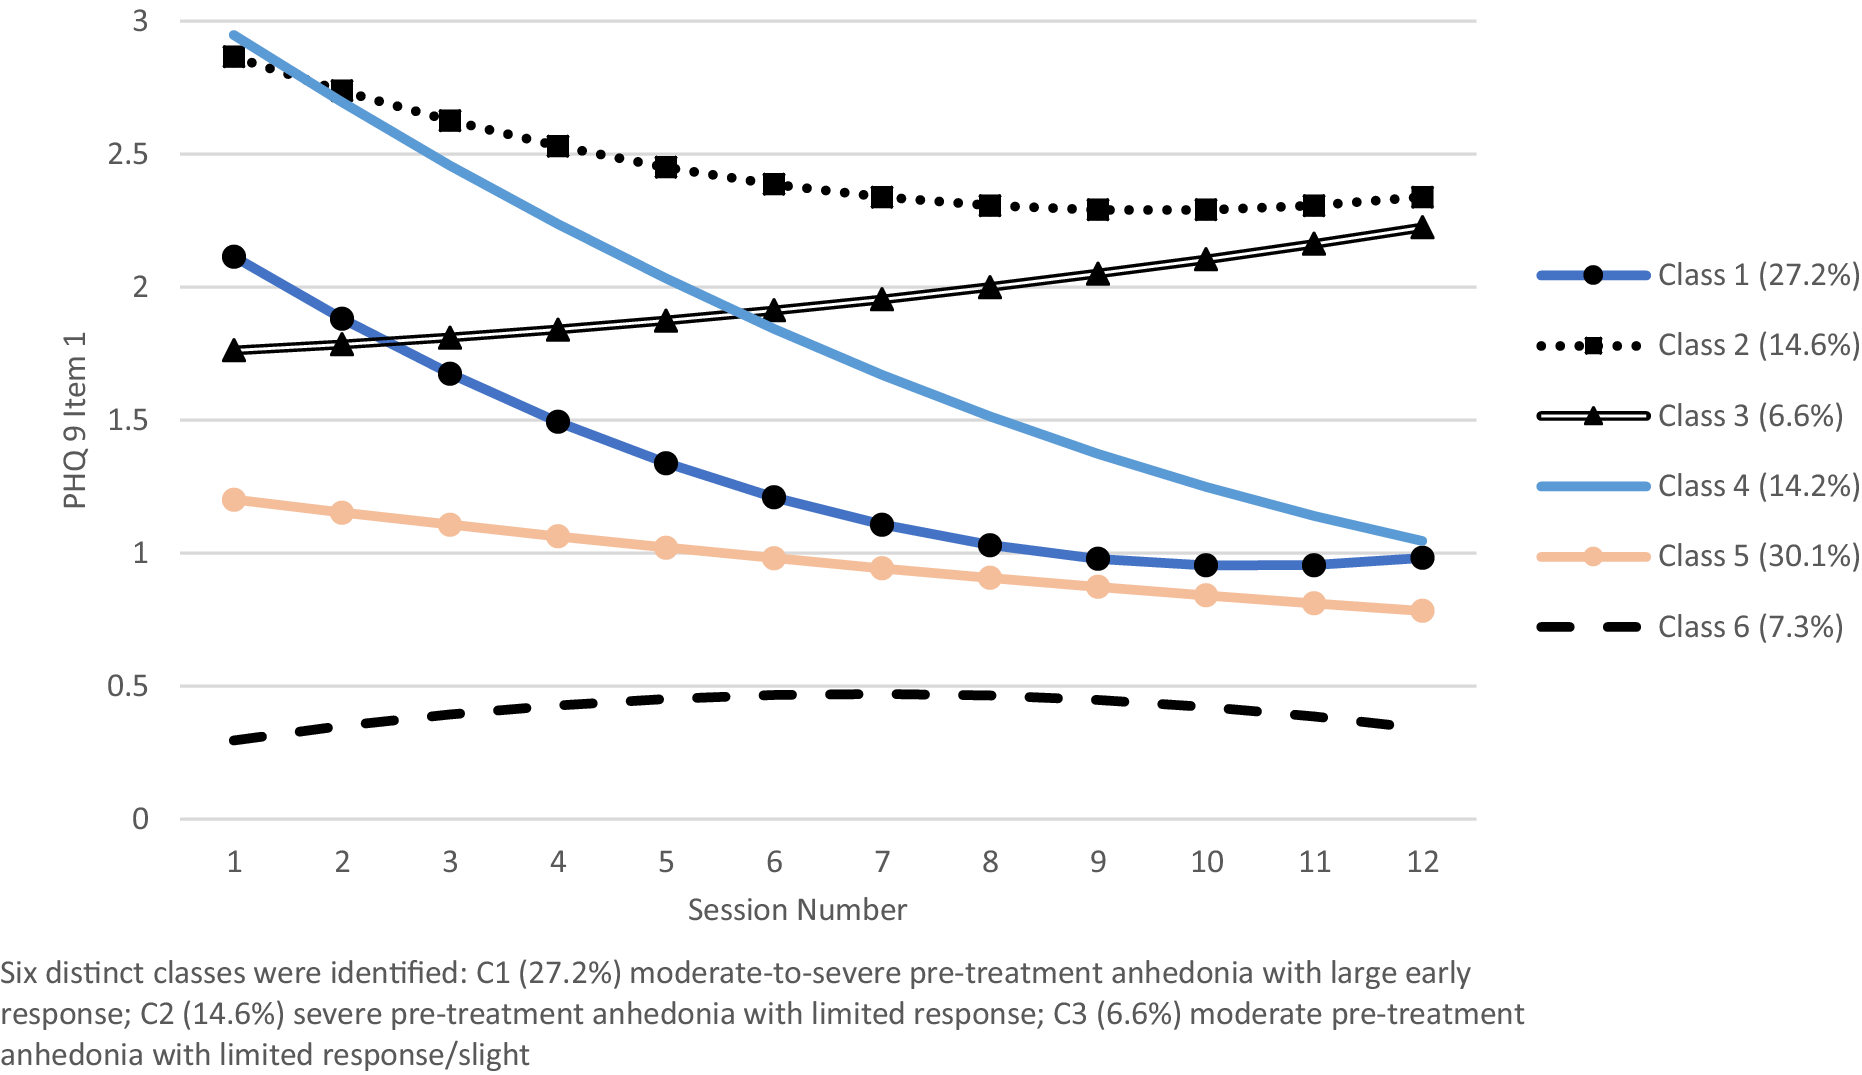
Figure 2. Long description
The X-axis is labeled Session Number and ranges from 1 to 12. The Y-axis is labeled P H Q 9 Item 1 and ranges from 0 to 3. Six distinct trajectory lines are plotted.
* Class 1 (27.2%): A dark blue line with circular markers starting at 2.1 and showing a steep exponential decay, leveling off at 1.0 by session 10.
* Class 2 (14.6%): A black dotted line with square markers starting at 2.9 and showing a gradual, slightly concave decrease to 2.3.
* Class 3 (6.6%): A black double-line with triangular markers starting at 1.8 and showing a steady linear increase to 2.2.
* Class 4 (14.2%): A solid light blue line starting at 2.9 and showing a constant linear decrease to 1.0.
* Class 5 (30.1%): A light peach line with circular markers starting at 1.2 and showing a gradual linear decrease to 0.8.
* Class 6 (7.3%): A thick black dashed line starting at 0.3, peaking slightly at 0.5 around session 7, and ending at 0.4.
Research Aim 2
Baseline variables associated with trajectories
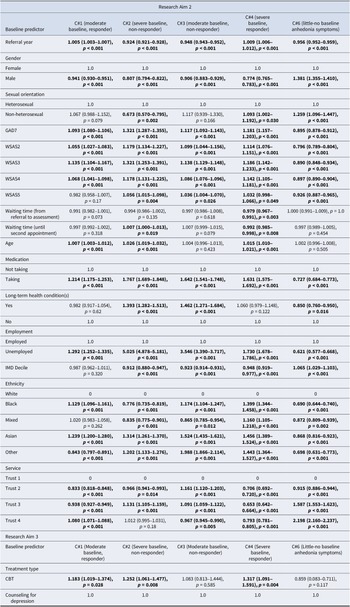
R3STEP was used for multinomial regression models that explored associations between baseline characteristics and different trajectories of anhedonia change. See Table 3 for odds ratios (OR), 95% confidence intervals (CI), and p-values for the different classes compared against C5. This was pragmatically selected as the reference group because it was the largest class representing the modal pattern of change for the sample (mild baseline symptoms and little response to treatment).
Associations between baseline characteristics and anhedonia trajectory classes 1, 2, 3, 4, and 6 relative to class 5 (mild baseline anhedonia, little response)
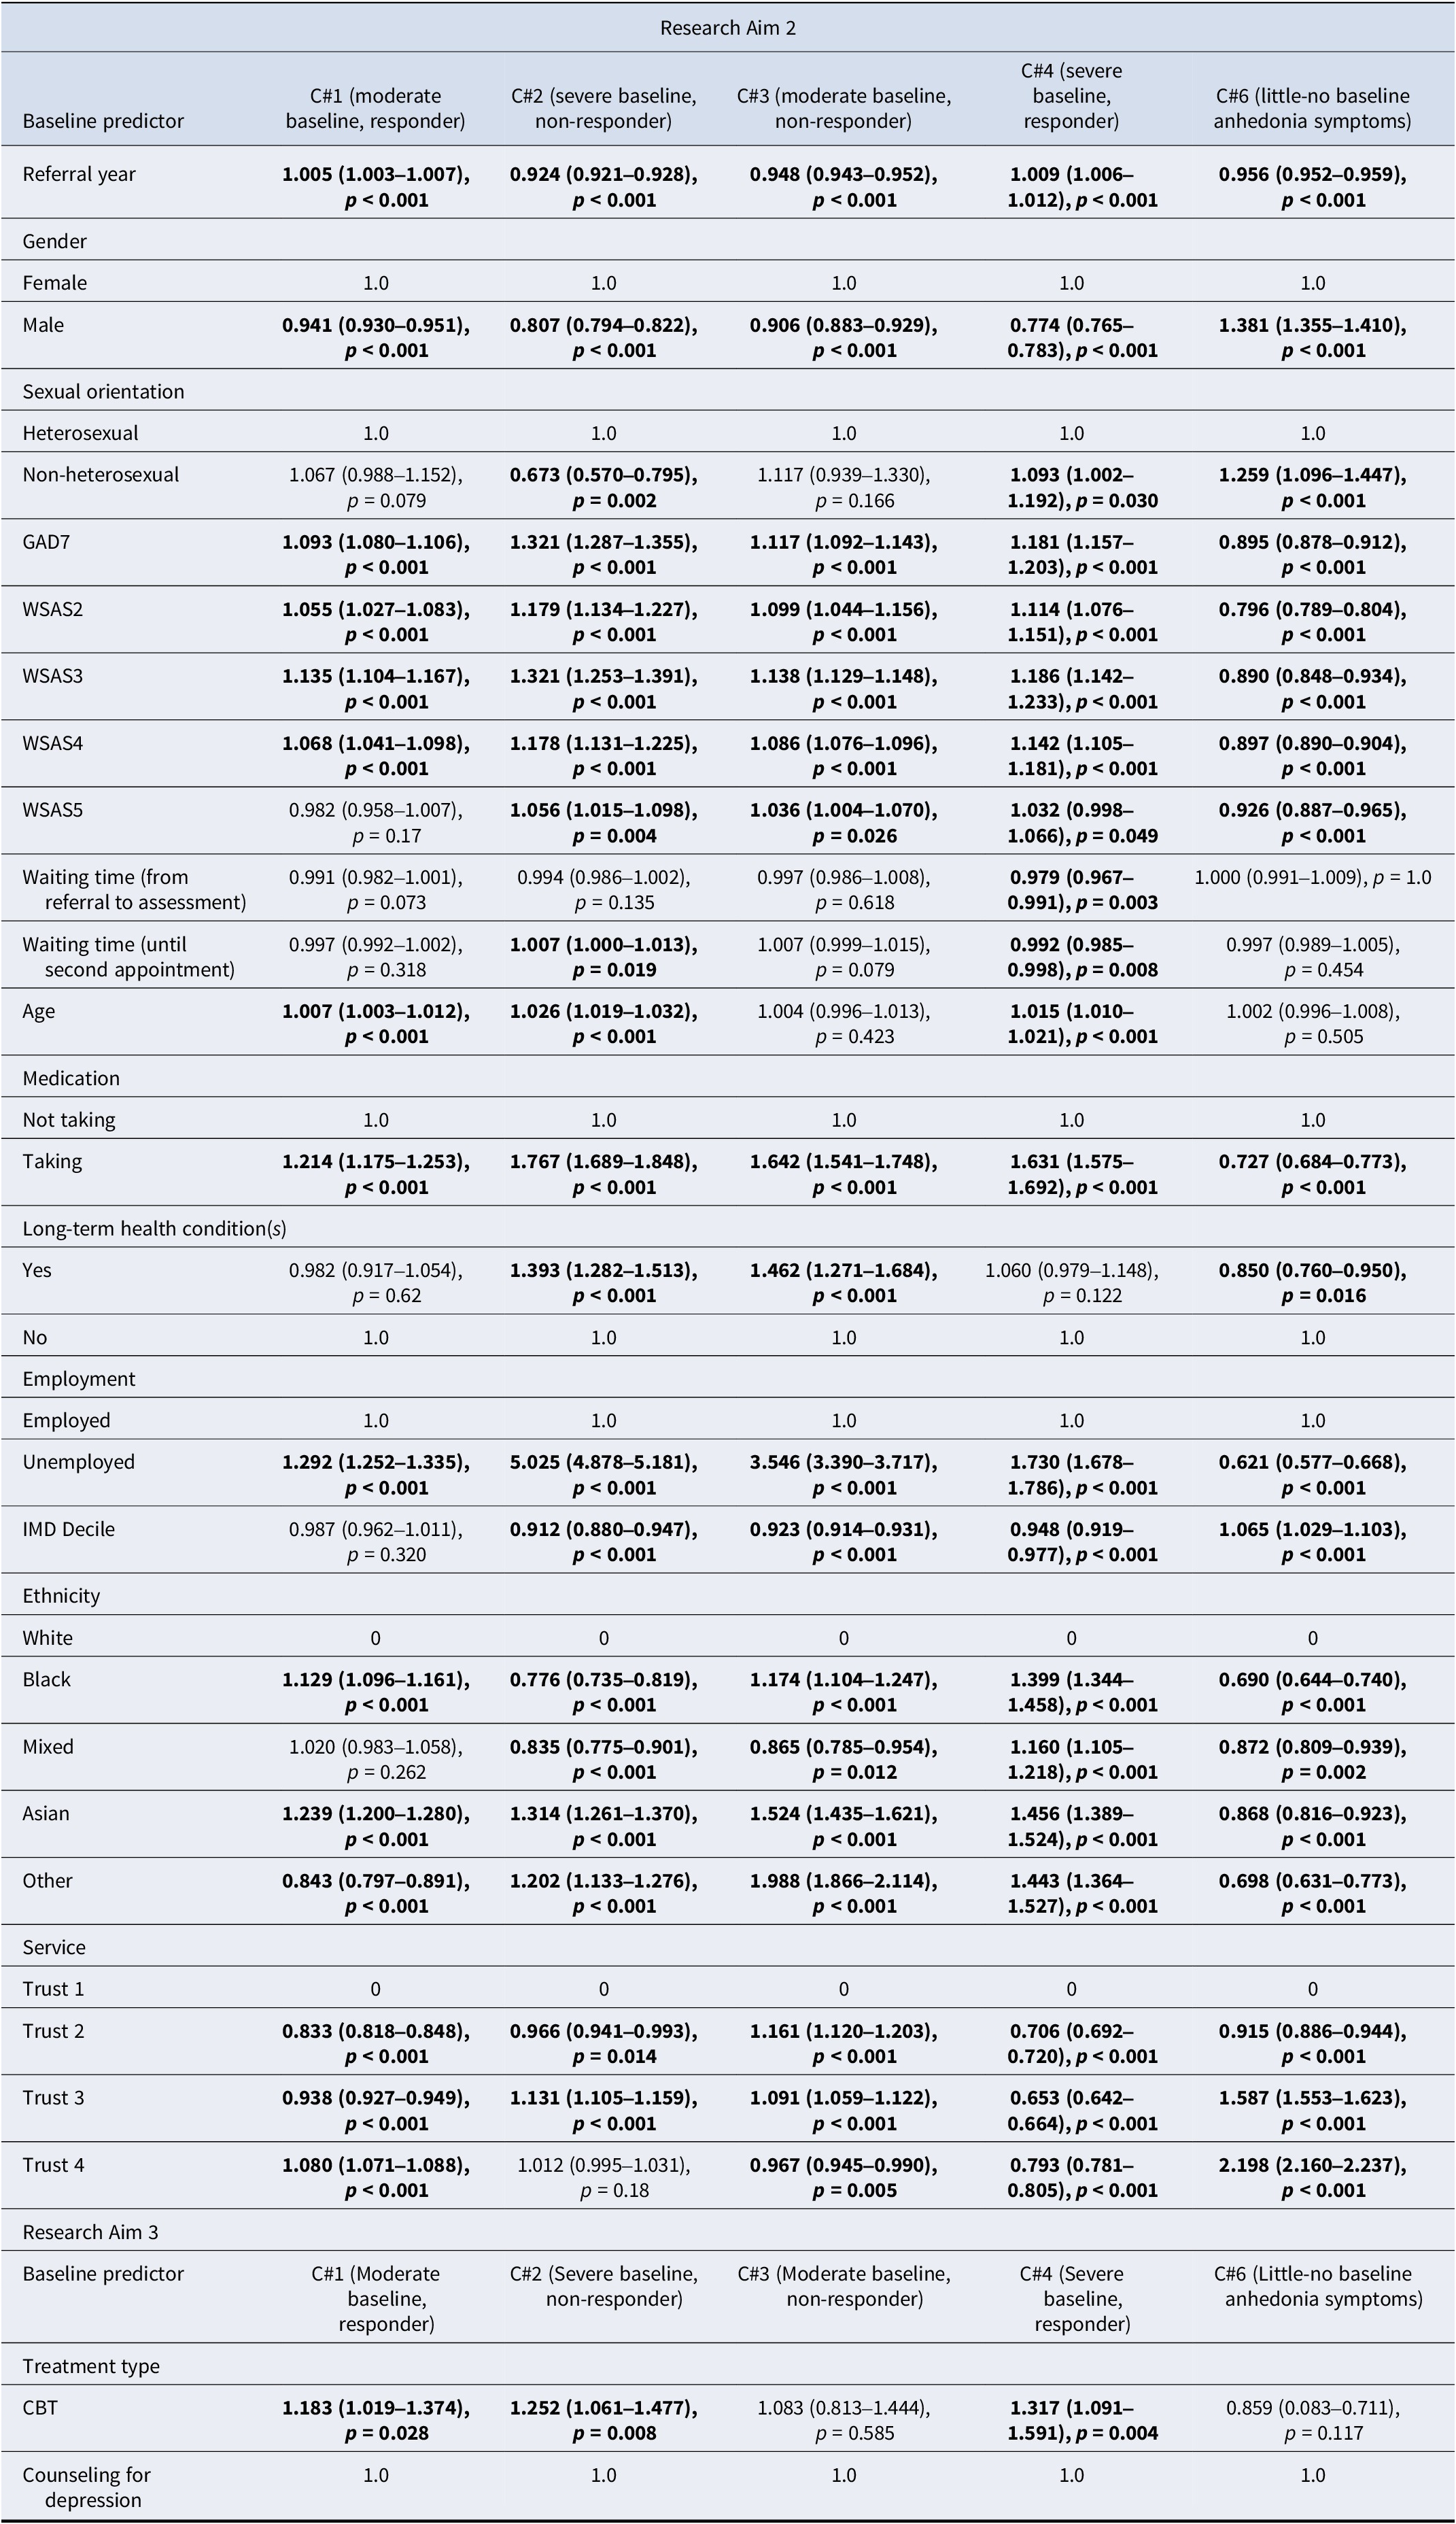
Table 3. Long description
The table presents odds ratios with 95 percent confidence intervals and p-values for predictors across five anhedonia classes (C#1, C#2, C#3, C#4, and C#6) relative to Class 5. Significant results (p < 0.05) are bolded.
Research Aim 2 Predictors:
* Referral year: Significant for all classes, ranging from 0.924 to 1.009.
* Gender (Male vs Female): Significant for all; highest odds in C#6 (1.381) and lowest in C#4 (0.774).
* Sexual orientation (Non-heterosexual vs Heterosexual): Significant for C#2 (0.673), C#4 (1.093), and C#6 (1.259).
* G A D 7: Significant for all; highest in C#2 (1.321).
* W S A S 2, 3, and 4: Significant for all classes; generally showing higher odds for severe/moderate classes and lower odds (below 1.0) for C#6.
* W S A S 5: Significant for C#2, C#3, C#4, and C#6.
* Waiting time (referral to assessment): Significant only for C#4 (0.979).
* Waiting time (until second appointment): Significant for C#2 (1.007) and C#4 (0.992).
* Age: Significant for C#1 (1.007), C#2 (1.026), and C#4 (1.015).
* Medication (Taking vs Not taking): Significant for all; highest in C#2 (1.767).
* Long-term health conditions (Yes vs No): Significant for C#2 (1.393), C#3 (1.462), and C#6 (0.850).
* Employment (Unemployed vs Employed): Highly significant for all; notably high odds in C#2 (5.025) and C#3 (3.546).
* I M D Decile: Significant for C#2, C#3, C#4, and C#6.
* Ethnicity (relative to White): Black, Asian, and Other ethnicities show varying significant associations across all classes.
* Service (Trusts 2, 3, and 4 relative to Trust 1): Most associations are significant across all classes.
Research Aim 3 Predictors:
* Treatment type (C B T vs Counseling for depression): Significant for C#1 (1.183), C#2 (1.252), and C#4 (1.317).
Note: All significant results (p < 0.05) in bold. 580 participants excluded for Research Aim 3.
Participants with the following baseline characteristics were more likely to belong to trajectory classes with typically more severe baseline anhedonia than C5 (C1,2,3,4):
-
• Male
-
• Older age (non-significant C3)
-
• Comorbid long-term health condition (non-significant C1,3)
-
• Unemployed
-
• Higher anxiety
-
• Higher functional impairment across the 4 WSAS items (C1 WSAS5/Relationships non-significant)
-
• Lower IMD Decile (non-significant C1)
-
• Not taking medication
-
• Asian ethnicity (compared to White ethnicity)
These characteristics also reduced the likelihood of being in C6 (no anhedonia symptoms) except for age (non-significant). There were conflicting directions of significant effects across different severities for the remaining predictors (see Table 4 for simplified results).
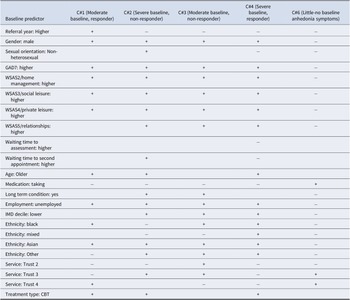
Simplified table describing associations between baseline characteristics and anhedonia trajectory classes 1, 2, 3, 4, and 6 relative to 5 (Mild Baseline Anhedonia, little response)
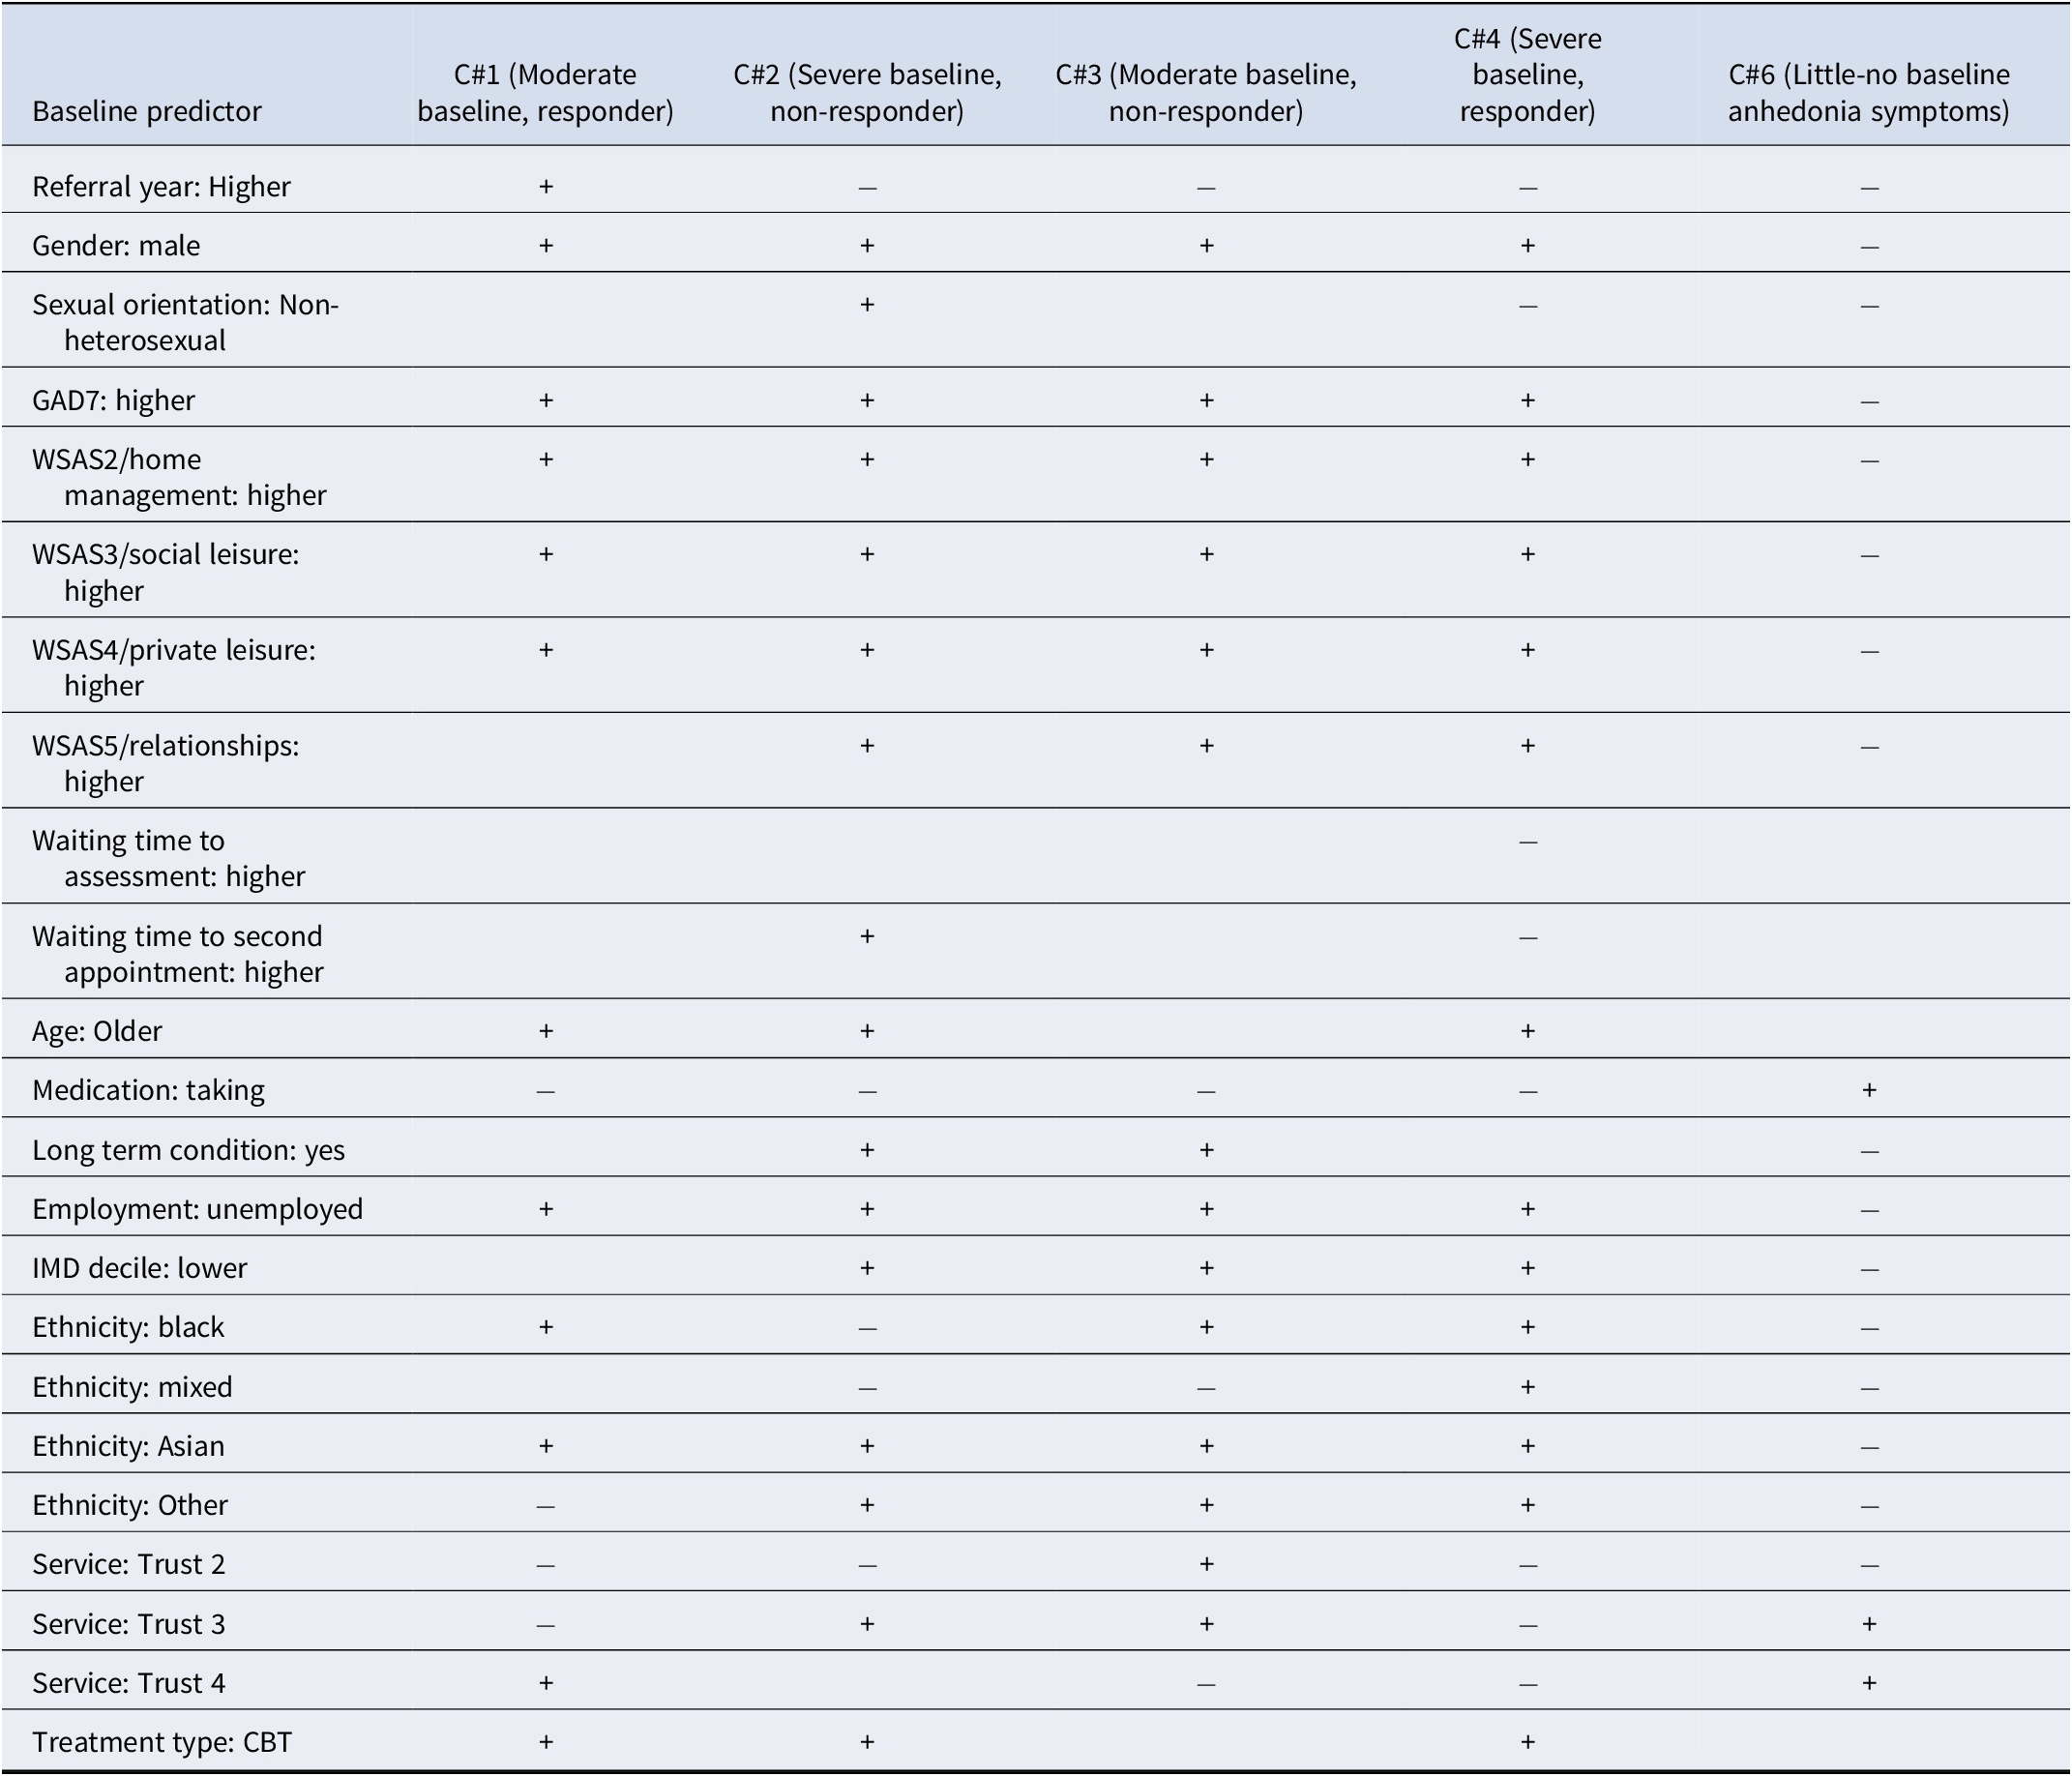
Table 4. Long description
The table consists of six columns. The first column lists baseline predictors, while columns two through six represent anhedonia trajectory classes: C number 1 (Moderate baseline, responder), C number 2 (Severe baseline, non-responder), C number 3 (Moderate baseline, non-responder), C number 4 (Severe baseline, responder), and C number 6 (Little-no baseline anhedonia symptoms). A plus symbol indicates increased likelihood and a minus symbol indicates reduced likelihood.
Key associations include:
* Referral year (Higher): plus for C number 1; minus for C number 2, C number 3, C number 4, and C number 6.
* Gender (male): plus for C number 1, C number 2, C number 3, and C number 4; minus for C number 6.
* G A D 7 (higher), W S A S 2 (home management), W S A S 3 (social leisure), and W S A S 4 (private leisure): plus for C number 1, C number 2, C number 3, and C number 4; minus for C number 6.
* Medication (taking): minus for C number 1, C number 2, C number 3, and C number 4; plus for C number 6.
* Employment (unemployed): plus for C number 1, C number 2, C number 3, and C number 4; minus for C number 6.
* Ethnicity (Asian): plus for C number 1, C number 2, C number 3, and C number 4; minus for C number 6.
* Treatment type (C B T): plus for C number 1, C number 2, and C number 4; blank for C number 3 and C number 6.
Note: Key: + increased likelihood – reduced likelihood.
Responder versus non-responder comparisons
Comparisons were also made between responder and non-responder classes with similar baseline anhedonia levels.
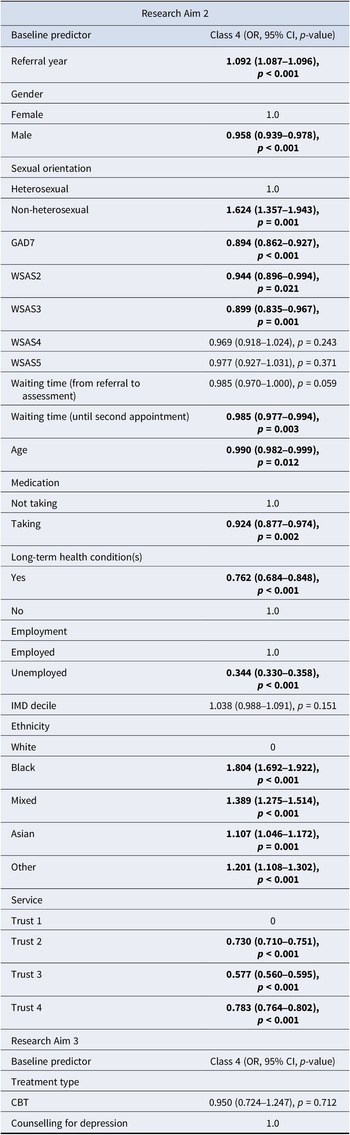
Severe baseline comparisons C4 (responders) and C2 (non-responders) for participants with severe-baseline anhedonia were compared (see Table 5).
Associations between baseline characteristics and anhedonia trajectory for class 4 (Responders, severe baseline anhedonia) relative to class 2 (Non-responders, severe baseline anhedonia)
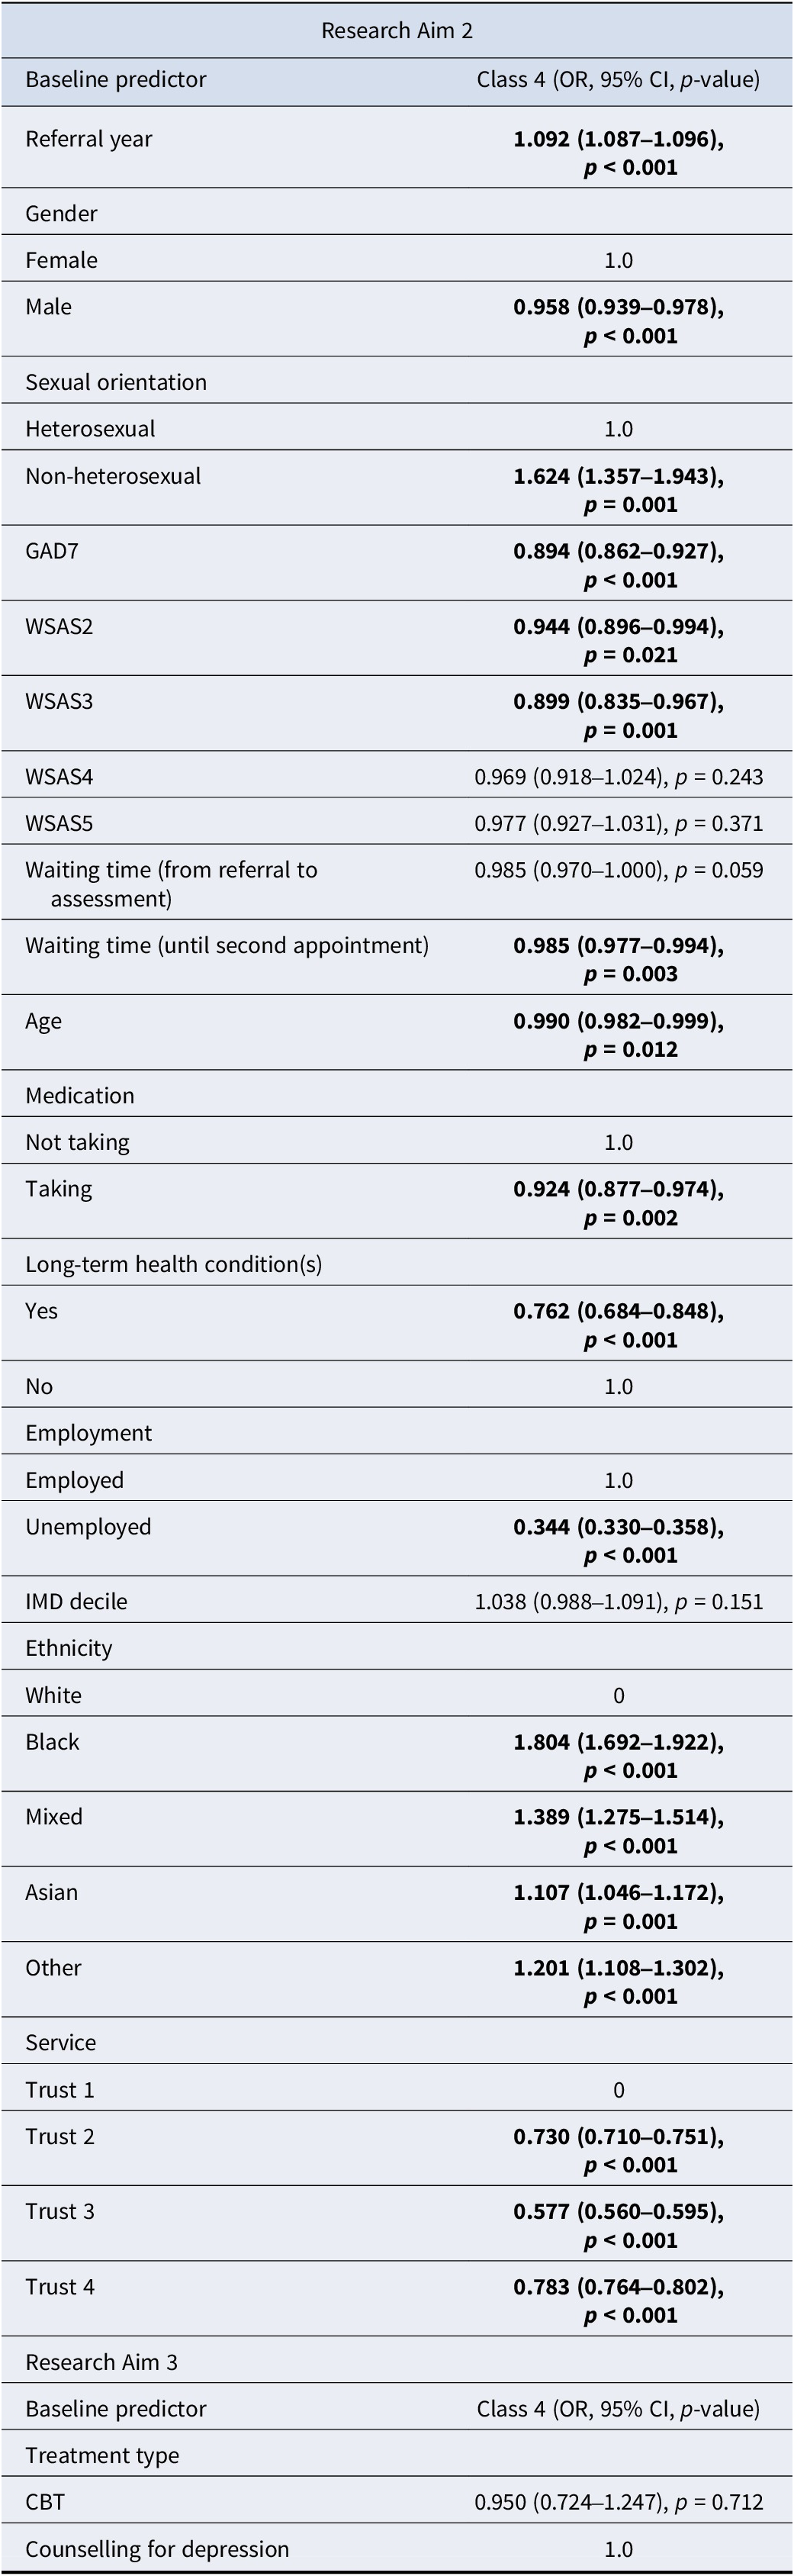
Table 5. Long description
The table is divided into two main sections: Research Aim 2 and Research Aim 3.
Research Aim 2 predictors and their Class 4 O R, 95 percent C I, and p-values include:
* Referral year: 1.092 (1.087 to 1.096), p less than 0.001.
* Gender: Female is the reference 1.0; Male is 0.958 (0.939 to 0.978), p less than 0.001.
* Sexual orientation: Heterosexual is the reference 1.0; Non-heterosexual is 1.624 (1.357 to 1.943), p equals 0.001.
* G A D 7: 0.894 (0.862 to 0.927), p less than 0.001.
* W S A S 2: 0.944 (0.896 to 0.994), p equals 0.021.
* W S A S 3: 0.899 (0.835 to 0.967), p equals 0.001.
* W S A S 4: 0.969 (0.918 to 1.024), p equals 0.243.
* W S A S 5: 0.977 (0.927 to 1.031), p equals 0.371.
* Waiting time (referral to assessment): 0.985 (0.970 to 1.000), p equals 0.059.
* Waiting time (until second appointment): 0.985 (0.977 to 0.994), p equals 0.003.
* Age: 0.990 (0.982 to 0.999), p equals 0.012.
* Medication: Not taking is the reference 1.0; Taking is 0.924 (0.877 to 0.974), p equals 0.002.
* Long-term health conditions: Yes is 0.762 (0.684 to 0.848), p less than 0.001; No is the reference 1.0.
* Employment: Employed is the reference 1.0; Unemployed is 0.344 (0.330 to 0.358), p less than 0.001.
* I M D decile: 1.038 (0.988 to 1.091), p equals 0.151.
* Ethnicity: White is 0; Black is 1.804 (1.692 to 1.922), p less than 0.001; Mixed is 1.389 (1.275 to 1.514), p less than 0.001; Asian is 1.107 (1.046 to 1.172), p equals 0.001; Other is 1.201 (1.108 to 1.302), p less than 0.001.
* Service: Trust 1 is 0; Trust 2 is 0.730 (0.710 to 0.751), p less than 0.001; Trust 3 is 0.577 (0.560 to 0.595), p less than 0.001; Trust 4 is 0.783 (0.764 to 0.802), p less than 0.001.
Research Aim 3 predictors include:
* Treatment type: C B T is 0.950 (0.724 to 1.247), p equals 0.712; Counselling for depression is the reference 1.0.
Note: Column headers are bolded, as are significant effects (p ≤ 0.05).
Participants in the responder class were more likely to have the following characteristics (all categories not mentioned were non-significant):
-
• Male
-
• Younger
-
• Non-heterosexual
-
• Recent cohort
-
• Shorter wait to second appointment
-
• Lower anxiety
-
• Less functional impairment (WSAS-2&3 only)
-
• Employed
-
• Not taking medication
-
• No long-term health conditions
-
• Be of any non-White ethnicity
-
• Treated at Trust-1
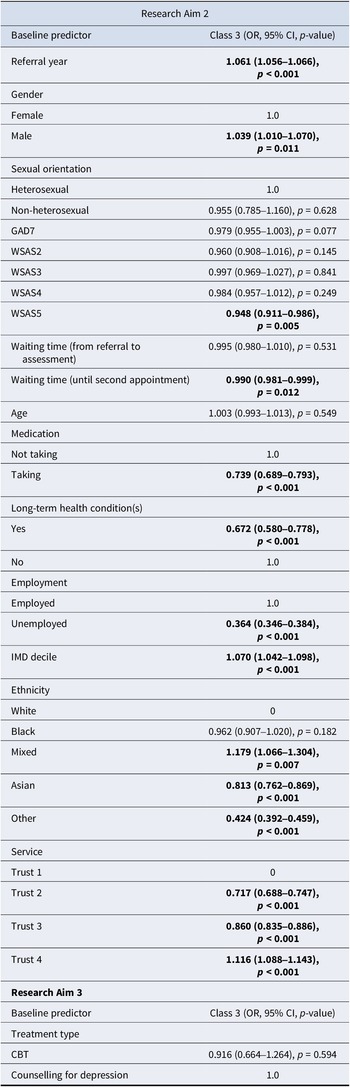
Moderate baseline comparisons C1 (responders) and C3 (non-responders) were compared for patients with moderate-baseline anhedonia (see Table 6).
Associations between baseline characteristics and anhedonia trajectory for class 1 (responders, moderate baseline anhedonia) relative to class 3 (non-responders, moderate baseline anhedonia)
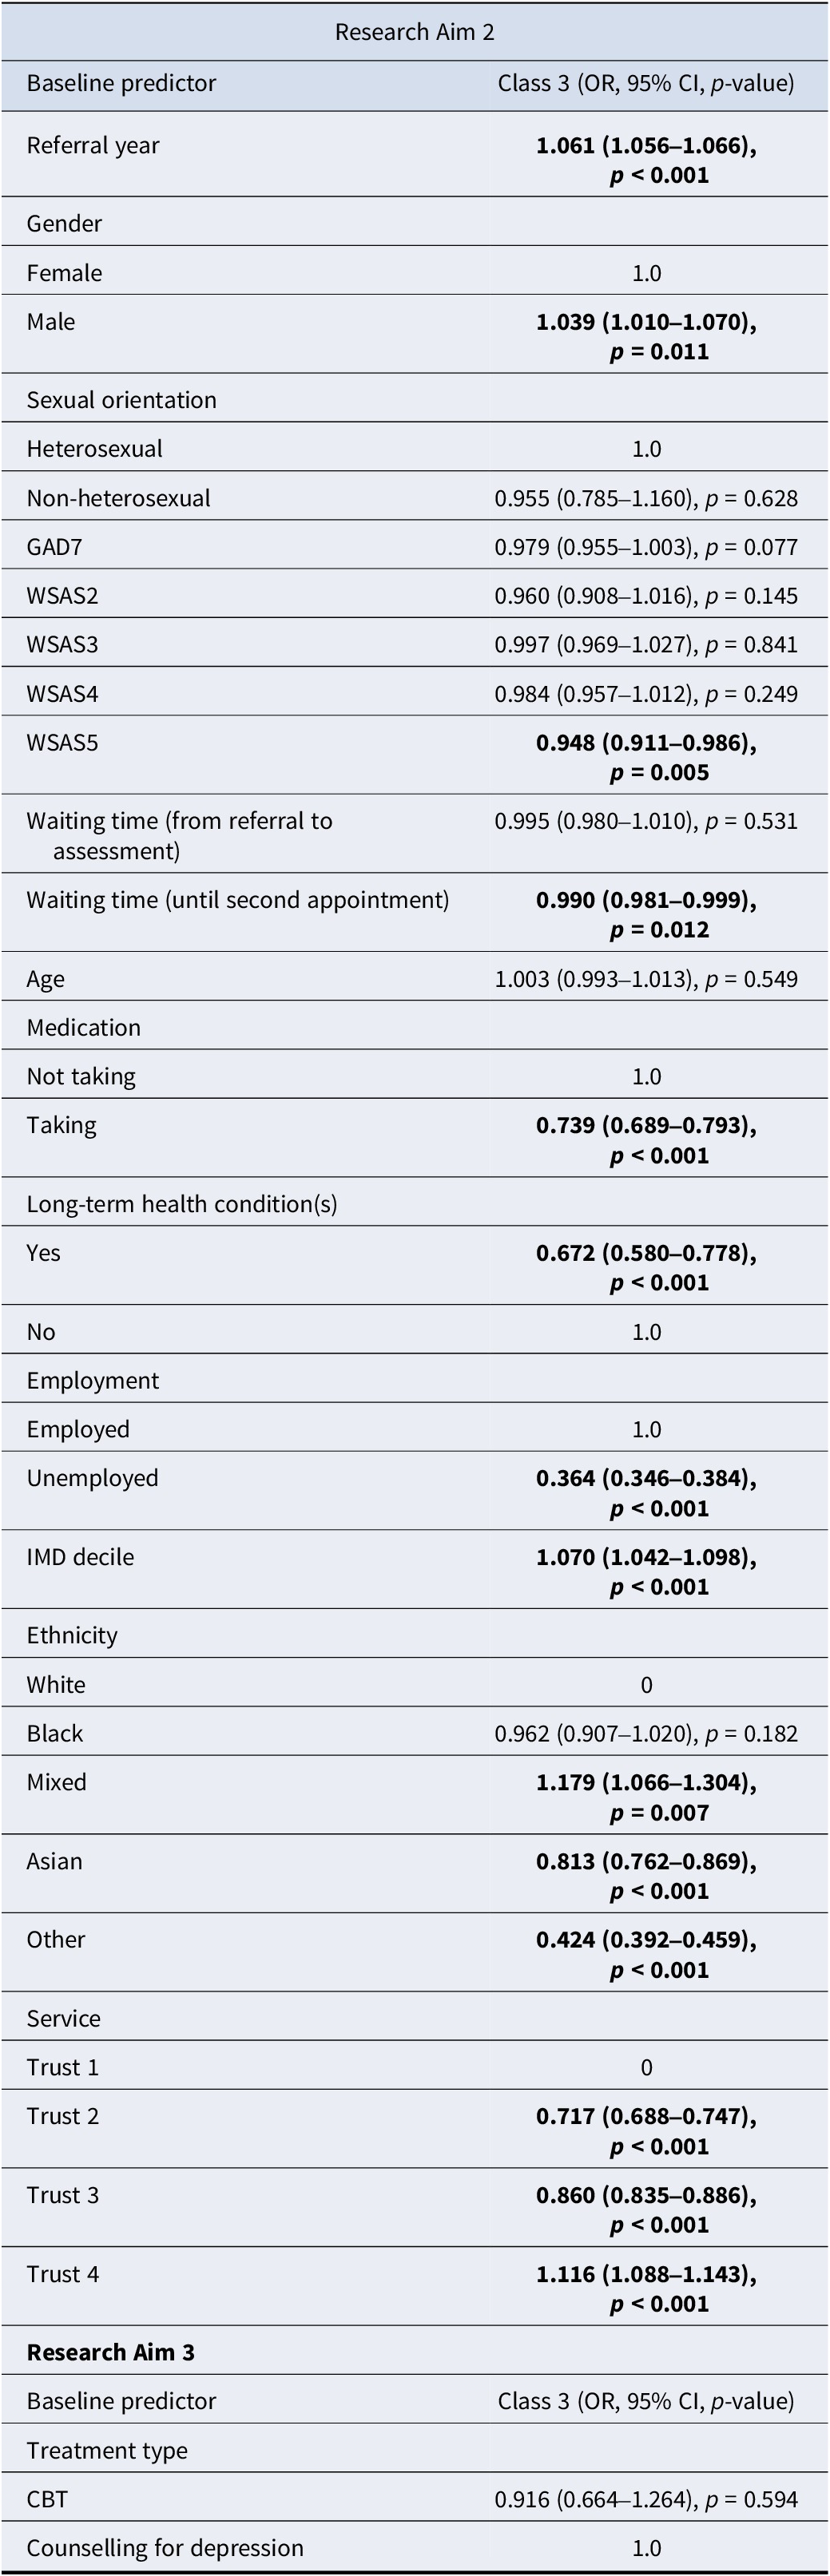
Table 6. Long description
The table is divided into Research Aim 2 and Research Aim 3. Values are reported as Odds Ratio O R, 95 percent Confidence Interval C I, and p-value. Significant results with p less than 0.05 are in bold.
Research Aim 2 predictors:
* Referral year: 1.061 (1.056 to 1.066), p less than 0.001.
* Gender: Female is reference 1.0; Male is 1.039 (1.010 to 1.070), p equals 0.011.
* Sexual orientation: Heterosexual is reference 1.0; Non-heterosexual is 0.955 (0.785 to 1.160), p equals 0.628.
* G A D 7: 0.979 (0.955 to 1.003), p equals 0.077.
* W S A S 2: 0.960 (0.908 to 1.016), p equals 0.145.
* W S A S 3: 0.997 (0.969 to 1.027), p equals 0.841.
* W S A S 4: 0.984 (0.957 to 1.012), p equals 0.249.
* W S A S 5: 0.948 (0.911 to 0.986), p equals 0.005.
* Waiting time referral to assessment: 0.995 (0.980 to 1.010), p equals 0.531.
* Waiting time until second appointment: 0.990 (0.981 to 0.999), p equals 0.012.
* Age: 1.003 (0.993 to 1.013), p equals 0.549.
* Medication: Not taking is reference 1.0; Taking is 0.739 (0.689 to 0.793), p less than 0.001.
* Long-term health conditions: Yes is 0.672 (0.580 to 0.778), p less than 0.001; No is reference 1.0.
* Employment: Employed is reference 1.0; Unemployed is 0.364 (0.346 to 0.384), p less than 0.001.
* I M D decile: 1.070 (1.042 to 1.098), p less than 0.001.
* Ethnicity: White is reference 0; Black is 0.962 (0.907 to 1.020), p equals 0.182; Mixed is 1.179 (1.066 to 1.304), p equals 0.007; Asian is 0.813 (0.762 to 0.869), p less than 0.001; Other is 0.424 (0.392 to 0.459), p less than 0.001.
* Service: Trust 1 is reference 0; Trust 2 is 0.717 (0.688 to 0.747), p less than 0.001; Trust 3 is 0.860 (0.835 to 0.886), p less than 0.001; Trust 4 is 1.116 (1.088 to 1.143), p less than 0.001.
Research Aim 3 predictors:
* Treatment type: C B T is 0.916 (0.664 to 1.264), p equals 0.594; Counselling for depression is reference 1.0.
Note: All significant results (p < 0.05) in bold. 580 participants excluded for Research Aim 3.
Participants in the responder class were more likely to have the following characteristics:
-
• Female
-
• Recent cohort
-
• Shorter wait to second appointment
-
• Less functional impairment on WSAS5/Close relationships
-
• Employed
-
• Not taking medication
-
• No long-term health conditions
-
• Higher IMD-Decile
-
• Mixed-ethnicity (Asian- or Other-ethnicity less likely)
-
• Treated at Trust-4 (Trust-2/3 less likely)
Research Aim 3
Research Aim 3 compared CBT and Counseling for Depression (CfD). There was insufficient power in the dataset for a third treatment type to be considered due to low numbers (Based on the n = 100 + 50(𝑖) method, a minimum of 250 participants were required for any further treatment types to be considered). The small number of participants who received these were excluded from this specific analysis.
Participants who received CBT were, relative to class 5, more likely to be members of classes 1, 2, or 4 (see Table 3).
The probability of being in either of the responder classes when compared to non-responder classes was not affected by receipt of Counselling or CBT (see Tables 5 and 6).
Discussion
This study used routine treatment data to identify distinct trajectories of anhedonia change during high-intensity psychological therapy for depression, and examined factors associated with those trajectories. With regard to research aim one, six trajectories were identified. Only patients in two classes (41.4% of the cohort) showed significant improvement, with positive change evident in PHQ-9 Item-1 by session 6. This suggests that when anhedonia responded to treatment, change was evident by the midpoint of therapy. This aligns with evidence that much symptom change during CBT for depression occurs in the first six sessions (Abel, Hayes, Henley, & Kuyken, Reference Abel, Hayes, Henley and Kuyken2016; Tang & DeRubeis, Reference Tang and DeRubeis1999), and extends that pattern to anhedonia specifically.
Compared with previous trajectory modeling research on overall depression symptom severity, these findings suggest anhedonia may respond differently to treatment. Two large-scale studies identified four trajectories of PHQ-9 total scores, the first using an older, smaller NCEL NHS TTad SIRN dataset from one Trust (Saunders et al., Reference Saunders, Buckman, Cape, Fearon, Leibowitz and Pilling2019), and the latter replicating those results using a South London NHS TTad dataset (Skelton et al., Reference Skelton, Carr, Buckman, Davies, Goldsmith, Hirsch, Peel, Rayner, Rimes, Saunders, Wingrove, Breen and Eley2023). The current study identified qualitatively different trajectories, with only classes 2 (severe baseline-fast improvement) and 4 (severe baseline-limited improvement) having direct equivalents. Class 6, characterized by little-to-no symptoms throughout treatment, had no analogue in studies for depression (or anxiety). Given that participants were included for depression, rather than anhedonia, this class potentially reflects people who do not experience anhedonia as part of their depression.
For the second research question, clearly identified risk factors for non-response were unemployment, long-term health conditions, antidepressant medication use, and experiencing a longer wait until the second appointment. Participants who received treatment more recently were also more likely to be placed in responder trajectory classes.
Unemployment, being the most significant risk factor, was broadly unsurprising given Buckman and colleagues found a very strong effect of unemployment on poor treatment prognosis for depression, regardless of treatment type (2022). Associations for both antidepressant use and long-term health conditions similarly align with existing evidence (Buckman et al., Reference Buckman, Saunders, Cohen, Barnett, Clarke, Ambler, DeRubeis, Gilbody, Hollon, Kendrick, Watkins, Wiles, Kessler, Richards, Sharp, Brabyn, Littlewood, Salisbury, White and Pilling2021a). One would have expected from the existing evidence base that patients who are from more deprived areas, and suffering from more comorbidity with regard to both anxiety and functional impairment to be consistently associated with non-responding trajectories (Prieto-Vila et al., Reference Prieto-Vila, González-Blanch, Estupiñá Puig, Buckman, Saunders, Muñoz-Navarro, Moriana, Rodríguez-Ruiz, Barrio-Martínez, Carpallo-González and Cano-Vindel2024; Saunders, Buckman, & Pilling, Reference Saunders, Buckman and Pilling2020a; Skelton et al., Reference Skelton, Carr, Buckman, Davies, Goldsmith, Hirsch, Peel, Rayner, Rimes, Saunders, Wingrove, Breen and Eley2023), however these were only associated with one of two non-responding trajectories.
The consistent small effect of time matches existing research around treatment outcomes in England, as services have shown modest improvements in outcomes year-on-year, reflective of developments in clinical practice (Clark, Reference Clark2018; Clark et al., Reference Clark, Canvin, Green, Layard, Pilling and Janecka2018; Saunders et al., Reference Saunders, Cape, Leibowitz, Aguirre, Jena, Cirkovic, Wheatley, Main, Pilling and Buckman2020b).
There was conflicting information on ethnicity, with no individual ethnic group consistently associated with responding or non-responding trajectory classes across both moderate-baseline and severe-baseline comparisons, except for mixed-ethnicity patients, who appeared consistently associated with response. The mechanism behind this is unclear, especially given that this has not been reported across wider depression or anxiety literature (and should be interpreted cautiously). There was also an association between waiting time to the second appointment (often considered the effective start of treatment in TTad) and non-responder class membership, consistent with previous research using TTad data found that waiting time for treatment was negatively associated with reliable recovery (Clark et al., Reference Clark, Canvin, Green, Layard, Pilling and Janecka2018).
Most notably, no trajectory class with baseline anhedonia showed complete elimination by endpoint. This supports evidence that anhedonia symptoms are associated with a greater chance of residual symptoms following therapeutic treatment (Alsayednasser et al., Reference Alsayednasser, Widnall, O’Mahen, Wright, Warren, Ladwa, Khazanov, Byford, Kuyken, Watkins, Ekers, Reed, Fletcher, McMillan, Farrand, Richards and Dunn2022). This is particularly problematic because the experience of residual symptoms post-treatment is one of the strongest risk factors for experiencing a relapse of depression (Buckman et al., Reference Buckman, Underwood, Clarke, Saunders, Hollon, Fearon and Pilling2018; Judd, Paulus, & Zeller, Reference Judd, Paulus and Zeller1999). Furthermore, 51.3% were more likely to follow trajectories indicating little to no anhedonia response. Although this limited response rate is broadly similar to that seen for psychotherapeutic depression treatment outcomes (Cuijpers et al., Reference Cuijpers, Karyotaki, Weitz, Andersson, Hollon and van Straten2014, Reference Cuijpers, Karyotaki, Ciharova, Miguel, Noma and Furukawa2021), anhedonia may require particular attention because it may persist even among patients otherwise responding to treatment. Since symptom change was typically evident by session six, this highlights the importance of identifying and targeting anhedonia early in treatment. A strong recommendation, therefore, would be a need for future therapeutic options to better prioritize and optimize anhedonia treatment.
Limitations
Although predictors were examined within a single multivariable model, reducing concerns associated with multiple independent testing, the inclusion of multiple predictors nonetheless introduces a potential risk of Type I error inflation. As such, findings should be interpreted with consideration of effect sizes, confidence intervals, and overall patterns rather than isolated p-values. Class labels were assigned based on visual interpretation of trajectory shape rather than formal thresholds (e.g. reliable change indices), which may introduce subjectivity in their interpretation.
The PHQ-9 presents several limitations. It includes only one anhedonia item, scored 0 (Not at all), 1 (Several days), 2 (More than half of the days), or 3 (Nearly every day). This limited range constrains variability in the data, making capturing subtle differences more difficult, which potentially caps the anhedonia-score distribution. Furthermore, the wording of the PHQ-9 may introduce measurement error; the scale is used to consider the severity of the respondent’s depressive symptoms, yet response options capture symptom frequency. A participant may experience anhedonia as severely problematic or crippling, but not frequently enough to merit “More than half of the days,” leading them to score 1. Similarly, the gap between “Not at all” and “Several days” may force participants into an imprecise response.
Due to the absence of a controlled study design, confounding remains a potential issue. As with other studies using data from the NHS TTad datasets (Saunders et al., Reference Saunders, Buckman, Cape, Fearon, Leibowitz and Pilling2019), there is no information on treatment protocol adherence within CBT or CfD sessions, and no information on the criteria used to allocate patients to treatment type. There may be confounding from undiagnosed or unmeasured comorbidities and other factors associated with the lack of improvement in anhedonia symptoms. In particular, this applies to our self-report measure on psychotropic medication use and long-term conditions. For example, people who were taking medication could have stopped taking it during the course of treatment, and anhedonic symptoms are a symptom of antidepressant withdrawal (Moncrieff, Read, & Horowitz, Reference Moncrieff, Read and Horowitz2024). More broadly, it did not capture medication type, class, dosage, or duration of use, which may all have differential impacts on outcomes. Similarly, the presence of a “long-term condition” was derived from routinely collected data and based on self-report without a standardized definition of duration or severity. Lastly, several additional characteristics linked with treatment prognosis were unavailable, including level of previous treatment/therapy experience, depression chronicity, marital status, social support, and personality disorder comorbidity (Buckman et al., Reference Buckman, Saunders, Cohen, Barnett, Clarke, Ambler, DeRubeis, Gilbody, Hollon, Kendrick, Watkins, Wiles, Kessler, Richards, Sharp, Brabyn, Littlewood, Salisbury, White and Pilling2021a, Reference Buckman, Saunders, O’Driscoll, Cohen, Stott, Ambler, Gilbody, Hollon, Kendrick, Watkins, Wiles, Kessler, Chari, White, Lewis and Pilling2021b, Reference Buckman, Saunders, Stott, Arundell, O’Driscoll, Davies, Eley, Hollon, Kendrick, Ambler, Cohen, Watkins, Gilbody, Wiles, Kessler, Richards, Brabyn, Littlewood, DeRubeis and Pilling2021c, Reference Buckman, Saunders, Stott, Cohen, Arundell, Eley, Hollon, Kendrick, Ambler, Watkins, Gilbody, Kessler, Wiles, Richards, Brabyn, Littlewood, DeRubeis, Lewis and Pilling2022; DeRubeis et al., Reference DeRubeis, Cohen, Forand, Fournier, Gelfand and Lorenzo-Luaces2014).
Reverse causality may also limit the interpretation of some associations. While one explanation is that taking medication may reduce the effectiveness of psychotherapy on anhedonia symptoms, alternatively, people on medication prior to starting psychotherapy may have experienced more treatment-resistant depression, as those who had responded may not have needed therapeutic support. Supporting this, medication use was a predictor of lower baseline severity and non-response among those with higher baseline severity. Similarly, there is a clear association between unemployment and poorer outcomes, but it is equally possible that unemployment leads to more treatment-resistant anhedonia, as those suffering from severe anhedonia and depression are less likely to be employed (Rizvi et al., Reference Rizvi, Cyriac, Grima, Tan, Lin, Gallaugher, McIntyre and Kennedy2015; Vinckier, Gourion, & Mouchabac, Reference Vinckier, Gourion and Mouchabac2017).
Selection biases could also limit generalizability. Firstly, high-intensity only interventions may overrepresent those with chronic or treatment-resistant depression. Attritional bias is also possible as those who dropped out before taking three measurement points may systemically differ, and experience more severe anhedonia. Finally, the sample was drawn from four services flowing data to the NCEL NHS TTad SIRN; demographically representative of these London-based services, potentially limiting generalizability to non-urban populations or other urban locations outside London. This, however, presents significant strengths. The sample is more ethnically diverse than NHS TTad nationally (NHS Digital, 2024), which is important given the need to avoid perpetuating systematic biases by under-representing historically marginalized groups. Greater representation of smaller groups contributes to a more inclusive and equitable evidence base and enhances the potential for identifying important subgroup effects and generalizing findings to those smaller groups in the wider population. Furthermore, the primary measure for this study, the PHQ-9, has shown across a range of communities to have good reliability and validity (Beck, Naz, Brooks, & Jankowska, Reference Beck, Naz, Brooks and Jankowska2019).
Finally, 97.5% of patients received either CBT or Counseling, narrowing the ability to make conclusions about the full treatment landscape. Despite this, homogeneity in the data emerged naturally and it remains a reasonable approximation of the current breadth of high-intensity treatments in England, given that last year, 93.3% of high-intensity therapy courses in TTad services were either CBT or Counselling (NHS Digital, 2024).
Implications
Firstly, there were notable associations between trajectories of anhedonia and patient characteristics. Clinicians may be able to gauge anhedonia symptom response by the midpoint of therapy. As such, therapists should track anhedonia from the start of treatment to support timely assessment and adjustment of the care plan. For those following responder trajectories, change was typically evident around session six. Early improvement can be seen as a positive prognostic indicator, reinforcing the continuation of the current treatment strategy. These patients could also potentially be considered for less frequent reviews to save resources.
Those showing no signs of improvement by session six could be monitored closer and more regularly with a view to potentially adapting their care plan. This may prompt discussions around additional personal or environmental factors in their lives, including possible comorbid conditions. More regular reviews may need to be considered, alongside more intensive treatment options, or potentially contacting their listed General Practitioner for alternative means of medical management.
This study also indicates several risk factors for non-response, allowing for the earlier identification of patients more likely to show limited improvement in anhedonia symptoms. For example, an individual with severe anhedonia with several non-responder risk factors (e.g. unemployed, taking medication, long-term health conditions) may require a more intensive treatment approach. While it may be useful for some patients to consider pivoting away from CBT and counselling, there were insufficient data to provide more specific recommendations. One possible option may be more targeted approaches that specifically address anhedonia, such as Augmented Depression Therapy/ADepT (Dunn et al., Reference Dunn, Widnall, Reed, Owens, Campbell and Kuyken2019, Reference Dunn, Widnall, Warbrick, Warner, Reed, Price, Kock, Courboin, Stevens, Wright, Moberly, Geschwind, Owens, Spencer, Campbell and Kuyken2023), although the evidence for this approach comes only from pilot RCT data and a more robust investigation of the effects is warranted before it can be considered for those with anhedonia more widely.
The presence of residual symptoms following treatment for depression is a significant risk factor for relapse and recurrence (Buckman et al., Reference Buckman, Underwood, Clarke, Saunders, Hollon, Fearon and Pilling2018). It is notable, therefore, that this study indicates a substantial proportion of patients exhibit little improvement in anhedonia symptoms following an episode of high-intensity psychological treatment such as CBT or Counseling. One option may be to consider prolonging treatment for those with limited response, though results from this study do not necessarily indicate that to be beneficial. For those patients exhibiting strong residual anhedonia, they could be recommended for additional follow-ups to monitor the risk of relapse, or relapse prevention interventions, including Collaborative Care (Moriarty et al., Reference Moriarty, Coventry, Hudson, Cook, Fenton, Bower, Lovell, Archer, Clarke, Richards, Dickens, Gask, Waheed, Huijbregts, van der Feltz–Cornelis, Ali, Gilbody and McMillan2020), Continuation-CT/CBT or Mindfulness-based CBT (Bockting et al., Reference Bockting, Hollon, Jarrett, Kuyken and Dobson2015; Kuyken et al., Reference Kuyken, Warren, Taylor, Whalley, Crane, Bondolfi, Hayes, Huijbers, Ma, Schweizer, Segal, Speckens, Teasdale, Van Heeringen, Williams, Byford, Byng and Dalgleish2016).
Certain factors were consistently tied to a higher risk of non-response, specifically unemployment and long-term health conditions. One possible explanation for this may be the extent to which participants are able to engage in activities in which they enjoy or find a sense of purpose or achievement is reduced. This reduced engagement creates a cycle by which the lack of pleasurable experiences might reduce positive affect and reinforce feelings of apathy and demotivation (Szczepanik et al., Reference Szczepanik, Furey, Nugent, Henter, Zarate and Lejuez2017).
Given that unemployment was by far the most significant risk factor for non-response, concurrent employment support programs may be particularly valuable for these patients, a comparison of which might be the individual placement and support (IPS) model, shown to be effective for individuals with severe mental illness (Hoffmann et al., Reference Hoffmann, Jäckel, Glauser, Mueser and Kupper2014). Similarly, for those suffering from long-term health conditions, additional support with accessing medical services may be of use.
Funding statement
This manuscript was supported by the UCL PALS Department and the Royal College of Psychiatrists ‘CORE Psychological Processes and Clinical Effectiveness Program Grant. None of these funders had any role in the study design, collection, analysis, or interpretation of the data, writing the manuscript, or the decision to submit the paper for publication.
Competing interests
The authors declare none.
Appendix A
Latent growth curve model comparison

Table A1. Long description
The table presents four model fit statistics: C F I, T F I, R M S E A, and S R M R.
* Linear model: C F I is 0.939, T F I is 0.945, R M S E A is 0.059, and S R M R is 0.084.
* Quadratic model: This row is bolded, indicating the best fit. C F I is 0.975, T F I is 0.976, R M S E A is 0.039, and S R M R is 0.034.
* Cubic model: All statistics are listed as 0.00 or 0.000.
Note: The Quadratic Latent Growth Curve Model is bolded as this model was selected (as are the column headers).
Growth parameter statistics for latent growth curve model

Table A2 Long description
The table presents data for the Overall mean of a full sample across three growth parameters.
1. Intercept: The Mean is 1.909 with 95 percent C I s ranging from 1.897 to 1.921.
2. Linear: The Mean is minus 0.137 with 95 percent C I s ranging from minus 0.141 to minus 0.133.
3. Quadratic: The Mean is 0.006 with 95 percent C I s ranging from 0.006 to 0.006.
Appendix B
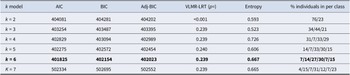
Growth mixture modelling fit statistics
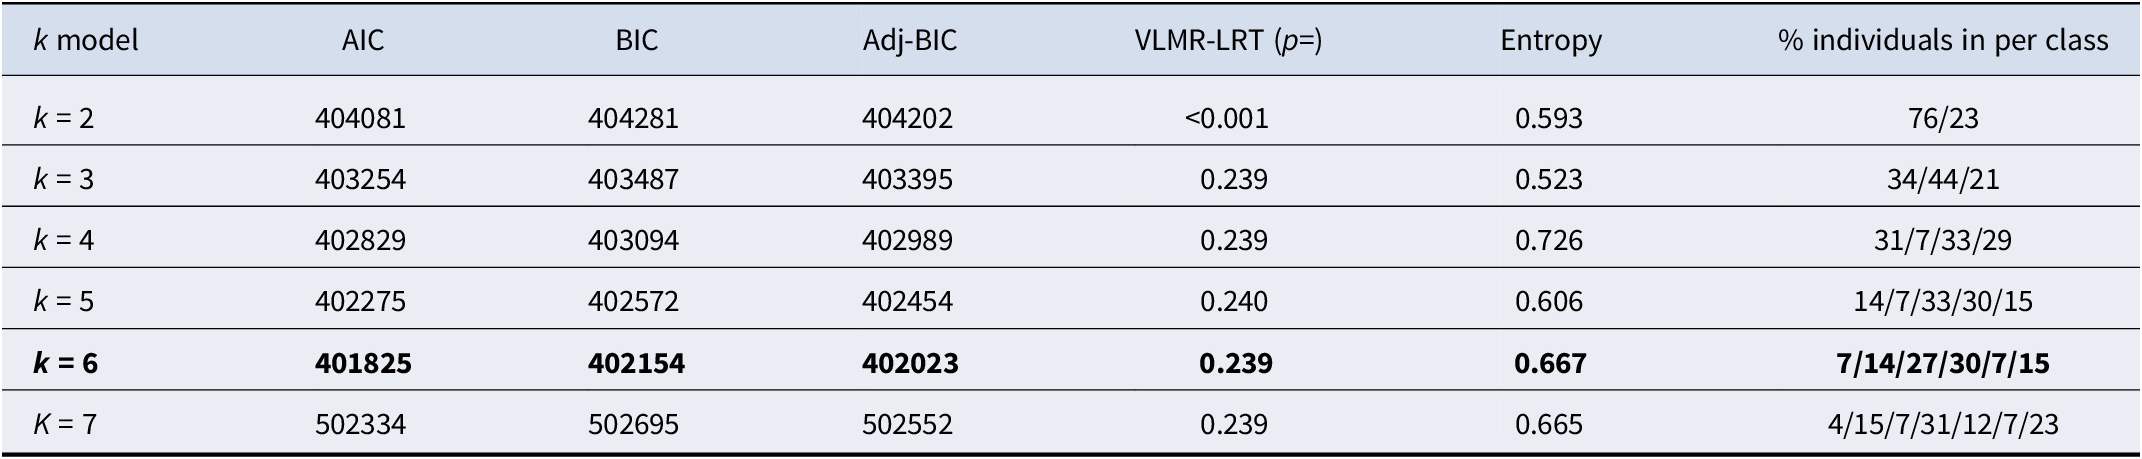
Table B1 Long description
The table consists of seven columns: k model, A I C, B I C, Adj-B I C, V L M R-L R T (p equals), Entropy, and percentage of individuals per class.
* k equals 2: A I C 404081, B I C 404281, Adj-B I C 404202, p less than 0.001, Entropy 0.593, Class distribution 76/23.
* k equals 3: A I C 403254, B I C 403487, Adj-B I C 403395, p 0.239, Entropy 0.523, Class distribution 34/44/21.
* k equals 4: A I C 402829, B I C 403094, Adj-B I C 402989, p 0.239, Entropy 0.726, Class distribution 31/7/33/29.
* k equals 5: A I C 402275, B I C 402572, Adj-B I C 402454, p 0.240, Entropy 0.606, Class distribution 14/7/33/30/15.
* k equals 6 (bolded): A I C 401825, B I C 402154, Adj-B I C 402023, p 0.239, Entropy 0.667, Class distribution 7/14/27/30/7/15.
* k equals 7: A I C 502334, B I C 502695, Adj-B I C 502552, p 0.239, Entropy 0.665, Class distribution 4/15/7/31/12/7/23.
Note: k = 6 model is bolded as this was the selected model (as are the column headers).
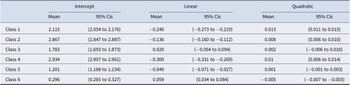
Growth parameter statistics for final GMM models
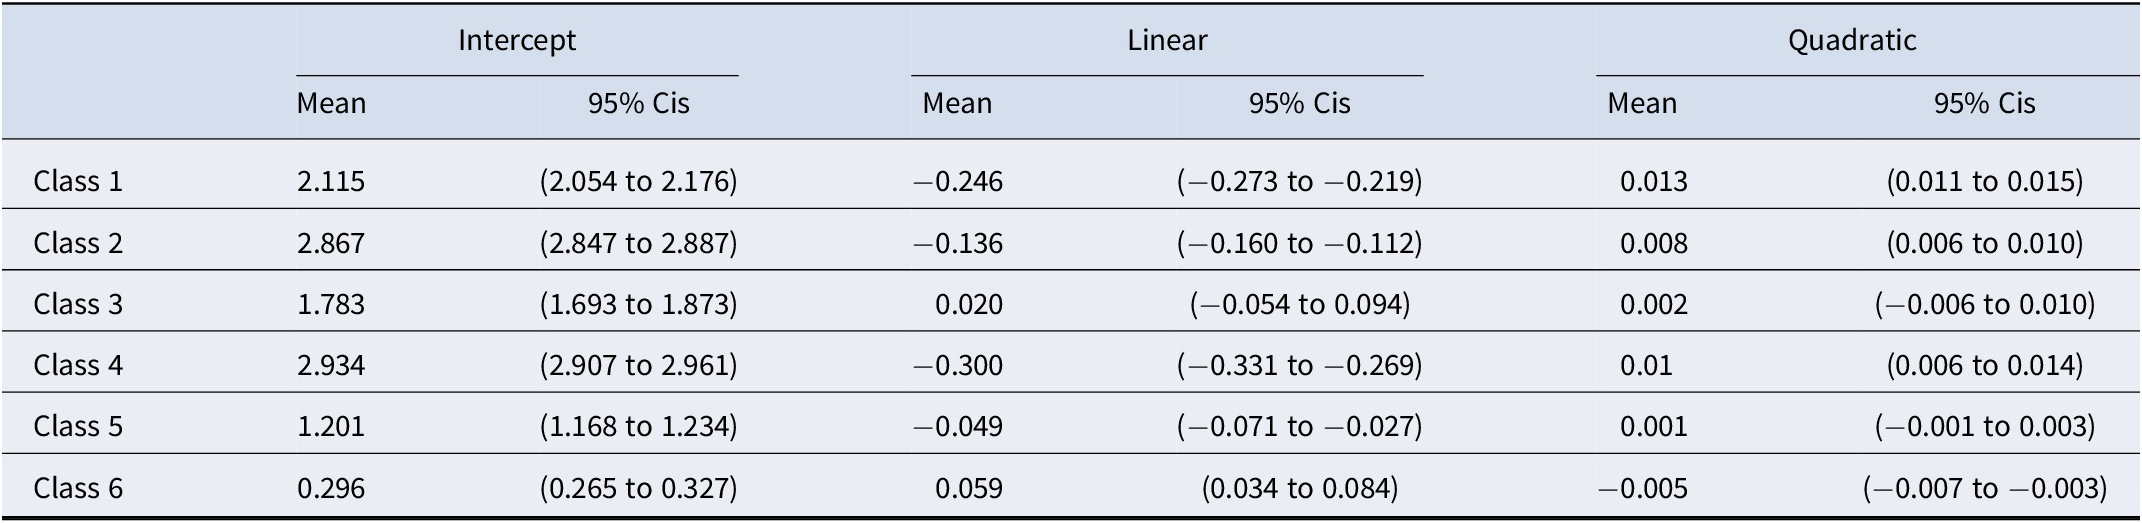
Table B2. Long description
The table is organized into seven columns. The first column lists the classes, and the subsequent columns are paired under three headers: Intercept, Linear, and Quadratic. Each pair includes a Mean and 95 percent C I s (Confidence Intervals).
* Class 1: Intercept Mean 2.115 (2.054 to 2.176); Linear Mean minus 0.246 (minus 0.273 to minus 0.219); Quadratic Mean 0.013 (0.011 to 0.015).
* Class 2: Intercept Mean 2.867 (2.847 to 2.887); Linear Mean minus 0.136 (minus 0.160 to minus 0.112); Quadratic Mean 0.008 (0.006 to 0.010).
* Class 3: Intercept Mean 1.783 (1.693 to 1.873); Linear Mean 0.020 (minus 0.054 to 0.094); Quadratic Mean 0.002 (minus 0.006 to 0.010).
* Class 4: Intercept Mean 2.934 (2.907 to 2.961); Linear Mean minus 0.300 (minus 0.331 to minus 0.269); Quadratic Mean 0.01 (0.006 to 0.014).
* Class 5: Intercept Mean 1.201 (1.168 to 1.234); Linear Mean minus 0.049 (minus 0.071 to minus 0.027); Quadratic Mean 0.001 (minus 0.001 to 0.003).
* Class 6: Intercept Mean 0.296 (0.265 to 0.327); Linear Mean 0.059 (0.034 to 0.084); Quadratic Mean minus 0.005 (minus 0.007 to minus 0.003).



 Open access

