


Highlights
What is already known?
-
• Flexible meta-regression can be used to model outcome–exposure relationships in meta-analyses. Different basis expansions of the exposure variable can be used in flexible meta-regression, including splines and fractional polynomials.
-
• Reporting guidelines in meta-analysis are important for ensuring transparency and reproducibility of research. However, no such guidelines exist for the reporting of studies employing flexible meta-regression.
What is new?
-
• The number of published studies employing flexible meta-regression increased dramatically over the period 2011–2021.
-
• Among the classes of basis expansions considered, spline models were more commonly used than the other methods.
-
• Reporting quality was generally poor among included studies, regardless of the method used.
Potential impact for RSM readers
-
• Our article provides an overview of the use of flexible meta-regression for researchers.
-
• Researchers may consult our list of reporting guidelines to improve the transparency and reproducibility of their flexible meta-regression analyses.
1 Introduction
Systematic reviews and meta-analyses are a cornerstone of epidemiological research. These studies synthesize the results of published literature on a given medical topic, providing the notable benefit of increased statistical power over any single study. Methods which meta-analyze non-linear exposure–outcome trajectories are called flexible meta-regression methods.
Flexible meta-regression proceeds in a similar way to standard meta-regression, with the main difference being replacing linear exposure term x with the terms of a basis expansion $\mathbf {B}=\big (f_1(x),f_2(x),\ldots ,f_m(x)\big )$
in order to flexibly model the trajectory over outcome y over its range. Many such bases have been used in practice, including: polynomial regression, where x is transformed into a polynomial expansion of degree m
Reference Greenland
1
; fractional polynomial (FP) models, where a variable selection algorithm pulled from a set of power transformations of x chooses the best fitting terms for the basisReference Royston, Ambler and Sauerbrei
2
–
Reference Sauerbrei and Royston
4
; and splines, which divide the range of x based on pre-specified knots and constructs low-order polynomials between them.Reference Perperoglou, Sauerbrei, Abrahamowicz and Schmid
5
–
Reference Bagnardi
7
See Appendix A for an overview of these methods.
$\mathbf {B}=\big (f_1(x),f_2(x),\ldots ,f_m(x)\big )$
in order to flexibly model the trajectory over outcome y over its range. Many such bases have been used in practice, including: polynomial regression, where x is transformed into a polynomial expansion of degree m
Reference Greenland
1
; fractional polynomial (FP) models, where a variable selection algorithm pulled from a set of power transformations of x chooses the best fitting terms for the basisReference Royston, Ambler and Sauerbrei
2
–
Reference Sauerbrei and Royston
4
; and splines, which divide the range of x based on pre-specified knots and constructs low-order polynomials between them.Reference Perperoglou, Sauerbrei, Abrahamowicz and Schmid
5
–
Reference Bagnardi
7
See Appendix A for an overview of these methods.
Transparent reporting of methods is important to ensure scientific reproducibility. To our knowledge, no comprehensive overview of flexible meta-regression methods has been published to date. Past reviews on other meta-regression methods and standard flexible (non-meta-)regression have identified reporting issues in the published literature.Reference Perperoglou, Sauerbrei, Abrahamowicz and Schmid 5 , Reference Xu, Liu and Jia 8 – Reference Jia, Xu and Cheng 11
We conducted a systematic search of the use of flexible meta-regression methods from 2011 to 2021 to describe: (a) their use and (b) the quality of their reporting.
2 Methods
2.1 Literature search
We searched EMBASE and MEDLINE for studies employing flexible meta-regression methods published between 2011 and 2021. Search terms were adapted from a pre-defined search filter to identify systematic reviews 12 (Appendix B). The Cochrane Collaboration Library was also searched using the search terms related to flexible meta-regression in the title and abstract fields (lines 24–33). Included abstracts and studies not published in English or French were translated using professional translators.
2.2 Inclusion and exclusion criteria
Two independent reviewers screened the titles and abstracts of identified studies at the first stage. Inclusion at this stage was solely based on whether the study was a biomedical systematic review. Any studies included by at least one of the reviewers were moved forward to the second stage of study selection. In the second stage, the full text was screened for inclusion by two independent reviewers. As the Cochrane Collaboration Library contains only meta-studies by design, results from this database were immediately moved forward to the second stage. Exclusion criteria at the second stage are listed in Appendix C. Any discrepancies between the two independent assessors were first discussed between them to achieve consensus. Discrepancies which were not resolved through discussion were brought to a third reviewer for final consensus. Inclusion/exclusion of identified studies was conducted in the DistillerSR systematic review software 13 and Microsoft Excel. 14
2.3 Data extraction and validation
Due to the large number of included records, a decision was made to conduct full data extraction and validation on a random subsample of studies satisfying inclusion criteria as is standard practice in reviews including a large number of studies.Reference Mbuagbaw, Kredo and Welch 15 Given the substantial sample of included studies, the time required to extract data, and the methodological scope of this review, it was determined that a sample of 25% was sufficient for full data extraction. A researcher extracted data from the included studies. These data were then validated by a second independent researcher. The variables to be extracted were determined a priori based on the research objectives. Standard publication characteristics were extracted (author country affiliations, number of authors, journal of publication, clinical field of study, and journal impact factor [JIF]). The primary clinical field of study was coded from the following categories: nutrition, public health, cardiology, nephrology, oncology, psychology, and other. The type of meta-analysis (MA or IPDMA as well), whether network MA (NMA) methods were used, and the number of included studies were also extracted. JIF in the publication year was obtained from Clarivate’s Journal Citations Reports online tool. If JIF was not available, the value for the nearest year was taken, with a preference for an earlier rather than later year. Publication year as well as the number of authors were obtained directly from bibliographic data. These were the only characteristics available for the entire sample, obtained directly from the bibliographic data of the initial search. All other publication characteristics were available only for the subsample from which further data were extracted. As the assessment of the risk of epidemiological bias is beyond the scope of this methodological study, included studies were not assessed for risk of bias (RoB).
The flexible meta-regression method(s) employed were extracted verbatim in a free text field. These were then coded into one of four categories: splines; local regression (LR); FP; and other methods, such as moving averages or (non-fractional) polynomial regression.
2.4 Proposed reporting guidelines
Given the lack of specific guidance for the reporting of flexible meta-regression methods, we propose a set of reporting items (Table 1). These were developed with knowledge of the methodological literature on flexible meta-regression as well as an initial overview of the included studies in the present review. Typically, reporting quality in a meta-study is measured through a checklist, such as the Preferred Reporting Items of Systematic reviews and Meta-Analyses (PRISMA).Reference Moher, Liberati, Tetzlaff and Altman 16 These guidelines encompass all aspects of the systematic review process. The reporting guidelines presented here are focused on the statistical methods employed in meta-studies using flexible meta-regression methods. The PRISMA statements concerning individual participant data MA (IPDMA)Reference Stewart, Clarke and Rovers 17 and NMAReference Liberati, Altman and Tetzlaff 18 provide examples of detailed guidance on statistical methodology, in particular. We referred to Perperoglou et al.Reference Perperoglou, Sauerbrei, Abrahamowicz and Schmid 5 for recommendations regarding spline models.
Proposed reporting guidelines for flexible meta-regression methods in systematic reviews

We employed our proposed reporting guidelines to extract information on the quality of reporting of flexible meta-regression methods from subsampled studies. Each of the 9 included items presents as a yes or no question, with a positive answer indicating good reporting and a negative one indicating the contrary. Items 5, 8, and 9 were only considered for studies which claimed to either have conducted a statistical test in their flexible meta-regression (Item 5), used spline methods (Item 8), or produced a figure of flexible meta-regression results (Item 9), respectively.
2.5 Data analysis
Descriptive statistics (n and % of studies) were calculated for important study characteristics. For numerical publication factors (impact factor, number of authors, and number of included studies), sample means and standard errors were also calculated. ANOVA was used to compare between group means of numerical variables. Chi-squared tests were used to compare group proportions. As the full sample is the target population of this review, we correspondingly used the fixed-population correction
 $$ \begin{align*} \text{FPC}=\sqrt{\frac{N_{\text{total}}-N_{\text{samp}}}{N_{\text{total}}-1}}=\sqrt{\frac{346-86}{346-1}}\approx0.868 \end{align*} $$
to adjust standard errors (SEs) estimated from the subsample, where $N_{\text {total}}=346$
is the number of studies in the target population and
$N_{\text {total}}=346$
is the number of studies in the target population and $N_{\text {samp}}=86$
is the number of studies sampled without replacement from the population.Reference Cochran
19
The subsample was compared to the full sample by the number of authors and publication year, the two bibliographic variables which the samples shared. Natural spline models with
$N_{\text {samp}}=86$
is the number of studies sampled without replacement from the population.Reference Cochran
19
The subsample was compared to the full sample by the number of authors and publication year, the two bibliographic variables which the samples shared. Natural spline models with $k=3$
equally-spaced knots were used to describe trends in scatterplots. All analyses were conducted in R.
20
$k=3$
equally-spaced knots were used to describe trends in scatterplots. All analyses were conducted in R.
20
2.6 Literature search update
After conducting the initial search, it was determined that studies using FP methods may not have been adequately captured. It was decided that an update would be conducted with an edited search strategy. In the new search, line 33 was modified to include the term “fractional poly*” (see Appendix B). The results of this search were then filtered using an anti-join to obtain the unique updated results. These were then assessed for eligibility in the present review. A random subsample of 25% of the eligible studies—the same procedure for the initial search—was included in data extraction, validation, and analysis.
3 Results
3.1 Search results
Our initial search identified a total of $N=2,466$
records, of which
$N=2,466$
records, of which $N=981$
were duplicates (Figure 1). The remaining
$N=981$
were duplicates (Figure 1). The remaining $N=1,485$
records screened included an additional
$N=1,485$
records screened included an additional $N=59$
studies identified in the search update. We excluded
$N=59$
studies identified in the search update. We excluded $N=1,109$
studies at the first stage of inclusion. We retrieved full-texts for all
$N=1,109$
studies at the first stage of inclusion. We retrieved full-texts for all $N=419$
included studies as well as
$N=419$
included studies as well as $N=43$
identified from the Cochrane database. Of these, a total of
$N=43$
identified from the Cochrane database. Of these, a total of $N=73$
were excluded at the second stage, leaving
$N=73$
were excluded at the second stage, leaving $N=346$
studies meeting inclusion criteria. A random subsample of 25% (
$N=346$
studies meeting inclusion criteria. A random subsample of 25% ( $N=86$
) was selected for full extraction.
$N=86$
) was selected for full extraction.
PRISMA flowchart outlining initial search, updated search, and screening results.
Note: Studies identified in the updated search as described in the methods section in order to capture fractional polynomial models. As described in Appendix B, the results were anti-joined to the results of the original search in order to capture studies which were not initially identified.

To assess the representativeness of the subsample, we compared it to the full sample using the bibliographic data available in both datasets. The subsample did not statistically significantly differ from the full sample in either the mean number of authors ( $6.9$
, SD
$6.9$
, SD $ = 4.6$
, and
$ = 4.6$
, and $7.3$
, SD
$7.3$
, SD $= 6.9$
, respectively) nor in the distribution of studies over publication year.
$= 6.9$
, respectively) nor in the distribution of studies over publication year.
3.2 Use of flexible meta-regression methods
The number of studies using flexible meta-regression methods increased over 2011–2021 (Figure 2, $p<0.001$
). Of the
$p<0.001$
). Of the $N=347$
studies, only
$N=347$
studies, only $N=5$
(
$N=5$
( $1.4\%$
) were published in 2011. The yearly frequency of publications increased eight-fold between 2011 and 2016 (
$1.4\%$
) were published in 2011. The yearly frequency of publications increased eight-fold between 2011 and 2016 ( $N=44$
,
$N=44$
, $12.7\%$
). Between 2016 and 2021, numbers remained constant, with a peak in 2019 of
$12.7\%$
). Between 2016 and 2021, numbers remained constant, with a peak in 2019 of $N=49$
(
$N=49$
( $14.1\%$
).
$14.1\%$
).
Histogram of identified and sub-sampled studies by publication year.
Note: The lightly shaded bars show the frequency by publication year of the $N=346$
included studies. The dark bars show the same frequency but for the
$N=346$
included studies. The dark bars show the same frequency but for the $N=86$
sub-sampled studies from which additional data were extracted.
$N=86$
sub-sampled studies from which additional data were extracted.

Of the $N=86$
for which additional data were extracted, spline models were the most widely used method (
$N=86$
for which additional data were extracted, spline models were the most widely used method ( $N=67$
,
$N=67$
, $77.9\%$
). This was statistically significant (
$77.9\%$
). This was statistically significant ( $p<0.001$
). FP and LR were less common among included studies (
$p<0.001$
). FP and LR were less common among included studies ( $N=17$
,
$N=17$
, $19.8\%$
, and
$19.8\%$
, and $N=5$
,
$N=5$
, $5.8\%$
, respectively). Two studies (
$5.8\%$
, respectively). Two studies ( $2.3\%$
) used other methods (a moving average model and a piecewise linear model) while two reported using flexible meta-regression but the particular method was unclear. Excluding the two studies with unclear methods,
$2.3\%$
) used other methods (a moving average model and a piecewise linear model) while two reported using flexible meta-regression but the particular method was unclear. Excluding the two studies with unclear methods, $N=77$
(
$N=77$
( $91.7\%$
) employed a single method while
$91.7\%$
) employed a single method while $N=6$
(
$N=6$
( $7.1\%$
) employed two. Four (
$7.1\%$
) employed two. Four ( $4.8\%$
) used both spline and FP. Two studies (
$4.8\%$
) used both spline and FP. Two studies ( $2.4\%$
) using other methods also employed a second: one of these also used splines and the other used LR. While FP models were more commonly used toward the end of the study period, no statistically significant trend was observed between the flexible meta-regression methods and year of publication.
$2.4\%$
) using other methods also employed a second: one of these also used splines and the other used LR. While FP models were more commonly used toward the end of the study period, no statistically significant trend was observed between the flexible meta-regression methods and year of publication.
The most common clinical field was nutrition ( $N=37$
) followed by public health (
$N=37$
) followed by public health ( $N=24$
) and cardiology (
$N=24$
) and cardiology ( $N=9$
). Mean JIF was
$N=9$
). Mean JIF was $4.4$
(SD
$4.4$
(SD $ =4.7$
). Studies had a mean of
$ =4.7$
). Studies had a mean of $7.5$
(SD
$7.5$
(SD $ =4.0$
) authors and of
$ =4.0$
) authors and of $22.8$
(SD
$22.8$
(SD $ =18.2$
) included studies. Only two studies were IPDMAs. Five countries had five or more publications with at least one affiliated author: China (
$ =18.2$
) included studies. Only two studies were IPDMAs. Five countries had five or more publications with at least one affiliated author: China ( $N=48$
,
$N=48$
, $55.8\%$
), the USA (
$55.8\%$
), the USA ( $N=16$
,
$N=16$
, $18.6\%$
), the UK (
$18.6\%$
), the UK ( $N=11$
,
$N=11$
, $12.8\%$
), Iran (
$12.8\%$
), Iran ( $N=9$
,
$N=9$
, $10.5\%$
), and Italy (
$10.5\%$
), and Italy ( $N=5$
,
$N=5$
, $5.8\%$
). No studies used NMA methods (not shown in Table 2). Mean JIF varied slightly over the study period (Figure 3).
$5.8\%$
). No studies used NMA methods (not shown in Table 2). Mean JIF varied slightly over the study period (Figure 3).
Summary statistics of sub-sampled studies by method and publication characteristic

* Individual studies may use more than one method.
** Categories based on JIF tertiles. Low: $<$
3.0; Mid: 3.0–4.2; High:
$<$
3.0; Mid: 3.0–4.2; High: $>$
4.2.
$>$
4.2.
*** Country/countries of affiliation of study authors as listed in the publication. Authors may have more than one country of affiliation. FP = fractional polynomial models; IPDMA = individual participant data meta-analysis; JIF = journal impact factor; LR = local regression; MA = meta-analysis.
Scatterplot of impact factor over publication year of sub-sampled studies.
Note: The dashed line is the fitted estimate for mean impact factor over time obtained through a linear regression model using a natural cubic spline basis with $k=3$
equally-spaced knots over the range of publication year. The 95% confidence ribbon (shaded gray) was obtained using the fitted SE of the spline regression model.
$k=3$
equally-spaced knots over the range of publication year. The 95% confidence ribbon (shaded gray) was obtained using the fitted SE of the spline regression model.

Descriptively, there were differences in certain publication characteristics between the methods used (Table 2). FP models became more common over time relative to other models (Figure 4). However, of the methods considered in this article, splines were the sole method used each year and were most commonly used in every single year. JIF differed somewhat between methods. Over half of studies using FP were published in the highest JIF tertile journals (JIF $> 4.2$
) compared to around a third for splines. The mean JIF of papers using FP (
$> 4.2$
) compared to around a third for splines. The mean JIF of papers using FP ( $5.0$
, SD
$5.0$
, SD $ = 2.5$
) was higher than that of those using splines (
$ = 2.5$
) was higher than that of those using splines ( $4.4$
, SD
$4.4$
, SD $ = 2.9$
) or LR (
$ = 2.9$
) or LR ( $3.4$
, SD
$3.4$
, SD $ = 2.6$
) (Table 2 and Figure 5). The mean number of included studies was highest for those using LR (
$ = 2.6$
) (Table 2 and Figure 5). The mean number of included studies was highest for those using LR ( $35.2$
, SD
$35.2$
, SD $ = 14.6$
) compared to spline (
$ = 14.6$
) compared to spline ( $21.5$
, IQR
$21.5$
, IQR $ = 19.0$
) or FP (
$ = 19.0$
) or FP ( $19.8$
, IQR
$19.8$
, IQR $ = 11.9$
) methods. However, the five reviews, including the largest number of studies, all employed spline methods. None of the tests for differences between the three methods presented here were significant at the 95% confidence level, however.
$ = 11.9$
) methods. However, the five reviews, including the largest number of studies, all employed spline methods. None of the tests for differences between the three methods presented here were significant at the 95% confidence level, however.
Histogram of sub-sampled studies by publication year and flexible meta-regression method.

Boxplot of impact factor, number of authors, and number of included studies by flexible meta-regression method.
Note: Due to small sample sizes in the other categories, only the results for spline ( $N=67$
), FP (
$N=67$
), FP ( $N=17$
), and LR (
$N=17$
), and LR ( $N=5$
) models are shown here. Studies may use more than one method. FP = fractional polynomial; LR = local regression.
$N=5$
) models are shown here. Studies may use more than one method. FP = fractional polynomial; LR = local regression.

3.3 Quality of reporting
Overall, 67.4% of studies ( $N=58$
) did not meet at least one of the reporting items (Table 3). The item with the worst reporting was Item 9 (reporting the method in included figures, if applicable). 44.4% (
$N=58$
) did not meet at least one of the reporting items (Table 3). The item with the worst reporting was Item 9 (reporting the method in included figures, if applicable). 44.4% ( $N=32$
) of the
$N=32$
) of the $N=72$
studies, including a figure, did not meet this item. Item 1 (does the study present any results of the flexible meta-regression method employed) had the best reporting, with only one study not meeting it.
$N=72$
studies, including a figure, did not meet this item. Item 1 (does the study present any results of the flexible meta-regression method employed) had the best reporting, with only one study not meeting it.
Number of sub-sampled studies by reporting item issue and publication characteristics

Note: Reporting items are outlined in full in Table 1. Note that Items 5, 8, and 9 are not applicable to all studies.
* Reporting items are assessed by method and not by study. Individual studies may use more than one method, this may mean that a study which uses two separate methods may meet the guidelines for one method but not the other, for example.
** Categories based on JIF tertiles. Low: $<$
3.0; Mid: 3.0–4.2; High:
$<$
3.0; Mid: 3.0–4.2; High: $>$
4.2.
$>$
4.2.
FP = fractional polynomial models; IPDMA = individual participant data meta-analysis; JIF = journal impact factor; LR = local regression; MA = meta-analysis.
Studies using LR ( $N=5$
) or with unclear methods (
$N=5$
) or with unclear methods ( $N=2$
) all had at least one item which was not met. Spline studies were moderately less likely to have at least one unmet reporting item (
$N=2$
) all had at least one item which was not met. Spline studies were moderately less likely to have at least one unmet reporting item ( $N=30$
, 59.7%) than FP (
$N=30$
, 59.7%) than FP ( $N=14$
, 82.4%) methods, although this difference was not statistically significant. In general, there was no statistically significant trend over the considered methods in reporting quality, defined as not meeting at least one checklist item.
$N=14$
, 82.4%) methods, although this difference was not statistically significant. In general, there was no statistically significant trend over the considered methods in reporting quality, defined as not meeting at least one checklist item.
Reporting was better in studies published midway through 2011–2021 (Table 3 and Figure 3). All studies from 2020 to 2021 ( $N=20$
) did not meet at least one of the items. Overall, studies from the highest JIF tertile journals showed worse reporting (75.0% not meeting at least one item) than those published in the lower tertiles (62.1% and 65.5% for the lowest and middle tertiles, respectively). Again, however, this finding was not statistically significant. Of the top five observed clinical fields in the subsample for which data were extracted, reporting was best in nephrology while it was worst in cardiology. Studies with 1–3 authors had markedly better reporting (43.8% not meeting at least one item) than those with four or more (between more than 70.0%).
$N=20$
) did not meet at least one of the items. Overall, studies from the highest JIF tertile journals showed worse reporting (75.0% not meeting at least one item) than those published in the lower tertiles (62.1% and 65.5% for the lowest and middle tertiles, respectively). Again, however, this finding was not statistically significant. Of the top five observed clinical fields in the subsample for which data were extracted, reporting was best in nephrology while it was worst in cardiology. Studies with 1–3 authors had markedly better reporting (43.8% not meeting at least one item) than those with four or more (between more than 70.0%).
4 Discussion
We identified $N=346$
systematic reviews published from 2011 to 2021 which employed flexible meta-regression methods. Over this period, the number of studies increased. This corresponds with previous research showing the increasing popularity meta-regression.Reference Pigott and Polanin
21
A 2019 study found that the number of published meta-analyses increased by over 4,000% between 1995 and 2017.Reference Niforatos, Weaver and Johansen
22
Similarly, Tipton et al.Reference Tipton, Pustejovsky and Ahmadi
23
found that the number of meta-regression studies (rather than other meta-analyses) increased dramatically since the mid-1970s. They found that the number of studies including “meta-analysis” and “meta-regression” or “meta regression” in the title increased from
$N=346$
systematic reviews published from 2011 to 2021 which employed flexible meta-regression methods. Over this period, the number of studies increased. This corresponds with previous research showing the increasing popularity meta-regression.Reference Pigott and Polanin
21
A 2019 study found that the number of published meta-analyses increased by over 4,000% between 1995 and 2017.Reference Niforatos, Weaver and Johansen
22
Similarly, Tipton et al.Reference Tipton, Pustejovsky and Ahmadi
23
found that the number of meta-regression studies (rather than other meta-analyses) increased dramatically since the mid-1970s. They found that the number of studies including “meta-analysis” and “meta-regression” or “meta regression” in the title increased from $N=1$
in 1980–1989 to
$N=1$
in 1980–1989 to $N=408$
in 2010–2017. Our review identified
$N=408$
in 2010–2017. Our review identified $N=188$
studies which employed flexible meta-regression in 2011–2017. While the search strategies between the two studies differed, this suggests that around half of published meta-regression studies employed flexible methods in this period.
$N=188$
studies which employed flexible meta-regression in 2011–2017. While the search strategies between the two studies differed, this suggests that around half of published meta-regression studies employed flexible methods in this period.
Splines were employed more frequently in the included studies than the other considered models. This persisted over important publication factors. However, FP methods became relatively more common over time—although there were no statistically significant trends over time in terms of the specific methods used. While FP models are generally widely implemented in statistical software, their extensions to meta-regression were proposed around the same time as splines.Reference Greenland 1 , Reference Bagnardi 7 It could be that splines have been more widely used in single studies and have therefore remained more familiar to clinical researchers over time.
The more prevalent use of splines does not imply that they are superior. One advantage of splines is their flexibility, allowing researchers to select knots based on a priori clinical knowledge.Reference Perperoglou, Sauerbrei, Abrahamowicz and Schmid 5 They can also estimate, in theory, any smooth function. On the other hand, FP models require less input and, therefore, may be less subjective.Reference White, Kaptoge, Royston and Sauerbrei 3
The impact factor of papers employing flexible meta-regression methods increased between 2015 and 2021 (Figure 3). This was preceded by a decrease in the period 2011–2014. Fewer studies from the early years of this period were identified and, therefore, the high JIF of the single study from 2011 may skew this trend. Keeping this in mind, the publication impact of reviews using flexible meta-regression generally increased over time.
We found no positive trend between journal impact and reporting quality. However, past research has found evidence for such a trend.Reference Bala, Akl and Sun 24 Often, reporting quality is measured with reference to gold-standard checklists, such as PRISMA and MOOSE.Reference Moher, Liberati, Tetzlaff and Altman 16 , Reference Brooke, Schwartz and Pawlik 25 The lack of trend identified in our study may be due to the lack of such an existing framework for flexible meta-regression to which authors may refer.
We identified other trends in reporting quality. Over two-thirds of reviews had at least one reporting issue. This matches with past research.Reference Xu, Liu and Jia 8 – Reference Jia, Xu and Cheng 11 These reviews, which focused on “dose–response” studies, found that reporting was inconsistent. We found that studies using splines had better reporting than those using FP or LR, although this trend was not statistically significant. Despite the lack of statistical significance, this descriptive trend may be surprising, as splines have the additional requirement of having to explicitly specify knots in order to be reproducible.Reference Perperoglou, Sauerbrei, Abrahamowicz and Schmid 5 In the analyzed subsample, splines had better rates of reporting than FP on seven of the eight non-spline-specific items. However, nearly one of five spline studies did not report knot locations. Past studies have also identified issues in reporting knot locations.Reference Perperoglou, Sauerbrei, Abrahamowicz and Schmid 5
There were differences in reporting quality over publication year and number of authors. The most recently published studies (2020–2021) had the lowest reporting quality. Authors should take care to ensure that they clearly and transparently report their use of statistical methods. This is a key component of research reproducibility. Studies with one to three authors appeared to have better reporting than those with four or more. Fleming et al.Reference Fleming, Koletsi and Pandis 26 examined the qualifications of authors of published systematic reviews and found that the appropriate use of reporting guidelines was associated with the inclusion of methodologists on the team reviewing the research. Similarly, Oltean et al.Reference Oltean and Gagnier 27 found that the reporting of specialized statistical methods, such as those accounting for clustered data, was related to the participation of methodologists on the study team as measured through author self-report. This may be related to the number of authors, although we did not specifically extract this level of detail from included studies. We also found that studies appearing in higher impact journals did not have higher reporting quality than those published in lower impact ones. This may appear counter-intuitive, given past research showing the contrary.Reference Mbuagbaw, Kredo and Welch 15 – Reference Bala, Akl and Sun 24 However, as no guidelines currently exist, editors may not be as demanding on specific reporting norms compared to more well-established fields such as the MA of binary treatments. Given the large number of studies using flexible meta-regression, the development of new reporting guidelines is of clear benefit to both authors and journal editors alike.
4.1 Strengths, limitations, and future work
Previous meta-reviews have considered the use and reporting of other methods in systematic reviews, but none to date have considered flexible meta-regression in particular.Reference Xu, Liu and Jia 8 – Reference Jia, Xu and Cheng 11 This study provides an insight into how researchers are using these methods in practice and where reporting may be improved in the future.
Our study has certain limitations, however. First, our search may have missed relevant studies.Reference Uttley, Quintana and Montgomery
28
We conducted a secondary search when it was found that studies employing FP methods were not being included in the initial search. We transparently highlight this search update in this article, although it is a limitation which must be acknowledged. Second, it was not practical to extract data from all $N=346$
included studies. A random subsample was selected for full extraction. While this is common practice, this is a limitation to the present analysis.Reference Wilson, Burnett, Moher, Altman and Al-Shahi
29
–
Reference Wilson, Burnett, Moher, Altman and Al-Shahi
31
This could have affected the power of our tests of numerical publication characteristics between the flexible meta-regression method groups. However, the sampled studies were not found to differ from those included in the full sample along available publication characteristics, giving no indication that the subsample is not broadly representative. Third, some of the extracted publication characteristics were subjective in nature (e.g., clinical field). However, they could still be important factors and should be extracted nonetheless.Reference Mbuagbaw, Lawson, Puljak, Allison and Thabane
32
Fourth, this study was not prospectively registered, although an initial protocol is available on the Open Science Framework (https://osf.io/kwm9p/). The reason for not prospectively registering a protocol is that the scope of the project increased over time. This, however, remains an important limitation. Despite this, we believe the work presented here has merit, particularly in terms of the absence of published reporting guidelines on flexible meta-regression methods. Fifth, given this gap in methodological guidance, we created a new list of reporting items specific to flexible meta-regression. However, these items employed binary yes/no assessments of reporting quality, which could limit their specificity and lead to over-simplified results. Future work could consider elaborating on some of the items and allowing for the evaluation of reporting adequacy and accuracy beyond a simple binary. Sixth, our aim was not to critically appraise the individual flexible meta-regression methods considered in this review. Indeed, each method has its own merits and it is at the discretion of researchers to employ those which best suit their data and research question. Finally, our proposed guidelines were based on an initial review of the included literature as well as our knowledge of the field. However, these guidelines have not been externally validated and were implemented ad hoc. Past meta-reviews, however, have used this approach given no previous recommendations.Reference Mbuagbaw, Kredo and Welch
15
,
Reference Mbuagbaw, Lawson, Puljak, Allison and Thabane
32
We believe that our proposed reporting guidelines provide a foundation for work to develop a validated list of guidelines. Past guidelines, such as PRISMAReference Moher, Liberati, Tetzlaff and Altman
16
and its subject-specific variants,Reference Stewart, Clarke and Rovers
17
,
Reference Liberati, Altman and Tetzlaff
18
have been established through collaborative work between researchers.
$N=346$
included studies. A random subsample was selected for full extraction. While this is common practice, this is a limitation to the present analysis.Reference Wilson, Burnett, Moher, Altman and Al-Shahi
29
–
Reference Wilson, Burnett, Moher, Altman and Al-Shahi
31
This could have affected the power of our tests of numerical publication characteristics between the flexible meta-regression method groups. However, the sampled studies were not found to differ from those included in the full sample along available publication characteristics, giving no indication that the subsample is not broadly representative. Third, some of the extracted publication characteristics were subjective in nature (e.g., clinical field). However, they could still be important factors and should be extracted nonetheless.Reference Mbuagbaw, Lawson, Puljak, Allison and Thabane
32
Fourth, this study was not prospectively registered, although an initial protocol is available on the Open Science Framework (https://osf.io/kwm9p/). The reason for not prospectively registering a protocol is that the scope of the project increased over time. This, however, remains an important limitation. Despite this, we believe the work presented here has merit, particularly in terms of the absence of published reporting guidelines on flexible meta-regression methods. Fifth, given this gap in methodological guidance, we created a new list of reporting items specific to flexible meta-regression. However, these items employed binary yes/no assessments of reporting quality, which could limit their specificity and lead to over-simplified results. Future work could consider elaborating on some of the items and allowing for the evaluation of reporting adequacy and accuracy beyond a simple binary. Sixth, our aim was not to critically appraise the individual flexible meta-regression methods considered in this review. Indeed, each method has its own merits and it is at the discretion of researchers to employ those which best suit their data and research question. Finally, our proposed guidelines were based on an initial review of the included literature as well as our knowledge of the field. However, these guidelines have not been externally validated and were implemented ad hoc. Past meta-reviews, however, have used this approach given no previous recommendations.Reference Mbuagbaw, Kredo and Welch
15
,
Reference Mbuagbaw, Lawson, Puljak, Allison and Thabane
32
We believe that our proposed reporting guidelines provide a foundation for work to develop a validated list of guidelines. Past guidelines, such as PRISMAReference Moher, Liberati, Tetzlaff and Altman
16
and its subject-specific variants,Reference Stewart, Clarke and Rovers
17
,
Reference Liberati, Altman and Tetzlaff
18
have been established through collaborative work between researchers.
5 Conclusion
We conducted a systematic search of the clinical literature on flexible meta-regression. We observed an increasing popularity of this method. Splines were the most used method among those considered in this article, with the use of FP growing somewhat over time. Reporting quality was generally poor among all studies, regardless of the method used. Reporting quality did not improve over time. This study may provide a useful guide for those hoping to conduct research in this field. Our findings highlight the need for better reporting among flexible meta-regression studies. This could be aided by the publication of a common set of reporting guidelines, as is the case in other fields of meta-research.
Author contributions
Conceptualization: A.B. and M.P.; Data curation: M.P.; Methodology: A.B., M.P., and R.S.; Formal analysis: M.P.; Investigation: M.P.; Visualization: M.P.; Validation: M.P. and V.J.C.; Writing—original draft: M.P.; Writing—review and editing: A.B., M.P., and R.S. All authors approved the final submitted draft.
Competing interest statement
The authors declare that no competing interests exist.
Data availability statement
The extracted data from the subsample of studies included in the review are available on the Open Science Framework (https://osf.io/kwm9p/).
Funding statement
M.P. received Ph.D. trainee funding from the Fond de Recherche du Québec – Santé (FRQS) (Bourses de doctorat en recherche numéro 333254). This work is also partially supported by the Canadian Institutes of Health Research (CIHR) funding.
Ethical standards
The research meets all ethical guidelines, including adherence to the legal requirements of the study country.
A Appendix. Summary of selected flexible regression methods
Flexible regression is the application of flexible basis expansions as terms in a regression model. A basis expansion is defined as a set of functions:
 $$ \begin{align} \mathbf{B}(x)=\big(f_1(x),f_2(x),\ldots,f_m(x)\big). \end{align} $$
The basis function is evaluated over the support of x. Once a suitable basis is obtained, one may include its elements as predictors in regression models.
For example, one may fit a simple regression model with outcome y, as follows:
 $$ \begin{align} \mathbf{y} = \beta_0 + \mathbf{B}(x) \boldsymbol{\beta}+ \boldsymbol{\epsilon,} \end{align} $$
where B is an $n\times m$
matrix of basis vectors,
$n\times m$
matrix of basis vectors, $f_1,f_2,\ldots ,f_m$
are functions of x,
$f_1,f_2,\ldots ,f_m$
are functions of x, $\beta _0$
is the linear intercept,
$\beta _0$
is the linear intercept, $\boldsymbol \beta = (\beta _1,\ldots ,\beta _m)$
is a vector of length m containing the coefficients of the basis vectors, and
$\boldsymbol \beta = (\beta _1,\ldots ,\beta _m)$
is a vector of length m containing the coefficients of the basis vectors, and $\boldsymbol \epsilon $
is a vector of error terms for the n data points.
$\boldsymbol \epsilon $
is a vector of error terms for the n data points.
While simple methods with known disadvantages, such as categorization, polynomial models, and piecewise functions, are sometimes used, recent advances in computing power have made it easy to fit relatively complex expansions.Reference Royston and Sauerbrei 33 Select flexible regression models are highlighted below. For a thorough introduction, see Ramsay and Silverman.Reference Ramsay and Silverman 34
A.1 Polynomial regression
Polynomial regression of degree m is based on a basis set of $j=1,\ldots ,m$
polynomial transformations
$j=1,\ldots ,m$
polynomial transformations $f_j$
of x as follows:
$f_j$
of x as follows:
 $$ \begin{align} f_j(x)=x^j. \end{align} $$
These models are a natural extension of simple linear regression. One benefit is that they allow for tailoring the complexity of the trajectory to the desired complexity of the supposed relationship. If one suspects that the true trajectory changes direction exactly once, for instance, it may be sufficient to fit a polynomial model of degree $m=2$
.Reference Madure and Greenland
35
Indeed, by adding more and more polynomial terms of increasing degree into the base set, one may fit trajectories resembling nearly any complex smooth curve.Reference Greenland
1
$m=2$
.Reference Madure and Greenland
35
Indeed, by adding more and more polynomial terms of increasing degree into the base set, one may fit trajectories resembling nearly any complex smooth curve.Reference Greenland
1
However, there are some problems with polynomial models. For one, adding bases beyond the quadratic term may lead to erratic fitted trajectories for extreme exposure values.Reference Greenland
1
Further, too many polynomial terms can result in unstable estimates, especially for small sample sizes.Reference Greenland
1
It is also important to ensure that values of $x=0$
(if any) do not overly influence model estimates.Reference Madure and Greenland
35
$x=0$
(if any) do not overly influence model estimates.Reference Madure and Greenland
35
A.2 Piecewise functions
A piecewise function is defined based on a partition of the range of x into K intervals. Within each interval k, the function $f_k(x)$
takes on a certain value. This value can be constant or based on some transformation of x.Reference Hastie, Tibshirani and Friedman
36
The type of piecewise model used depends on what class of transformations of x are allowed (e.g., the degree d of a polynomial
$f_k(x)$
takes on a certain value. This value can be constant or based on some transformation of x.Reference Hastie, Tibshirani and Friedman
36
The type of piecewise model used depends on what class of transformations of x are allowed (e.g., the degree d of a polynomial $f_k(x)=x+x^2+\cdots +x^d$
), the intervals chosen, and whether or not the
$f_k(x)=x+x^2+\cdots +x^d$
), the intervals chosen, and whether or not the $f_k(x)$
are allowed to jump or are forced to be equal at interval boundaries.
$f_k(x)$
are allowed to jump or are forced to be equal at interval boundaries.
The basis of a piecewise model consists of two parts: the intercept basis and the function basis. The former is simply the basis set of indicator functions for the K intervals: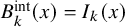 $B_k^{\text {int}}(x) = I_k(x)$
. Here,
$B_k^{\text {int}}(x) = I_k(x)$
. Here, $I_k(x)$
is the indicator function equal to
$I_k(x)$
is the indicator function equal to $1$
when x is within interval k and
$1$
when x is within interval k and $0$
elsewhere. The latter is the basis set of the K products of functions
$0$
elsewhere. The latter is the basis set of the K products of functions $f_k(x)$
with their respective interval indicator functions
$f_k(x)$
with their respective interval indicator functions $I_k(x)$
:
$I_k(x)$
: $B_k^{\text {fun}}(x) = f_k(x)I_k(x)$
. This gives the basis set
$B_k^{\text {fun}}(x) = f_k(x)I_k(x)$
. This gives the basis set
 $$ \begin{align*} \mathbf{B} = \big\{B_k^{\text{int}}\big\}_{k=1,\ldots,K} ~\bigcup ~\big\{B_k^{\text{fun}}\big\}_{k=1,\ldots,K} \end{align*} $$
giving us $2K$
parameters to estimate. Note that it is not necessary to include function bases
$2K$
parameters to estimate. Note that it is not necessary to include function bases $B_k^{\text {fun}}$
in a piecewise model. In this case, there are
$B_k^{\text {fun}}$
in a piecewise model. In this case, there are $K-1$
parameters to estimate (excluding the reference level).
$K-1$
parameters to estimate (excluding the reference level).
One common piecewise model is the continuous piecewise linear model. Here, the $B_k^{\text {fun}}$
consist exclusively of linear functions of x. Constraints are placed on
$B_k^{\text {fun}}$
consist exclusively of linear functions of x. Constraints are placed on $f(x)$
to require it to be continuous at each interval boundary
$f(x)$
to require it to be continuous at each interval boundary $\xi _k$
.Reference Hastie, Tibshirani and Friedman
36
This constraint, which forces the limit of the function at each
$\xi _k$
.Reference Hastie, Tibshirani and Friedman
36
This constraint, which forces the limit of the function at each $\xi _k$
to exist and be equal to its value at
$\xi _k$
to exist and be equal to its value at $\xi _k$
(i.e.,
$\xi _k$
(i.e., $f(\xi _k^-)=f(\xi _k)=f(\xi _k^+)$
), removes parameters from the model by requiring them to be equal. For example, for
$f(\xi _k^-)=f(\xi _k)=f(\xi _k^+)$
), removes parameters from the model by requiring them to be equal. For example, for $K=3$
, the equality constraint around
$K=3$
, the equality constraint around $\xi _1$
gives us
$\xi _1$
gives us $\beta _1^{\text {int}} + \xi _1\beta _1^{\text {fun}} =\beta _2^{\text {int}} + \xi _1\beta _2^{\text {fun}} $
, reducing the number of parameters to estimate by two.
$\beta _1^{\text {int}} + \xi _1\beta _1^{\text {fun}} =\beta _2^{\text {int}} + \xi _1\beta _2^{\text {fun}} $
, reducing the number of parameters to estimate by two.
A.3 Splines
Longitudinal spline models fit a curve over outcome y around fixed points (knots) over time x. These provide a series of low-order polynomial bases fit to the outcome. This method is very flexible, allowing for a wide range of shapes to be estimated.Reference Hastie, Tibshirani and Friedman 36 Spline methods are implemented in the base R package splines.
To fit a spline model for a trajectory $f(x)$
, one must assume that it can be represented by a linear combination of spline bases with both a fixed degree d and knot sequence.Reference Perperoglou, Sauerbrei, Abrahamowicz and Schmid
5
One can then express
$f(x)$
, one must assume that it can be represented by a linear combination of spline bases with both a fixed degree d and knot sequence.Reference Perperoglou, Sauerbrei, Abrahamowicz and Schmid
5
One can then express $f(x)$
as
$f(x)$
as
 $$ \begin{align*} f(x) = \sum_{k=1}^{K+d+1}\beta_k\mathbf{B}_k(x) \end{align*} $$
with $\mathbf {B}_k(x)$
defined as the kth element of the basis set
$\mathbf {B}_k(x)$
defined as the kth element of the basis set $\mathbf {B}$
as above on the vector space V;
$\mathbf {B}$
as above on the vector space V; $\beta _k$
as the associated spline coefficient for
$\beta _k$
as the associated spline coefficient for $\mathbf {B}_k(x)$
; and K as the total number of knots. A simple basis spline model such as this leads to
$\mathbf {B}_k(x)$
; and K as the total number of knots. A simple basis spline model such as this leads to $d+k+1$
free parameters to estimate. Spline models with
$d+k+1$
free parameters to estimate. Spline models with $d=1$
(linear splines) fit straight lines between the knots. Models with
$d=1$
(linear splines) fit straight lines between the knots. Models with $d=3$
(cubic splines) are the standard in flexible modeling as they produce curves which appear smooth to the human eye while limiting the total number of parameters to be estimated.Reference Perperoglou, Sauerbrei, Abrahamowicz and Schmid
5
$d=3$
(cubic splines) are the standard in flexible modeling as they produce curves which appear smooth to the human eye while limiting the total number of parameters to be estimated.Reference Perperoglou, Sauerbrei, Abrahamowicz and Schmid
5
The main advantage of spline models is that they simplify the complex non-linear estimation of $f(x)$
to a much simpler linear estimation of coefficients
$f(x)$
to a much simpler linear estimation of coefficients $\beta _k$
. This lends itself naturally to regression using least-square or ML estimation. However, the necessity of user-defined tuning parameters (degree, knot locations, and number of knots) induces some level of subjectivity to the modeling process.Reference Harrell
37
A general rule-of-thumb is to place knots along x with a large amount of data or in locations where one expects
$\beta _k$
. This lends itself naturally to regression using least-square or ML estimation. However, the necessity of user-defined tuning parameters (degree, knot locations, and number of knots) induces some level of subjectivity to the modeling process.Reference Harrell
37
A general rule-of-thumb is to place knots along x with a large amount of data or in locations where one expects $f(x)$
to change rapidly. Subject-level knowledge is therefore useful when determining knot locations.
$f(x)$
to change rapidly. Subject-level knowledge is therefore useful when determining knot locations.
There are many different types of statistical splines. Examples include B-splines and natural splines. It can be shown that the regression spline models described above are a specific category of continuous piecewise functions.Reference Hastie, Tibshirani and Friedman
36
In this case, the constraints that the overall trajectory $f(t)$
as well as its first and second derivatives are continuous over the range of x are added. In general, an order-m spline model with knots at
$f(t)$
as well as its first and second derivatives are continuous over the range of x are added. In general, an order-m spline model with knots at $\xi _1,\ldots ,\xi _K$
belongs to the family of piecewise polynomial models of order m.Reference Hastie, Tibshirani and Friedman
36
$\xi _1,\ldots ,\xi _K$
belongs to the family of piecewise polynomial models of order m.Reference Hastie, Tibshirani and Friedman
36
A.4 Fractional polynomial models
FP models are based on a variable selection algorithm pulled from a limited set of power transformations of x.Reference Royston and Altman 38 This method was motivated by the ad hoc approaches of early applied statisticians and uses variable selection procedures to determine the best-fitting trajectory.Reference Royston and Sauerbrei 33 , Reference Tukey 39 Variable selection in FP models is outlined in detail by Royston and Sauerbrei.Reference Royston and Sauerbrei 33 This method has been implemented in the R package mfp.Reference Ambler and Benner 40
An FP transformation of $x>0$
is defined as
$x>0$
is defined as $x^p$
with p chosen from the set S of powers
$x^p$
with p chosen from the set S of powers $S=\{-2,-1,-0.5,0,0.5,1,2,3\}$
, where
$S=\{-2,-1,-0.5,0,0.5,1,2,3\}$
, where $x^p=\text {log}(x)$
for
$x^p=\text {log}(x)$
for $p=0$
, by convention. An FPm model (that is, an FP model of degree m) consists of a basis set
$p=0$
, by convention. An FPm model (that is, an FP model of degree m) consists of a basis set $\mathbf {B}(x)$
of m FP transformations. These are iteratively defined as
$\mathbf {B}(x)$
of m FP transformations. These are iteratively defined as
 $$ \begin{align*} f_j(x) = \left \{ \begin{array}{ll} x^{p_j} & \text{ if } p_j \neq p_{j-1} \\ f_{j-1}(x)~log(x) & \text{ else}, \end{array} \right. \end{align*} $$
where the basis set is based on $j=1,\ldots ,m$
beginning with
$j=1,\ldots ,m$
beginning with $f_0(x)=1$
and
$f_0(x)=1$
and $p_0 = 0$
. The most commonly used degrees of FP models are 1 and 2.Reference Royston, Ambler and Sauerbrei
2
Higher degrees allow for more flexible modeling (i.e., reducing bias in the fitted trajectory), but this comes at the cost of increased model variance, lower parsimony, and increased computational requirements.
$p_0 = 0$
. The most commonly used degrees of FP models are 1 and 2.Reference Royston, Ambler and Sauerbrei
2
Higher degrees allow for more flexible modeling (i.e., reducing bias in the fitted trajectory), but this comes at the cost of increased model variance, lower parsimony, and increased computational requirements.
In general, FP models are relatively easy to fit and require little user input. They have the ability to estimate a wide range of trajectory shapes.Reference Royston and Sauerbrei 33 However, they are limited to strictly positive values of x. Timepoints with inherent zeros (e.g., the start of an event) or negative values (e.g., time before or after the event) cannot be used without adjustments. One may add some constant positive value (e.g., the minimum observed value plus one) to correct for this, but this choice is arbitrary. Further, the multiple tests involved in variable selection can lead to overfitting.Reference Ambler and Royston 41 Insufficient power to detect a non-linear trend may also arise from the variable selection procedure, particularly for small sample sizes.Reference Royston and Sauerbrei 33 Similar to other polynomial regression models, the behavior of the estimated trajectory at the tails of x is sensitive to the final transformations selected.Reference Ramsay and Silverman 34
A.5 Local polynomial regression
Local polynomial regression is a non-parametric regression method which is used to fit smooth curves.Reference Ramsay and Silverman
34
It can be seen as an extension of the moving average and polynomial regression, where low-order polynomials are fit in the local neighborhood of each data point. This method, as opposed to the others summarized above, does not output basis expansion $\mathbf {B}(x)$
for use in other regression models, per se. Instead, it estimates flexible trajectories using a weighted regression approach.
$\mathbf {B}(x)$
for use in other regression models, per se. Instead, it estimates flexible trajectories using a weighted regression approach.
First, a standard linear model is assumed
 $$ \begin{align*} f(x_i) = g(x_i)+\epsilon_i, \end{align*} $$
where $f(x_i)$
,
$f(x_i)$
, $i=1,\ldots ,n$
, is the outcome of interest at
$i=1,\ldots ,n$
, is the outcome of interest at $x_i$
,
$x_i$
, $g(\cdot )$
is an unknown function, and
$g(\cdot )$
is an unknown function, and $\epsilon _i$
is an error term.
$\epsilon _i$
is an error term.
The method below can be generalized to the multivariable case, but, for illustrative purposes, suppose there is a single numeric predictor x.Reference Chambers and Hastie
42
Consider smoothing parameter $\alpha>0$
. As the user-defined value of
$\alpha>0$
. As the user-defined value of $\alpha $
increases, the final fitted trajectory becomes smoother. This parameter defines a window around each data point whereby the fitted curve is weighted such that points nearer to its centre are given more weight than those farther away.Reference Chambers and Hastie
42
For
$\alpha $
increases, the final fitted trajectory becomes smoother. This parameter defines a window around each data point whereby the fitted curve is weighted such that points nearer to its centre are given more weight than those farther away.Reference Chambers and Hastie
42
For $\alpha \leq 1$
, the neighborhood weight function at point
$\alpha \leq 1$
, the neighborhood weight function at point $(x_i,y_i)$
is
$(x_i,y_i)$
is
 $$ \begin{align*} w_i(x_i,y_i)=\begin{cases} w\big(\Delta_i(x),\Delta_{(q)}(x)\big),&\alpha\leq1\\ w\big(\Delta_i(x),\Delta_{(n)}(x)\alpha\big),&\alpha>1, \end{cases} \end{align*} $$
where w is some pre-determined weighting function, $\Delta _i(x)=|x-x_i|$
,
$\Delta _i(x)=|x-x_i|$
, $\Delta _{(i)}(x)$
is its
$\Delta _{(i)}(x)$
is its $i^{\text {th}}$
value ordered from smallest to largest along
$i^{\text {th}}$
value ordered from smallest to largest along $i=1,\ldots ,n$
. A commonly-used weighting function is the tri-cube weight:
$i=1,\ldots ,n$
. A commonly-used weighting function is the tri-cube weight:
 $$ \begin{align*} w(a,b)=\begin{cases} \big(1-(a/b)^3\big)^3,&0\leq a<b \\ 0,&a\geq b. \end{cases} \end{align*} $$
The fitted trajectory is then estimated through weighted least-squares regression, with the neighborhood weights used as the model weights. The user can decide on which degree of polynomial, m, to fit at each data point. Typically, the highest order considered is a quadratic fit ( $m=2$
).
$m=2$
).
B Appendix. Full search terms for meta-epidemiological review
See Table 4.
Ovid MEDLINE search terms

C Appendix. Reasons for exclusion at the second stage ( $N=73$
)
$N=73$
)

-
1. Incorrect publication type (
$N=54$
).-
• Study is a letter to the editor, conference abstract, conference presentation, protocol, textbook chapter, or other publication which is not a scientific journal article.
-
-
2. No flexible meta-regression (
$N=7$
).-
• Study does not use at least one flexible meta-regression method.
-
-
3. Incorrect scientific or clinical context (
$N=5$
).-
• Study is not a biomedical study of human health.
-
• Study is an in-vitro study.
-
• Study is a brain scan study.
-
• Study is solely methodological in nature and does not conduct a real-world data analysis.
-
-
4. No meta-analysis (
$N=3$
).-
• Study was a systematic review but did not include a quantitative meta-analysis.
-
-
5. Study withdrawn (
$N=2$
).-
• Study was withdrawn.
-
-
6. Study did not use real-world data (
$N=1$
).-
• Study employed only simulated or artificial data
-
-
7. Not a systematic review (
$N=1$
).-
• Study defined itself as a rapid or scoping review rather than a complete systematic review.
-
• Study is a pooled analysis of pre-existing datasets not derived from a search.
-
• Study is a meta-analysis of studies but studies were selected non-systematically.
-
• Study was an analysis from a data consortium.
-


 Open access

