


Introduction
King George Island is the largest of the South Shetland Islands, situated in northern Antarctic Peninsula (Fig. 1). Because of the relative ease of access and generally low alteration grade compared with other areas in the Antarctic Peninsula region, the geology of the island has been subject to numerous investigations over the past several decades. This has resulted in a complicated stratigraphy that has been supported by a large number of isotopic ages, mainly determined by the K-Ar method (see summary of published ages by Leat & Riley Reference Leat, Riley, Smellie, Panter and Geyer2021a). However, there is evidence for Ar loss and K-metasomatism and the validity of many of the ages is debatable (cf. Dupre Reference Dupre1982, Birkenmajer et al. Reference Birkenmajer1990, Soliani & Bonhomme Reference Soliani and Bonhomme1994, Shiling et al. Reference Shiling, Xiangshen, Molan and Birkenmajer1996, Smellie et al. Reference Smellie, Millar, Rex and Butterworth1998, Willan & Kelley Reference Willan and Kelley1999, Kraus 2005, Pańczyk et al. Reference Pańczyk, Nawrocki and Williams2009, Nawrocki et al. Reference Nawrocki, Pańczyk and Williams2010, Reference Nawrocki, Pańczyk and Williams2011, Haase et al. Reference Haase, Beier, Fretzdorff, Smellie and Garbe-Schönberg2012). King George Island is renowned for its terrestrial, Palaeogene-Early Miocene, high-latitude palaeoenvironmental record, preserved in sedimentary strata (e.g. Zastawniak Reference Zastawniak1981, Zastawniak et al. Reference Zastawniak, Wrona, Gaździcki and Birkenmajer1985, Birkenmajer & Zastawniak Reference Birkenmajer and Zastawniak1989, Cao Reference Cao, Yoshida, Kaminuma and Shiraishi1992, 1994, Dutra & Batten Reference Dutra and Batten2000, Poole et al. Reference Poole, Hunt and Cantrill2001, Hunt & Poole Reference Hunt and Poole2003, Fontes & Dutra Reference Fontes and Dutra2010, Cantrill & Poole Reference Cantrill and Poole2012, Mozer Reference Mozer2012, Reference Mozer2013, Warny et al. Reference Warny, Kymes, Askin, Krajewski and Tatur2019). It is an important location for understanding the environmental evolution of Antarctica and up to four glacial episodes have been postulated. However, the validity of one has been criticized (Dingle & Lavelle Reference Dingle and Lavelle1998, Troedson & Smellie Reference Troedson and Smellie2002) and a precise correlation with global isotope zones (sensu Miller et al. Reference Miller, Wright and Fairbanks1991) remains uncertain (Troedson & Riding Reference Troedson and Riding2002, Troedson & Smellie Reference Troedson and Smellie2002). A fuller understanding of Antarctica's environmental history is reliant on having a well-defined stratigraphy linked to a well-constrained chronology. As a result of our study, it is clear that many aspects of the stratigraphy and chronology of King George Island are questionable and require substantial revision.
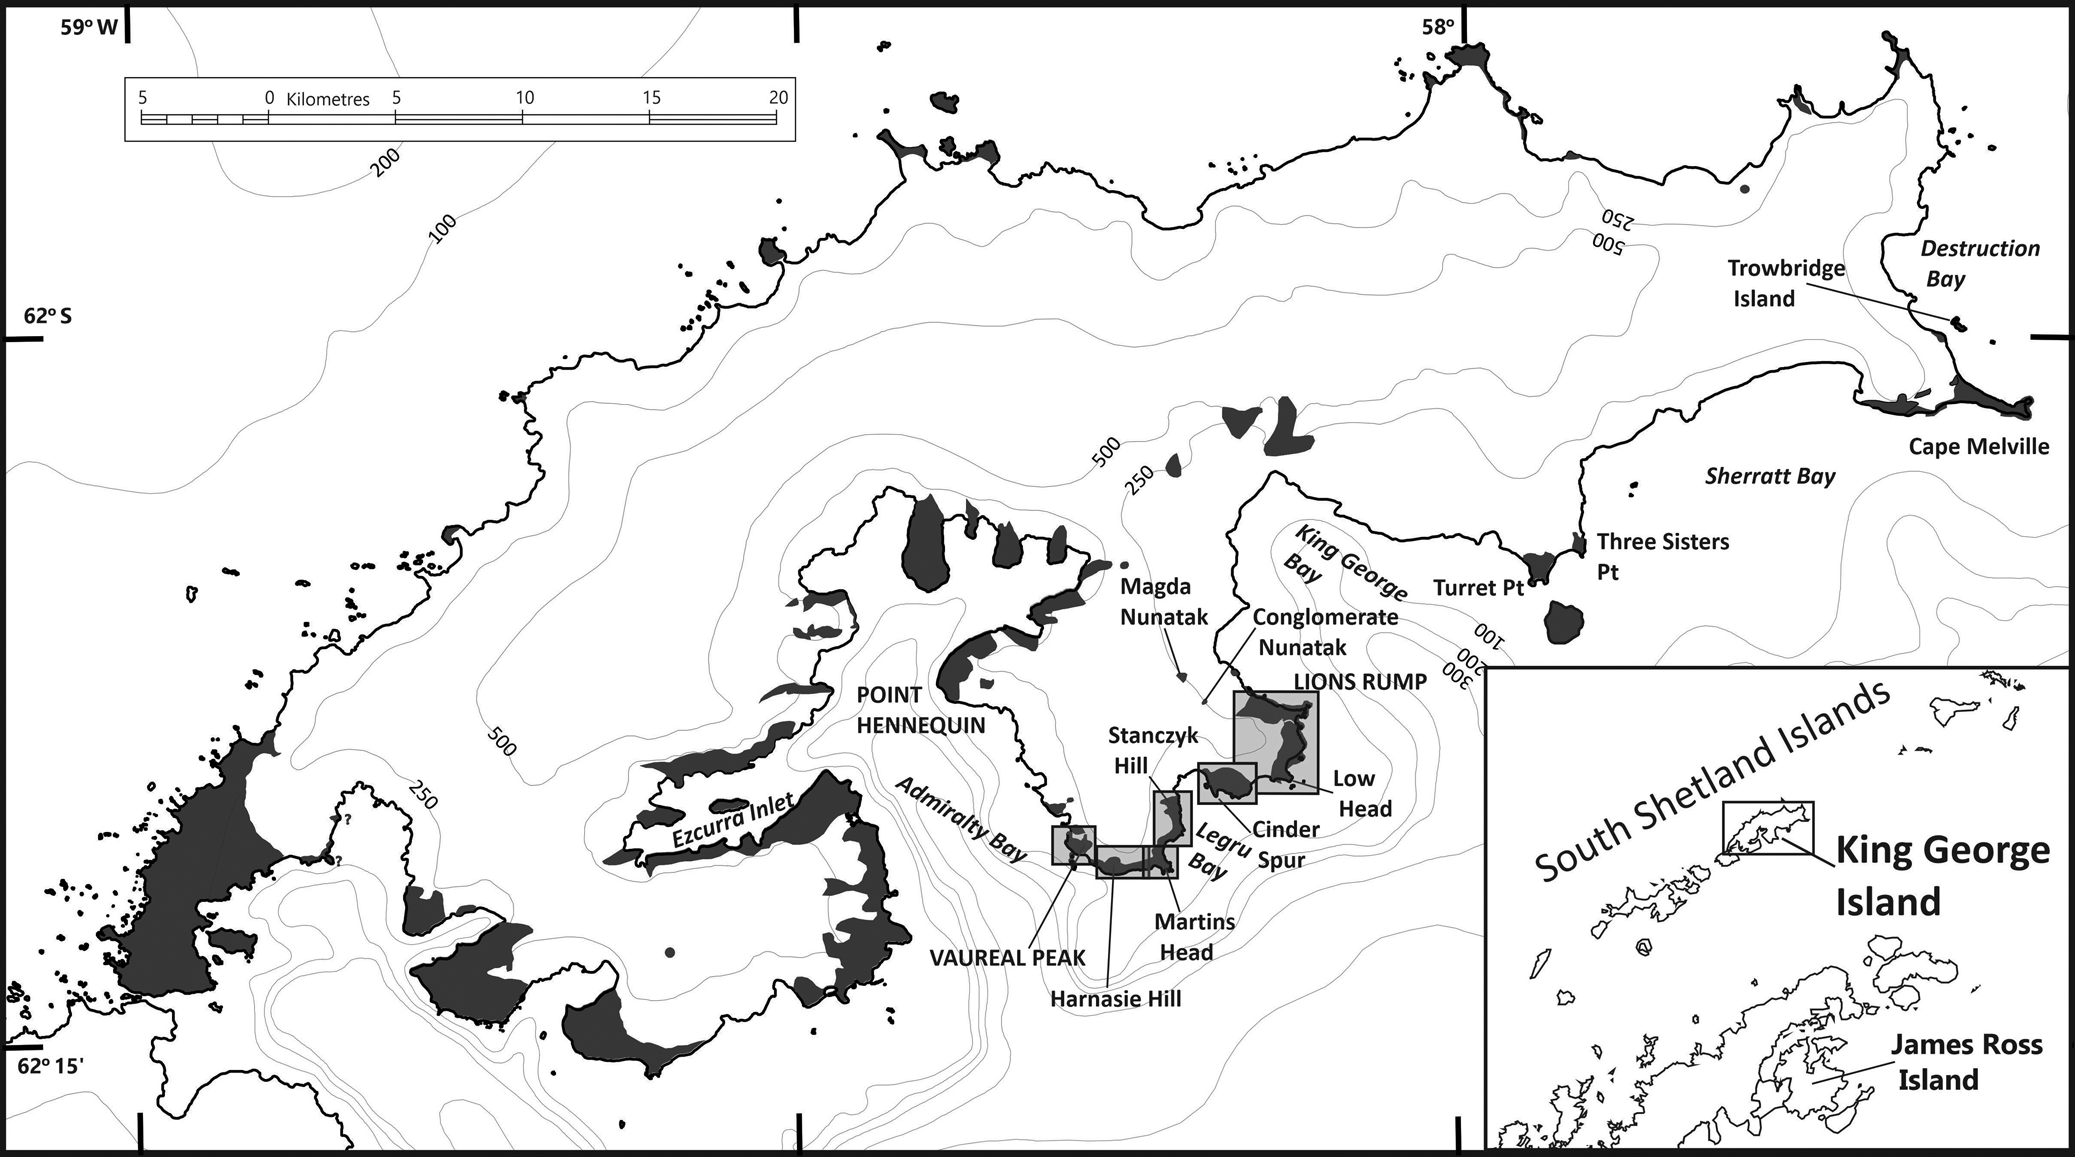
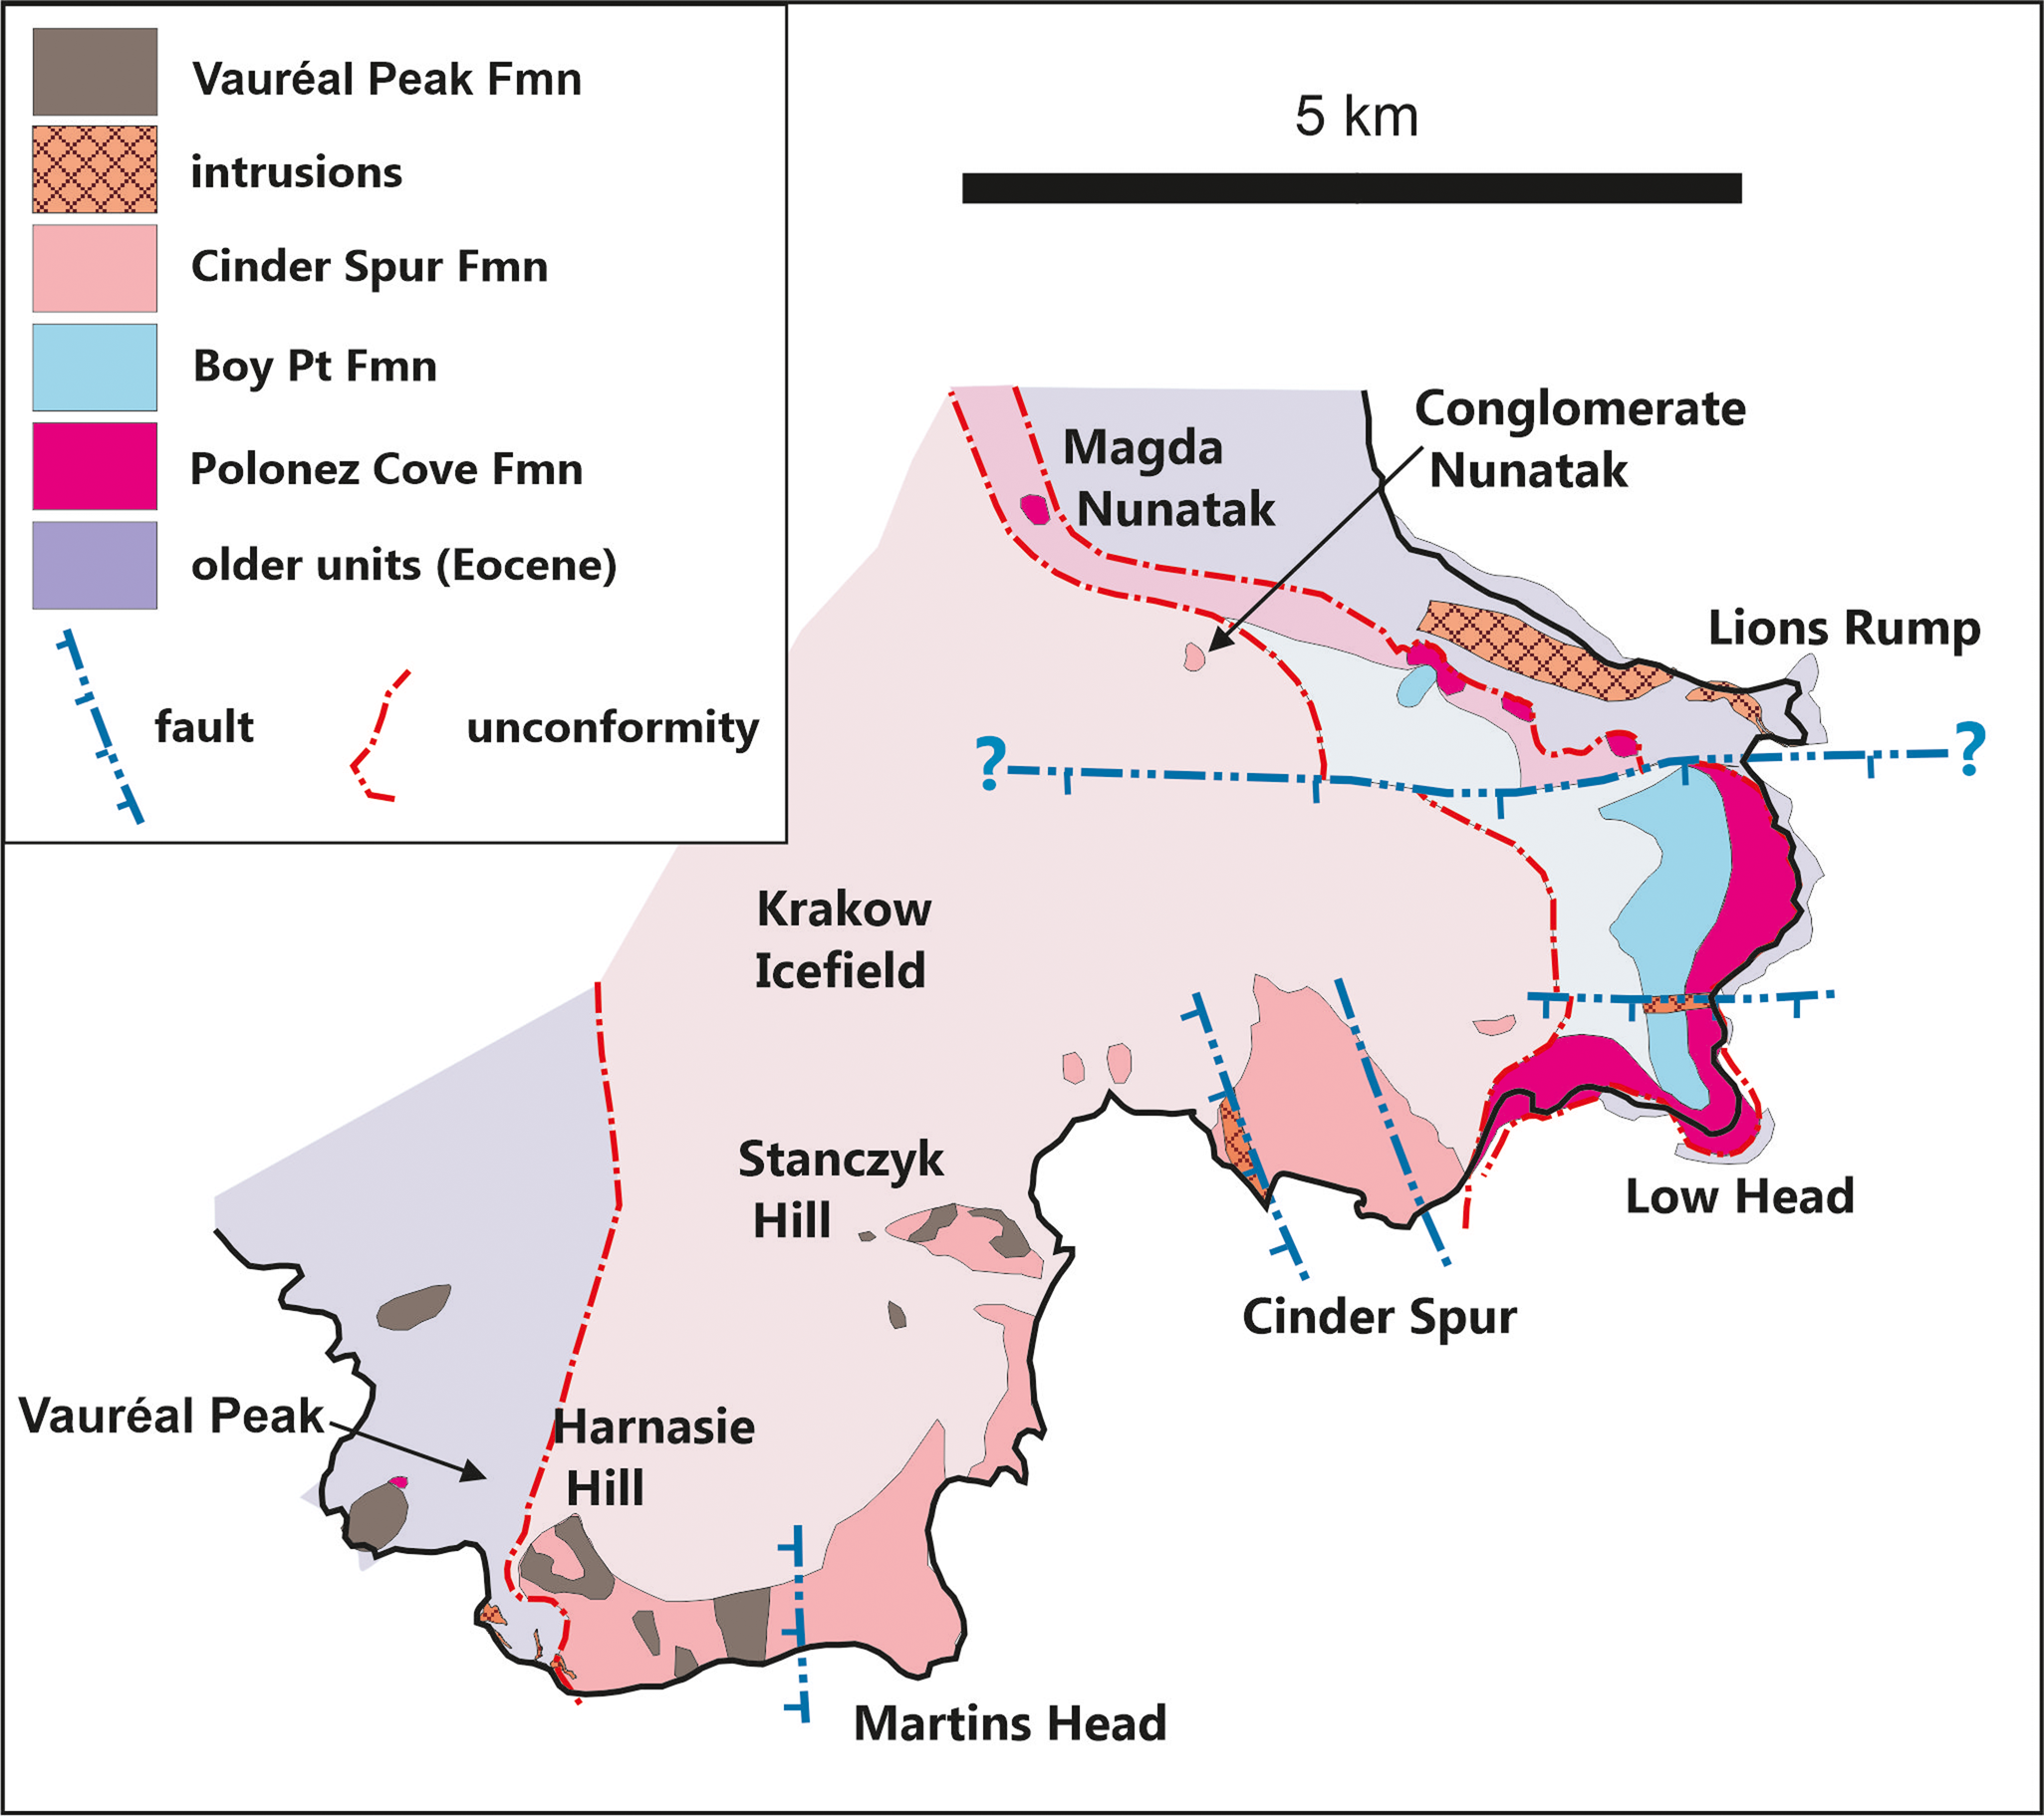
Map of King George Island, showing the distribution of rock outcrops and the areas included in this study (shaded boxes). The inset shows the location of the South Shetland Islands (including King George Island) in the northern Antarctic Peninsula region.
The islands are largely constructed of the products of arc volcanism, mainly lavas and clastic rocks with fewer small outcrops of coeval plutons (e.g. Smellie et al. Reference Smellie, Pankhurst, Thomson and Davies1984, Shen Reference Shen and Shen1994, Dutra & Batten Reference Dutra and Batten2000, Birkenmajer Reference Birkenmajer2001 and references therein, Mozer Reference Mozer2012, Reference Mozer2013). The volcanism is dominated by basalt to andesite lavas with island arc tholeiite to calc-alkaline compositions (Smellie et al. Reference Smellie, Pankhurst, Thomson and Davies1984, Birkenmajer et al. Reference Birkenmajer and Francalanci1991a, Machado et al. Reference Machado, Chemale, Conceição, Kawaskita, Morata, Oteíza and van Schmus2005, Haase et al. Reference Haase, Beier, Fretzdorff, Smellie and Garbe-Schönberg2012, Leat & Riley Reference Leat, Riley, Smellie, Panter and Geyer2021b). It apparently proceeded in a series of volcanic ‘flare-ups’ (sensu Paterson & Ducea Reference Paterson and Ducea2015) with peaks at c. 130–110, 90–70, 60–40 and 30–20 Ma (Willan & Kelley Reference Willan and Kelley1999, Fretzdorff et al. Reference Fretzdorff, Worthington, Haase, Hekinian, Franz, Keller and Stoffers2004, Haase et al. Reference Haase, Beier, Fretzdorff, Smellie and Garbe-Schönberg2012, Smellie Reference Smellie and Kleinschmidt2020, Leat & Riley Reference Leat, Riley, Smellie, Panter and Geyer2021a). The main axis of active arc volcanism also migrated in a north-easterly or, more likely, south-easterly direction (Pankhurst & Smellie Reference Pankhurst and Smellie1983, Nawrocki et al. Reference Nawrocki, Pańczyk, Wójcik and Kozłowska-Roman2021a, Smellie Reference Smellie, Smellie, Panter and Geyer2021a), which resulted in the youngest volcanic rocks, of Oligocene and Early Miocene age, being confined to eastern King George Island. Rocks of comparable age are very scarce elsewhere in Antarctica (e.g. Hannah et al. Reference Hannah, Florindo, Harwood and Fielding2001). The King George Island strata contain evidence for several glaciations, inferred to be variably of local to regional (pan-Antarctic) extent, together with several interglacials, some of which may have included alpine glaciers (Birkenmajer Reference Birkenmajer1990, Birkenmajer et al. Reference Birkenmajer, Gaździcki and Krajewski2005). However, recent dating studies, mainly by the 40Ar/39Ar method, have challenged the validity of several of the glacial and interglacial episodes (e.g. Nawrocki et al. Reference Nawrocki, Pańczyk and Williams2011, Smellie et al. Reference Smellie, Hunt, McIntosh and Esser2021). Moreover, apart from Cape Melville and the area between Lions Rump and Low Head (Fig. 1), previous mapping on eastern King George Island has been only at a reconnaissance level (cf. Birkenmajer Reference Birkenmajer1982, Smellie et al. Reference Smellie, Pankhurst, Thomson and Davies1984, Troedson & Riding Reference Troedson and Riding2002, Troedson & Smellie Reference Troedson and Smellie2002). The type sections for the palaeoenvironmentally important Polonez Cove and Cape Melville formations are well studied, but at least ten additional formations are currently recognized (Table I; e.g. Birkenmajer Reference Birkenmajer1980, Reference Birkenmajer1982, Reference Birkenmajer1987, Reference Birkenmajer1995b, Birkenmajer & Weiser Reference Birkenmajer and Weiser1985, Porebski & Gradzinski Reference Porębski and Gradziński1987, Reference Porębski and Gradziński1990, Birkenmajer & Butkiewicz Reference Birkenmajer and Butkiewicz1988, Troedson & Riding Reference Troedson and Riding2002, Troedson & Smellie Reference Troedson and Smellie2002).
Stratigraphy of eastern King George Island (after Birkenmajer Reference Birkenmajer1982).
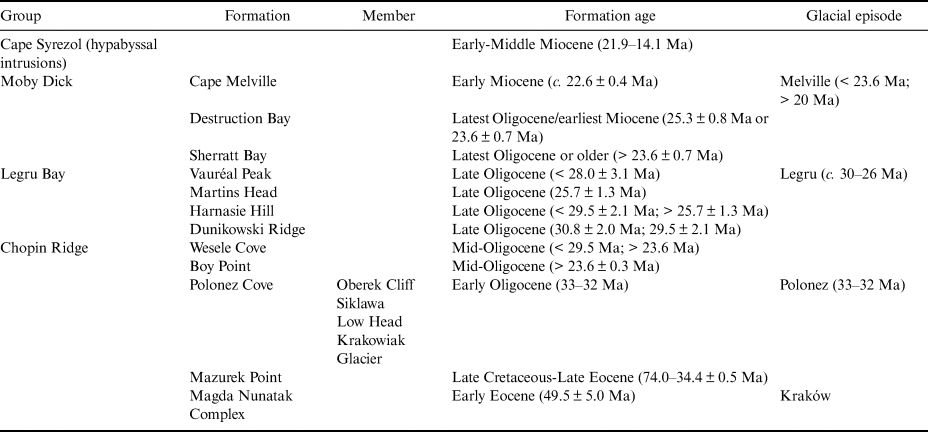
Note: All ages are by K-Ar except for the Polonez Cove Formation, which is palaeontological.
The principal focus of this paper is a description of the lithostratigraphy of Oligocene sedimentary and associated volcanic sequences on eastern King George Island and to present the strata within an improved chronological framework supported by new 40Ar/39Ar isotopic ages. Together with the revised lithostratigraphy, the new ages significantly expand our understanding of the chronology of Cenozoic glacial episodes in Antarctica and enable an improved correlation with global climate events (e.g. Hunt & Poole Reference Hunt and Poole2003, Francis et al. Reference Francis, Ashworth, Cantrill, Crame, Howe, Stephens, Cooper, Barrett, Stagg, Storey, Stump and Wise2008, Cantrill & Poole Reference Cantrill and Poole2012).
Methods
Fieldwork was undertaken on King George Island on 12 January–16 March 1996, 19 January–3 March 1999, 9–18 February 2014 and for 4 weeks in January–February 2019. Detailed mapping, largely on a bed-by-bed basis, was directly onto 1:10,000-scale Falkland Islands Dependencies Aerial Survey Expedition (FIDASE; 1958) and HMS Endurance (1979) air photographs provided by the British Antarctic Survey. Although the maps of the studied localities included in this paper show the solid geology, maps based on the distribution of actual rock exposure are also included for comparison (Supplemental Information S1). Rock samples were taken for petrography, whole-rock geochemistry and 40Ar/39Ar isotopic dating. A total of 200 thin sections were examined. The isotopic dating was carried out at the New Mexico Geochronology Research Laboratory and at Leeds University (methods described in Supplemental Information S2). All samples are archived in the British Antarctic Survey Geological Specimens Collection, Cambridge, England. Full details of the dating results are also included in Supplemental Information S2.
Stratigraphy
Previous geological studies of eastern King George Island established a relatively complicated stratigraphy involving numerous formations ranging in age between the Late Cretaceous and Early Miocene (Table I). The Oligocene formations rest unconformably on a local ‘basement’ composed of andesite lavas, which provide a maximum age for the strata. Previously thought to extend back to the Late Cretaceous (74 Ma; Birkenmajer & Gaździcki Reference Birkenmajer and Gaździcki1986), the basement lavas are now known to be Middle Eocene (c. 45 Ma; Smellie et al. Reference Smellie, Pankhurst, Thomson and Davies1984, Pańczyk & Nawrocki Reference Pańczyk and Nawrocki2011, Smellie et al. Reference Smellie, Hunt, McIntosh and Esser2021). Numerous Oligocene formations have been defined (Table I). Most are volcanic, but they include the mainly sedimentary (glacial-marine) Polonez Cove Formation, which is the oldest Oligocene geological unit recognized. Isotopic dating, by the K-Ar method, suggested a range of ages for the Oligocene strata between c. 33 and < 25.7 Ma (Birkenmajer Reference Birkenmajer1989). Several of the ages are either simply maxima or minima and some conflict with the observed order of succession. Moreover, the inferred palaeontological age of the highly fossiliferous Polonez Cove Formation (c. 33–32 Ma) is older than the age determined by 87Sr/86Sr isotopic dating of shelly fossils (29.8 ± 0.6 Ma; Dingle et al. Reference Dingle, McArthur and Vroon1997, Dingle & Lavelle Reference Dingle and Lavelle1998), although recent unpublished 87Sr/86Sr isotopic studies may have narrowed the age gap (K. Krajewski, cited by Warny et al. Reference Warny, Kymes, Askin, Krajewski and Tatur2019). However, the Polonez Cove Formation is characterized by abundant reworked older fossils, and it has been difficult to determine a reliable palaeontological age (see discussion by Birkenmajer Reference Birkenmajer2001, and below). Moreover, the shelly fossils dated by the 87Sr/86Sr method showed poor preservation, and any ages must be treated with caution (acknowledged by Dingle et al. Reference Dingle, McArthur and Vroon1997). Taken together with suspicion of Ar loss and K-metasomatism affecting the published K-Ar ages, the Oligocene-Miocene chronology is poorly established and the ages of all the formations require verification.
Magda Nunatak Complex (abandoned stratigraphical unit)
Magda Nunatak Complex is the name used for an association of lava, lava breccia ('hyaloclastite') and fossiliferous marine sedimentary strata that crop out only at Magda Nunatak in eastern King George Island (Fig. 1). Despite an early prescient study, which attributed the sedimentary rocks to the Polonez Cove Formation, but without citing supporting evidence (Tokarski et al. Reference Tokarski, Paolo and Rubinowski1981), the capping lava was correlated with the supposedly long-lived (Late Cretaceous-Oligocene) Mazurek Point Formation (Birkenmajer Reference Birkenmajer1982). Subsequent K-Ar dating of the capping lava yielded an Eocene age (49.5 ± 5 Ma), thus apparently confirming the correlation, and the age was used to suggest the existence of an Eocene glacial episode called the Kraków Glaciation (Birkenmajer et al. Reference Birkenmajer, Delitala, Narębski, Nicoletti and Petrucciani1986). However, 87Sr/86Sr dating of shelly material in the Magda Nunatak sediments yielded an age of 28.5 ± 0.64 Ma (Dingle & Lavelle Reference Dingle and Lavelle1998). Although 87Sr/86Sr ages are determined with reference to the Cenozoic seawater 87Sr/86Sr curve and are therefore subject to variable errors depending on the slope of that curve (for methodology, see McArthur et al. Reference McArthur, Howarth and Bailey2001), the 87Sr/86Sr ages obtained at Magda Nunatak make an Eocene age for the sequence unlikely. Moreover, Troedson & Smellie (Reference Troedson and Smellie2002) pointed to the strong lithological similarity with the Polonez Cove Formation and provided a preliminary 40Ar/39Ar age (lacking supporting data) slightly younger than the Sr age. Here we re-emphasize the remarkable similarity in lithofacies between the two outcrops, which is essentially on a bed-by-bed basis (Fig. 2; cf. Troedson & Smellie Reference Troedson and Smellie2002). Together with a new 40Ar/39Ar age reported here (see later), all doubt is removed that the Eocene age for the Magda Nunatak Complex is incorrect and it is indistinguishable from the Polonez Cove Formation, with which it is unequivocally correlated. Thus, there is no justification for retaining the Magda Nunatak Complex name for the outcrop and it is suggested that it should be removed from the stratigraphical lexicon.
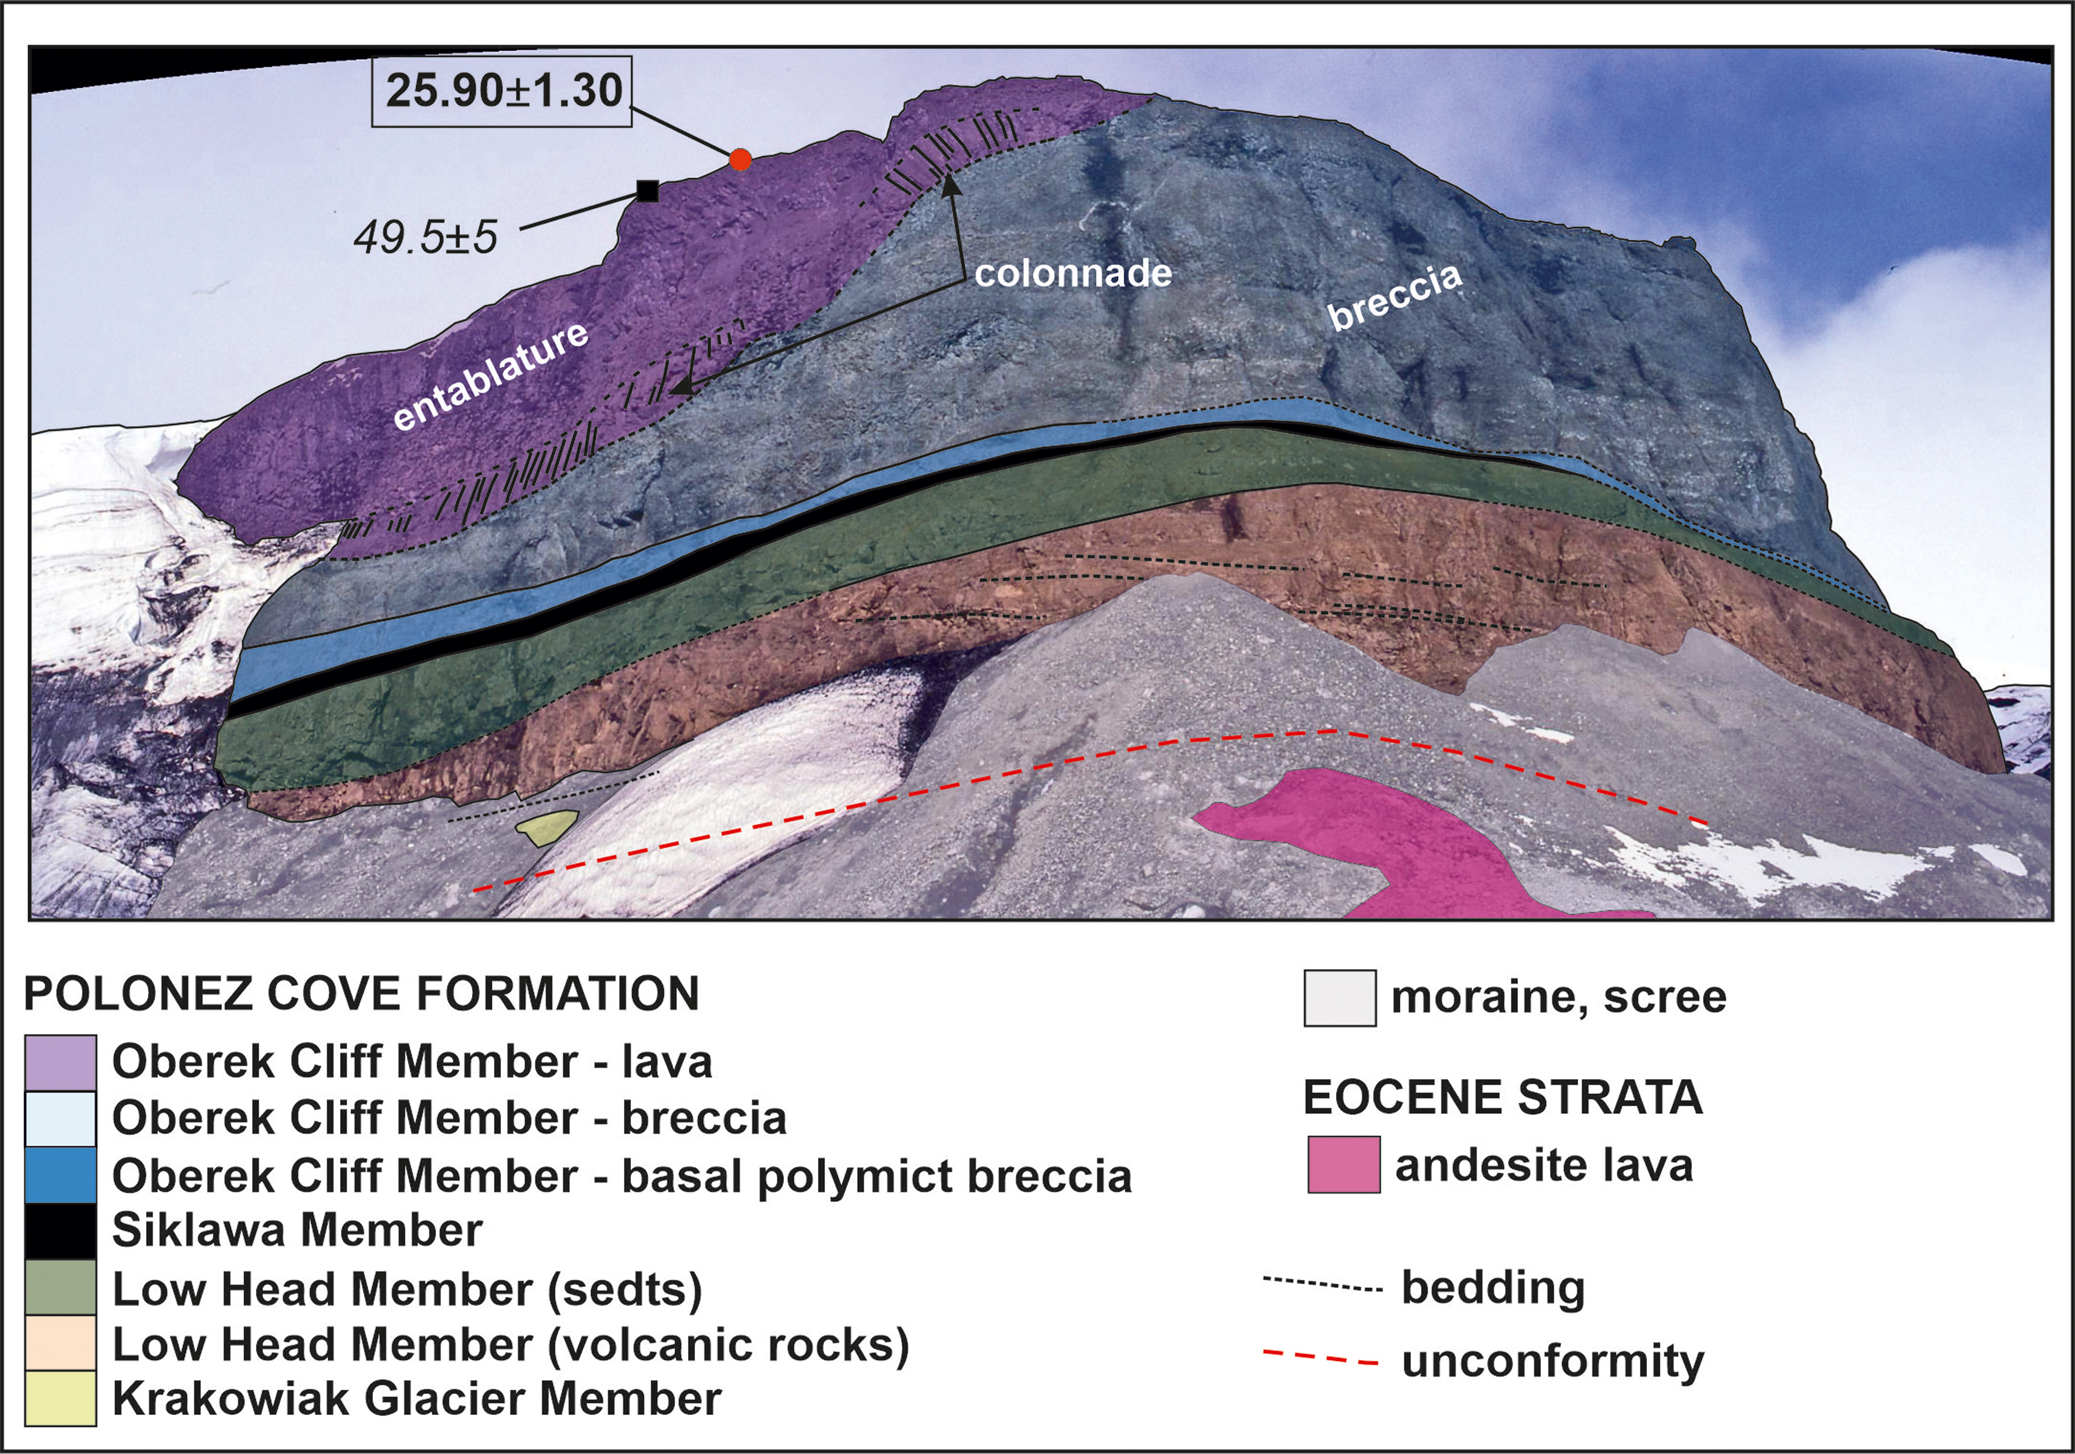
View of Magda Nunatak, looking west, with the geology indicated. There is a remarkable and conspicuous similarity with the internal stratigraphy of the Polonez Cove Formation, exposed just 3 km to the south-east, and with which the outcrop is now correlated. An outcrop of the Bayview Member is also present within the sequence, out of sight at right, and a tiny outlier of the Chlamys Ledge Member occurs at the summit (also out of sight; Troedson & Smellie Reference Troedson and Smellie2002). The locations of the two dated samples shown are approximate. The rock face is c. 60 m high (estimated).
Hervé Cove tillite (name not recommended)
Additional evidence for Eocene ice conditions on King George Island was cited by Birkenmajer et al. (Reference Birkenmajer, Gaździcki and Krajewski2005), who suggested that a volcanic diamictite with supposedly exotic erratics on the south coast of Ezcurra Inlet (Fig. 1) was also a glacial deposit (tillite). With an inferred age of c. 45–41 Ma (by K-Ar), overlapping within the error of the K-Ar age for the Magda Nunatak Complex, the deposit was called the Hervé Cove tillite, and it was believed to be associated with volcanoes with ice-capped summits. The age of the deposit was subsequently shown to be c. 49 Ma (by 40Ar/39Ar and U-Pb dating; Nawrocki et al. Reference Nawrocki, Pańczyk and Williams2011). However, alpine glaciers are unlikely to be a source of exotic (i.e. non-local) erratics. The erratic lithologies were not described, but volcanic diamictites similar in lithofacies to the ‘Hervé Cove tillite’ are common in Eocene sequences elsewhere on King George Island and lack exotic erratics (Smellie et al. Reference Smellie, Hunt, McIntosh and Esser2021). The evidence for glacial deposition and alpine glaciers on King George Island during the Eocene is thus currently unproven (Mozer Reference Mozer2013, Smellie et al. Reference Smellie, Hunt, McIntosh and Esser2021; see also Nawrocki et al. Reference Nawrocki, Pańczyk and Williams2011), and it is recommended that the use of the name ‘Hervé Cove tillite’ should be discontinued unless a glacial origin can be much better demonstrated.
Polonez Cove Formation
Because of its association with an important glacial episode (the Polonez Glaciation), the Polonez Cove Formation is one of the most intensively investigated geological units in the South Shetland Islands (e.g. Barton Reference Barton1965, Birkenmajer Reference Birkenmajer1980, Reference Birkenmajer1982, Reference Birkenmajer1987, Reference Birkenmajer1995a, Paolo & Tokarski 1982, Gazdzicki & Pugaczewska Reference Gaździcki and Pugaczewska1984, Birkenmajer & Wieser Reference Birkenmajer and Weiser1985, Porebski & Gradzinski Reference Porębski and Gradziński1987, Reference Porębski and Gradziński1990, dos Santos et al. Reference dos Santos, Rocha-Campos, Trompette, Uhlein, Gipp and Simões1990, Smellie & Rex Reference Smellie and Rex1993, Smellie et al. Reference Smellie, Millar, Rex and Butterworth1998, Troedson & Smellie Reference Troedson and Smellie2002, Quaglio et al. Reference Quaglio, Anelli, dos Santos, de Perinotto and Rocha-Campos2008, Reference Quaglio, Warren, Anelli, dos Santos, Rocha-Campos and Gaździcki2014, Nawrocki et al. Reference Nawrocki, Pańczyk, Wójcik and Tatur2021b). The formation is continuously exposed in a 2.0 km-long cliff section between Low Head and Lions Rump, but it also includes substantial outcrops at Godwin Cliffs and Magda Nunatak and small outliers at Vauréal Peak and Three Sisters Point (Figs 1–4). The maximum thickness of the formation varies from 58 m at Godwin Cliffs to 59 m at Mazurek Point and c. 63 m (estimated) at Magda Nunatak (Troedson & Smellie Reference Troedson and Smellie2002). It rests unconformably on an uneven surface eroded into andesite lavas of the Middle Eocene Hennequin Formation (also called the Mazurek Point Formation; Pańczyk & Nawrocki Reference Pańczyk and Nawrocki2011, Smellie et al. Reference Smellie, Hunt, McIntosh and Esser2021). The basal surface has a general relief of c. 15–20 m, with local hollows or channels up to 10 m deep (e.g. at Magda Nunatak and Mazurek Point). The lava is sometimes sheared and brecciated in the vicinity of the contact, with diamict injected into fractures between clasts (Birkenmajer Reference Birkenmajer1995a, Troedson & Smellie Reference Troedson and Smellie2002, and unpublished observations by the authors). Glacial striations and roche moutonée landforms have also been described at Three Sisters Point (Paulo & Tokarski Reference Paulo and Tokarski1982, Birkenmajer Reference Birkenmajer1995a). The boundary with the overlying Polonez Cove Formation was regarded as an angular unconformity by Birkenmajer (Reference Birkenmajer1995a). However, it is probably better regarded as a disconformity. The contact is planar and sub-horizontal. Despite the abundance of fossils in the Polonez Cove Formation, particularly in its type area, many have been recycled from older strata (see Supplemental Information S3 & S4). Even contemporary fossils have relatively long age ranges, and it has only proven possible to determine an imprecise Oligocene palaeontological age (Gazdzicki & Pugaczewska Reference Gaździcki and Pugaczewska1984, Gaździcka & Gaździcki Reference Gaździcka and Gaździcki1985, Birkenmajer & Gaździcki Reference Birkenmajer and Gaździcki1986, and see later discussion).
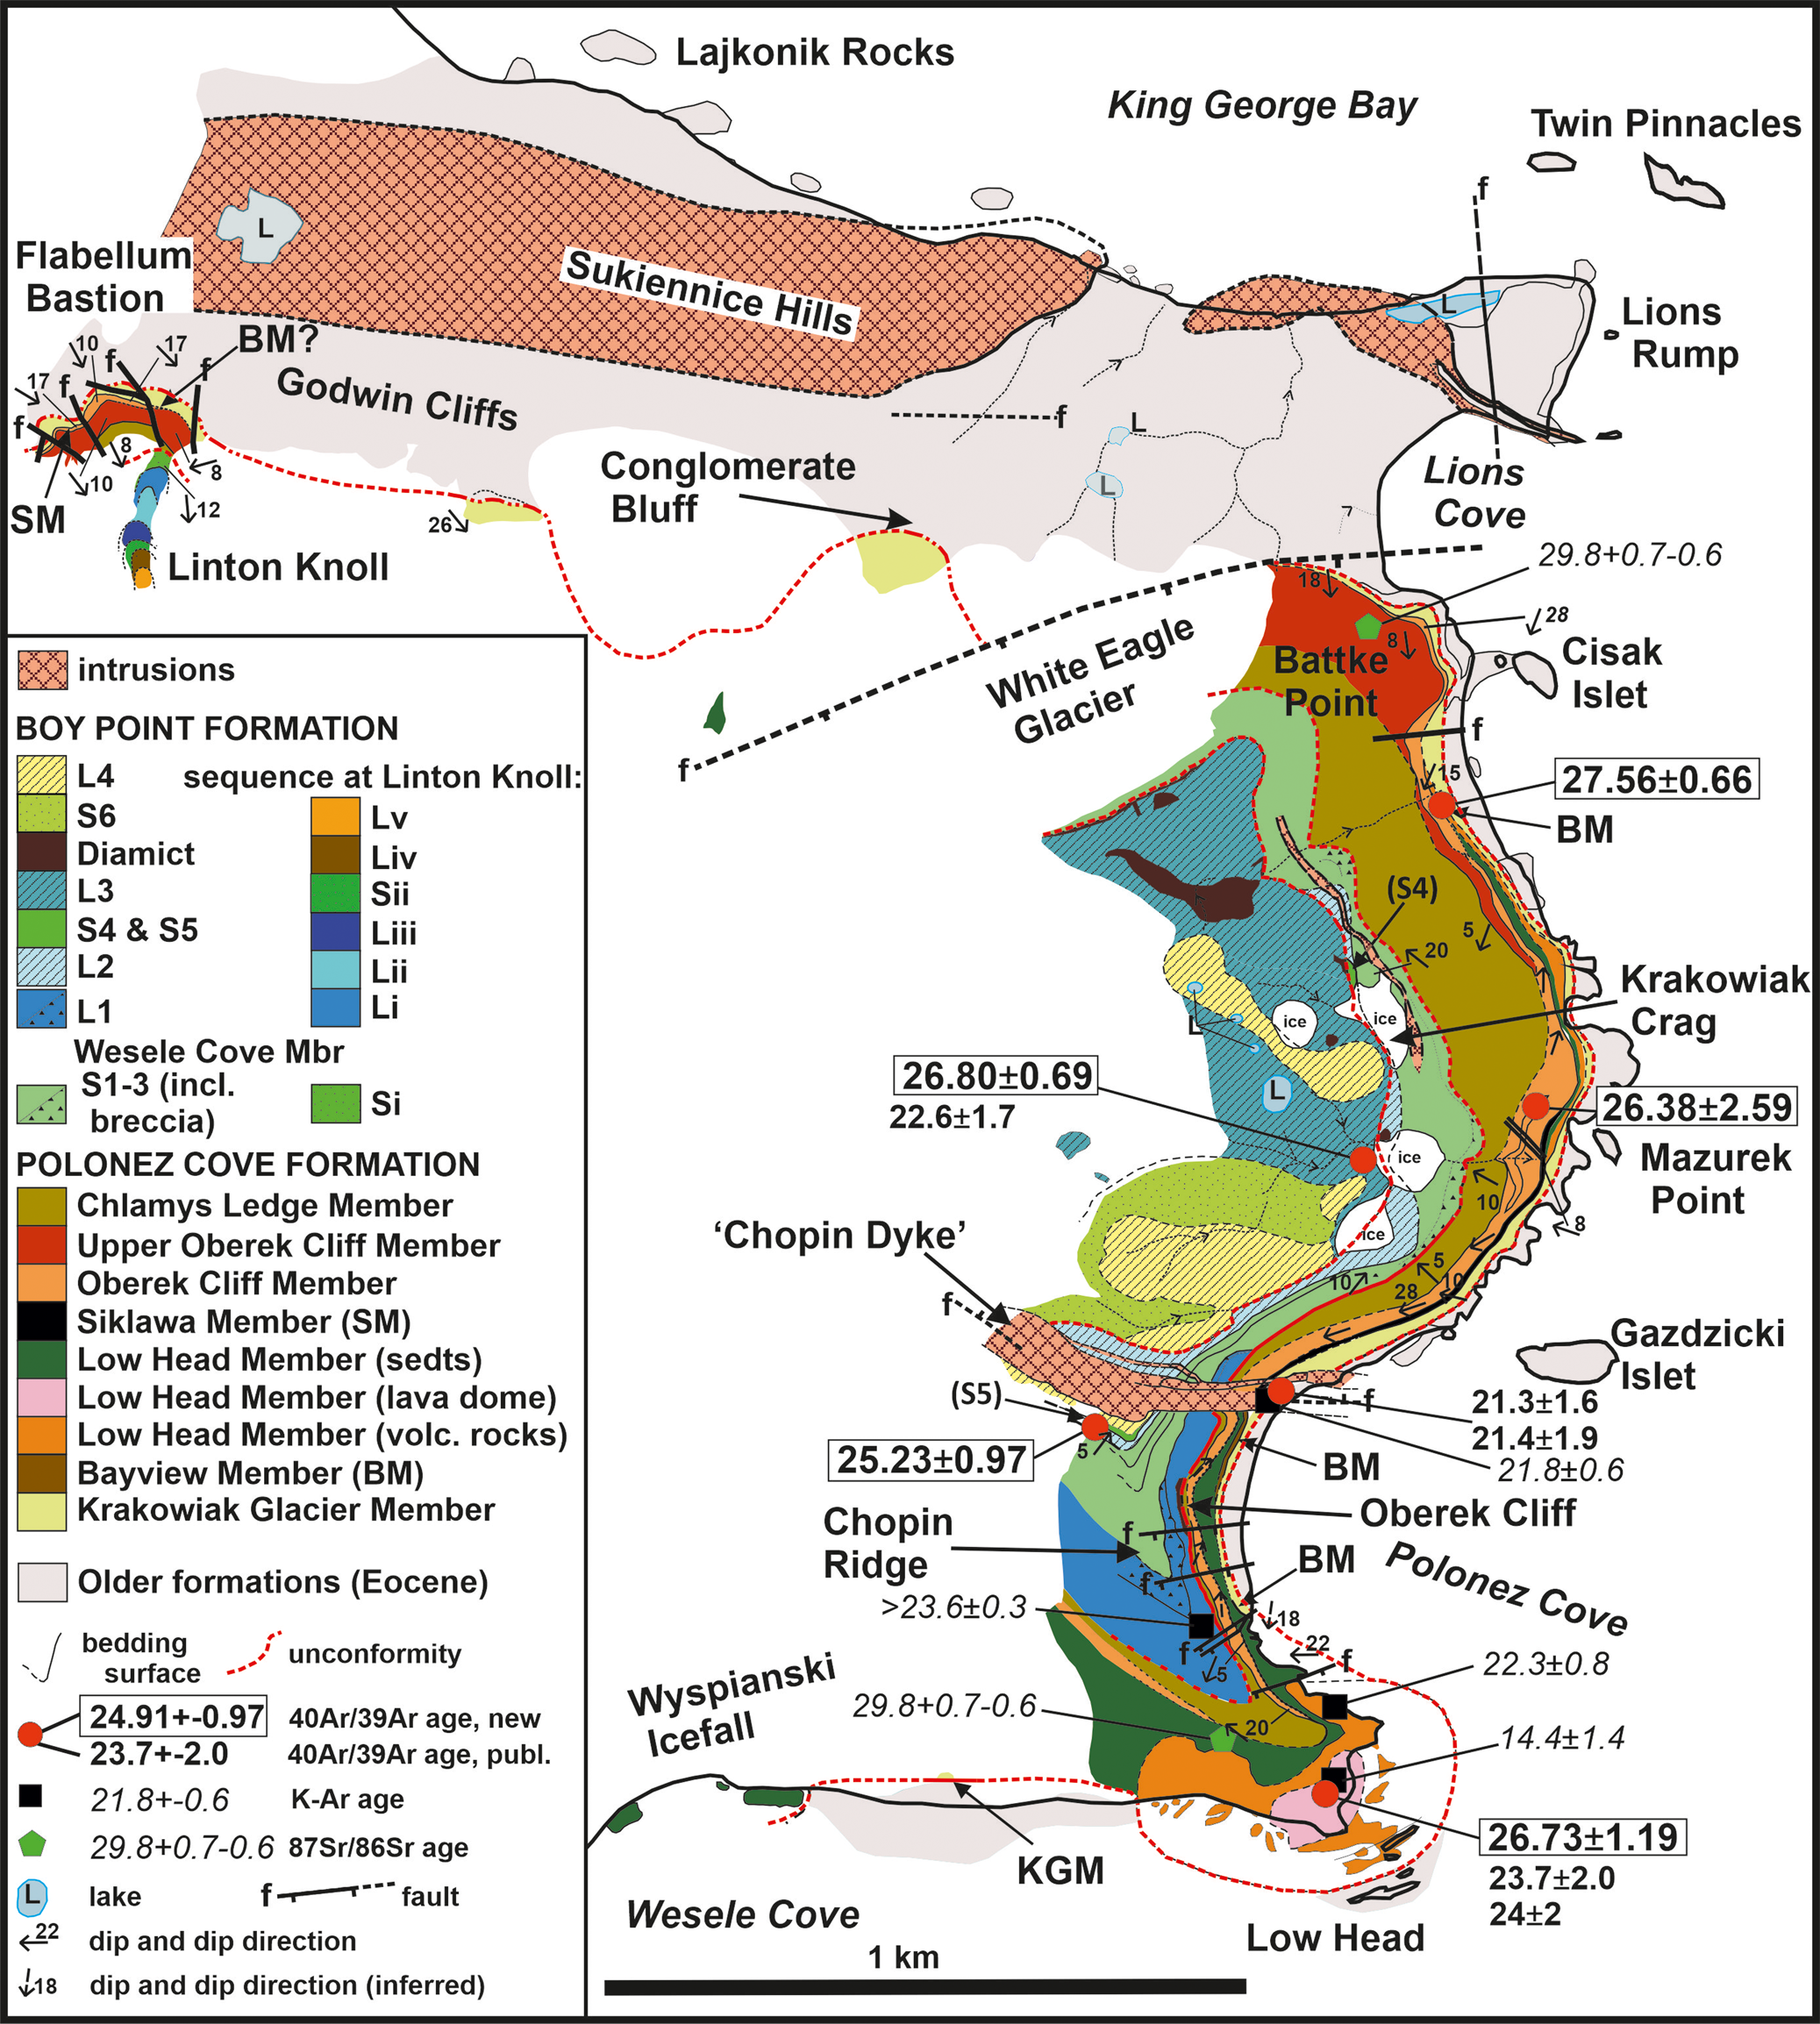
Geological map of the Low Head-Lions Rump-Godwin Cliffs area, eastern King George Island. The ‘upper Oberek Cliff Member’ depicted at Battke Point and Godwin Cliffs is a fossiliferous sandy-gravelly deposit (broadly comparable to subunit ‘OC3’ of Troedson & Smellie Reference Troedson and Smellie2002) with a remarkable resemblance to similarly fossiliferous sedimentary rocks of the Low Head Member (especially subunit ‘L2’ of Troedson & Smellie Reference Troedson and Smellie2002).
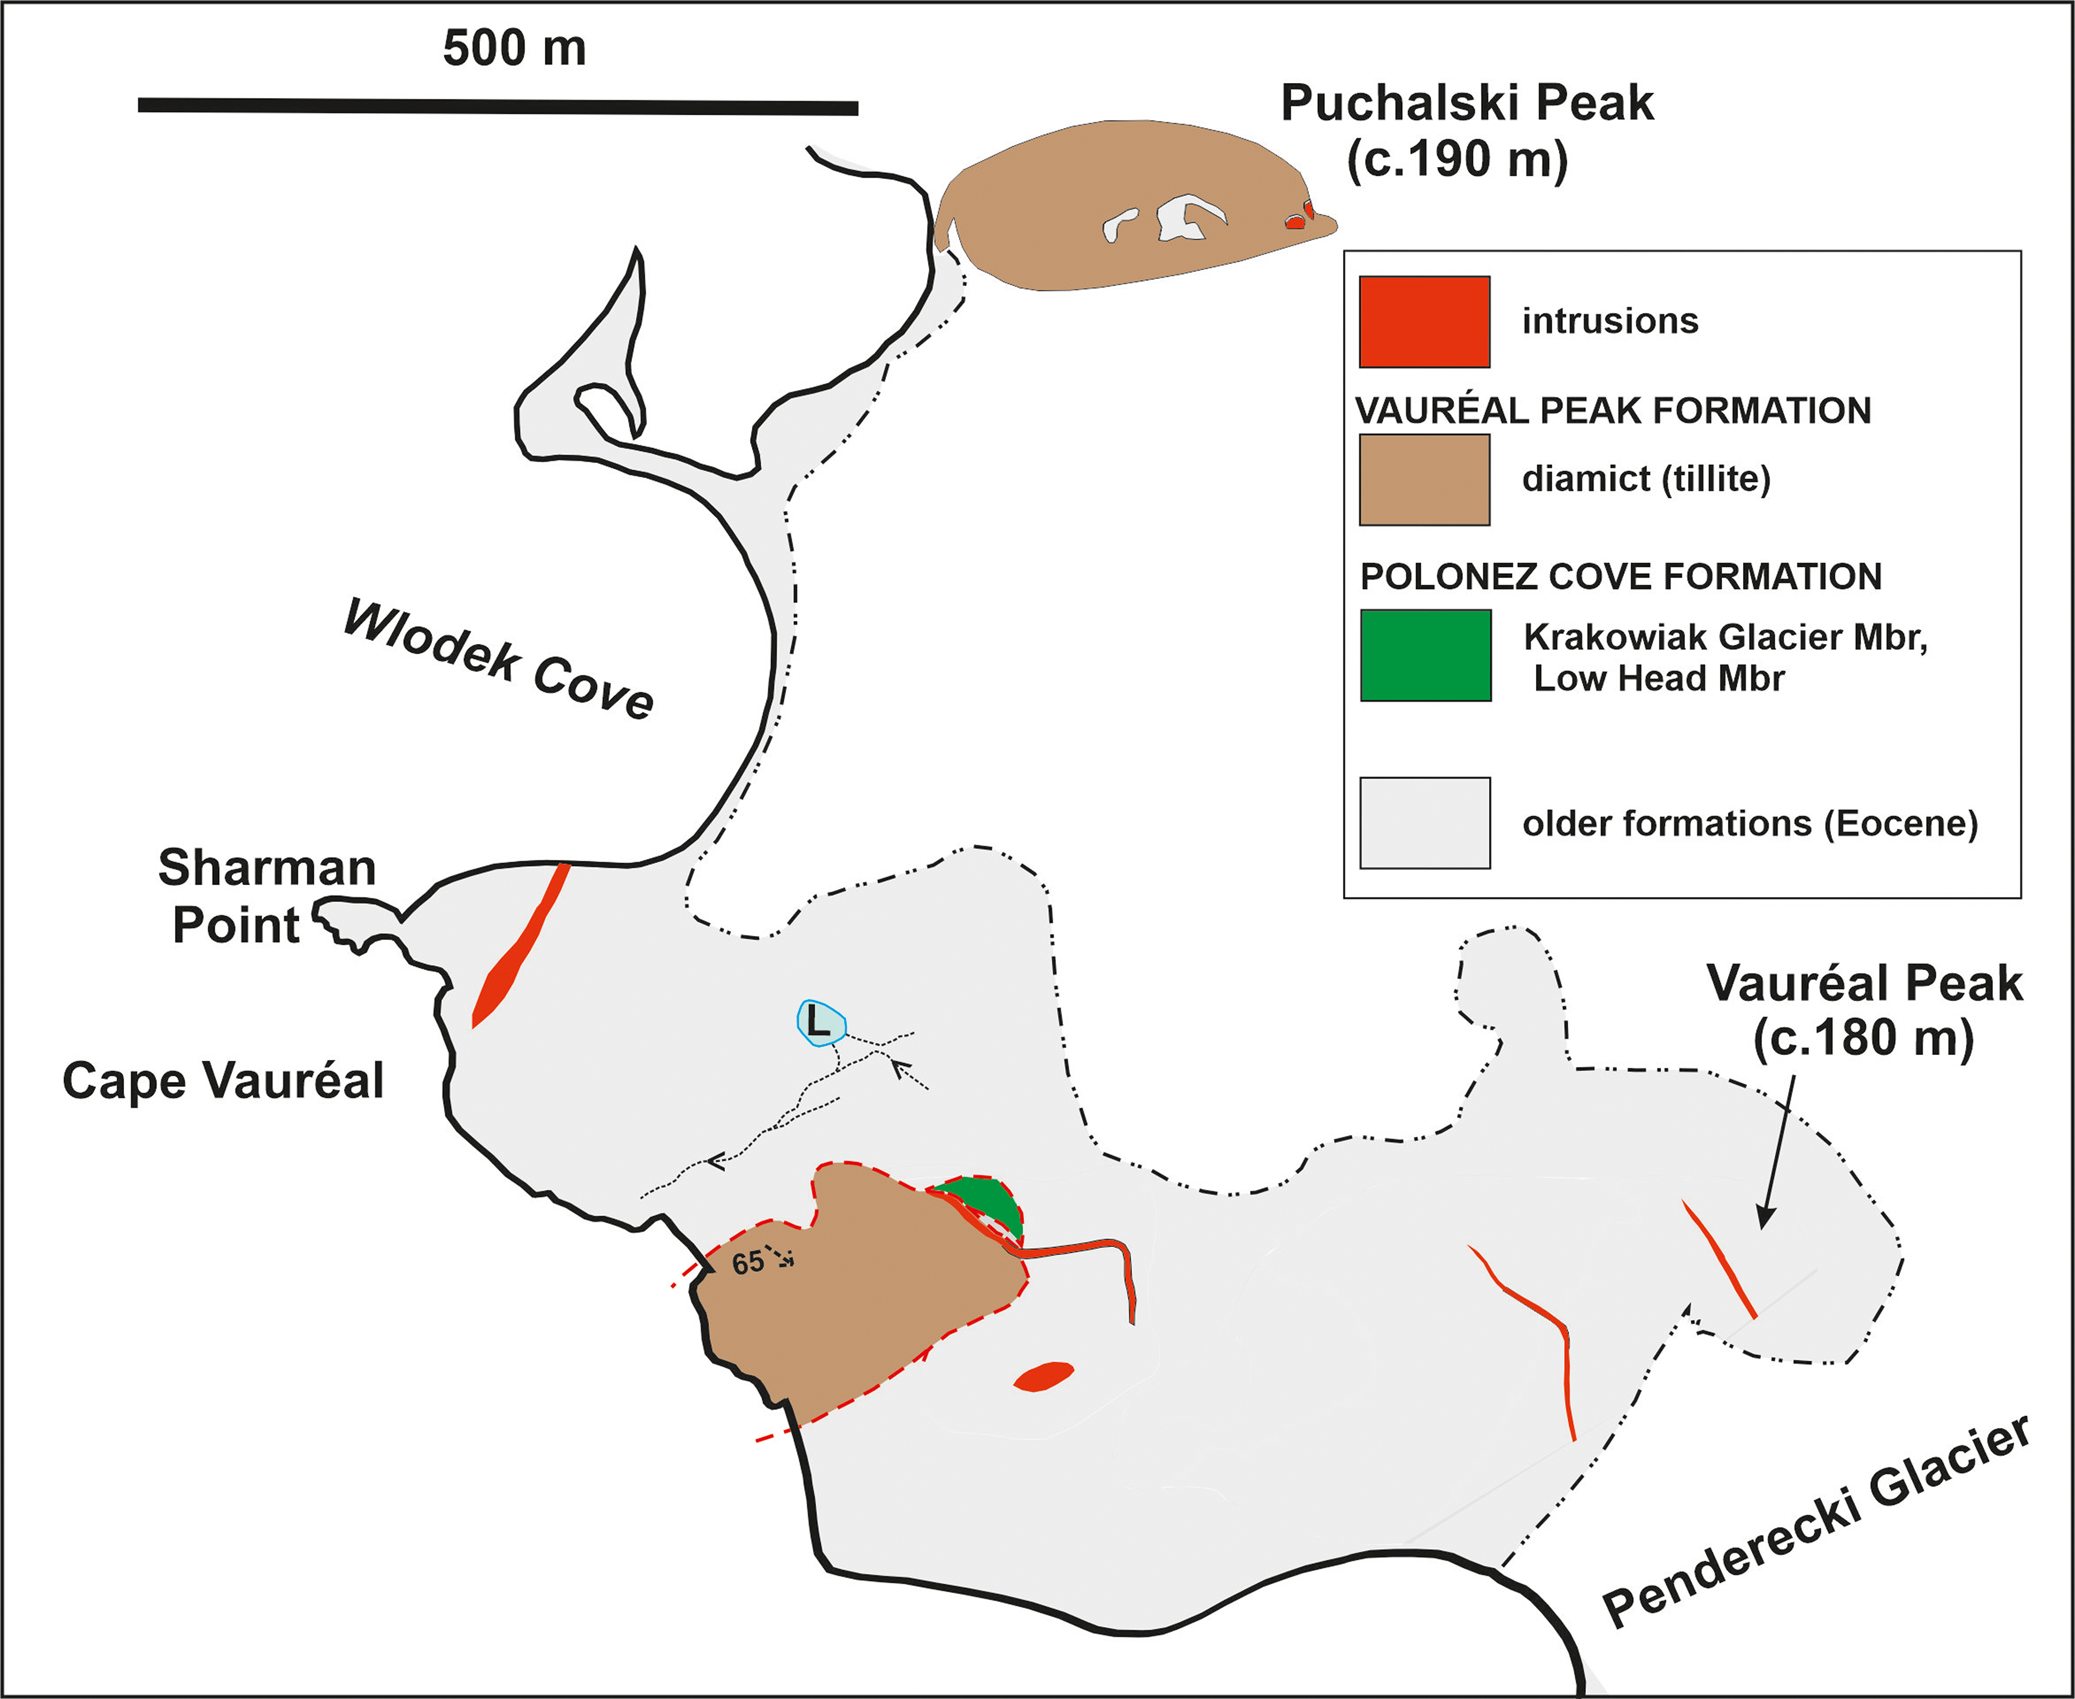
Geological map of the Vauréal Peak area, eastern King George Island. See Fig. 3 for explanation of additional symbols.
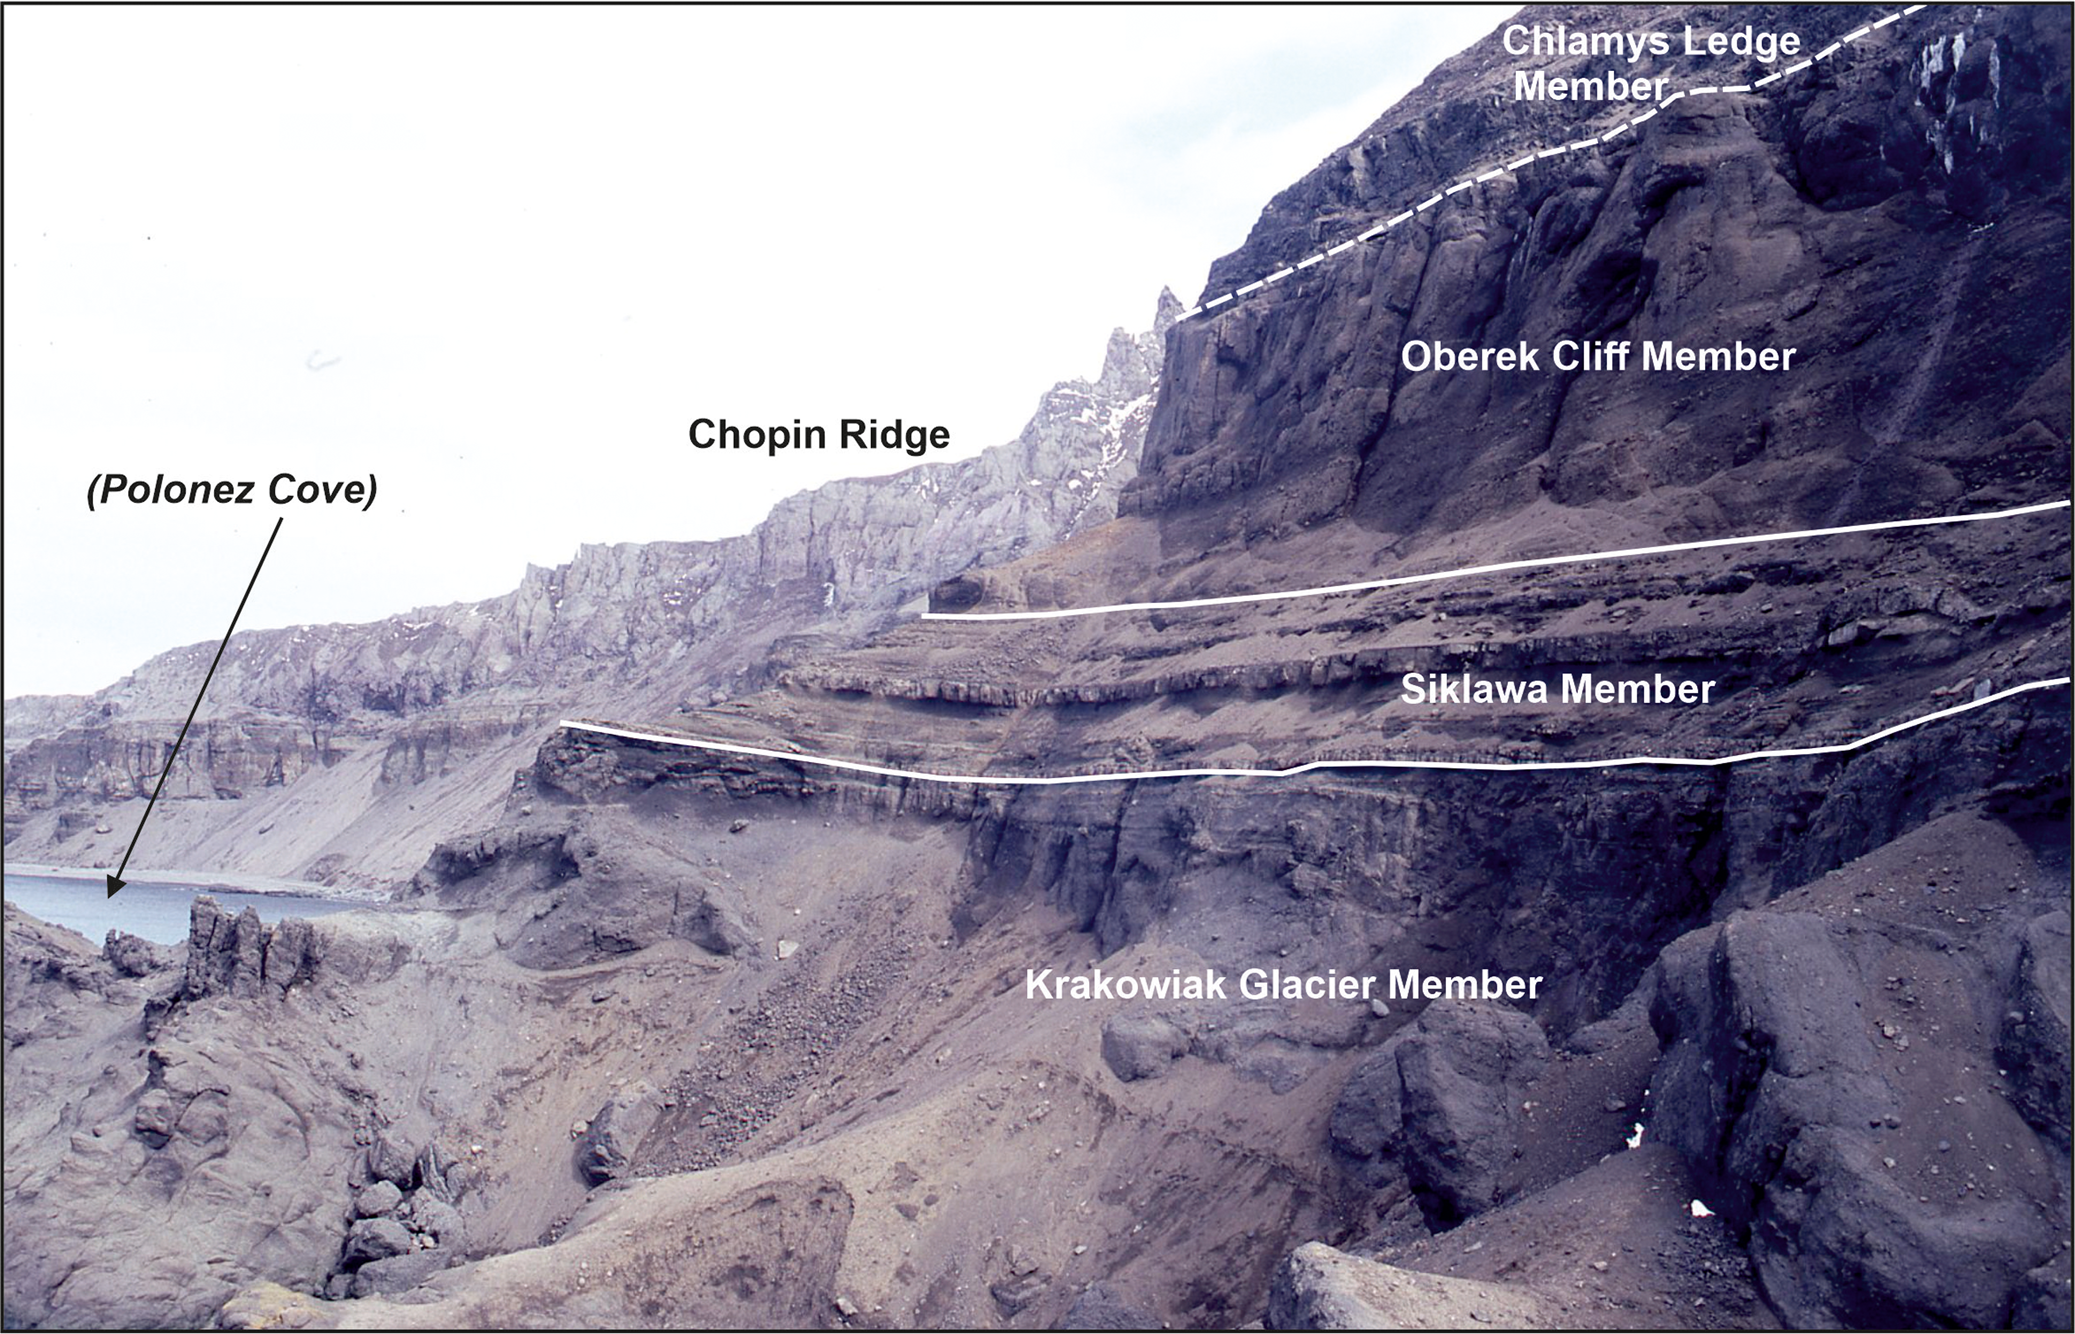
The most complete sections of the Polonez Cove Formation occur between Low Head and Lions Rump and at Magda Nunatak (Figs 1, 2 & 5). The formation has been divided into six members, with further division of the members into multiple subunits on a sedimentological basis (Figs 2 & 6; Troedson & Smellie Reference Troedson and Smellie2002; cf. Birkenmajer Reference Birkenmajer1982, Porebski & Gradzinski Reference Porębski and Gradziński1987). The earliest-formed deposit is the diamictite-dominated Krakowiak Glacier Member (Fig. 7a). It contains basal lenses of lodgement tillite but is largely formed of debris flow deposits and minor sandstones laid down in an ice-front environment and from icebergs. It is spectacularly polymict, with abundant erratics derived from the South Shetland Islands, Antarctic Peninsula and East Antarctica (Birkenmajer & Wieser Reference Birkenmajer and Weiser1985, Troedson & Smellie Reference Troedson and Smellie2002). Multiple sources probably situated in the southern Antarctic Peninsula, Haag Nunataks, Ellsworth Mountains, Transantarctic Mountains and, speculatively, Gamburtsev Mountains were demonstrated by Nawrocki et al. (Reference Nawrocki, Pańczyk, Wójcik and Tatur2021b) on the basis of U-Pb isotopic ages of zircons obtained from a small selection of the erratics. The distal provenance of many erratics led Birkenmajer & Weiser (Reference Birkenmajer and Weiser1985) to suggest an association with a grounded pan-Antarctic regional ice sheet, but Troedson & Smellie (Reference Troedson and Smellie2002) suggested that the distal erratics were probably reworked (i.e. dropped by far-travelled icebergs, at least some of which were sourced in East Antarctica, and subsequently reincorporated in marine-based ice sourced locally in the South Shetland Islands).
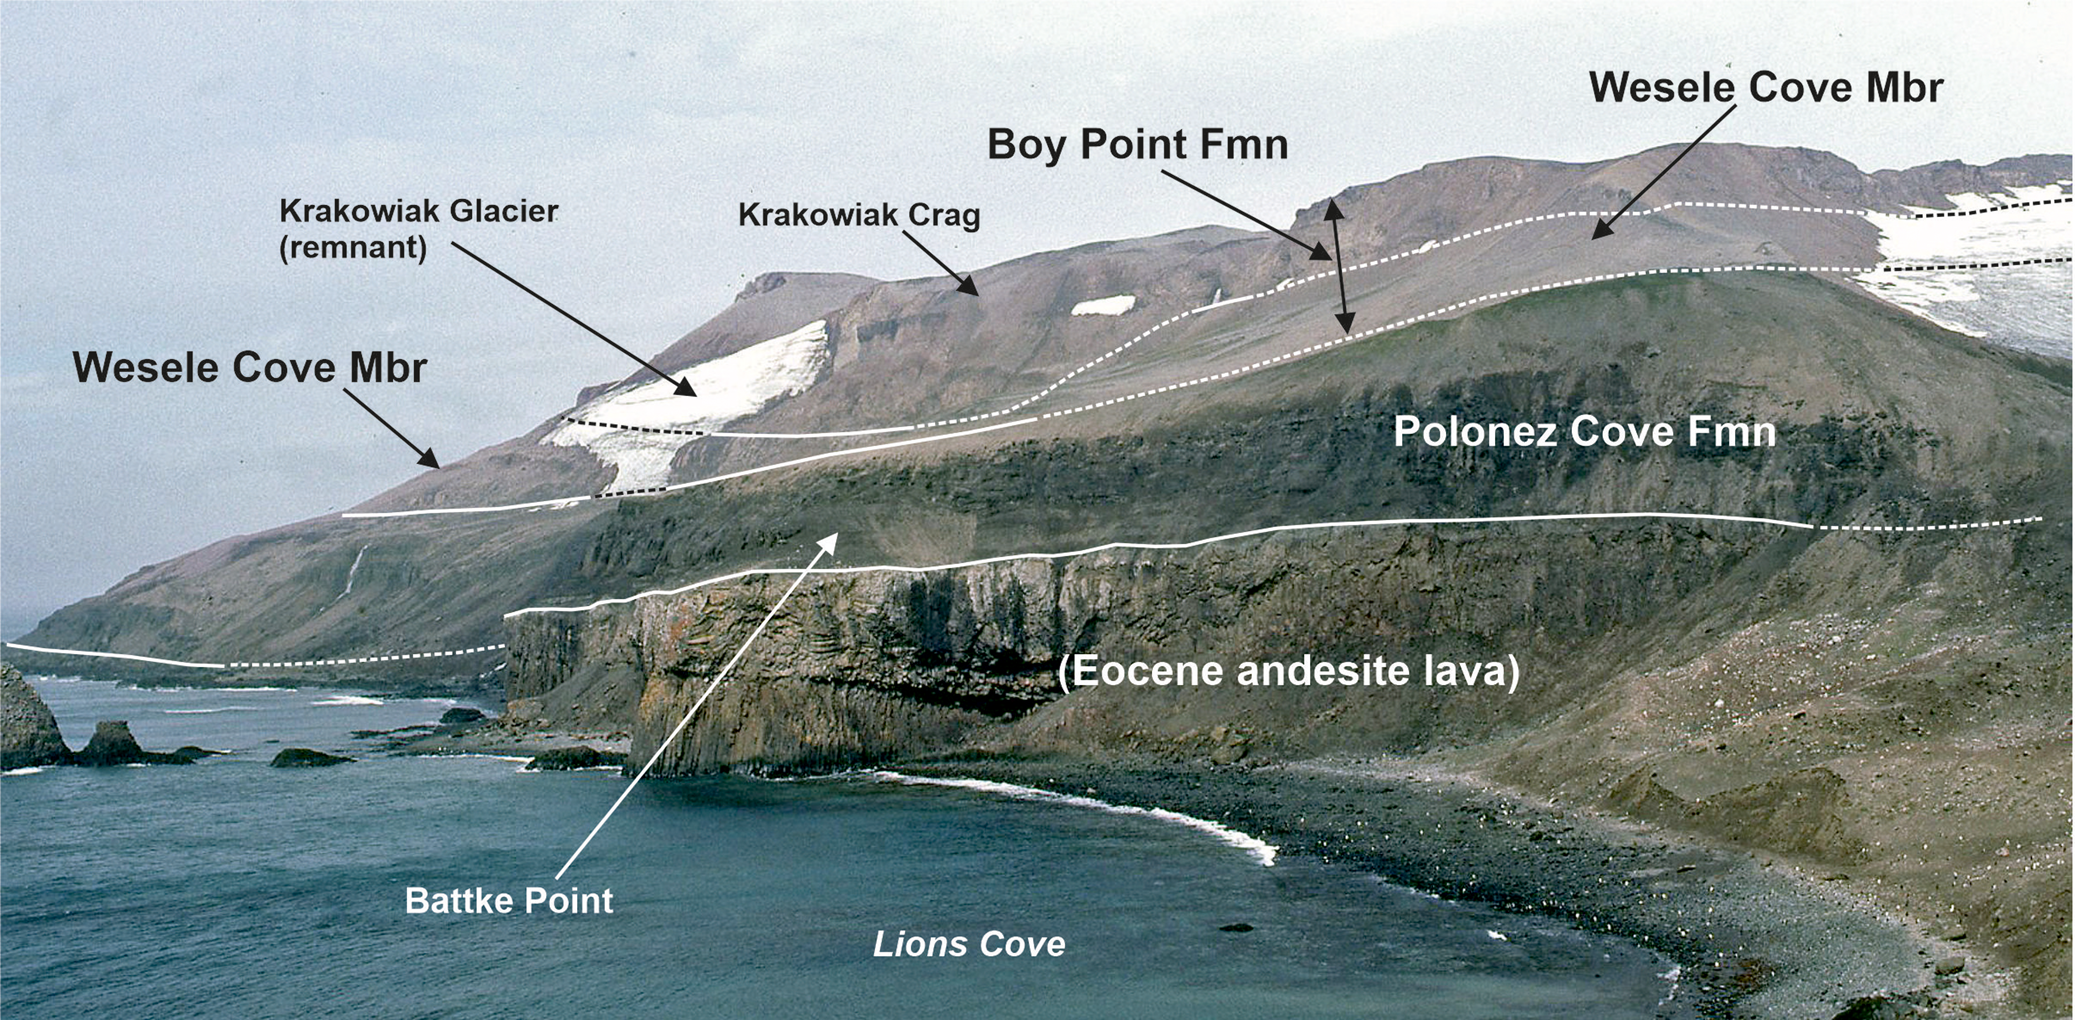
View looking south from Lions Rump to Battke Point and Krakowiak Crag, showing the sequence of formations. The view illustrates clearly how the Wesele Cove Member locally intervenes between the Polonez Cove and Boy Point formations, contradicting the previously published stratigraphy (i.e. Birkenmajer Reference Birkenmajer1982, Reference Birkenmajer2001). The amount of relief shown is c. 200 m (estimated). The dramatic reduction in the extent of Krakowiak Glacier is evident when this image (taken in January 1996) is compared with that taken in 1976 by Smellie et al. (Reference Smellie, Pankhurst, Thomson and Davies1984, fig. 40).
View of the Polonez Cove Formation showing its constituent members, looking south from Mazurek Point. Approximately 45 m of section is shown in the foreground.
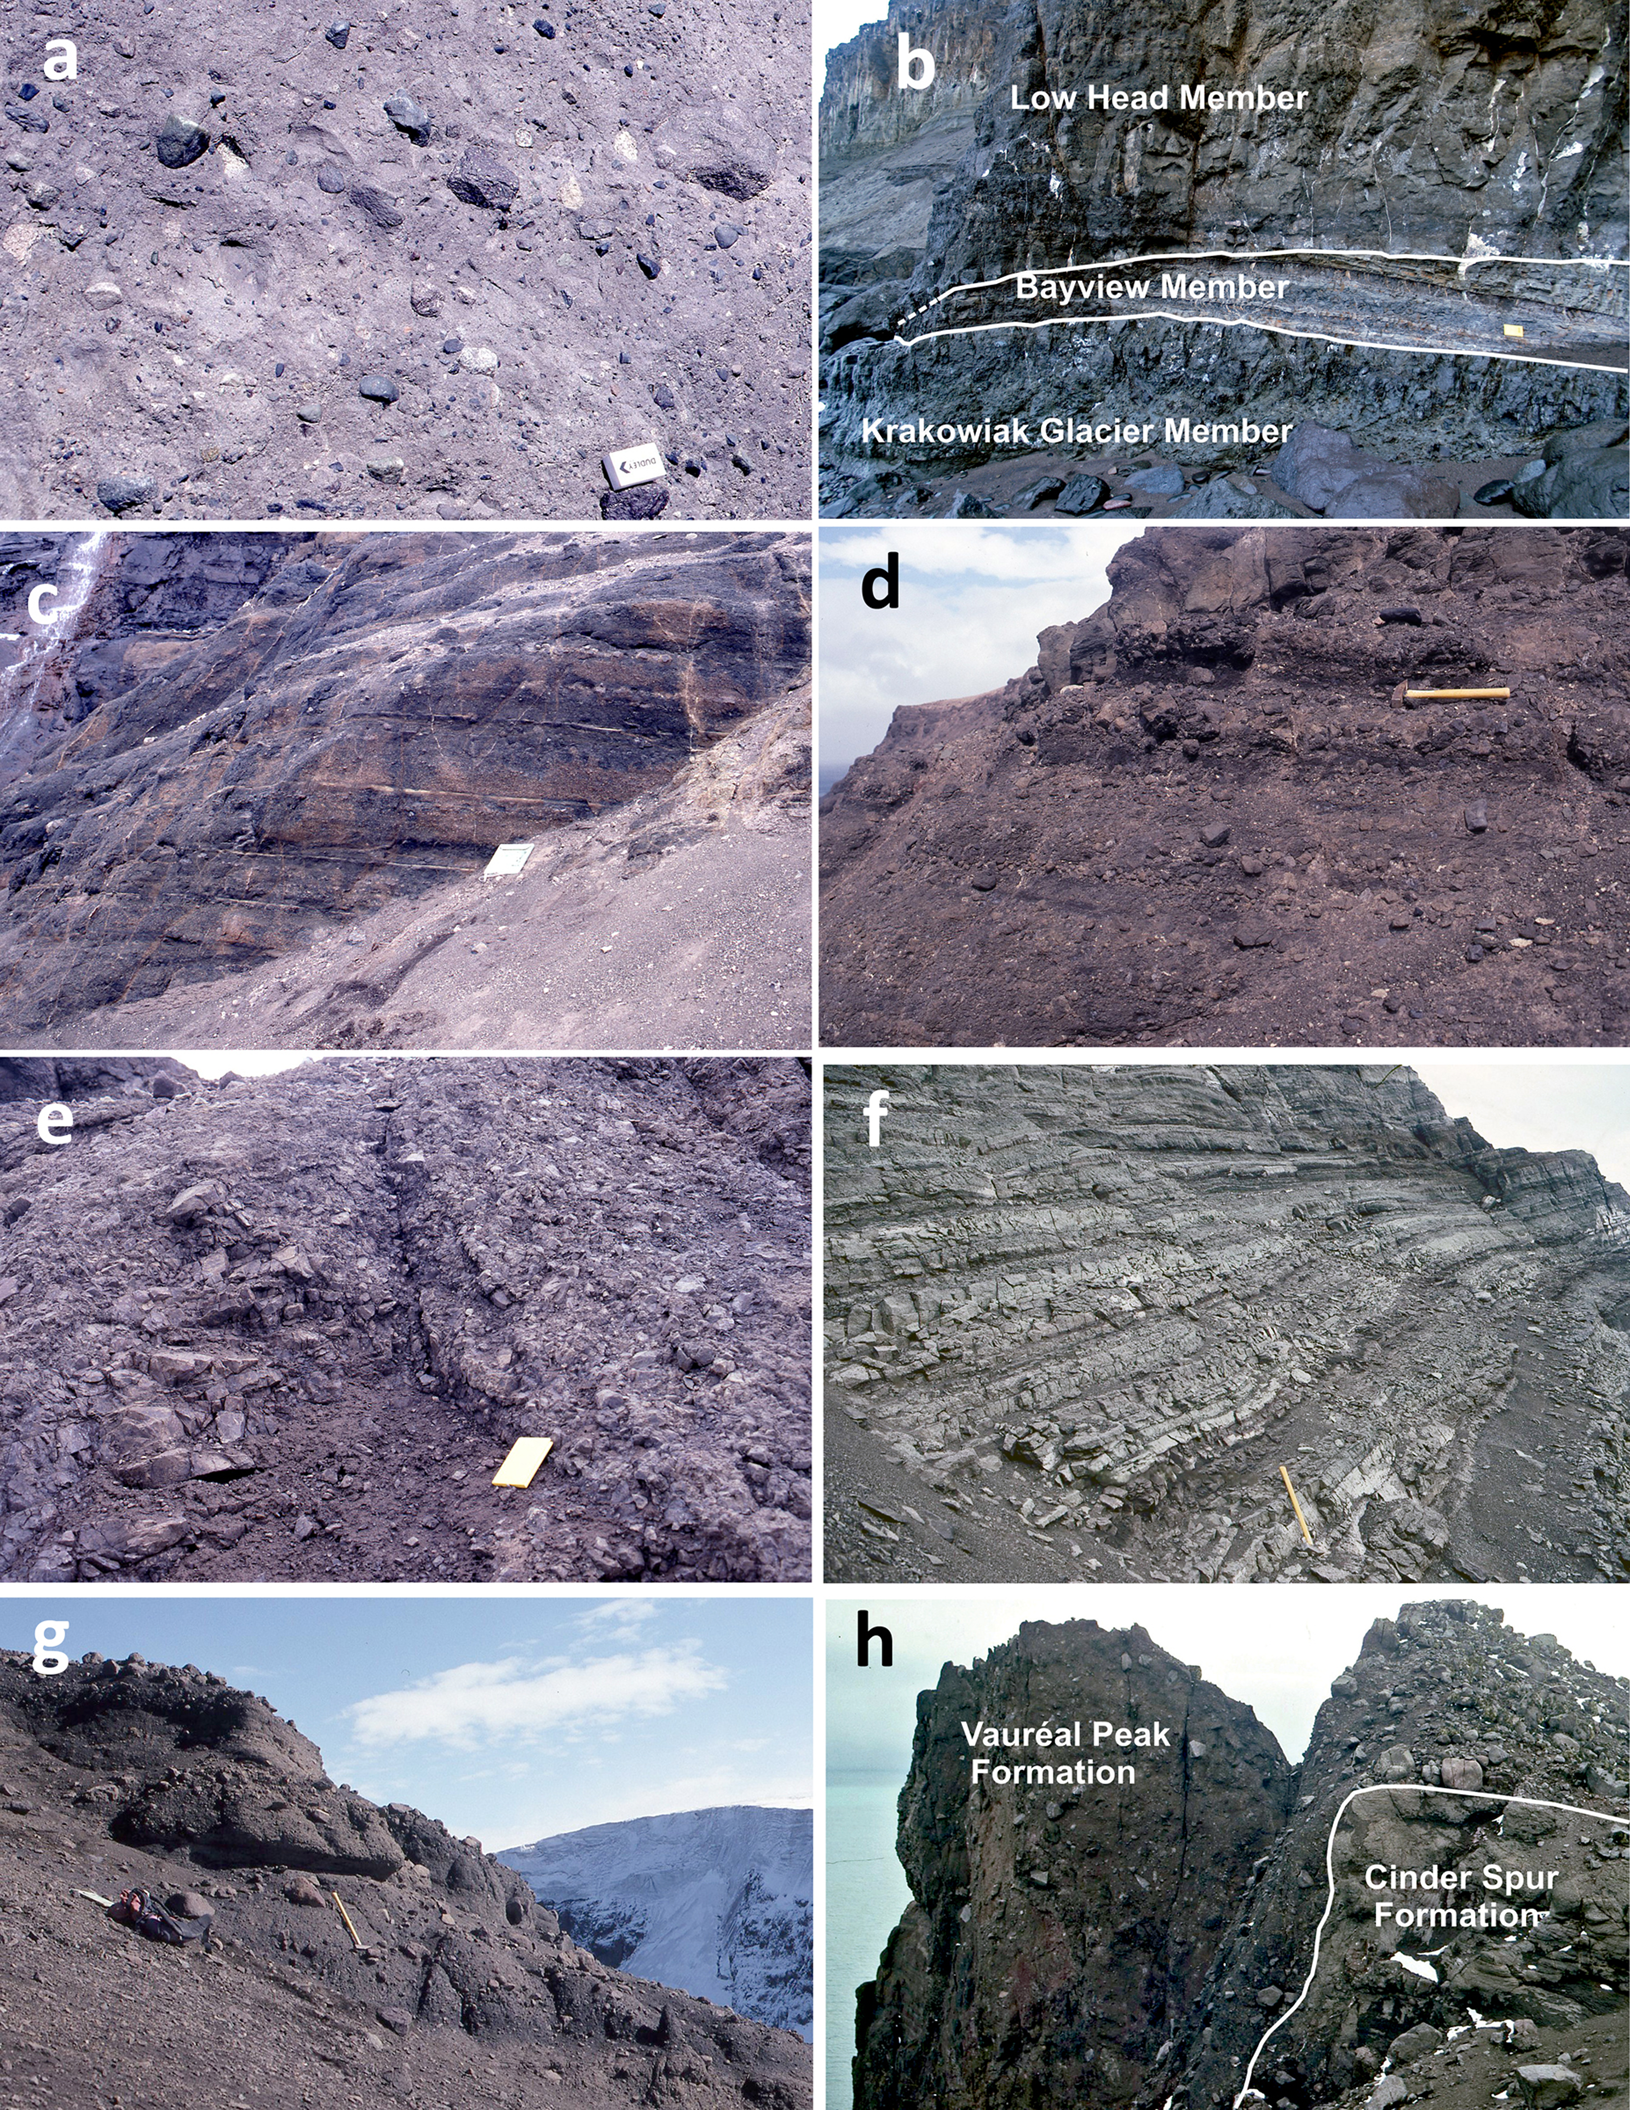
Compendium of photographs showing representative lithofacies in the Oligocene volcanic and sedimentary outcrops on eastern King George Island. a. Massive diamict; Krakowiak Glacier Member (Polonez Cove Formation) at Godwin Cliffs. The eraser is 5 cm long. b. Thinly stratified strata of the Bayview Member sandwiched between the Krakowiak Glacier and Low Head members (Polonez Cove Formation); beach crag c. 350 m south of Chopin Dyke; the field notebook is 16 cm long. c. Unusually well-defined graded beds of monomict fine lava breccia within a lava-fed delta at Godwin Cliffs; Oberek Cliff Member (Polonez Cove Formation); the mapping case is 30 cm in width. d. Crude massive beds of breccio conglomerate with dispersed white-coloured chlamys fragments, part of a lava-sourced fan delta at Battke Point; Low Head Member (Polonez Cove Formation); the hammer is 35 cm in length. e. Pervasively fractured and brecciated lava of the Boy Point Formation at Linton Knoll; the field notebook is 16 cm long. f. Well-stratified, pale-coloured sedimentary beds of sequence type 1 at Stamp Buttress (Cinder Spur Formation); the hammer is c. 70 cm in length. g. Crudely bedded gravelly breccio conglomerates of sequence type 2 at Martins Head (Cinder Spur Formation); the hammer is c. 70 cm long. h. Massive diamict of the Vauréal Peak Formation unconformably draping sedimentary rocks of the Cinder Spur Formation (sequence type 1) at the summit of Cape Syrezol; note how the diamict adheres to an almost vertical face cut in the older rocks; the large boulder in the foreground at right is c. 30 cm in length.
All of the members overlying the Krakowiak Glacier Member have a predominantly local basalt source, and some contain subunits that are entirely volcanic (Fig. 7b–d). The members alternate between sparsely fossiliferous, planar-bedded, generally fine-grained sediments (mainly sandstones) formed in relatively deep water (Bayview, Siklawa and Chlamys Ledge members); locally fossiliferous coarse epiclastic fan deltas sourced in recently active volcanism (subunits of the Low Head and Oberek Cliff members); and gravelly conglomeratic sediments with prominent channels and cross-stratification, typically highly fossiliferous and characteristic of deposition under relatively shallow-water high-energy conditions (other (upper) subunits of the Low Head and Oberek Cliff members). The entirely volcanic subunits consist of lava-fed deltas (in the Low Head and Oberek Cliff members; Porebski & Gradzinski Reference Porębski and Gradziński1990) and a co-genetic association of breccia with a central plug-like mass that were collectively formed during submarine extrusion of a highly crystalline lava dome (Smellie et al. Reference Smellie, Millar, Rex and Butterworth1998).
The extent of the Bayview and Siklawa members mapped during our study mirrors that shown by Troedson & Smellie (Reference Troedson and Smellie2002) but differs slightly in detail, as follows: 1) it is uncertain that the Siklawa Member continues to the south of the Chopin Dyke, its structural position there being represented by similar-looking thin-bedded, monomict bottom-set beds of an Oberek Cliff Member fan delta; and 2) the Bayview Member, best developed at Magda Nunatak (Troedson & Smellie Reference Troedson and Smellie2002), is everywhere else represented by small, erosionally isolated lenses (locations marked on Fig. 3), one of which (south of Chopin Dyke) was previously interpreted as part of the Low Head Member (Fig. 7b; Porebski & Gradzinski Reference Porębski and Gradziński1987, plate 7(2); cf. Quaglio et al. Reference Quaglio, Warren, Anelli, dos Santos, Rocha-Campos and Gaździcki2014).
The outcrop at Three Sisters Point is a small relict, measuring just 100 m long by c. 70 m wide (Birkenmajer Reference Birkenmajer1995a). It consists of diamictite and fossiliferous marine conglomerate correlated with the Krakowiak Glacier and Low Head members, respectively. The presence of striations and roche moutonée landforms cut in the basement lava noted by Paulo & Tokarski (Reference Paulo and Tokarski1982; see also Birkenmajer Reference Birkenmajer1995a) have not been observed in other outcrops of the formation. Moreover, similar features also occur on top of the overlying Polonez Cove Formation at Three Sisters Point, and their orientations are consistent with modern topography. Their origin is therefore ambiguous and they thus might all have been caused by recent glacial action (observations of AT). Two even smaller outcrops were mapped at Vauréal Peak by Birkenmajer (Reference Birkenmajer1982). Polonez Cove Formation diamictite (Krakowiak Glacier Member?), which was shown close to the summit of Vauréal Peak at c. 180 m above sea level, was not observed during our investigation. However, a small outlier is present midway between Cape Vauréal and Vauréal Peak (Fig. 4). Two lithofacies are present and, as at Three Sisters Point, have been correlated with the Krakowiak Glacier and Low Head members (Birkenmajer Reference Birkenmajer1982, Birkenmajer et al. Reference Birkenmajer, Soliani and Kawashita1989, Quaglio et al. Reference Quaglio, Anelli, dos Santos, de Perinotto and Rocha-Campos2008). At both localities, the Krakowiak Glacier Member comprises mainly massive diamictite with abundant erratic clasts. The Low Head Member at Three Sisters Point has not been described (cf. Birkenmajer Reference Birkenmajer1995a, fig. 4), but at Vauréal Peak it is a crudely stratified sequence c. 10 m thick, dominated by massive pebbly diamictite alternating with sandy fine conglomerate and minor sandstone. It is sparsely fossiliferous (Quaglio et al. Reference Quaglio, Anelli, dos Santos, de Perinotto and Rocha-Campos2008).
Boy Point Formation (redefined stratigraphical unit)
Previous studies divided the strata above the Polonez Cove Formation into two formations: a lower Boy Point Formation, composed of felsic-intermediate lavas, and an upper Wesele Cove Formation, formed of agglomerates, conglomerates and sandstones (Birkenmajer Reference Birkenmajer1982, Reference Birkenmajer2001, fig. 43). In fact, the published stratigraphy is inverted and the Wesele Cove Formation, as defined by Birkenmajer (Reference Birkenmajer1982), mainly overlies the Polonez Cove Formation directly across a sub-horizontal planar erosional unconformity, although in Oberek Cliff it is sandwiched between lavas of the Boy Point Formation (Figs 3, 5 & 8). In its form, attitude and extent, the basal unconformity resembles other planar erosional surfaces observed within the Polonez Cove Formation, and they are present within the overlying Boy Point Formation too. Thus, the Wesele Cove Formation is essentially a sedimentary sequence contained within a thicker lava sequence. Its provenance is also andesitic-dacitic, similar to the associated lavas. Therefore, it is suggested that the Wesele Cove Formation is more appropriately reclassified as a member of the lava-dominated Boy Point Formation and it is here renamed the Wesele Cove Member (Table II).
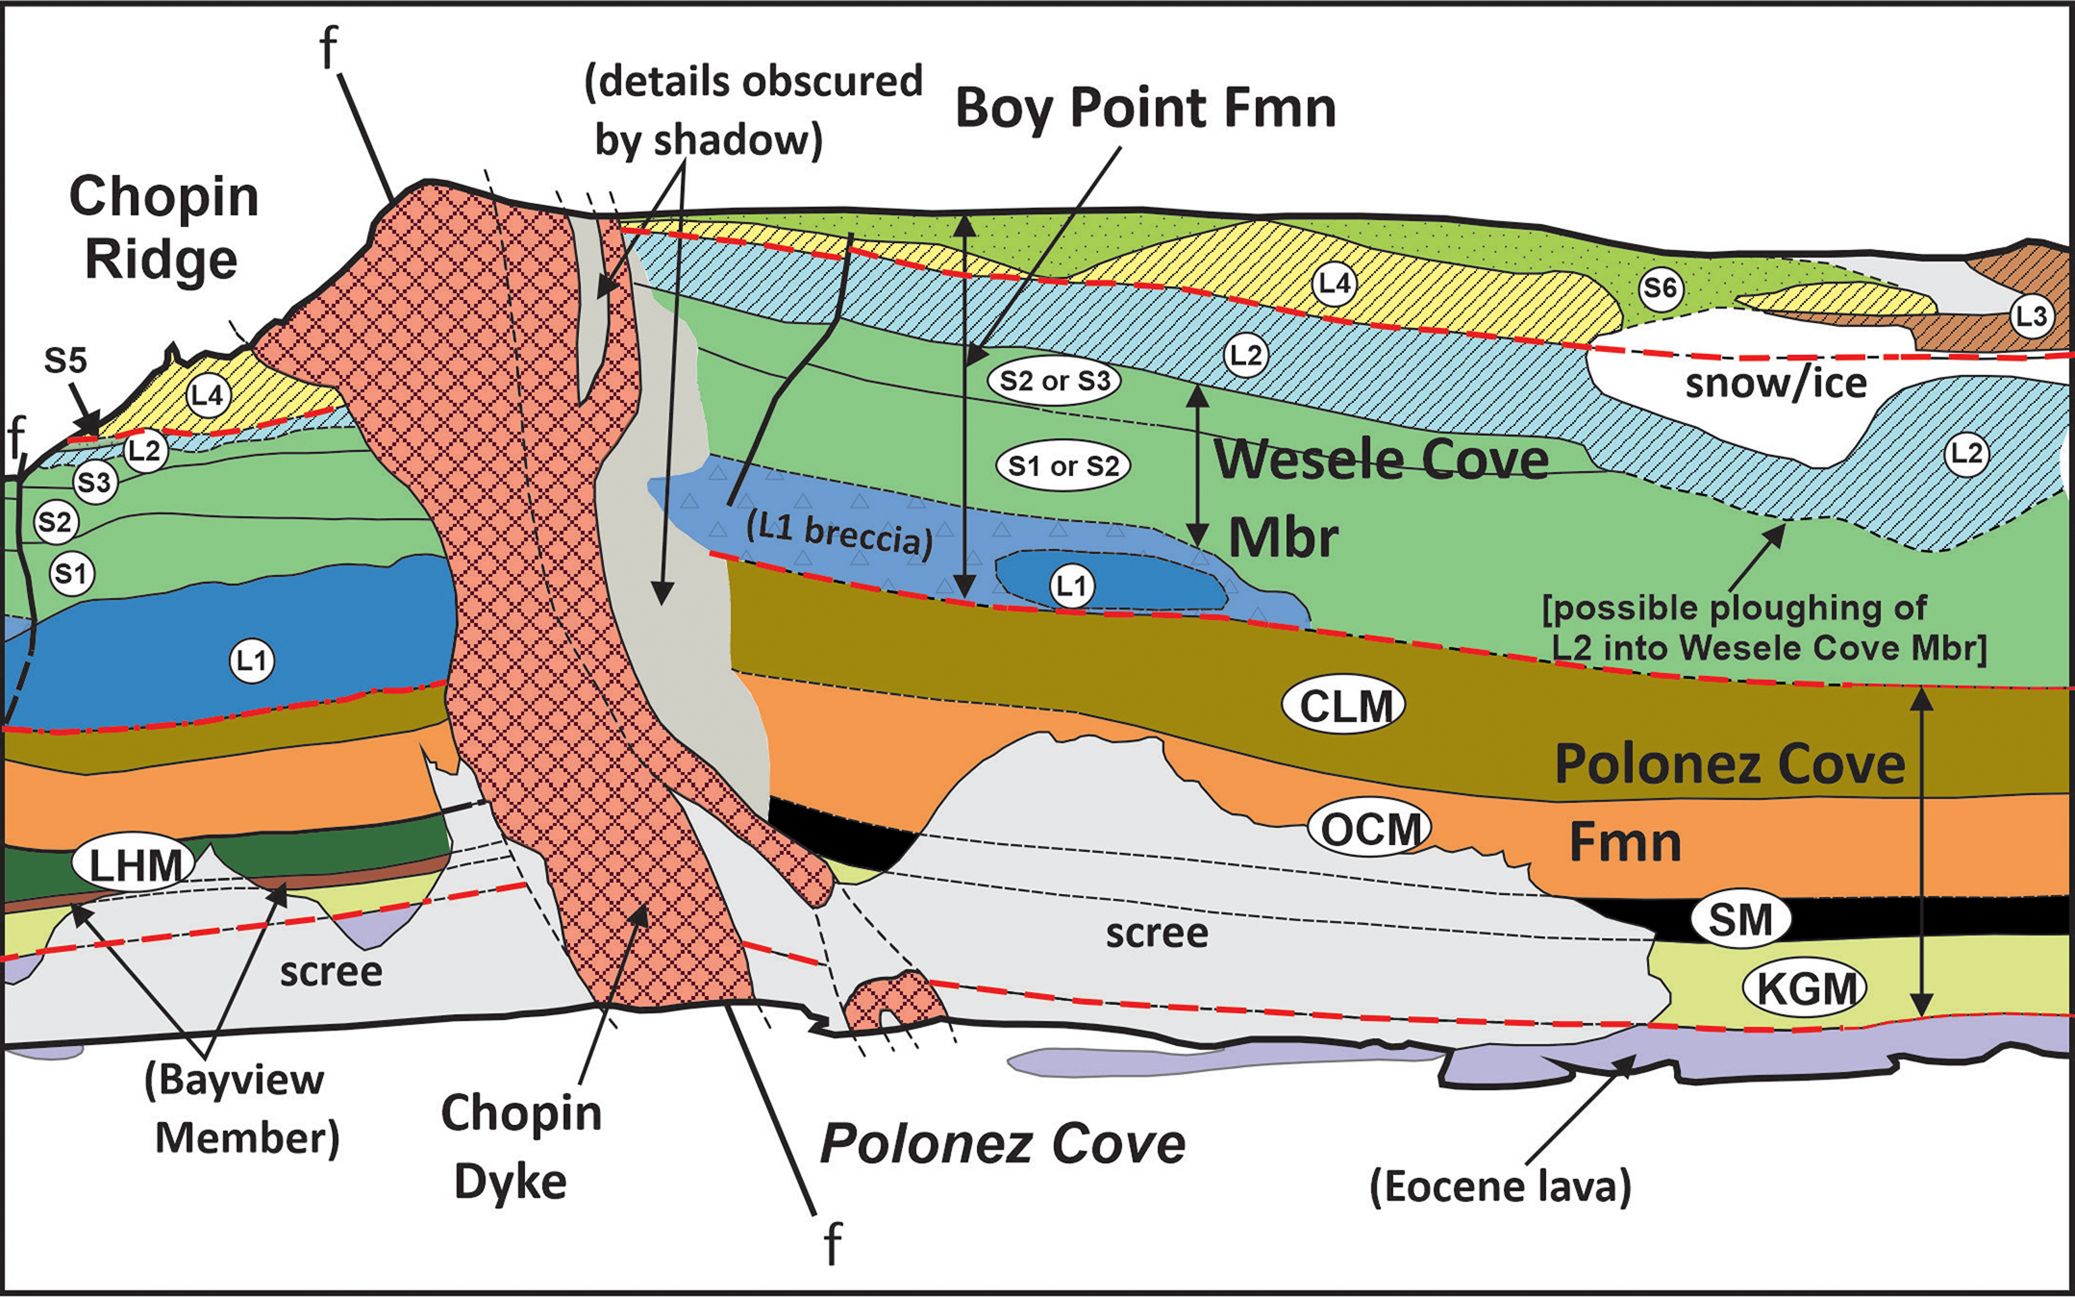
Sketched view of Oberek Cliff (c. 200 m high) showing the stratigraphical units present, including the large Chopin Dyke. Note how lava L2 of the Boy Point Formation appears to plough into sediments of the Wesele Cove Member at right. Note also that S6 probably underlies L6 (view affected by foreshortening). Because exposures are discontinuous, it cannot be proven that sedimentary sequences S4 (not in view), S5 and S6 are different units. They occupy a similar stratigraphical position. Colours used are explained in Fig. 3. CLM = Chlamys Ledge Member; KGM = Krakowiak Glacier Member; LHM = Low Head Member; OCM = Oberek Cliff Member; SM = Siklawa Member.
Stratigraphy of eastern King George Island (this paper).
Note that the ‘Mazurek Point Formation’ (now Hennequin Formation) is omitted from the Oligocene stratigraphy; its age has been shown to be Eocene and unrelated geologically to the overlying formations of the Chopin Ridge Group (Pańczyk & Nawrocki Reference Pańczyk and Nawrocki2011, Smellie et al. Reference Smellie, Hunt, McIntosh and Esser2021).
a Excludes the Sherratt Bay Formation (probable dolerite sill, part of the Cape Syrezol Group?).
b Probably a distal marine equivalent of the Cinder Spur Formation.
c New stratigraphical unit.
d Redefined stratigraphical unit.
e The Polonez Glaciation strictly only applies to the basal unit (Krakowiak Glacier Member), but conventional usage applies it to the entire formation.
The Boy Point Formation is dominated by andesite-dacite lavas (Birkenmajer Reference Birkenmajer1982). Although an outcrop at Stamp Buttress (close to Boy Point; Fig. 9) was also assigned to the formation, it is compositionally and physically dissimilar (massive basaltic andesite lava and autoclastic breccia indistinguishable from lavas at Boy Point nearby), and the original study by Birkenmajer (Reference Birkenmajer1982), which correlated unconformably overlying strata at Stamp Buttress with the Wesele Cove Formation, is incorrect. The supposed Wesele Cove Formation outcrop at Stamp Buttress is an integral part of the lava-dominated sequence that forms the Cinder Spur outcrop, and it is here assigned to the new Cinder Spur Formation (see below; Figs 9 & 10). The exposed upper surface of the Boy Point Formation everywhere corresponds to the present-day erosion surface, but a steep cross-cutting unconformity can be inferred from the distribution of outcrops on the west side of Wesele Cove, where the Boy Point Formation and most of the Polonez Cove Formation are cut out (Fig. 9). The total thickness of the Boy Point Formation is difficult to measure, but it is probably c. 100–150 m (Birkenmajer Reference Birkenmajer1982, estimated up to 120 m). Despite the formation being absent at Boy Point, the name is embedded in the literature and is retained here. However, the type section is at Oberek Cliff (Figs 3 & 8).
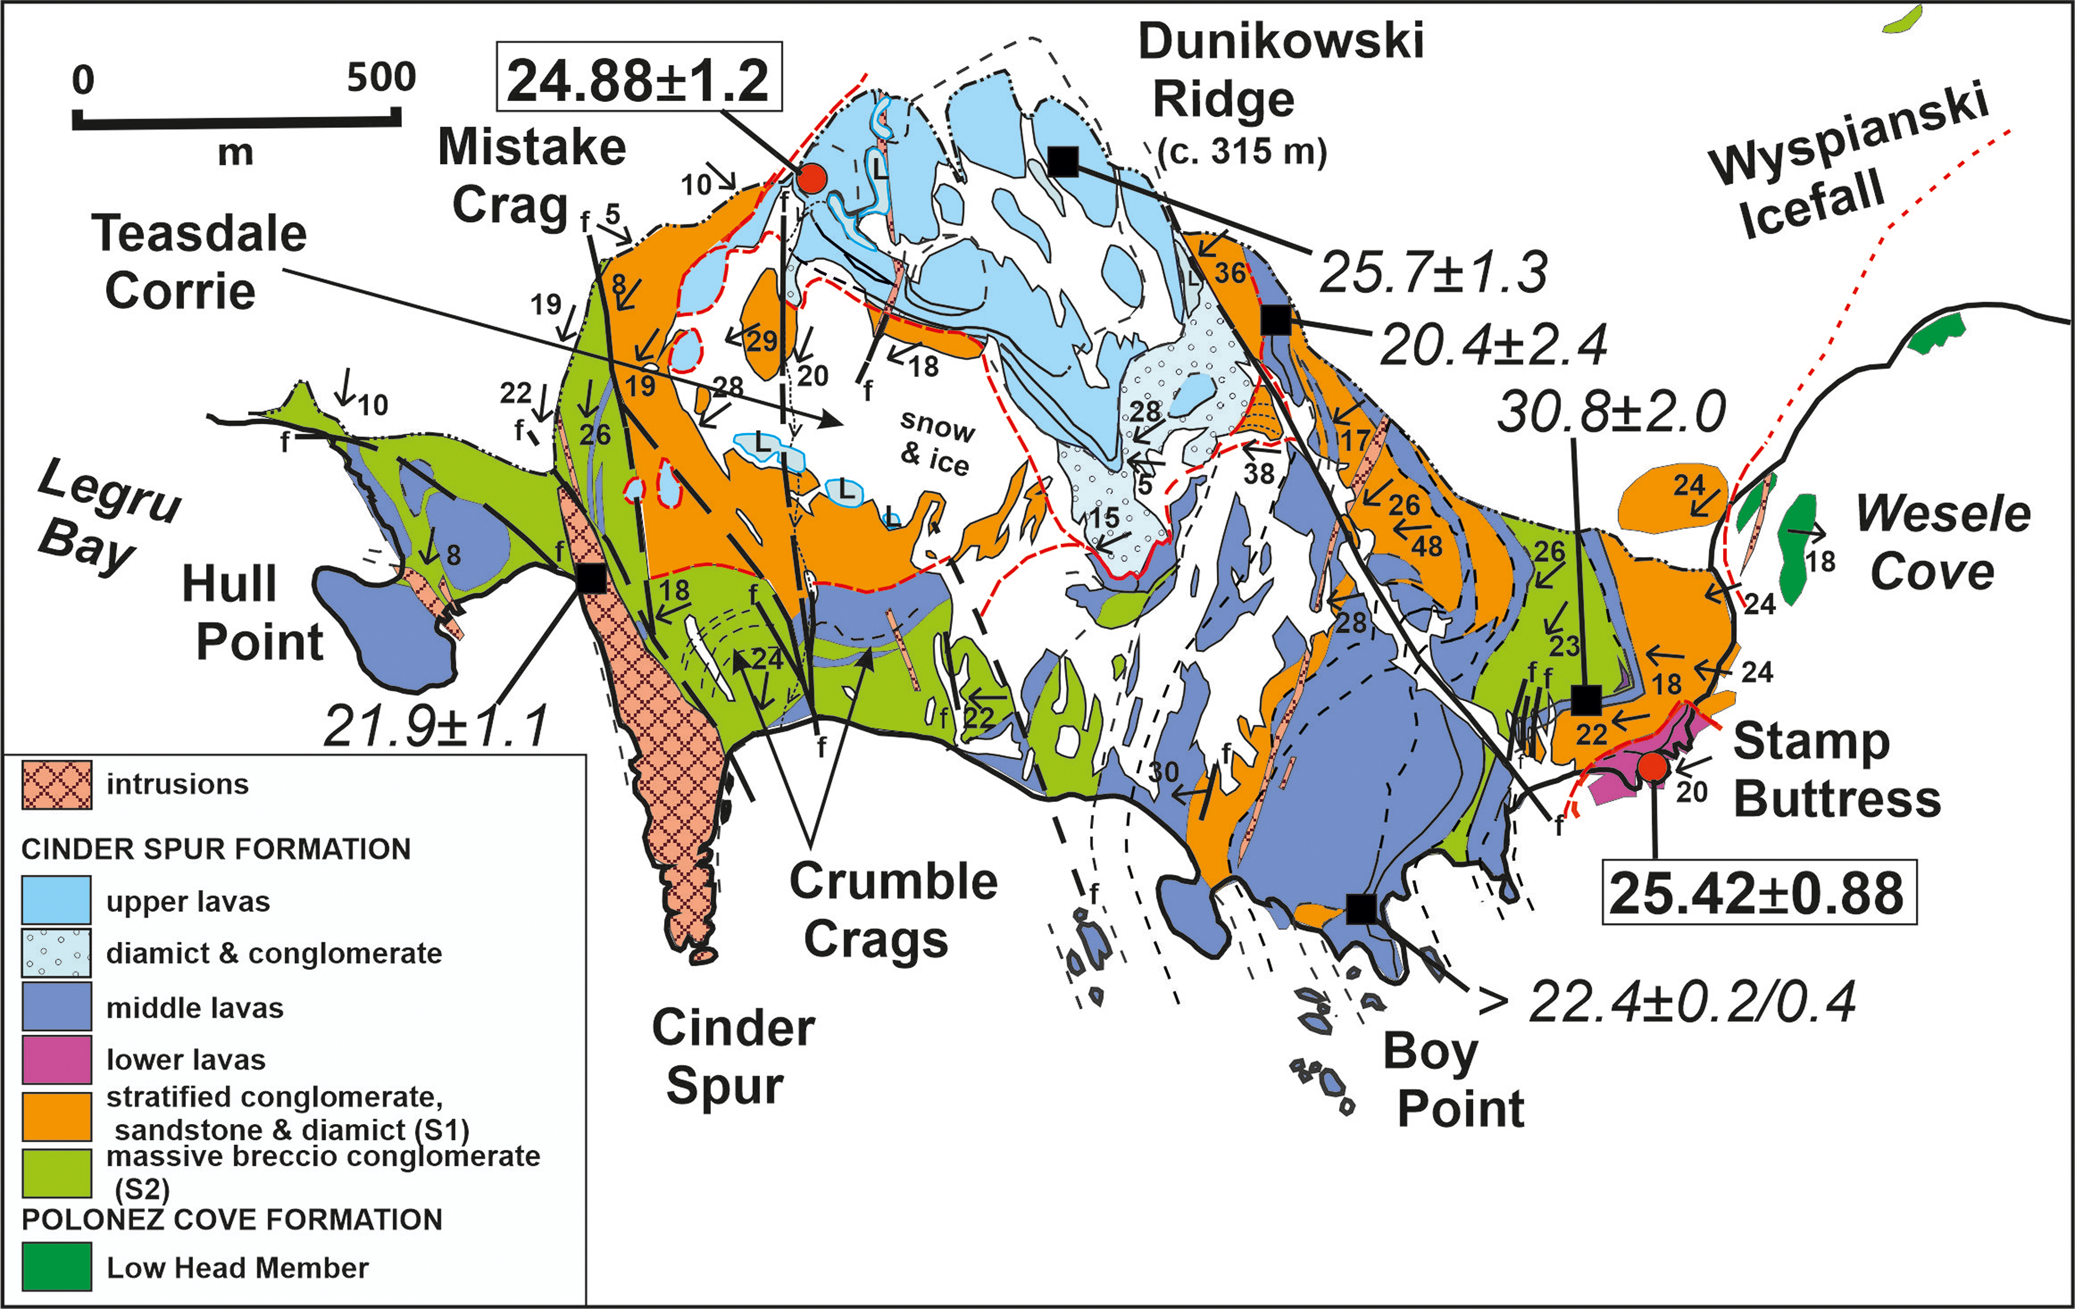
Geological map of the Cinder Spur area, eastern King George Island. See Fig. 3 for explanation of additional symbols.
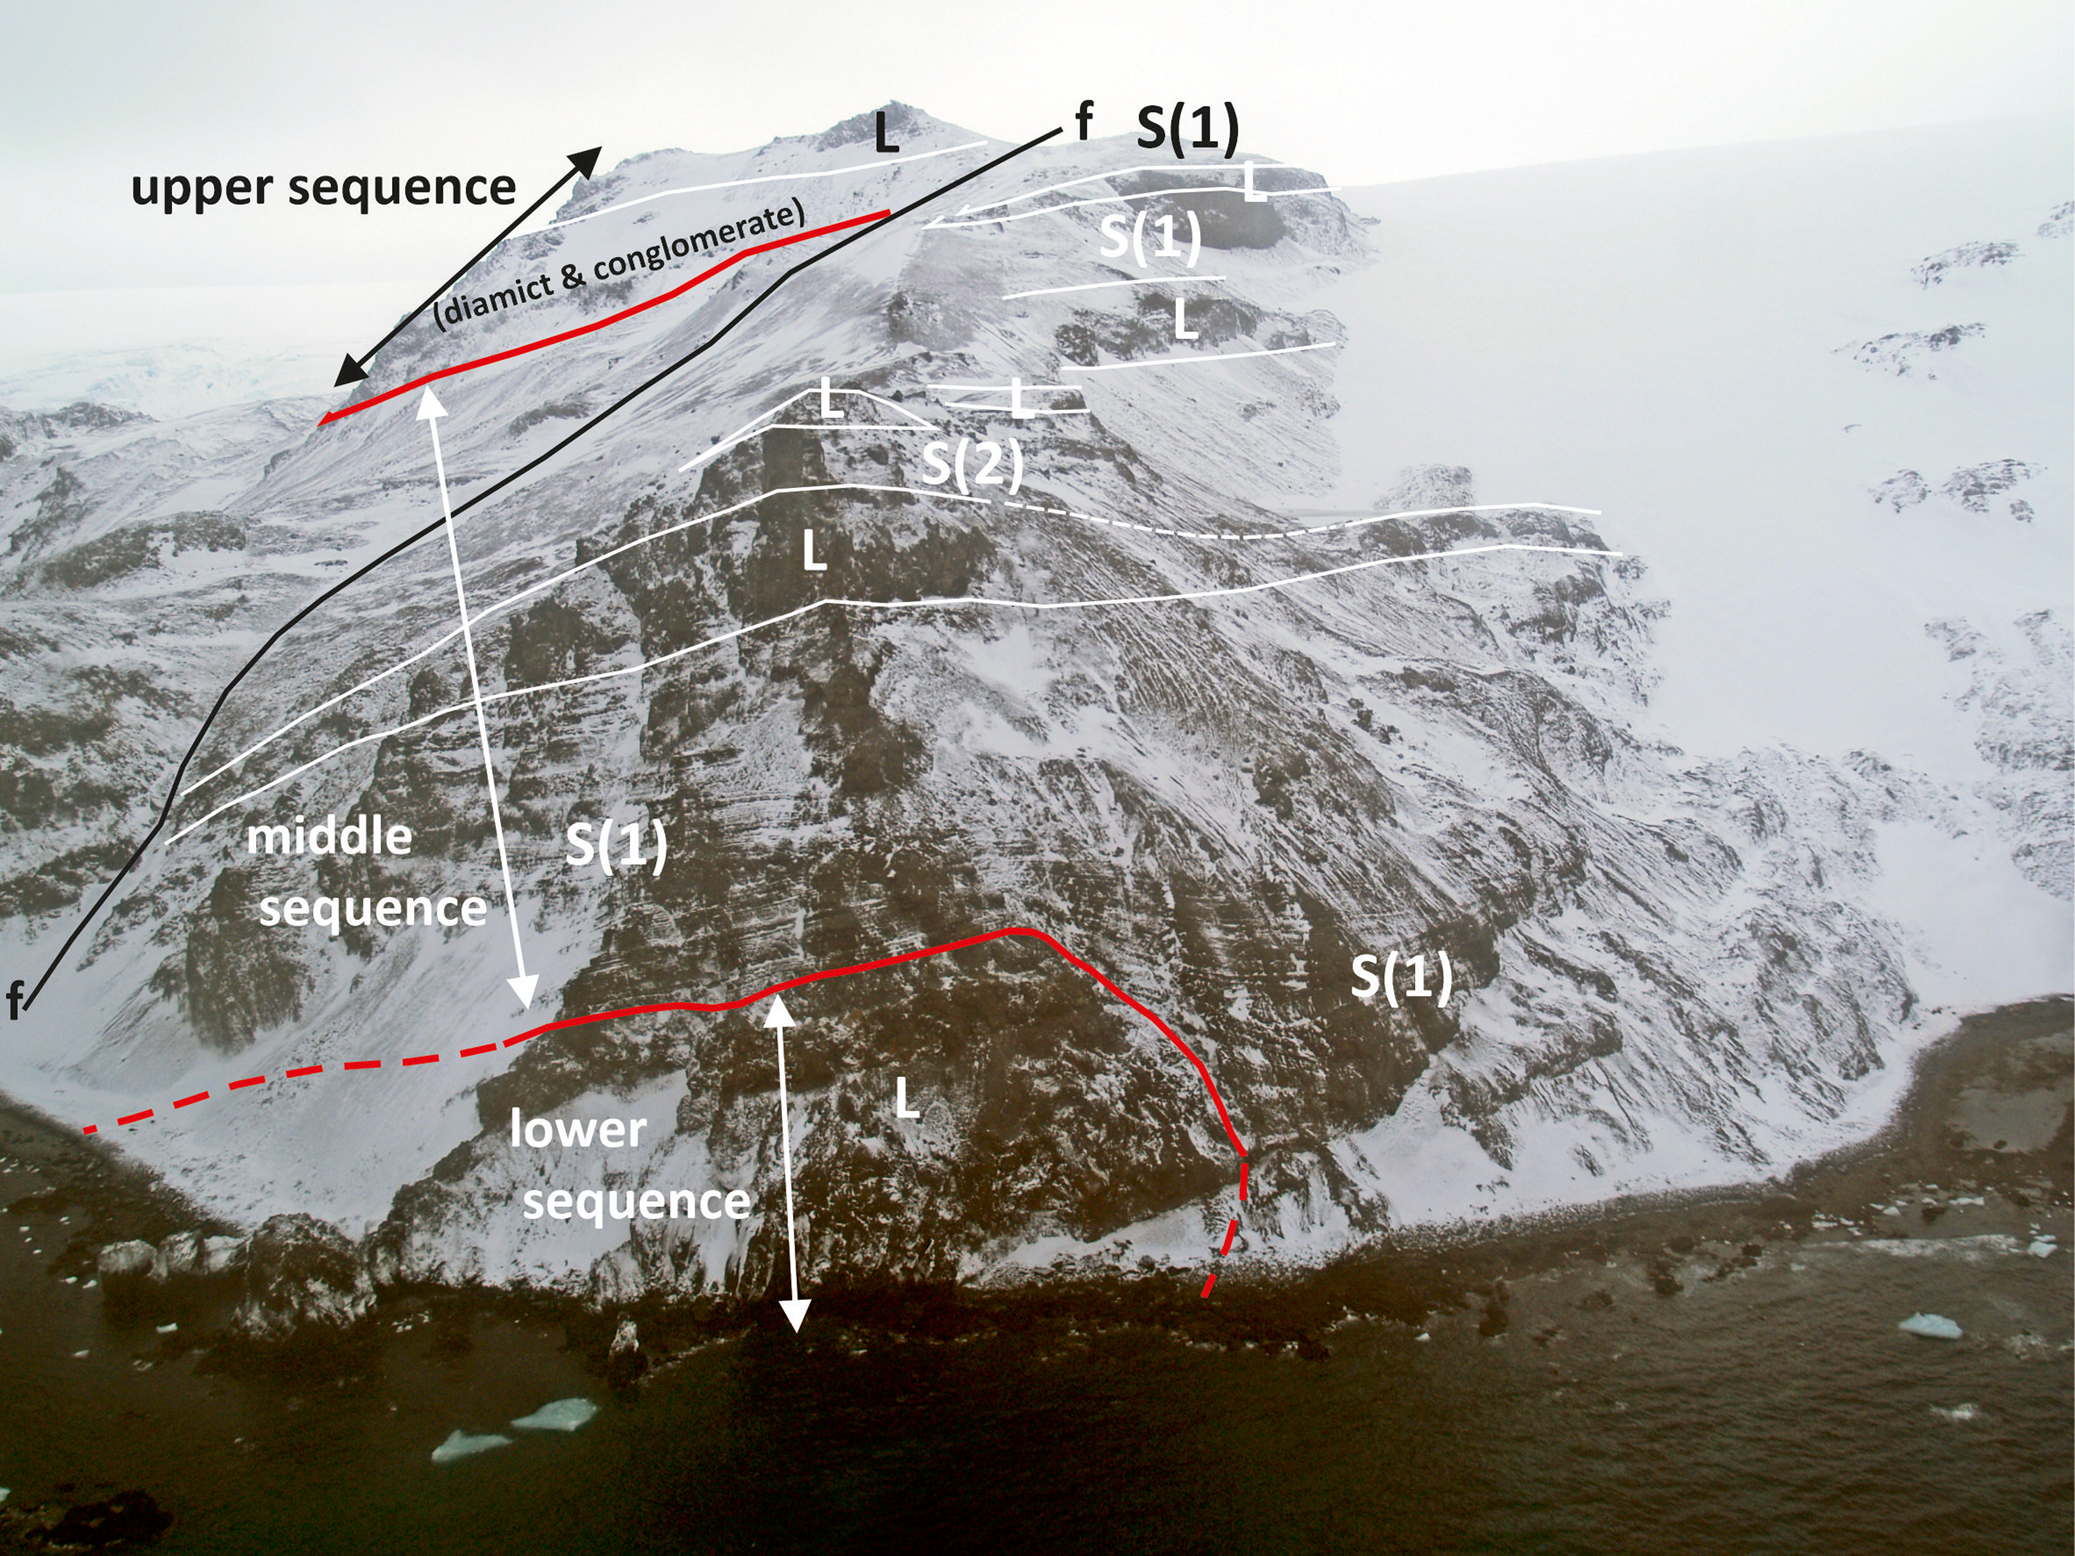
View of Stamp Buttress, looking up Dunikowski Ridge, showing selected geological units (cf. Fig. 9). All of the rocks shown belong to the Cinder Spur Formation. Note how S(1), whilst occupying a channel cut in the lower lava sequence at right, is a conformable part of the sequence and not an outlier of the Wesele Cove Formation, as interpreted by Birkenmajer (Reference Birkenmajer1982) and which led to the lavas of the lower sequence being mapped incorrectly as part of the Boy Point Formation. Approximately 300 m of relief is shown. Red lines are prominent unconformities. L = lava; S(1), S(2) = sedimentary rocks of type 1 and type 2 sequences, respectively; see text for further explanation.
Four lavas (L1–L4; Fig. 3) are present within the Boy Point Formation at Oberek Cliff. They are distinctive highly porphyritic andesites and dacites in which largely opaque oxide-altered hornblende phenocrysts are common and conspicuous (Table III). Elsewhere in the South Shetland Islands, amphibole is a rare phenocryst phase in lavas (Smellie et al. Reference Smellie, Pankhurst, Thomson and Davies1984). The lavas are brightly coloured (mainly pale green, pink, pale grey and khaki-brown), non-vesicular and characteristically pervasively fractured to brecciated (Fig. 7e). In Oberek Cliffs, the lowest stratum included in the formation comprises c. 25 m of purplish grey to pale green lava (L1; Fig. 8), which varies irregularly between coarse lava breccia and highly fractured but otherwise intact lava. Lava L2, pale pinkish grey in colour and composed predominantly of lava breccia, is only 8 m thick south of Chopin Dyke but thickens northwards to c. > 40 m, across the fault occupied by the Chopin Dyke, before wedging out within the Wesele Cove Formation c. 400 m south of Battke Point. Lavas L3 and L4 are similar to L2 but with different colours.
Major oxide analyses of Oligocene lavas and intrusions, eastern King George Island.
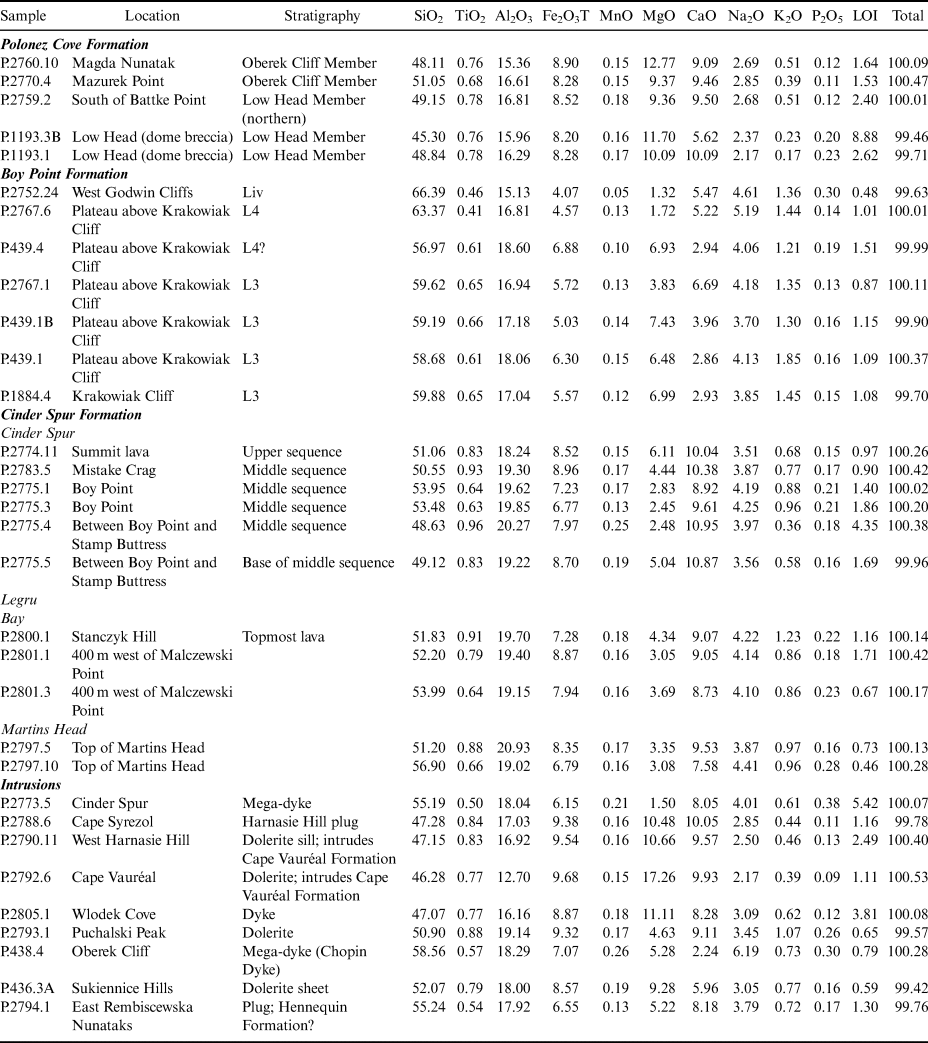
LOI = loss on ignition.
Within the lavas above the Wesele Cove Member, granule conglomerate and sandstone (S4) occupy a prominent hollow c. 8 m deep overlying L2 in Krakowiak Crag. S4 is pale green-grey and mainly conglomeratic. It contains large chlamys fossil moulds, which are locally abundant. A sequence of polymict, green granule and pebble conglomerates (S5), c. 4 m thick, also overlies L2 on the south flank of Chopin Dyke. It is apparently unfossiliferous and comprises lensoid beds and pebble trails a few centimetres to 1.5 m thick, which are crudely interstratified with rare thin sandstone lenses, with some channelized trough cross-stratification and (?)tabular cross-bedded sets. The stratigraphical position of S5 is uncertain. It overlies L2 similar to S4, but it is also overlain by L4 (L3 is absent south of Chopin Dyke), similar to S6 north of Chopin Dyke. Lithologically, S5 is more like S4. The characteristics of S6 are very uncertain as it is preserved solely as a felsenmeer of fissile platy debris composed of feldspathic sandstone and rare pebble conglomerate. It crops out on the undulating plateau above Krakowiak Crag.
A hitherto-unrecognized likely internal erosion surface truncates L2, S4 and S1 (S1 described below). It is planar and sub-horizontal and best seen in the east-facing Oberek Cliffs north of Chopin Dyke (Fig. 8). The surface is overlain by lavas L3 and L4. Lava L3, pale green to brown in colour, is intruded by and intimately intermixed with massive, mainly pale grey polymict diamictite, which appears to have originally covered parts of the underlying erosion surface. The youngest unit in the formation is pale grey to pink lava (L4). Its basal surface is uneven on a large scale, draping L3 and probably S6.
Wesele Cove Member: The lavas of the Boy Point Formation are interbedded with volcanic-sourced sediments. The most prominent deposit is identified here as the Wesele Cove Member, which forms a sequence > 80 m thick (see also Birkenmajer Reference Birkenmajer1982). It overlies lava L1 in Oberek Cliffs (Fig. 8), and it is dominated by distinctive pale grey or pale khaki-coloured feldspathic sandstones. The sandstones have a gently north-east-dipping homoclinal stratification that oversteps the basal unconformity with the Polonez Cove Formation. The Wesele Cove Member has been divided informally into three subunits (S1–S3) separated by planar, slightly erosive surfaces (Fig. 8). The separating surfaces are only obvious, as shallow notches, in Oberek Cliff on both sides of Chopin Dyke. Although some of the subunits presumably extend further north into Krakowiak Crag, they have not been mapped owing to the poor exposures and lithological similarities between the sediment packages. In addition, correlation of specific subunits across Chopin Dyke (which occupies a fault) is uncertain. The upper contact is a gently north-dipping, planar to locally very uneven surface overlain by lava L2, which cuts out the highest sedimentary package. The surface may be erosional or lava L2 may have sunk in unconsolidated sandstones of the Wesele Cove Member (Fig. 8). The member is described from the base up in Chopin Ridge.
The basal strata of the Wesele Cove Member, locally overlying L1 in southern Oberek Cliff, comprise up to 10 m of green (?)monomict gravelly conglomerate and laminated coarse sandstone, some with isolated outsize lava blocks, and there are lenses of blocky volcanic breccia. These beds are overstepped northwards by c. 25 m of very thick (up to 10 m) beds of massive, monomict lava breccia, alternating with thinner (few metres) units of pale green, thinly laminated sandstone. This sequence (S1) fines upward, from basal breccias, through finer breccias, up into sandstones. South of Chopin Dyke, S2 and S3 consist of a total of c. 28 m of white feldspathic sandstone and minor gravelly sandstone. Beds are typically hard to distinguish. The sequence also contains pebbly conglomerate and coarse breccio-conglomerate in beds up to 8 m thick, which become thinner northwards.
Other outcrops of the Boy Point Formation: Lavas of the Boy Point Formation also crop out at Linton Knoll (Fig. 3). At least five different lavas are present (Li–Lv), ranging from 2 to 20 m thick with thinner lavas towards the top; they are thinner than lavas in the outcrop above Krakowiak Crag but otherwise indistinguishable in appearance. The lavas are interbedded with a poorly seen, thin (≤ 6 m) deposit of pebble and cobble conglomerate and matrix-rich volcanic breccio-conglomerate (Sii). A thin wedge of pale grey feldspathic coarse sandstone and granule to pebble conglomerate also crops out in situ and as morainic debris at Godwin Cliff, directly beneath the lava sequence just described (Fig. 3). It may either be an outlying outcrop of the Wesele Cove Member or it is a sediment wedge above that member within the lava sequence, similar to sediment subunits S4 and S5 (described above).
Although the outcrop of the Boy Point Formation is apparently confined to the Lions Rump-Low Head-Linton Knoll area, rare clasts of lithologically identical hornblende-phyric andesite occur in sedimentary rocks at Martins Head and Harnasie Hill, in outcrops assigned to the Cinder Spur Formation (see below). The presence of the clasts may suggest that either the Boy Point Formation crops out more widely and its lavas were reworked into the younger formation or else hornblende andesite lavas may also have erupted within the Cinder Spur Formation but are not currently exposed.
Cinder Spur Formation (new stratigraphical unit)
The Cinder Spur Formation is the most extensive Oligocene stratigraphical unit on eastern King George Island. The type locality is at Cinder Spur, where the range of lithofacies and their relationships are best exposed (Fig. 9). Other outcrops occur on the west side of Legru Bay, at Retreat Bluffs, Stanczyk Hill, Martins Head and Harnasie Hill (Fig. 11). The only published maps of Cinder Spur are on a very small scale (Barton Reference Barton1965, Birkenmajer Reference Birkenmajer1982). Birkenmajer (Reference Birkenmajer1982) divided the sequence into five parts: a basal basalt lava sequence (Boy Point Formation, at its type locality; reassigned here to the Cinder Spur Formation), unconformably overlain by agglomerates, conglomerates and sandstones of the Wesele Cove Formation, itself unconformably overlain by lavas of the Dunikowski Ridge Formation. To the west, across a fault, the Dunikowski Ridge Formation (lava, conglomerate, agglomerate) was overlain by the Harnassie Hill Formation (agglomerate and tuff of a basaltic cinder cone), itself overlain by the Martins Head Formation (lava, agglomerate). Unfortunately, many of the published details of the geology of Cinder Spur are incorrect (e.g. see Figs 9 & 10).
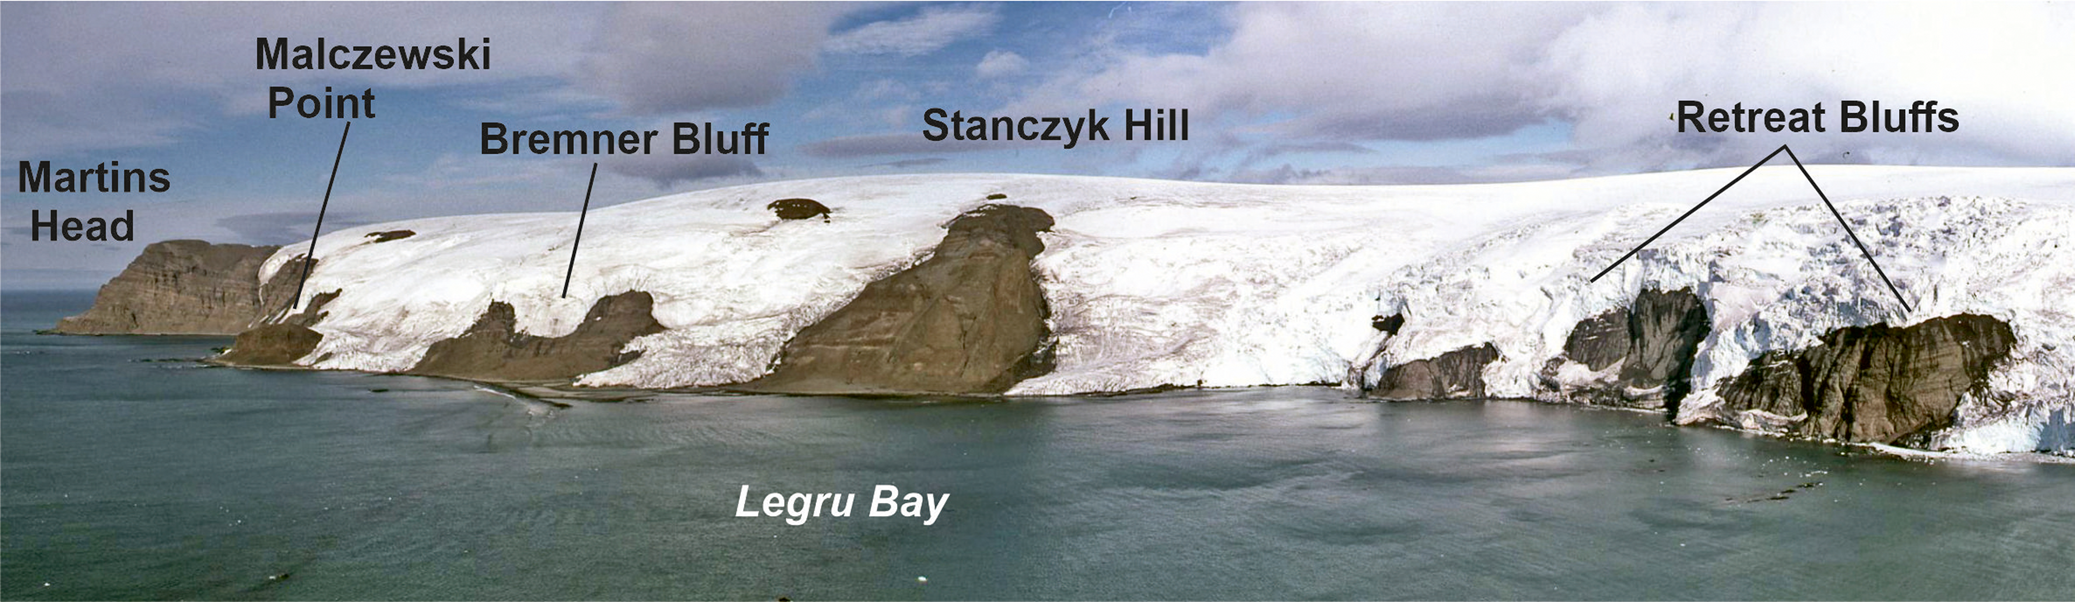
View of outcrops of the Cinder Spur Formation on the west side of Legru Bay. The varied dip orientations seen in the outcrops suggest that they were formed in more than one volcanic edifice; that responsible for Martins Head, in which strata dip to the right (approximately to the north-west), must have been situated in Bransfield Strait but has been considerably eroded.
The Cinder Spur Formation is composed of alternating lavas and sedimentary rocks (Fig. 9). Its base is unexposed, but at Harnasie Hill it overlies Eocene strata of the Cape Vauréal Formation, although the nature of the contact is uncertain (Fig. 12; Smellie et al. Reference Smellie, Hunt, McIntosh and Esser2021). The top is mainly the present-day erosion surface except where it is erosively overlain by the Vauréal Peak Formation, of uncertain age (see later). The relationship with the Boy Point Formation is unknown as no contacts are exposed, but our interpretation of the outcrops on the west side of Wesele Cove suggest a strong erosional unconformity is present that is probably responsible for restricting the western outcrop extent of the Boy Point Formation. Because of faulting and large ice-covered gaps in exposure, the total thickness of the Cinder Spur Formation is unknown, but it must exceed 500 m (see also Birkenmajer Reference Birkenmajer1982).
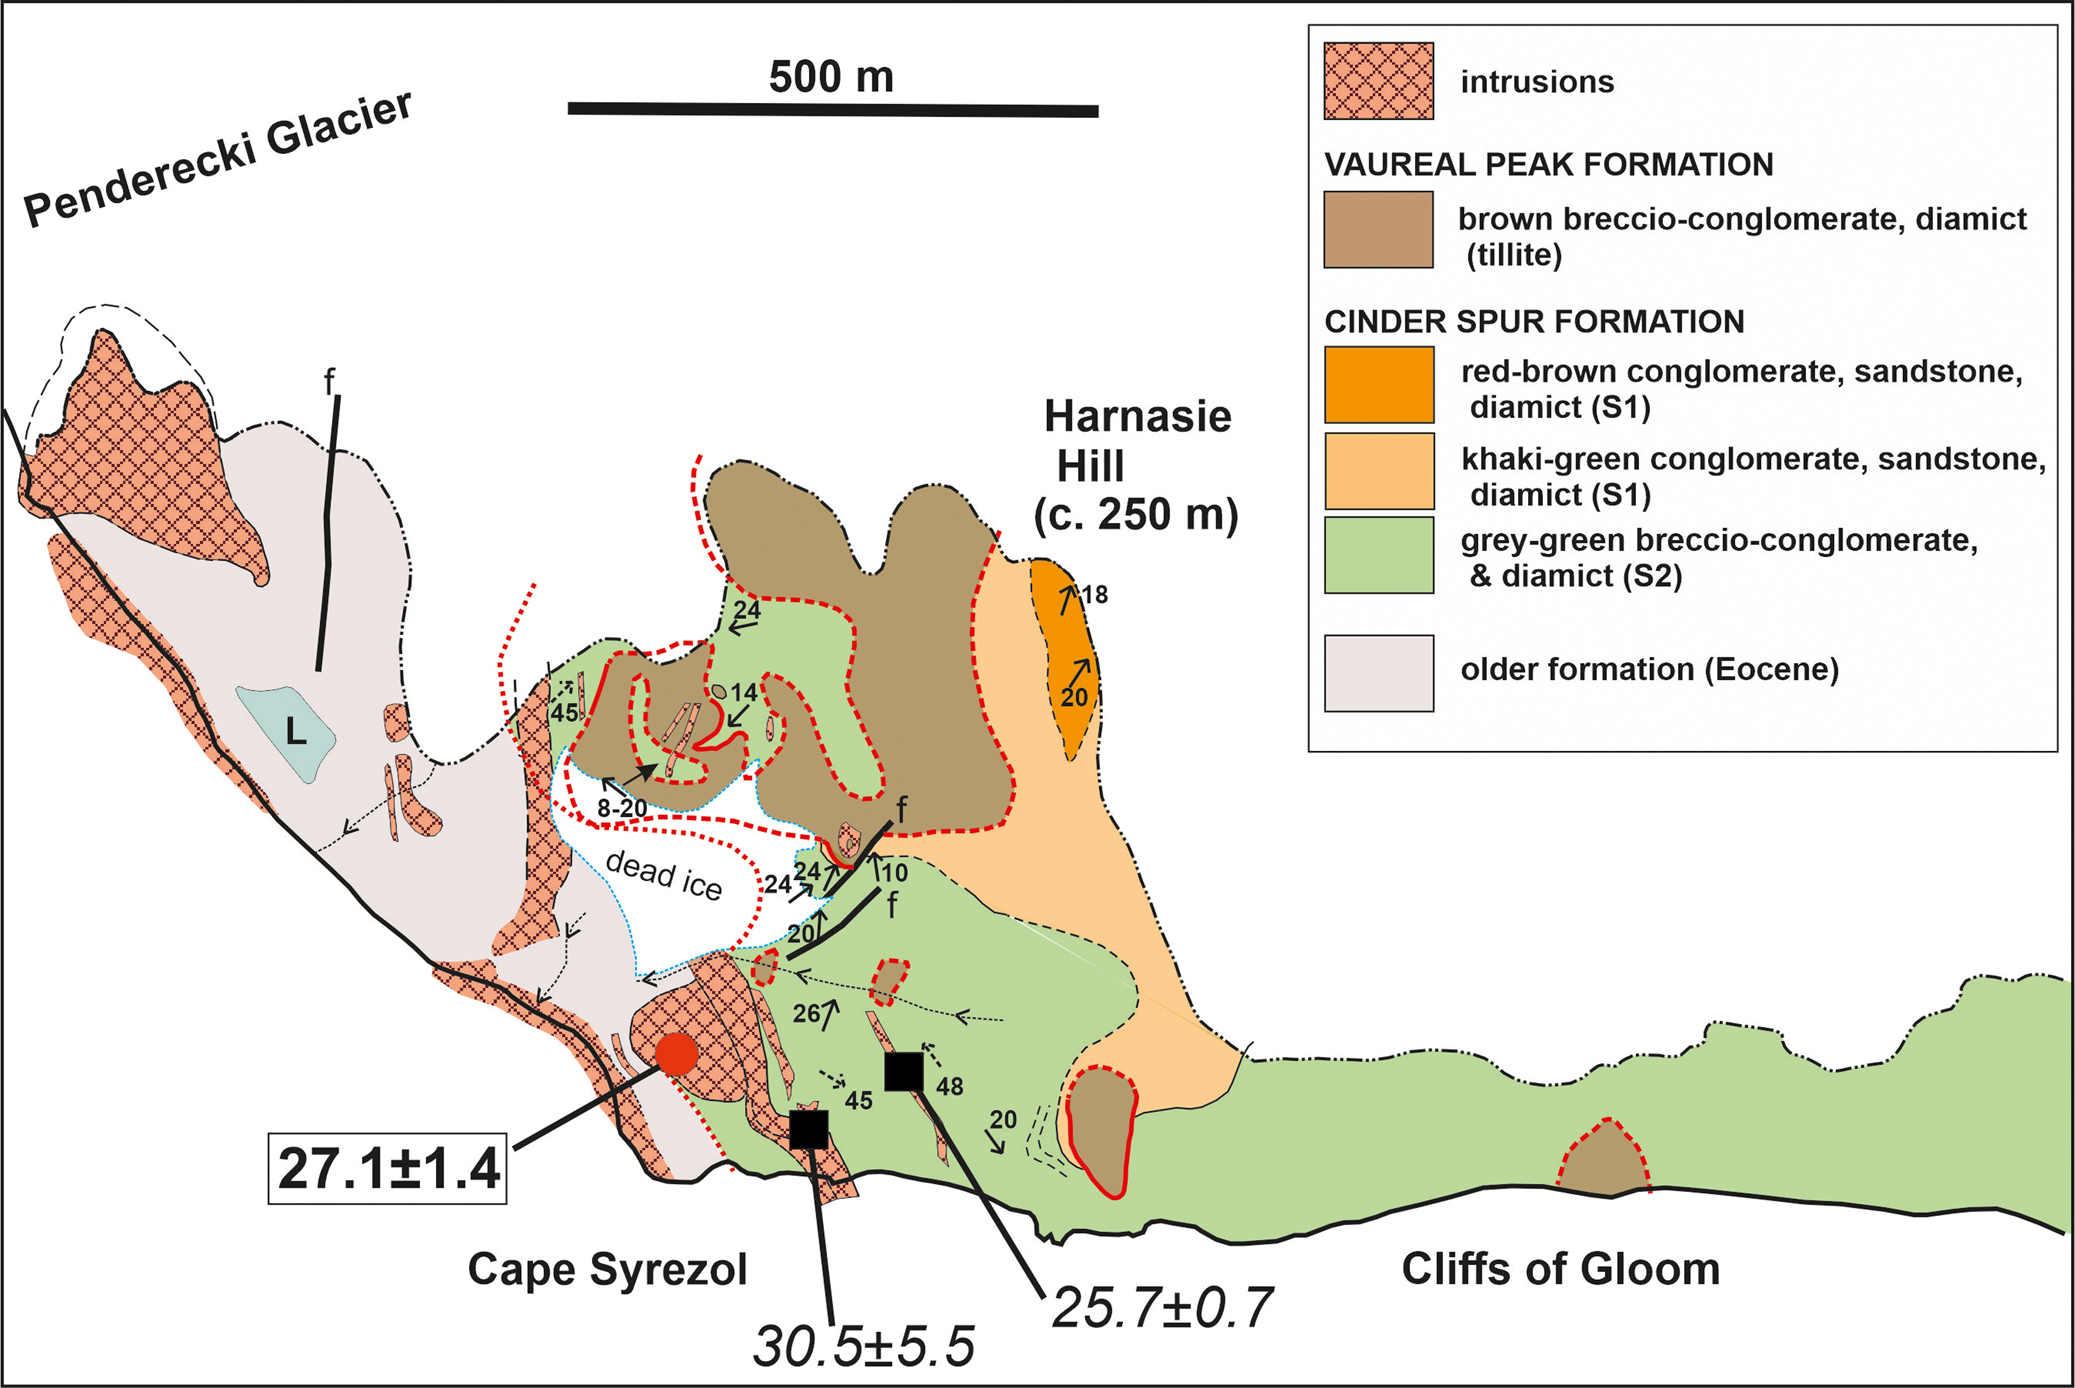
Geological map of the Harnasie Hill area. See Fig. 3 for explanation of additional symbols.
At the type locality at Cinder Spur, the succession is formed of at least three unconformity-bounded sequences, as follows: 1) a lower sequence formed of two lavas, which Birkenmajer (Reference Birkenmajer1982) assigned to his Boy Point Formation (reassigned here to the Cinder Spur Formation), 2) a middle sequence at least 200–250 m thick, composed of alternating lavas and lithologically variable volcaniclastic sedimentary rocks and 3) an upper, lava-dominated sequence. The sequences dip at low to moderate angles (10–38°, typically 20–25°) to the west-south-west, swinging round to more southerly dips in the western outcrops. Intraformational unconformities were observed rarely within the middle sequence but are probably quite common (e.g. that mapped at the base of the upper sedimentary sequence shown in Fig. 9). Fossils are absent, although possible plant stem impressions were observed on a bedding plane at a single locality. The variable dip orientations at the different localities further west on King George Island (Figs 12–14) suggest that the sequences were erupted from more than one volcanic centre, and that responsible for the sequence at Martins Head was formerly situated in Bransfield Strait (Fig. 11).
Lavas in the Cinder Spur Formation are conspicuously feldspar-pyroxene-phyric basalts and silica-poor basaltic andesites (Table III). Many contain minor, mainly iron oxide-altered amphibole phenocrysts. Olive green and red-brown amphibole crystals are also ubiquitous and conspicuous in the associated sedimentary strata, in lava clasts and as phenoclasts. The abundance of amphibole in the sedimentary rocks suggests that hornblende andesite or dacite lavas crop out in situ within the Cinder Spur Formation rather than the debris being derived solely by erosion and reworking of the Boy Point Formation. Thus, the lavas in both formations may share a similar petrogenesis. They consist of massive centres encased in autobreccia characteristic of subaerial ‘a’ā effusion. Fresh clinopyroxene is particularly characteristic and conspicuous, occurring as abundant, often large phenocrysts (and phenoclasts in the interbedded sediments) up to several millimetres in length. Brown juvenile clast-rich muddy diamictites (slurry-flow deposits) occur directly beneath many of the individual lavas in the type section. Lavas at Cinder Spur are typically c. 10 m thick, rising to c. 25 m. Elsewhere, lava thicknesses are more variable, with massive portions ranging from c. 5 m to 30 m encased in relatively thin (few metres), pale grey to pink, scoriaceous autobreccia.
Sedimentary sequences interfinger with lavas throughout the Cinder Spur Formation. Two distinctive types of sedimentary sequences are present and are distinguished by stratification, colour and the dominant lithofacies. Type 1, which is less common except at Cinder Spur, consists of well-stratified, relatively thin-bedded, multi-coloured (mainly pale khaki-grey and red) fine conglomerate, gravelly sandstone and diamictite (Fig. 7f). Type 2 comprises poorly stratified, thick-bedded, mainly grey green coarse and fine conglomerates and breccio-conglomerates (Fig. 7g). The commonest and most widespread sedimentary lithofacies in the type 1 sedimentary sequences are pale-coloured, khaki-grey, green and red gravelly sandstones, granule and pebble conglomerates and purplish-brown pebbly mudstone diamictites. Although the colours often appear to be stratigraphically confined, they are also commonly vagrant and follow fractures that cross the local sequence irregularly. The lithologies are planar bedded and remarkably continuous on an exposure scale, most beds being restricted only by erosive channels. Channels are conspicuous and characteristic, usually several tens of metres wide and a few metres to sometimes tens of metres deep. Pale khaki-coloured juvenile lava lapilli with a wide range of sizes are common. However, the clast population is polymict, formed of locally derived feldspar-clinopyroxene-phyric lavas, with or without hornblende phenocrysts. Most beds are massive.
The more common type 2 sedimentary sequences are dominated by grey green, poorly sorted granule to small-pebble conglomerates, breccio-conglomerates and diamictites with abundant sandstone matrix and numerous dispersed sub-rounded-angular pebbles to boulders. As in the type 1 deposits, many clasts ≤ 2 cm are essentially monomict, formed of yellow juvenile lapilli, whereas clasts > 2 cm are polymict, dominated by locally derived lavas. Bedding is often difficult to discern but is planar and mainly up to 1 m thick. Most beds are massive. Some beds of coarse breccio-conglomerate are up to 10 m thick, with abundant fine sandstone or mudstone matrix; many display a strong bed-parallel fissile jointing. A particularly thick deposit of diamictite and conglomerate underlies the upper lava sequence at Cinder Spur, and it occupies a channel at least several tens of metres deep cut in the middle sequence at that locality.
As at Cinder Spur, lavas are subordinate or sub-equal to sedimentary strata in outcrops at Retreat Bluffs, Stanczyk Hill and Bremner Bluff, but they are dominant at Martins Head and Malczewski Point (Figs 13 & 14). By contrast, the Harnasie Hill outcrop is entirely sedimentary (Fig. 12). The exposed sequences are c. 250 m thick at each of the three main outcrops (Stanczyk Hill, Martins Head, Harnasie Hill). The bedding dips generally to the west or south-west, but it is more variable at Harnasie Hill. Interbedded sedimentary sequences individually up to 25 m in thickness are common in the summit succession at Martins Head and at Malczewski Point and Stanczyk Hill. They are mainly type 2 sequences of khaki to greenish-coloured, thick-bedded (> 1–2 m, up to 6 m) sandy coarse breccio-conglomerates or polymict volcanic breccias, in very thick (up to > 14 m) massive beds, together with brown-coloured muddy diamictites. In contrast, a 9 m-thick type 1 sequence of planar-bedded, multi-coloured muddy fine diamictites, less common pebbly conglomerates and coarse sandstones with large-scale channel scars crops out near the base of Stanczyk Hill, and binocular observations suggest that similar rocks are present in inaccessible Retreat Bluffs (Fig. 13). Type 1 and type 2 sedimentary sequences are also present at Harnasie Hill, where the thickest accumulation of type 2 sequence is present (≥ 200 m thick; Fig. 12). It is the type area for the Harnasie Hill Formation of Birkenmajer (Reference Birkenmajer1982, p. 45), described as ‘Basaltic lapilli tuff and breccia … alternating with agglomerate, tuff-sandstone and tuff-shale, … porphyritic basalt lava flow and lava-agglomerate-conglomerate intercalations‘. The whole sequence was interpreted as a basaltic cinder cone deposit. However, despite the presence of yellow to pale green (?)juvenile granule-size lapilli, which may be abundant locally, the deposits are overwhelmingly sedimentary. The strata at each locality are polymict except at Cape Syrezol, where the basal 25 m of the seaward-facing cliffs are formed by massive to crudely planar stratified, dark green, fine vitroclastic deposits, at least some of which are probably pyroclastic (coarse tuffs). Whilst the clasts characteristically appear to be locally derived lavas of the Cinder Spur Formation, a large block a few metres in diameter, composed of pale purple fissile lava with prismatic amphibole, was observed locally; the clast has a remarkable resemblance to lavas in the Boy Point Formation, and a similar hornblende andesite cobble was observed in muddy diamictite at Martins Head. The Harnasie Hill sedimentary strata are in faulted contact with lavas just west of Martins Head (Fig. 14).
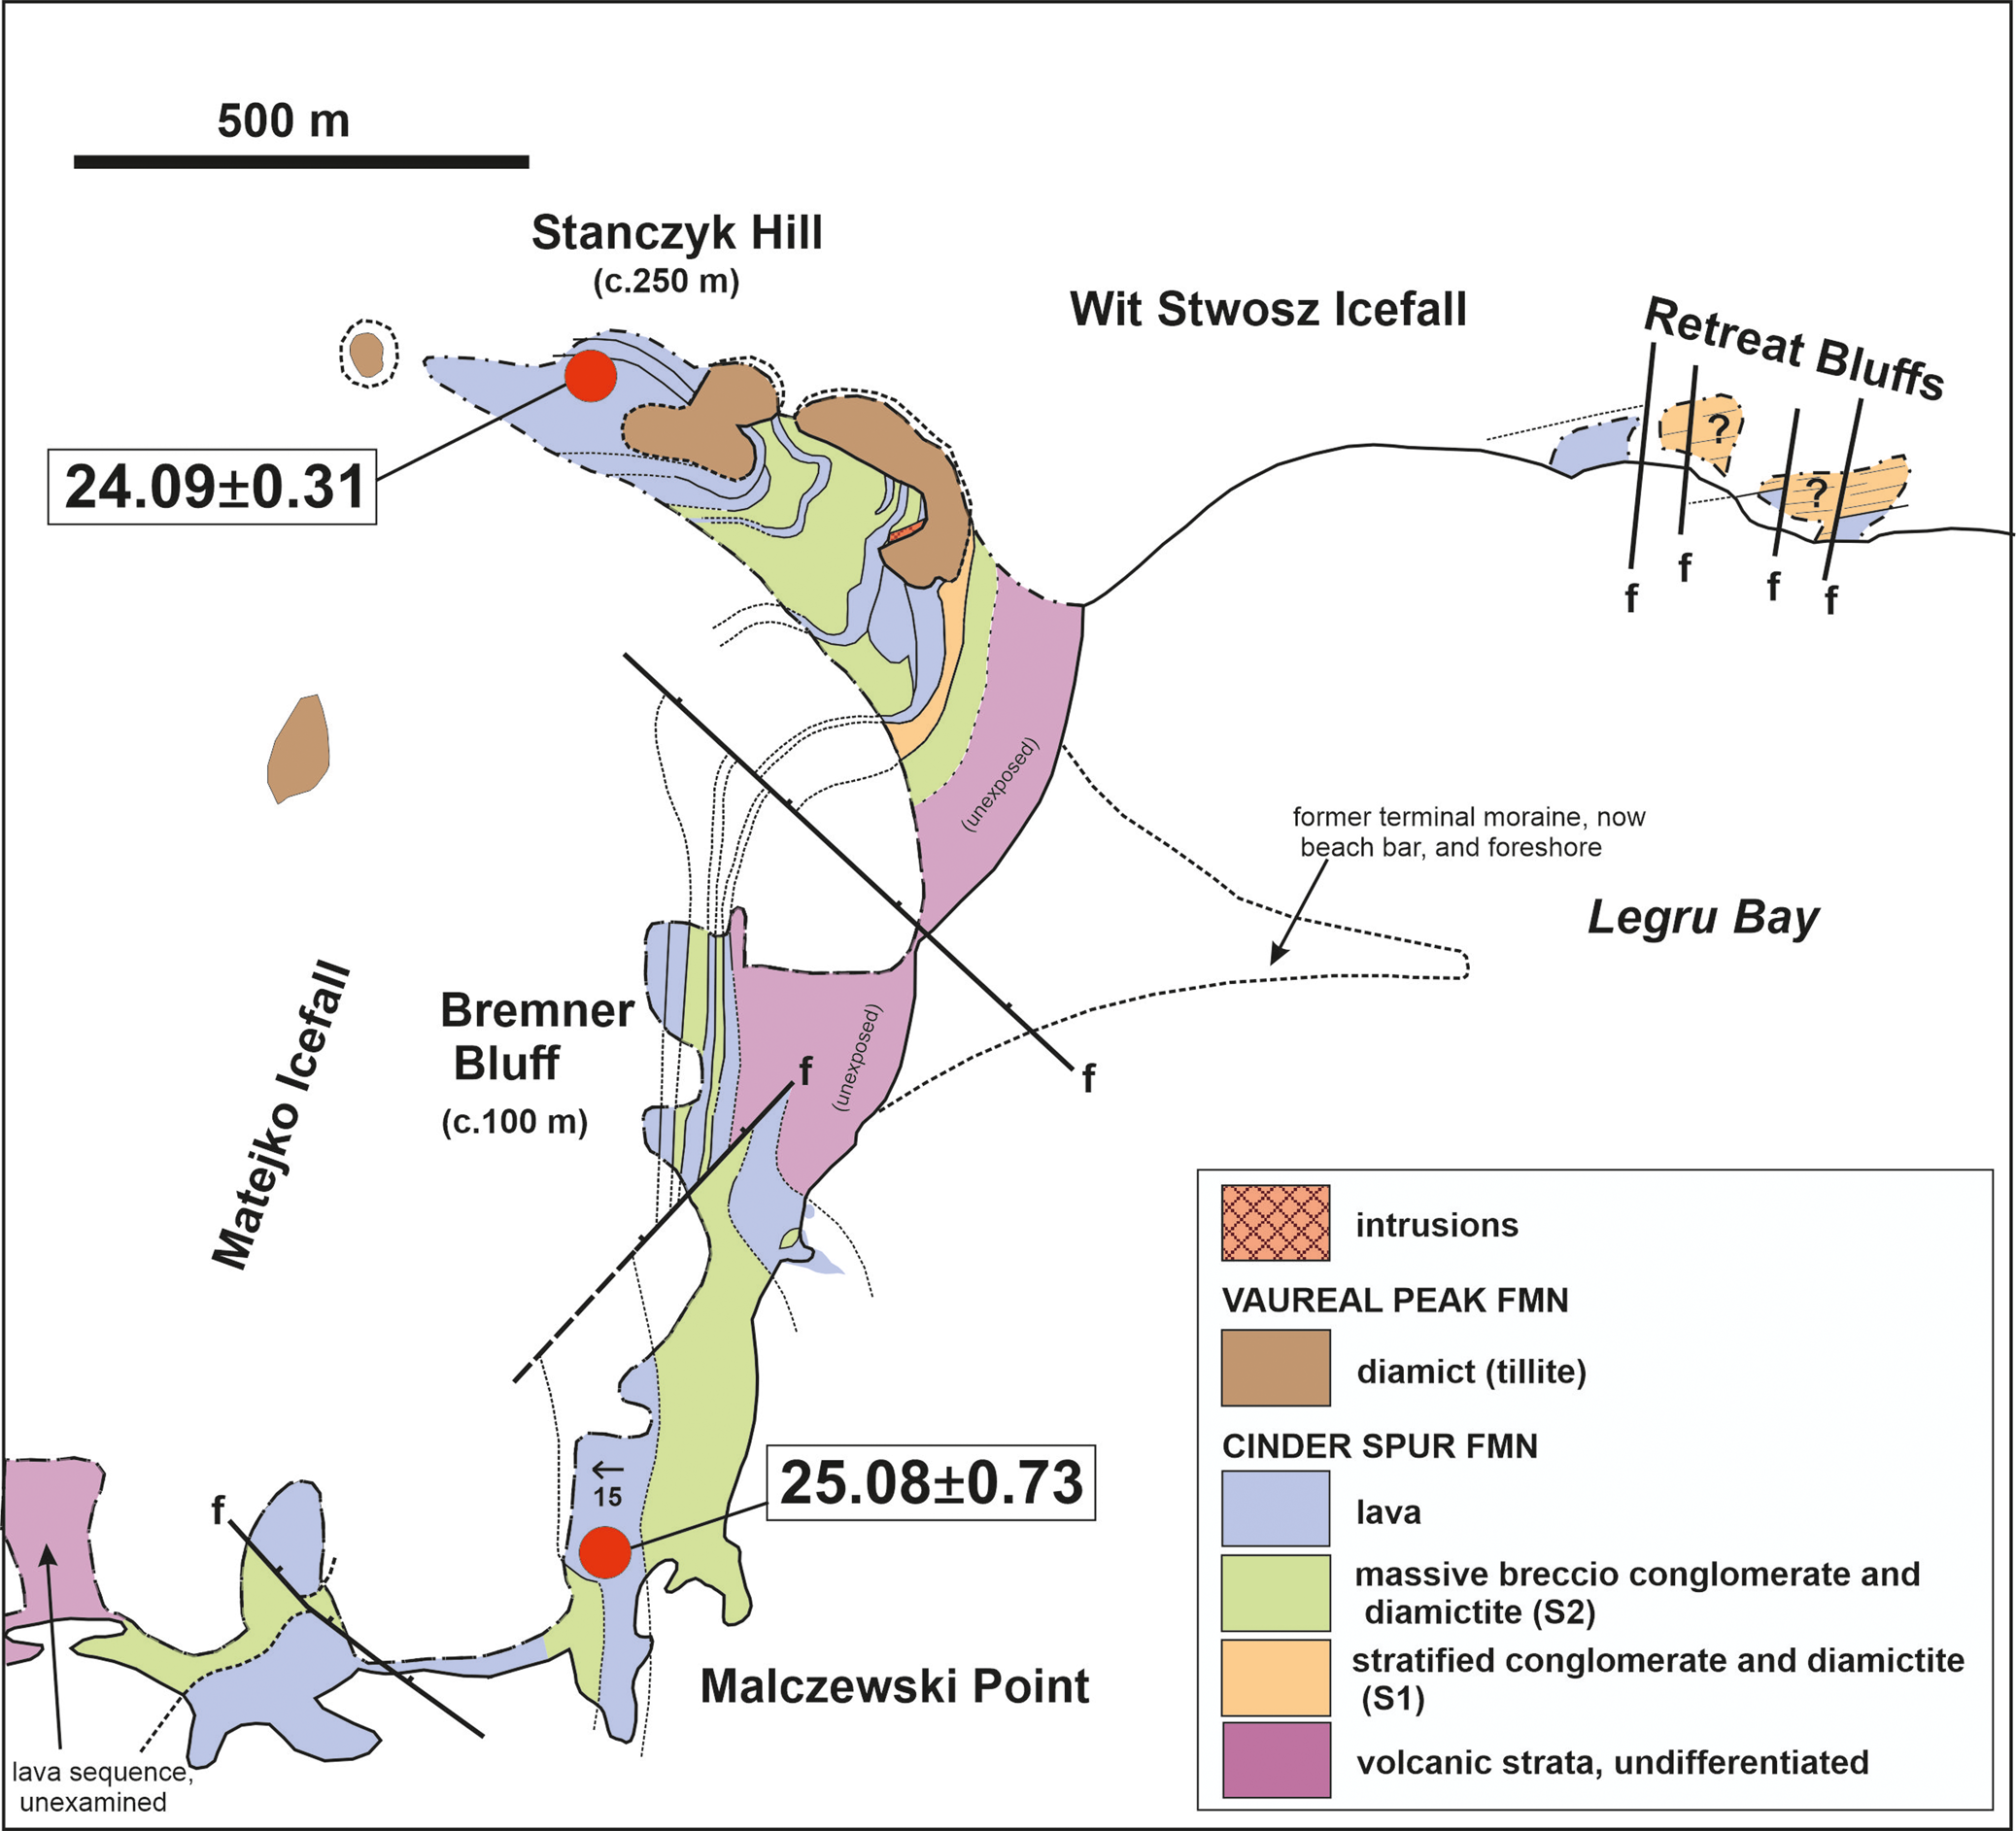
Geological map of the Stanczyk Hill-Malczewski Point area. See Fig. 3 for explanation of additional symbols.
Lastly, Conglomerate Nunatak (Fig. 1) was mapped previously as green basaltic conglomerate of the Polonez Cove Formation (Low Head Member), probably on the basis of the presence of blocks of fossiliferous Polonez Cove Formation lying nearby (not observed during our study; cf. Birkenmajer Reference Birkenmajer1982; see also Tokarski et al. Reference Tokarski, Paolo and Rubinowski1981). The conglomerate was said to be overlain by tuff, agglomerate and lava of the Boy Point Formation. However, the outcrop is formed entirely of unfossiliferous, clast-supported breccio-conglomerate and conglomerate. The deposits are khaki or grey-coloured, rich in pale grey juvenile clasts and crudely stratified in the south-west exposures, changing south-eastwards into massive green strata dominated by basalt lava clasts. They are pervasively and prominently red-stained in places. The closest overall resemblance is to sedimentary strata in the Cinder Spur Formation, possibly both type 1 (south-west) and type 2 (south-east) sequences, with which the outcrop is provisionally correlated.
Vauréal Peak Formation
The study area contains the type section for the Vauréal Peak Formation (also informally called the Vauréal Peak tillite; Birkenmajer Reference Birkenmajer1982) at Vauréal Peak (Fig. 4). Its age is unknown but inferred to be c. 25 Ma (Birkenmajer et al. Reference Birkenmajer, Soliani and Kawashita1989). The formation has a minimum thickness of c. 70 m. It is formed of a khaki-brown to brownish-green massive coarse diamictite dominated by brown siltstone-fine sandstone matrix (30–70%) in which are dispersed angular-subangular (rarely well-rounded), coarse sand to cobble-sized polymict lava clasts. Similar to sedimentary rocks in the underlying Cinder Spur Formation, well-formed phenoclasts of clinopyroxene are common, plus lesser amphibole, and practically all of the lithic clasts are of feldspar-pyroxene-phyric basalt lavas with minor hornblende andesite or dacite. Large blocks of sandstone and granule conglomerate several metres in length similar to type 2 sequence rocks of the Cinder Spur Formation were also observed in basal diamictite at one locality (the so-called ‘fossil ice wedge’ locality described by Birkenmajer Reference Birkenmajer1982, figs 22 & 23). K-Ar whole-rock isotopic dating of a lava block in the outcrop near Vauréal Peak yielded an Eocene age (47.0 ± 1.1 Ma; Birkenmajer et al. Reference Birkenmajer, Soliani and Kawashita1989), indicating that some Eocene outcrops also contributed clasts to the Vauréal Peak Formation. A small proportion of outsize blocks is also present, up to 2.3 m in diameter (generally < 50 cm), but with at least one likely megaclast 3–4 m across, composed of Cinder Spur Formation lava breccia (Smellie et al. Reference Smellie, Hunt, McIntosh and Esser2021). Several of the larger blocks are fractured, and fine matrix from the diamictite infills the fractures and extends as thin veinlets a short distance into the surrounding diamictite (sketched in Birkenmajer Reference Birkenmajer1982, fig. 22). Stratification occurs very rarely within the Puchalski Peak outcrop (Fig. 4), comprising faintly (often wispy) stratified gravelly conglomerate, pebble trails and wavy (disturbed) planar laminated sandstone. The stratification is typically 10–20 cm thick and extends laterally only a few metres before fading out into massive diamictite. This is not the large-scale (?)stratification-like ‘plastic folds-undulations’ [sic] alluded to by Birkenmajer (Reference Birkenmajer1982, fig. 14), which were not observed by us.
The Vauréal Peak Formation occupies a V-shaped palaeovalley with steep to sub-vertical margins in the type locality outcrop between Vauréal Peak and Cape Vauréal (Fig. 4). The margins are well exposed at two localities, and features interpreted as a fossil ice wedge at one were described by Birkenmajer (Reference Birkenmajer1982). At the latter, lava of the adjacent outcrop of the Eocene Hennequin Formation is brecciated and contains scarce admixed fragments of possible Cape Vauréal Formation lava (also Eocene) and a few of dolerite (for a description of the Eocene stratigraphy, see Smellie et al. Reference Smellie, Hunt, McIntosh and Esser2021). The breccia grades laterally downwards through jigsaw-fractured lava into massive Hennequin Formation lava and up into Vauréal Peak Formation diamictite. Birkenmajer (Reference Birkenmajer1982) also recorded glacial striations on a surface of Eocene (Hennequin Formation) lava beneath the lava breccia just described, but they were not observed by us.
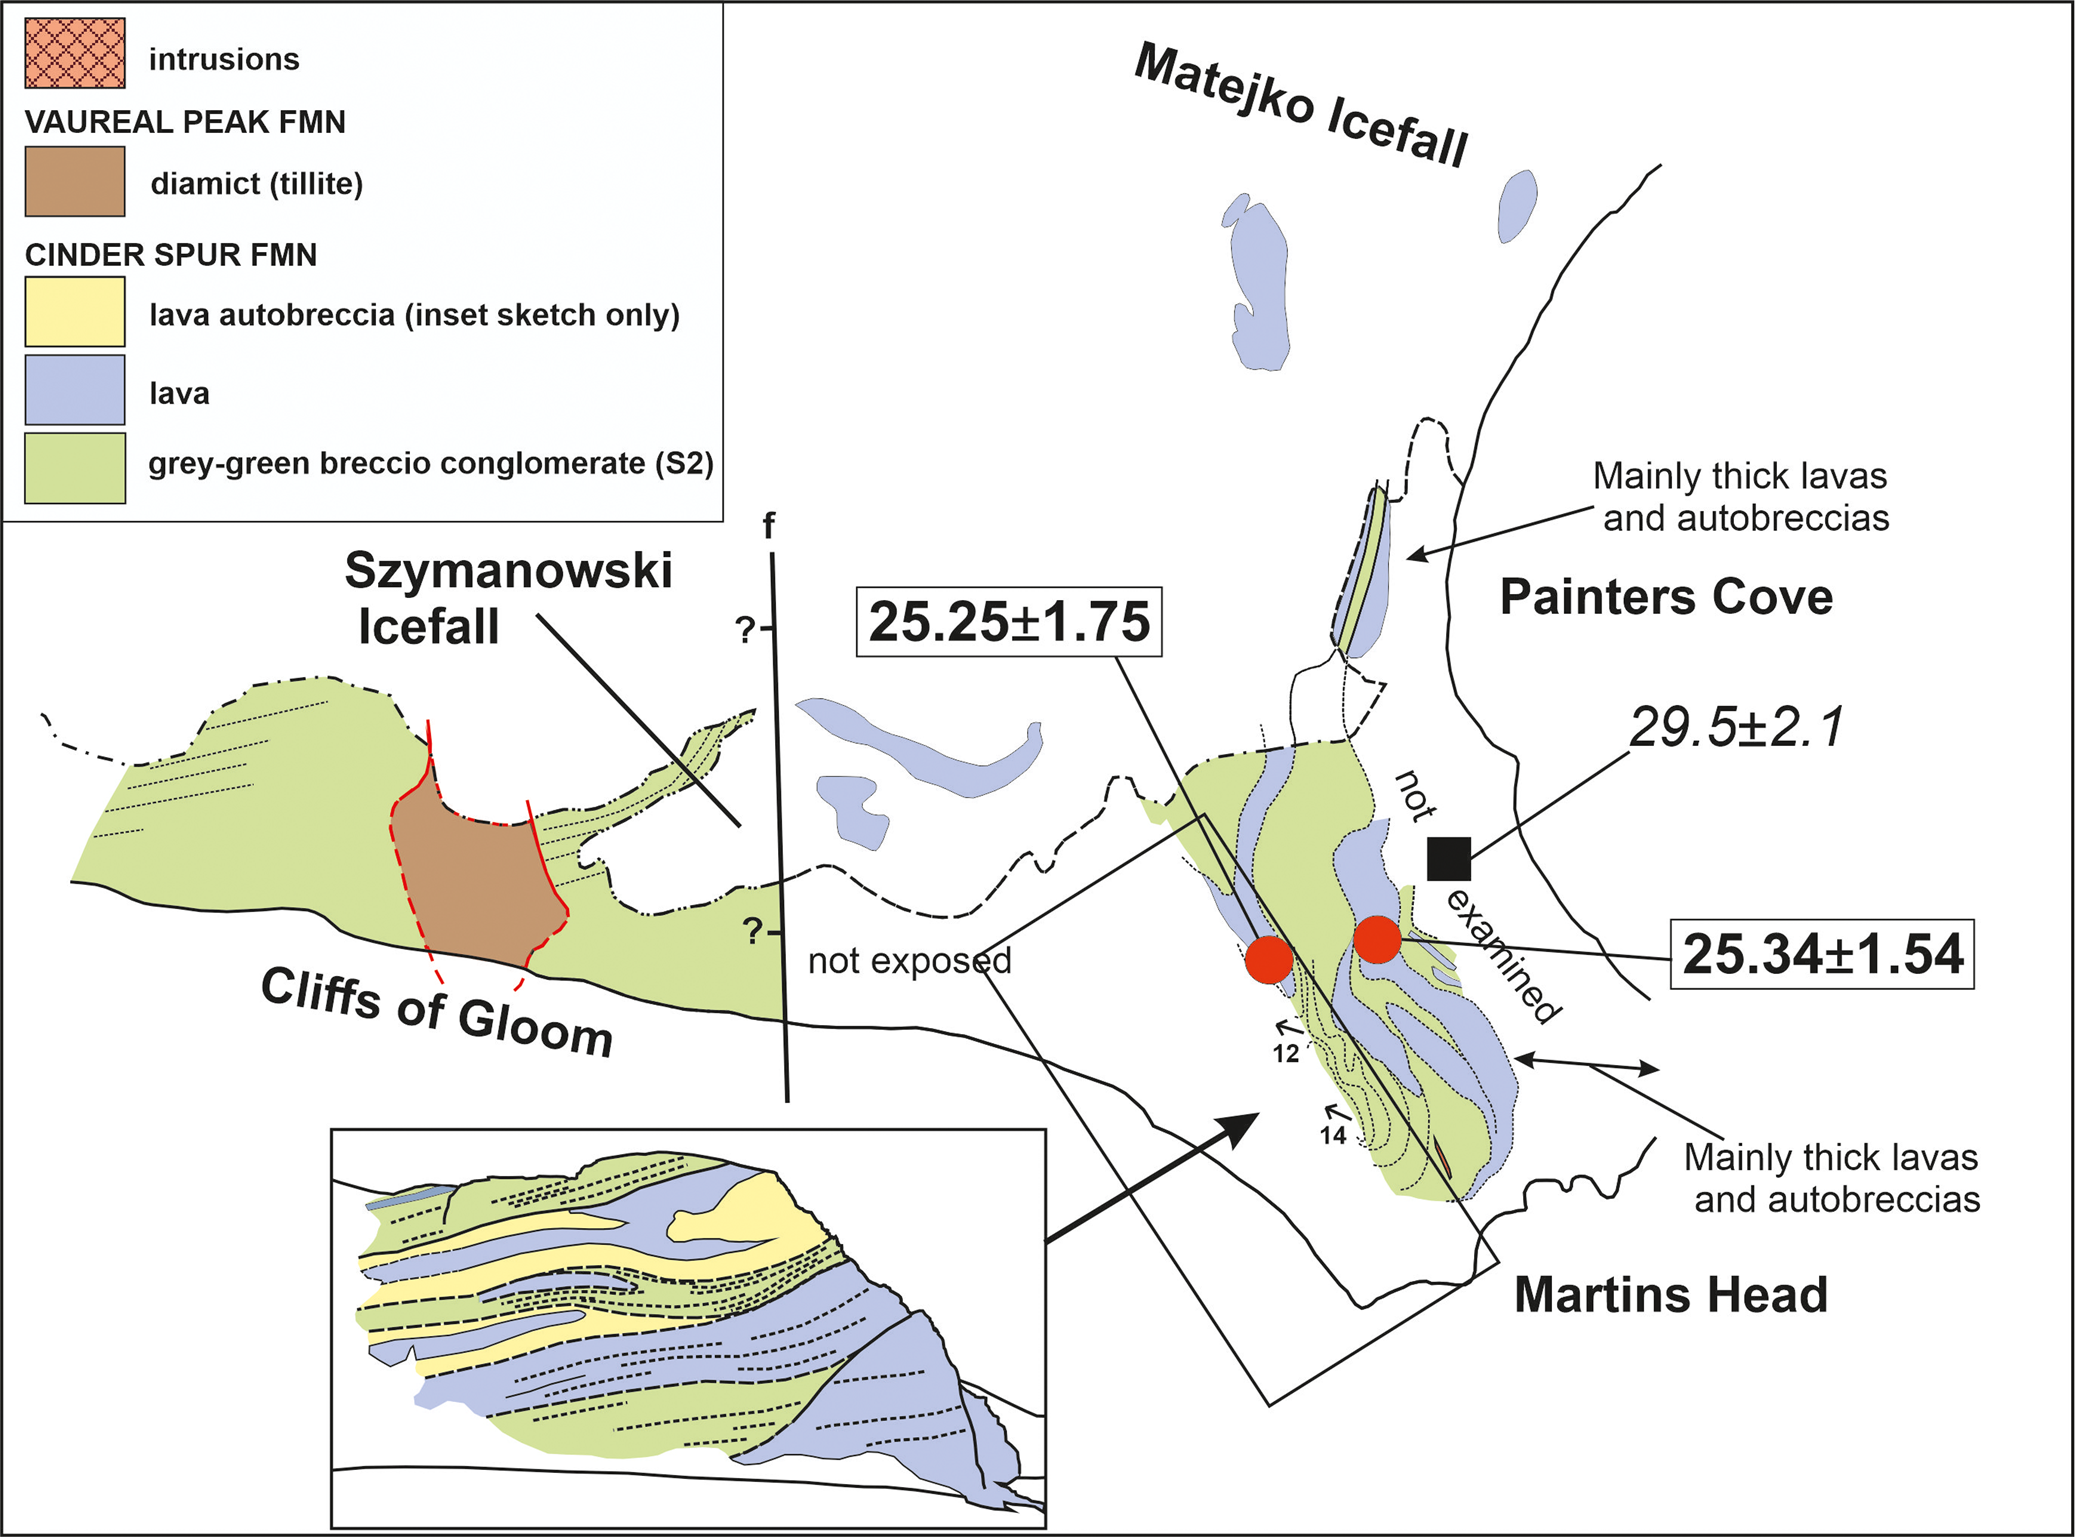
At Puchalski Peak, the Cape Vauréal Formation unconformably drapes a narrow west-south-west-trending ridge composed of steep-dipping pyroxene-feldspar-phyric lavas (correlated with the Eocene Carruthers Cliff Formation of Vauréal Peak; Smellie et al. Reference Smellie, Hunt, McIntosh and Esser2021) and dolerite (Fig. 4). Both the lavas and dolerite are heavily fractured, with the intensity of fracturing increasing close to the contact with the Cape Vauréal Formation. At Stanczyk Hill, Cape Syrezol summit and west of Martins Head, diamictite forms a spectacular exposure draped on and over the Cinder Spur Formation (Figs 13–15). The basal erosional surface cuts down at least 250 m, and diamictite adheres to almost vertical rock faces at three places in the Cliffs of Gloom (Fig. 7h).
Geological map of Martins Head. See Fig. 3 for explanation of additional symbols. The geological details shown in the Cliffs of Gloom and in the inset are based on binocular observations.
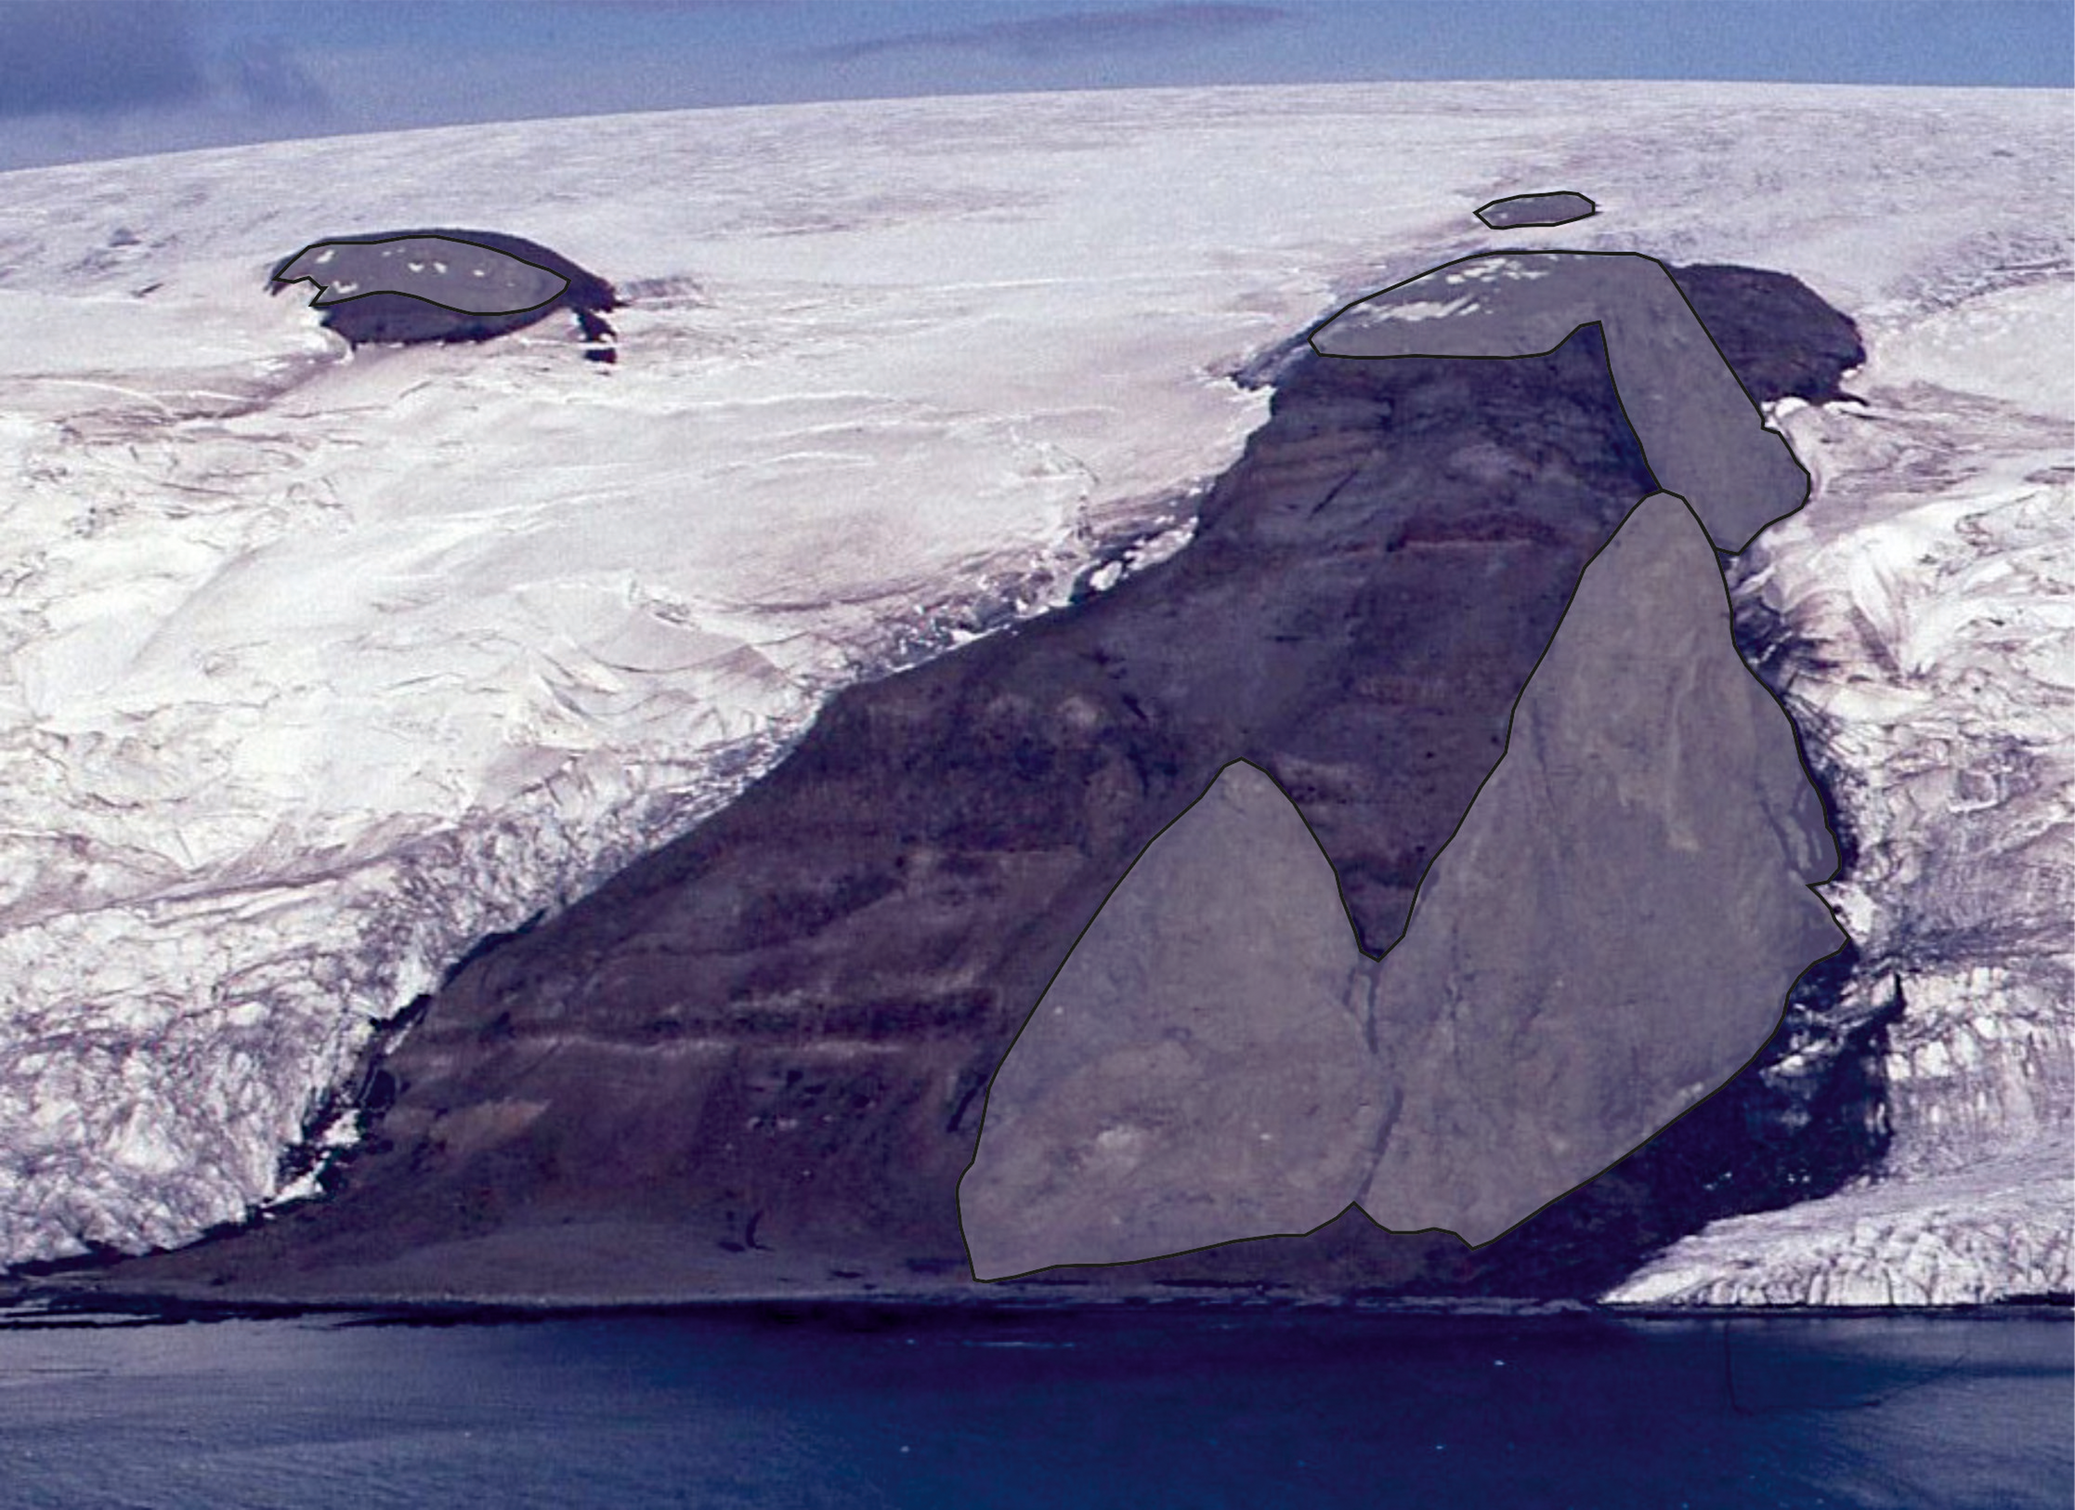
View of Stanczyk Hill from Cinder Spur, showing outcrops of Vauréal Peak Formation diamict (grey) draped over lavas and clastic rocks of the Cinder Spur Formation. The diamict drapes an eroded surface cut c. 250 m down into the volcanic sequence, which is being exhumed as the diamict is eroded away.
Outcrops of the Vauréal Peak Formation at Harnasie Hill (Fig. 12) rest on an uneven undulating palaeotopography developed on the Cinder Spur Formation. Additionally, at one locality, sedimentary strata in the underlying Cinder Spur Formation are very disturbed, with bedding dips varying irregularly from 8° to 20° in a zone a few metres wide close to the Vauréal Peak Formation.
Intrusions
Hypabyssal intrusions, including dykes, sills and irregular sheets of basalt and dolerite, are generally minor in the areas studied except at Harnasie Hill, where they are common and conspicuous, although mainly intruding Eocene strata (Fig. 12). The largest individual examples are ‘mega-dykes’ at Cinder Spur and the Chopin Dyke north of Low Head (130 and 75 m wide, respectively); a plug-like mass c. 125 m in diameter at Cape Syrezol; and a thick (several tens of metres) northerly inclined sheet at Sukiennice Hills (Figs 3, 9 & 12). The latter was interpreted as a sequence of dipping thin lavas by Birkenmajer (Reference Birkenmajer1994), and together with adjacent poorly exposed volcaniclastic rocks, they were combined in his Sukiennice Hills Formation, undated but with an estimated age speculatively thought to be close to the Eocene-Oligocene boundary (but see Smellie et al. Reference Smellie, Hunt, McIntosh and Esser2021). Although no contacts are exposed, the relatively coarse dolerite textures and presence of pervasive crude ‘layer-like’ structures dipping at 22–44° to the north, contrasting with the shallower (mainly c. 20°) southerly dips of the adjacent sedimentary strata, are distinctive features that are also seen in dolerite sills elsewhere in the South Shetland Islands (e.g. at Hall Peninsula (Snow Island), Williams Point (Livingston Island), Duff Point (northern Greenwich Island) and Fort William (Robert Island; Smellie et al. Reference Smellie, Pankhurst, Thomson and Davies1984, figs 21 & 22). Additionally, although the Sherratt Bay Formation at Cape Melville (Fig. 1) is currently interpreted as a ‘terrestrial plateau-basalt sheet’ > 60 m thick, and it is included in the Moby Dick Group (Table I; Birkenmajer Reference Birkenmajer1987), it is also doleritic, with pervasive columnar jointing and coarse (1–2 cm diameter) nodular textures on weathered surfaces caused by zeolite alteration (cf. Birkenmajer Reference Birkenmajer1987, and unpublished information of JLS). A thick dyke on the north flank of the eastern tip of Cape Melville intrudes the Cape Melville Formation and appears to be continuous with the underlying Sherratt Bay Formation (observation of AT). The nodular surface was interpreted as a hydrothermal and weathering feature created prior to deposition of the Destruction Bay Formation, implying an age older than the Destruction Bay Formation (Birkenmajer et al. Reference Birkenmajer, Soliani and Kawashita1988b). However, similar distinctive nodular textures occur in several of the dolerites listed above and were caused by deuteric alteration rather than weathering. The sum of the features we have described, particularly if the connection with a dyke is verified, is more characteristic of an intrusion (mainly a sill), albeit possibly a large one, or more than one, with a possible outcrop extending across Destruction Bay to Trowbridge Island (Fig. 1). The sill has not been accurately dated, but it yielded a poor K-Ar age of > 18 Ma (Birkenmajer et al. Reference Birkenmajer, Gaździcki, Kreuzer and Müller1985). Finally, the columnar-jointed oval outcrop at Low Head, regarded as a sub-volcanic plug by Birkenmajer (Reference Birkenmajer1982; see also Smellie et al. Reference Smellie, Pankhurst, Thomson and Davies1984), is not an intrusion. It is a small lava dome with associated carapace breccia extruded in a submarine setting coeval with deposition of the Oligocene Polonez Cove Formation, in which it is grouped within the Low Head Member (subunit L1 of Troedson & Smellie Reference Troedson and Smellie2002; see Smellie et al. Reference Smellie, Millar, Rex and Butterworth1998).
Summary of main stratigraphical results
As a result of our investigation, significant changes that we propose to the lithostratigraphy of eastern King George Island are summarized as follows (cf. Tables I & II):
1) The Magda Nunatak Complex, formerly thought to be Eocene in age, is reassigned to the Oligocene Polonez Cove Formation, as originally suggested by Tokarski et al. (Reference Tokarski, Paolo and Rubinowski1981).
2) The Wesele Cove Formation is shown to underlie the Boy Point Formation, a reverse of the published stratigraphy. Moreover, it is now known to be sandwiched between andesite-dacite lavas of the Boy Point Formation; as a result, the Wesele Cove Formation is reclassified here as a member of the Boy Point Formation.
3) The Harnasie Hill Formation, previously interpreted as a discrete stratum formed of agglomerate of a ‘cinder cone‘ that intervenes between the Dunikowski Ridge and Martins Head formations, is neither formed of agglomerate nor does it form a single mappable datum. It occurs as multiple packages of sedimentary rock interbedded throughout the volcanic sequence. Moreover, the overlying and underlying Martins Head and Dunikowski Ridge formations are lithologically indistinguishable. Thus, the three formations are combined into a single unified volcano-sedimentary unit here named the Cinder Spur Formation.
4) The Vauréal Peak Formation, a glacial diamict (tillite), is removed from the Legru Bay Group. It was previously linked stratigraphically with the underlying Martins Head, Harnasie Hill and Dunikowski Ridge volcanic formations. However, there is no obvious unifying characteristic that might be used to group together the different formations in the Legru Bay Group. Moreover, there is evidence for a substantial age gap between the Vauréal Peak Formation and the underlying units.
Chronology
Results of previous studies
Palaeontology: The Polonez Cove Formation (including the outlying sequence at Magda Nunatak) is highly fossiliferous but, because of recycling of fossils, it has proved hard to derive an unambiguous palaeontological age. Coccoliths, bivalves, gastropods, foraminifera, worms, echinoderms, bryozoans, coral, brachiopods, a diatom genus, algae and palynomorphs including dinoflagellates, spores, gymnosperm and angiosperm pollen, as well as stromatolites have all been described (see complete listing and references in Supplemental Information S3 & S4). The Low Head Member is the most diverse unit of the formation, but all of the members are fossiliferous to a variable extent. However, coccoliths are the only age-diagnostic fossils. They indicate an upper Early Oligocene to Late Oligocene age, usually quoted as c. 33–32 Ma (e.g. Gazdzicki & Pugaczewska Reference Gaździcki and Pugaczewska1984, Gaździcka & Gaździcki Reference Gaździcka and Gaździcki1985, Birkenmajer & Gaździcki Reference Birkenmajer and Gaździcki1986, Birkenmajer et al. Reference Birkenmajer, Dudziak and Tokarski1988a).
Isotopic dating studies: An age for the Polonez Cove Formation (Low Head Member) slightly younger than that suggested by the palaeontology was obtained based on 87Sr/86Sr isotopic analyses (i.e. c. 29–28 Ma; Dingle et al. Reference Dingle, McArthur and Vroon1997, Dingle & Lavelle Reference Dingle and Lavelle1998). Other 87Sr/86Sr ages of c. 32–30 Ma have also been reported for the Krakowiak Glacier Member, as well as 27.0 ± 0.3 Ma for the Chlamys Ledge Member, but the details are unpublished (K. Krajewski, cited by Warny et al. Reference Warny, Kymes, Askin, Krajewski and Tatur2019). However, widespread alteration of the shelly material in the Polonez Cove Formation generally (acknowledged by Dingle et al. Reference Dingle, McArthur and Vroon1997, Dingle & Lavelle Reference Dingle and Lavelle1998) makes the significance of the 87Sr/86Sr ages difficult to interpret, and only a general Oligocene age can currently be affirmed (see discussion later).
The age of the overlying Boy Point Formation is also not well known and has been based largely on bracketing by older and younger formations. It is generally believed to be c. mid-Oligocene by comparison with the age of 32–30 Ma assumed for the older Polonez Cove Formation (Birkenmajer Reference Birkenmajer1989), but that is apparently contradicted by a single published relatively imprecise 40Ar/39Ar age of 22.6 ± 1.7 Ma for a Boy Point Formation lava (Smellie et al. Reference Smellie, Millar, Rex and Butterworth1998) and a K-Ar age of > 23.6 ± 0.3 Ma for the basal lava of the Boy Point Formation, believed to be younged and not a true eruptive age (Birkenmajer et al. Reference Birkenmajer, Delitala, Narębski, Nicoletti and Petrucciani1986). K-Ar ages determined on the younger Cinder Spur Formation vary from 30.8 ± 2.0 Ma to 20.4 ± 2.4 Ma for lavas at Cinder Spur, 29.5 ± 2.1 Ma for lava at the top of Martins Head, to 17.3 ± 1.3 Ma for a tiny lava outcrop at Vauréal Peak (Birkenmajer et al. Reference Birkenmajer, Delitala, Narębski, Nicoletti and Petrucciani1986, Reference Birkenmajer, Soliani and Kawashita1989). The youngest two ages were thought to be reset (Birkenmajer & Gaździcki Reference Birkenmajer and Gaździcki1986); the small outcrop at Vauréal Peak is now thought to be a megaclast of the Cinder Spur Formation reworked within the Vauréal Peak Formation (Smellie et al. Reference Smellie, Hunt, McIntosh and Esser2021). Lastly, intrusions in the area were grouped by Birkenmajer (Reference Birkenmajer1982) into the Cape Syrezol Group. The only isotopic ages for the intrusions, all but one determined by the K-Ar method, are consistently Oligocene and Miocene. They comprise K-Ar ages of 21.8 ± 0.6 Ma for the Chopin Dyke, 21.9 ± 1.1 Ma for the Cinder Spur mega-dyke and 30.5 ± 5.5 and 25.7 ± 0.7 for dykes at Harnasie Hill (Birkenmajer & Gaździcki Reference Birkenmajer and Gaździcki1986, Birkenmajer et al. Reference Birkenmajer, Soliani and Kawashita1989). 40Ar/39Ar ages obtained on the Chopin Dyke (21.3 ± 1.6; 21.4 ± 1.9 Ma) are indistinguishable from the K-Ar age (Smellie et al. Reference Smellie, Millar, Rex and Butterworth1998). Despite the ‘plug’ at Low Head initially yielding a K-Ar age of 14.4 ± 1.4 Ma, which influenced its interpretation (Birkenmajer et al. Reference Birkenmajer, Delitala, Narębski, Nicoletti and Petrucciani1986), later dating by 40Ar/39Ar yielded older imprecise ages of 24 ± 2 Ma (Keller et al. Reference Keller, Fisk, White and Birkenmajer1992) and 23.7 ± 2.0 Ma (Smellie et al. Reference Smellie, Millar, Rex and Butterworth1998). Moreover, the surrounding breccia yielded a K-Ar age of 22.3 ± 0.8 Ma (Birkenmajer et al. Reference Birkenmajer, Gaździcki, Gradziński, Kreuzer, Porębski, Tokarski, Thomson, Crame and Thomson1991b), which is consistent with its cogeneity with the associated dome outcrop. Finally, a single preliminary 40Ar/39Ar age of 20.98 ± 3.14 Ma for the Cape Melville Formation was published by Troedson & Riding (Reference Troedson and Riding2002), but without supporting data. Although the Cape Melville Formation has been well studied and is not part of our study (for stratigraphical and lithofacies details, see Troedson & Riding Reference Troedson and Riding2002), refining its age is relevant to understanding the development of Oligocene-Miocene formations on King George Island, and it is included here for completeness.
Results of new 40Ar/39Ar dating
A total of 15 samples were dated, including a tuff interbedded with the glacio-marine Cape Melville Formation (Table IV, new Ar ages). Representative 40Ar/39Ar age spectra are shown in Fig. 16. Details of the methods used, analytical information, step-heating spectra and isotope correlation plots for all of the dated samples are provided in Supplemental Information S2. All errors quoted are 2σ. The sample locations and new ages, together with previously published ages, are shown in Figs 3, 9, 12, 13 & 14.
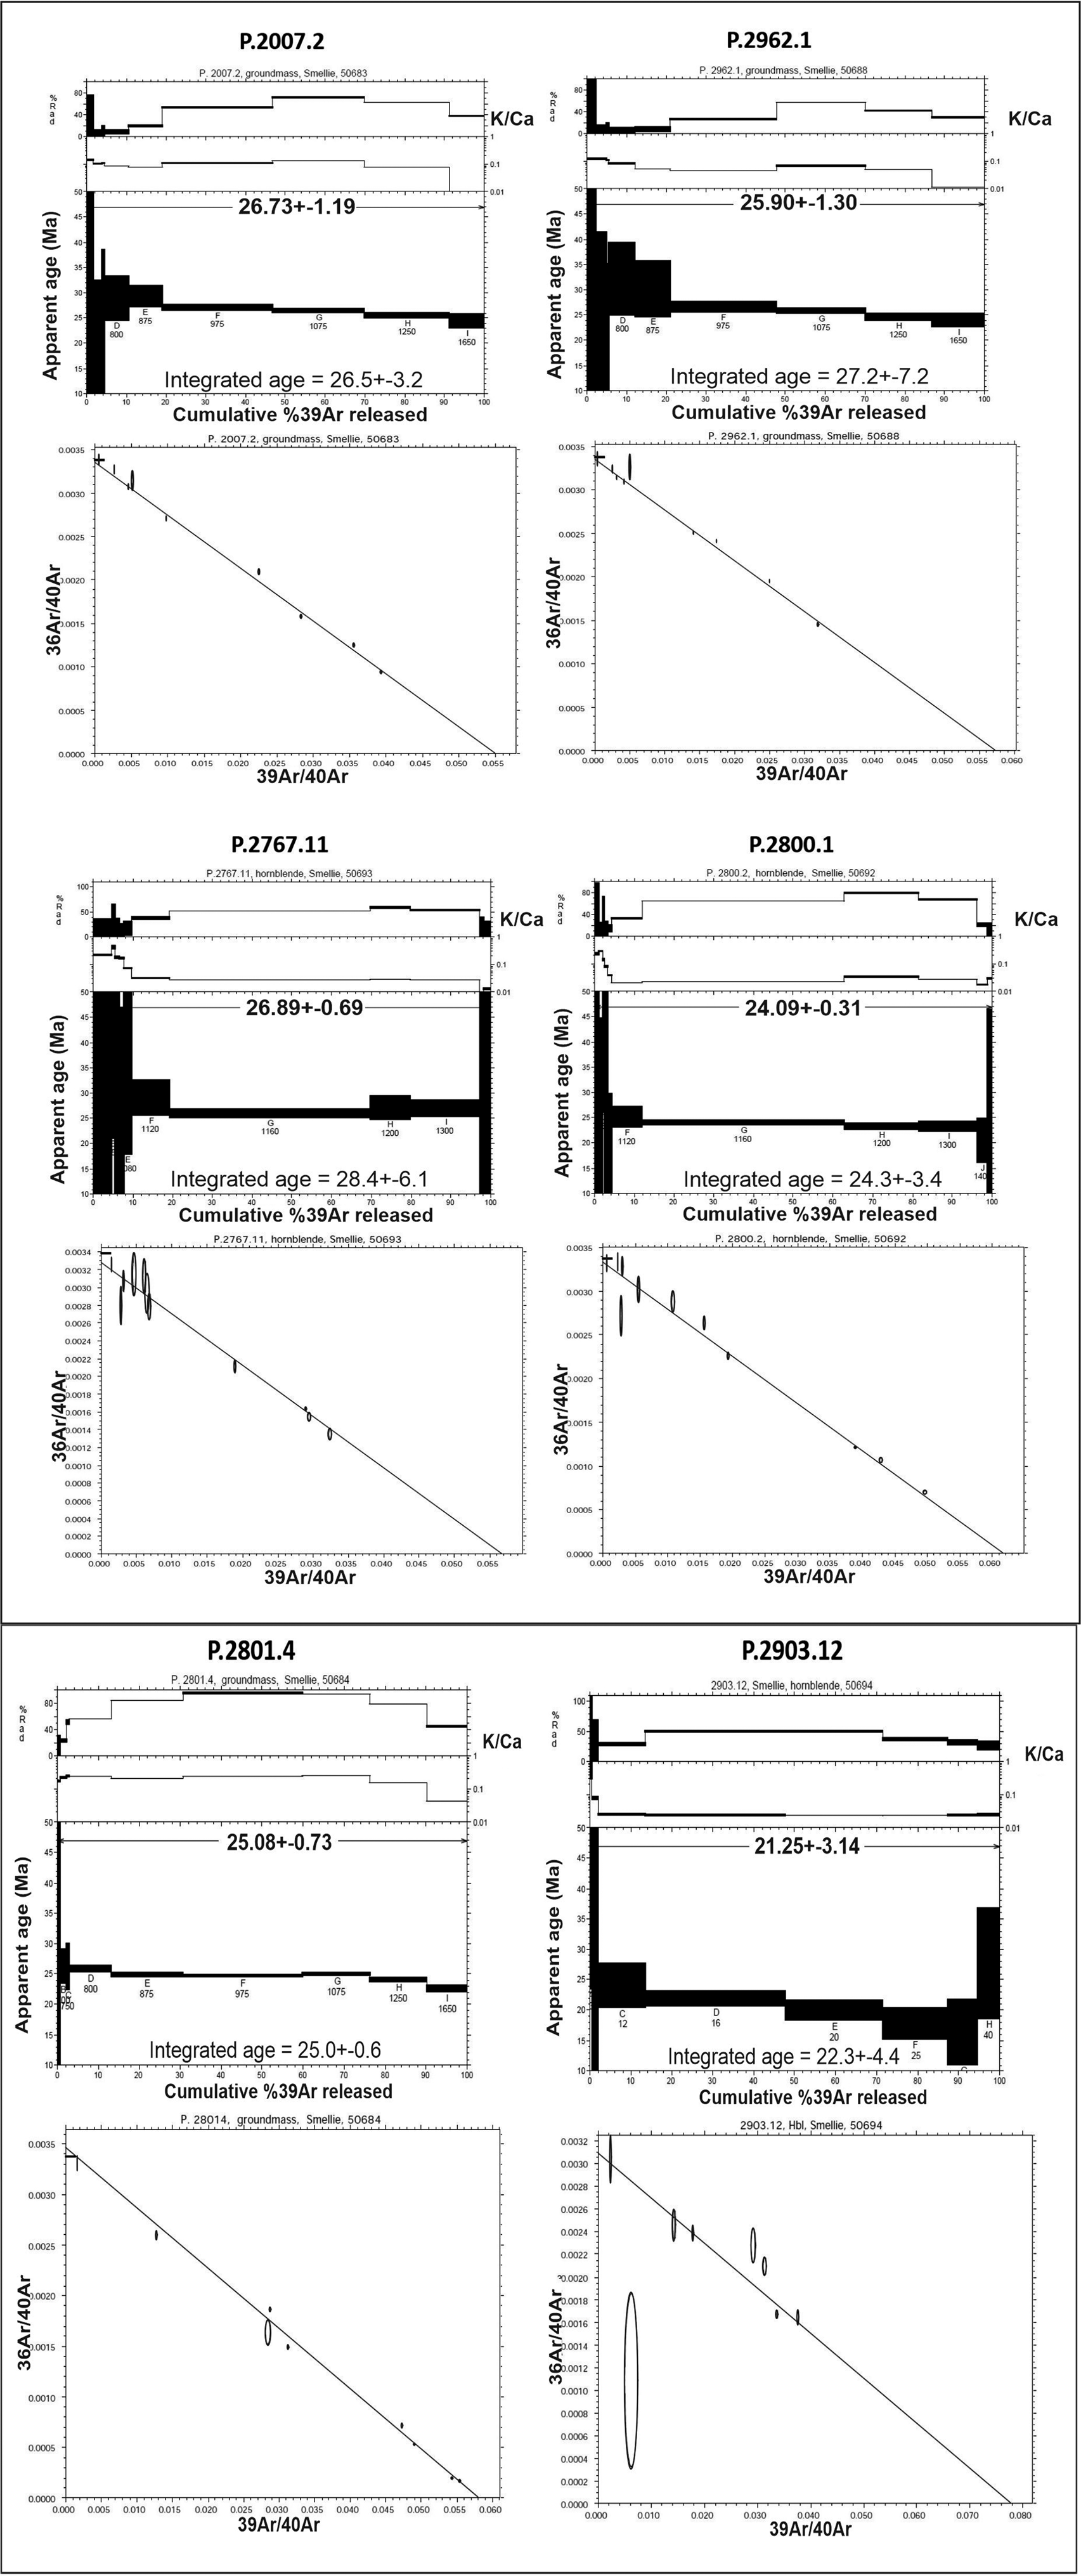
Representative 40Ar/39Ar age spectra for lava samples from the Polonez Cove Formation (P.2007.2; P.2962.1), the Boy Point Formation (P.2767.11) and the Cinder Spur Formation (P.2800.1, P.2801.4), and a tuff from the Cape Melville Formation (P.2903.12). See Table 2 and Supplemental Information S2 for analytical details.
Summary of 40Ar/39Ar results for King George Island lavas.
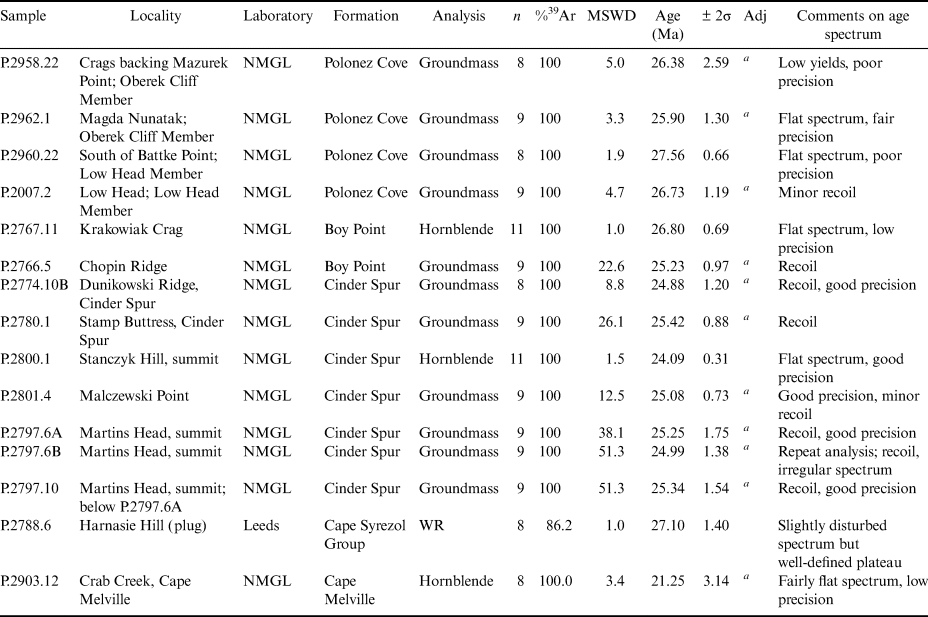
Notes: NMGL = New Mexico Geochronology Laboratory; WR = whole-rock crushed sample; n = number of heating steps; %39Ar = total fraction of gas released used in calculation of weighted mean age (always 100% for these recoil-prone samples, as discussed in Supplemental Information S2); Adj denotes high-MSWD samples with weighted mean errors multiplied by the square root of the MSWD.
a Calculated using Taylor/Mahon error (see Supplemental Information S2).
Polonez Cove Formation: Four samples were dated from volcanic members in the Polonez Cove Formation, in its type area and at Magda Nunatak. They include lavas from the Low Head and Oberek Cliff members and the small lava dome at Low Head (also Low Head Member). The new ages reported in this paper (Table IV) are stratigraphically consistent and within error, although the errors are relatively large. The new ages vary from 25.90 ± 1.30 Ma (Magda Nunatak; Oberek Cliff Member; Fig. 17) to 27.56 ± 0.66 and 26.38 ± 2.59 Ma south of Battke Point (Low Head Member) and facing Mazurek Point (Oberek Cliff Member). The Low Head dome (basal Low Head Member) is dated as 26.73 ± 1.19 Ma (Fig. 16). Together they provide a mean age for the Polonez Cove Formation (above the Krakowiak Glacier Member) of c. 26.64 ± 1.43 Ma. The data suggest that the duration of deposition was potentially c. 1.7 m.y. (27.6–25.9 Ma). However, the age range probably indicates that some of the Ar dates are less accurate than others for undetermined reasons (e.g. unrecognized minor Ar loss or gain). The new ages are still likely to be much more accurate than the previous data, and they cover a narrower age range.
Geological sketch map of volcanic and sedimentary outcrops on the south-east coast of King George Island, based on the present study.
Boy Point Formation: The two samples from the Boy Point Formation dated by us are andesite lavas. They gave ages of 26.80 ± 0.69 Ma (L3; Fig. 16) and 25.23 ± 0.97 Ma (L2). Disregarding the K-Ar age, which is significantly younger and not within error of our two new 40Ar/39Ar ages, the three 40Ar/39Ar ages are cumulatively within error. However, the two new ages reported here contradict the mapped stratigraphical succession. The younger age is from the outcrop of L2 within 50 m of the very large Chopin Dyke, and it may have suffered some thermal resetting. The new age for L3 overlaps with the youngest age obtained on the underlying Polonez Cove Formation, suggesting that no significant gap in time occurred prior to construction of the Boy Point Formation, and deposition may have been essentially continuous or with a geologically short break. This is consistent with the presence of marine fossils in interbedded sedimentary rocks (subunit S4) and the evidence for pervasive brecciation of the lavas, signifying immersion in water and a possible marine eruptive setting for both formations. The two new samples are probably the most accurate. They have a mean age of c. 26.02 ± 0.83 Ma, which is our best estimate for the age of the lava-dominated upper Boy Point Formation.
Cinder Spur Formation: Six lavas were dated from major outcrops of the Cinder Spur Formation (Figs 9, 13 & 14). Although not within error, the new ages are well clustered, with a limited range varying from 25.42 ± 0.88 to 24.09 ± 0.31 Ma (Fig. 16). The published K-Ar ages have a much wider range (30.8 ± 2.0 to 20.4 ± 2.4 Ma) that wholly encompasses the new 40Ar/39Ar ages, suggesting that the new ages are more precise. Although the mean age of the new data is 25.01 ± 1.11 Ma, prominent erosional unconformities are present within the formation in the type area at Cinder Spur and are of uncertain duration (Figs 9 & 10). The stratigraphical limits of the formation are also ill-defined, implying that the full range of ages may not have been tested. The base is unexposed (presumably younger than the Boy Point Formation, with a mean age of 26.02 ± 0.83 Ma). The youngest age determined for a lava in the Boy Point Formation (25.23 ± 0.97 Ma) overlaps with older ages for lavas in the Cinder Spur Formation. Thus, the possibility exists that the two formations might overlap in time, perhaps by interfingering. However, field relationships mapped at the eastern margin of the Cinder Spur outcrop, where the Boy Point Formation is removed entirely together with most of the Polonez Cove Formation (Fig. 9), suggest that a prominent erosional unconformity is present, consistent with different ages. The Cinder Spur Formation is overlain by the Vauréal Peak Formation, across a profound erosional unconformity, and there is evidence for a large time gap (see below).
Intrusions: Only one intrusion was dated during this study: the plug-like outcrop that intrudes Cinder Spur Formation strata at Harnasie Hill (Fig. 12). The sample is very fresh, with much unaltered olivine, and it yielded a slightly disturbed but well-defined plateau age of 27.1 ± 1.4 Ma. The new age is the second oldest age in our dataset, older even than the ages for the Polonez Cove Formation, which is known to be older than the Cinder Spur Formation.
Cape Melville Formation: In our study, a hornblende separate from a tuff interbedded with the Cape Melville Formation at Cape Melville yielded an age of 21.25 ± 3.14 Ma (Fig. 16). Despite the large error, the age is stratigraphically consistent with the other available ages for associated rocks on the headland.
Discussion
Age of Oligocene-Miocene sedimentation and volcanism on eastern King George Island
Our study has significantly revised the stratigraphy of sedimentary and volcanic formations on eastern King George Island and established their ages more reliably (Table II). Most of the geological units have Late Oligocene ages (Chattian), with a probable narrow spread of c. ≤ 2 m.y. Based on the new mapping and chronology, a revised map showing the likely distribution of the Oligocene formations on eastern King George Island is shown in Fig. 17.
The age of the Polonez Cove Formation was previously based on imprecise palaeontological and potentially unreliable Sr isotopic ages. Our 40Ar/39Ar ages on interbedded lavas indicate that the formation was deposited at c. 26.64 ± 1.43 Ma (a mean of four 40Ar/39Ar ages). The duration of deposition would have been relatively short if the sequence represents a single glacial-deglacial cycle (Porębski & Gradziński Reference Porębski and Gradziński1987, Troedson & Smellie Reference Troedson and Smellie2002). The new ages strictly only apply to the basalt volcanism-sourced members, and the Polonez Glaciation itself, represented by the basal Krakowiak Glacier Member diamictites, is not dated directly. However, it is likely that its age is only slightly older than that of the succeeding members.
The new ages are consistently slightly older, by up to 4 m.y., than other 40Ar/39Ar ages previously published (most without supporting data) for the same geological units (Fig. 3; Keller et al. Reference Keller, Fisk, White and Birkenmajer1992, Smellie et al. Reference Smellie, Millar, Rex and Butterworth1998, Troedson & Smellie Reference Troedson and Smellie2002), for reasons unknown. Our 40Ar/39Ar ages are also c. 2–3 m.y. younger than the published 87Sr/86Sr ages. A similar consistent age disparity between Sr ages from fossil bivalves and Ar ages from lavas occurs in the mainly Pliocene James Ross Island Volcanic Group, on the east flank of northern Antarctic Peninsula (Fig. 1). The disparity was explained as being a consequence of mixing between inshore seawater and freshwater runoff affected by equilibration, with lavas containing low 87Sr/86Sr ratios. Because of the low gradient of the Sr seawater curve during the Pliocene, the slightly lower 87Sr/86Sr ratios would create artificially older ages (Smellie Reference Smellie, Smellie, Panter and Geyer2021b). However, the reference Sr dating curve for the Oligocene is not as flat as in the Pliocene (McArthur et al. Reference McArthur, Howarth and Bailey2001), so slight changes in the Sr ratios should not have such a noticeable effect on the ages. We suggest that pervasive alteration observed in most of the Sr-dated shelly fossils in the Polonez Cove Formation (Dingle et al. Reference Dingle, McArthur and Vroon1997, acknowledged by the authors) is probably the major effect responsible for the older ages. The Sr results should thus be regarded as suspect and Ar ages used in preference. Our best estimate for the depositional age of the Polonez Cove Formation is therefore c. 26.64 ± 1.43 Ma. On the basis of high δ18O values of benthic foraminifera in a high-resolution study, Hauptvogel et al. (Reference Hauptvogel, Pekar and Pincay2017) suggested that Antarctica was heavily glaciated between 27.8 and 24.5 Ma (a period that includes the Oi2b event (26.7 Ma)), consistent with an ice sheet similar to or larger than present and with no sign of a significant collapse during interglacials. With the Polonez Glaciation now also dated as c. 26.7 Ma, we suggest that it can be correlated with Oi2b with considerable confidence.
Published ages for the Boy Point Formation, as now defined, are > 23.6 ± 0.3 Ma for L1 (by K-Ar; Birkenmajer et al. Reference Birkenmajer, Delitala, Narębski, Nicoletti and Petrucciani1986) and 22.6 ± 1.7 Ma for L3 (by 40Ar/39Ar; Smellie et al. Reference Smellie, Millar, Rex and Butterworth1998). The new dated samples confirm the Oligocene age inferred previously, although they are considerably younger than the c. 33–30 Ma age previously assumed (Birkenmajer Reference Birkenmajer1989). We suggest that the formation has an age of c. 26.02 ± 0.83 Ma. This is the mean of our two dated samples; it dates the upper, lava-dominated part of the formation. The formation was previously assumed to directly overlie the Polonez Cove Formation and then was itself overlain by the Wesele Cove Formation (Birkenmajer Reference Birkenmajer1982). However, the latter (now regarded as a member) is interbedded with lavas of the Boy Point Formation, although it also locally forms the basal unit of the formation and progrades northwards across the Polonez Cove Formation for much of its extent, a reverse of the originally published relationships. The remarkable similarity between the ages of the Polonez Cove and Boy Point formations indicates that they were formed within a short period of time, and the lithofacies suggest that they were both formed in a marine environmental setting. The several unconformities mapped in the two constituent formations therefore have little time significance.
The Cinder Spur Formation is formed of subaerial basalt lavas and interbedded fluvial and mass-flow deposits. It is newly defined in this paper and is an amalgamation of three previously described formations (Martins Head, Harnasie Hill and Dunikowski Ridge formations). It is the most geographically extensive formation investigated in the study and indicates a significant episode of volcanism. Previously published ages had a very wide spread (30.8 ± 2.0 to 20.4 ± 2.4 Ma, possibly ranging up to 17.3 ± 1.3 Ma). Several of the ages were regarded as having been younged because they conflicted with the observed or inferred order of succession, possibly due to local reheating and Ar loss (Birkenmajer et al. Reference Birkenmajer, Soliani and Kawashita1989). The formation is now reliably dated as 25.42 ± 0.88 to 24.09 ± 0.31 Ma (mean age: 25.01 ± 1.11 Ma). Although its base is unexposed, the new ages indicate that the eruptive episode probably followed shortly after that of the Boy Point Formation and the two formations are petrologically similar. Although some overlap in age is possible, the field relationships suggest that deep erosion of the Boy Point Formation occurred before eruption of the Cinder Spur Formation as a result of a significant episode of uplift of at least 200 m. Like formations in the marine Chopin Ridge Group, the several unconformities mapped at the base of and within the Cinder Spur Formation probably represent relatively little geological time. It is also notable that the ages obtained for the Cinder Spur Formation overlap with those determined for the marine Destruction Bay Formation at Cape Melville (23.6 ± 0.7 Ma (by K-Ar; Birkenmajer et al. Reference Birkenmajer, Soliani and Kawashita1988b) or 25.3 ± 0.8 Ma (by 87Sr/86Sr, mean age; Dingle & Lavelle Reference Dingle and Lavelle1998; Fig. 1)) and it seems likely that the latter is a distal equivalent of the Cinder Spur Formation. A correlation between the two is further supported by the presence of detrital amphibole in the Destruction Bay sediments (Troedson & Riding Reference Troedson and Riding2002), an otherwise rare volcanic mineral in the South Shetland Islands that is common and conspicuous in the Cinder Spur Formation (Smellie et al. Reference Smellie, Pankhurst, Thomson and Davies1984).
The Cinder Spur Formation is overlain by the Vauréal Peak Formation, a massive diamictite of glacial origin (i.e. a tillite; Birkenmajer Reference Birkenmajer1982). The age of the Vauréal Peak Formation is unknown but was previously inferred to be comparable with that of the underlying lavas (i.e. c. 30–26 Ma). It lacks contemporaneous dateable lavas and is not cross-cut by intrusions; dating of lava clasts has yielded only provenance ages (e.g. Birkenmajer et al. Reference Birkenmajer, Soliani and Kawashita1989, Smellie et al. Reference Smellie, Hunt, McIntosh and Esser2021). The diamict and volcanic formations were combined within the Legru Bay Group to define the local Legru Glacial (Birkenmajer et al. Reference Birkenmajer1982; group name now defunct). However, although previous authors acknowledged that the base of the Vauréal Peak Formation is incised into the underlying volcanic strata, the significance of that erosion has never been addressed. For example, it cuts down at least 250 m at the Cliffs of Gloom and Stanczyk Hill (Fig. 15; see also Fig. 7h). Moreover, from the orientation of strata in the different outcrops of the Cinder Spur Formation, the original edifices responsible for the volcanism must have extended into Bransfield Strait and have been significantly cut back by marine erosion (Fig. 11). The mapped outcrops of the Vauréal Peak Formation (Figs 12 & 13) indicate exhumation of a palaeotopography that included a south-facing cliff and a deep coastal embayment, corresponding to the Cliffs of Gloom and Legru Bay, respectively. The palaeotopography indicates a coastline very much like that of today. The implication is that the southern margin of King George Island had already undergone severe marine erosion prior to deposition of the Vauréal Peak Formation. Therefore, a much younger age than previously assumed is indicated. Although the age is unknown, it is estimated conservatively to be ≤ 10 Ma.
A precise palaeontological age for the glacio-marine Cape Melville Formation, on easternmost King George Island, has proven elusive despite an abundance of in situ macrofossils, but benthic foraminifera suggest that the formation is Early Miocene (Birkenmajer & Luczkowska Reference Birkenmajer and Luczkowska1987). Bracketing by field relationships indicates a maximum age of < 25.3 ± 0.8 or < 23.6 ± 0.7 Ma (by 87Sr/86Sr and K-Ar dating, respectively) obtained on brachiopods and a basaltic tuff, respectively, in the underlying marine sedimentary Destruction Bay Formation (Birkenmajer et al. Reference Birkenmajer, Gaździcki, Kreuzer and Müller1985, Reference Birkenmajer, Soliani and Kawashita1988b, Dingle & Lavelle Reference Dingle and Lavelle1998). Similarly, dykes cross-cutting the Cape Melville Formation yielded K-Ar minimum ages of 20.1 ± 0.2 and > 19.9 ± 0.3 Ma (Birkenmajer et al. Reference Birkenmajer, Gaździcki, Kreuzer and Müller1985). No interaction between the dykes and sediments has been described that might suggest they were contemporary. Our dating of a tuff interbedded with the Cape Melville Formation as 21.25 ± 3.14 Ma (Early Miocene (Aquitanian)) has helped to define more precisely its depositional age. The age is slightly younger than, but within error of, an inferred Sr age of 22.6 ± 0.4 Ma obtained on skeletal carbonate from the upper part of the Cape Melville Formation by Dingle & Lavelle (Reference Dingle and Lavelle1998). Consideration of all the available data suggests that the depositional age of the Cape Melville Formation is now relatively well defined at c. 22–21 Ma. It thus corresponds to the Mi1a glacial (c. 21.8 Ma, or possibly 21.24 Ma; Cooke et al. Reference Cooke, Nelson and Crundwell2008).
Finally, only one hypabyssal intrusion was dated during our study: a plug at Harnasie Hill. Adjacent dykes have broadly similar K-Ar ages (30.5 ± 5.5 and 25.7 ± 0.7 Ma; Birkenmajer et al. Reference Birkenmajer, Soliani and Kawashita1989), and hypabyssal intrusions on western King George Island have yielded comparable ages of 27.9 ± 0.3 and 25.4 ± 0.4 Ma (by U-Pb, on zircon; Pańczyk et al. Reference Pańczyk, Nawrocki and Williams2009). However, the youngest age for the Cinder Spur Formation is 24.09 ± 0.31 Ma (Table IV), which can be regarded as a maximum age for the intrusions at Harnasie Hill. Thus, the field relations suggest that excess Ar may have affected all three dated samples at that locality. Further dating, preferably by the U-Pb method (e.g. Pańczyk et al. Reference Pańczyk, Nawrocki and Williams2009, Nawrocki et al. Reference Nawrocki, Pańczyk and Williams2010, Reference Nawrocki, Pańczyk and Williams2011), is required to establish the ages of these intrusions.
If our interpretation of the field relations at Cape Melville is correct, the so-called Sherratt Bay Formation is a sill with a likely age similar to dykes at the locality (i.e. c. 20 Ma; by K-Ar). Thus, it is doubtful that a single dolerite sill with no particularly distinctive characteristics should remain as a named stratigraphical unit of formation status (see also Troedson & Riding Reference Troedson and Riding2002), and it is omitted from Table II on that basis. An informal name that might be used for the feature, which retains its geographical association, is the Sherratt Bay sill. Other hypabyssal intrusions on south-eastern King George Island have significantly younger ages of 21.9 ± 1.1, 21.4 ± 1.9, 21.8 ± 0.6, 20.1 ± 0.2 and > 19.9 ± 0.3 Ma (mean age of 21.3 Ma; by K-Ar and 40Ar/39Ar). The prominent clustering around 22–21 Ma implies that it was an important period of extension, faulting and intrusion. The dykes both exploited and cut across several faults (best seen at Cinder Spur; Fig. 9). The significance of the tectono-magmatic episode is uncertain, but Birkenmajer (Reference Birkenmajer, Yoshida, Kaminuma and Shiraishi1992) speculated that it may be linked to the early stages of opening of Bransfield Strait at 26–22 Ma.
Conclusions
King George Island, South Shetland Islands (northern Antarctic Peninsula), is host to an internationally renowned series of volcanic and sedimentary sequences that preserve evidence for multiple glacial episodes, of which four have previously been described. No comparable strata are exposed anywhere else on Antarctica. New mapping and 40Ar/39Ar chronological studies of the sequences show that the established stratigraphy and chronology require significant revision. In particular, the existence of an Eocene glaciation (Kraków Glaciation) is conclusively disproved, and the presence of Eocene alpine glaciers (represented by the ‘Hervé Cove tillite’) on King George Island is also shown to be unproven. The ‘Mazurek Point Formation’ (now called the Hennequin Formation) is Eocene in age and wholly unrelated in its lithofacies and eruptive setting (subaerial) to much younger members of the Chopin Ridge Group, which formed in a marine setting. It is thus no longer regarded as a valid part of that group, and the revised stratigraphical succession (Chopin Ridge group) now comprises only the Polonez Cove and Boy Point formations, both of which were deposited within a narrow time interval at c. 26.7–26.0 Ma. The lithostratigraphical basis for four other formations (Dunikowski Ridge, Harnasie Hill, Martins Head and Vauréal Peak formations), which together formerly comprised the Legru Bay Group, is also suspect. The basal three formations are combined into a single new unit (Cinder Spur Formation; 25.01 ± 1.11 Ma) composed of subaerial basalt lavas and fluvial and mass-flow sedimentary deposits, and no group name is required. Most of the formations described in this paper are Late Oligocene (Chattian) in age, and they are all shown to have been deposited in a narrow time interval, probably ≤ 2 m.y., despite the presence of numerous unconformities between and within several of the units. Dating of a tuff interbedded with the Cape Melville Formation has confirmed its age as Early Miocene (c. 22–21 Ma; Aquitanian). Finally, the Vauréal Peak Formation, composed of diamict interpreted as a tillite, is shown to drape a palaeolandscape very similar to today, including deep coastal embayments and sea-facing cliffs, which implies that it is much younger than previously envisaged. As a consequence of the revised stratigraphy and new 40Ar/39Ar chronological results, the ages of the three major glacial episodes represented on King George Island are determined to be c. 26.7 Ma (Polonez Glaciation), probably c. 21.8 Ma (Melville Glaciation) and c. ≤ 10 Ma (Legru Glaciation). The two main glacial episodes can thus be correlated with the Oi2b and Mi1a global isotope stages, respectively.
Acknowledgements
The authors are very grateful to the British Antarctic Survey and the University of Leeds for their support of this investigation. We are also grateful for the help of Andy Teasdale, Carl Haberl, Filipo Croso and Anne Flink during fieldwork by the authors on King George Island. Phil Guise is thanked for his help and guidance with the geochronology at Leeds University. The authors also gratefully thank the captains, officers and crews of HMS Endurance, HMS Protector, RRS Bransfield and RRS Shackleton for their invaluable logistical support, and Mike Tabecki (BAS) and Annika Burns (Leicester) for making the numerous thin sections from challenging samples that are at the heart of this study. JLS also gratefully thanks Professors Tony Rocha-Campos and Paulo dos Santos and the logistical support of the Brazilian Antarctic Programme (PROANTAR; i.e. Programa Antártico Brasiliero) for his invited visit to King George Island in 2014. JLS is also very grateful to Ray Burgess (Manchester University, UK) for discussions on 40Ar/39Ar data. We are also grateful to Teal Riley and Jerzy Nawrocki for their careful reviews of this paper; Ieuan Hopkins and Kevin Roberts (British Antarctic Survey Archive Service) for helping with access to archived field data; and Beverley Ager and Mandy Tomsett (British Antarctic Survey Library) for obtaining copies of hard-to-access papers relating to this study.
Author contributions
JLS: conceptualization (lead), data acquisition (equal), data curation (equal), formal analysis (lead), funding acquisition (lead), investigation (lead), writing - original draft (lead), writing - review and editing (lead).
WCM: conceptualization (supporting), data acquisition (equal), data curation (equal), formal analysis (equal), investigation (supporting), writing - original draft (supporting), writing - review and editing (supporting).
RW: conceptualization (supporting), data acquisition (equal), data curation (equal), formal analysis (supporting), investigation (supporting), writing - original draft (supporting), writing - review and editing (equal).
AT: conceptualization (supporting), data acquisition (equal), data curation (equal), formal analysis (equal), investigation (supporting), writing - original draft (supporting), writing - review and editing (equal).
RJH: conceptualization (supporting), data acquisition (supporting), data curation (supporting), formal analysis (supporting), investigation (equal), writing - original draft (supporting), writing - review and editing (equal).
Supplemental material
Four supplemental information files will be found at https://doi.org/10.1017/S095410202100033X.


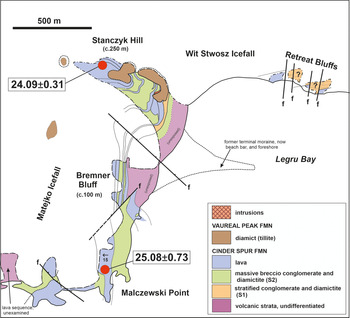


 Open access