


Introduction
Comparative historical analyses have emphasized the role played by conservative and center-right parties in the development and consolidation of democratic regimes in Europe. Ziblatt (Reference Ziblatt2017: xii, 21) showed that strong and electorally competitive right parties favored democratization processes by making democracy less threatening to social elites and drastically reducing the appeal and power of extreme right groups. Luebbert’s (Reference Luebbert1991: 8) classical study Liberalism, Fascism, or Social-Democracy emphasized that strong center-right electoral coalitions managed to weaken and isolate working-class actors and paved the path to liberal hegemony and democratic stability. These two studies identified different sets of social and political factors affecting the strength of conservative or center-right political forces. In Luebbert’s (Reference Luebbert1991: 6) study, the presence of strong cultural divides splitting the middle classes negatively affected the electoral and political prospects of center-right parties. Ziblatt’s (Reference Ziblatt2017: 37, 45) explanation enriched Luebbert’s analytical frame by showing that conservative control of electoral results through the use of exclusion, manipulation, and corruption impinged negatively on the ability of conservative parties to mobilize their supporters, build strong organizations, and campaign on cultural issues appealing to non-elite social sectors.
The two crucial constraints identified by Luebbert and Ziblatt were present in Spain in the first third of the 20th century. Consequently, from the perspective of these theoretical approaches, this country should be considered a least likely case for the development of a strong conservative party in the 1930s. Cultural divisions within the upper and middle classes were particularly strong due to the importance of both center-periphery tensions and conflicts around the role of the Catholic Church (Linz Reference Linz and de Miguel1979: 124–25). In addition, the oligarchic control of electoral processes in the Restoration regime (from 1874 to 1931) prevented the development of stable conservative mass organizations appealing to ideological orientations and programmatic preferences (Gil Pecharromán Reference Gil Pecharromán1994; Varela Ortega Reference Varela Ortega1977). The weakness of the conservative party was aggravated by the Primo de Rivera dictatorship (from 1923 to 1930) and its failed attempts to build a new mass party to replace old conservatism. Given the combined presence of these long-term and structural constraints, one should expect Spanish conservative actors to be poorly coordinated (Ziblatt Reference Ziblatt2017: 350–55) and unable to build strong links with substantial segments of the Spanish society during the Second Republic (1931–36). In fact, the analysis of the 1931 elections, the first held in the republican period, reveals a weak and fragmented right, split along ideological and territorial lines and still constrained by the presence of local clientelistic leaderships. However, despite the constraints mentioned above, the main conservative party in the 1930s, the conservative Confederación Española de Derechas Autónomas – CEDA – (Spanish Confederation of Autonomous Rights) managed to attain impressive electoral results in a very short period of time, becoming the largest parliamentary group in the 1933 legislative elections.
This combination of inauspicious conditions and fast-improving electoral results enhances the interest of analyzing the social roots and electoral strength of Spanish conservatism during the Second Republic. While the organizational aspects of this party-building process have already been analyzed in historical case studies (Álvarez Tardío Reference Álvarez Tardío2016; Montero Reference Montero1977), there are no empirical analyses on the sources and dynamics of conservative electoral support during this historical period. In particular, there is no systematic information on the ability of the conservative right to develop strong links with substantial segments of Spanish society on the basis of underlying structural social conditions. There are no systematic analyses of the social contexts that facilitated the most the success of the right in this historical period.
This paper analyses the factors allowing the right to build a strong electoral base by conducting ecological statistical analyses on the provincial electoral performance of the right in the 1931, 1933, and 1936 legislative elections. The point of departure of this analysis lies both in the comparative literature on party system formation in Western Europe and historical case studies focusing on the Spanish Republic. These two streams of literature emphasize the strong connections between conservative electoral support and underlying sociopolitical cleavages (Bartolini Reference Bartolini2000; Lipset and Rokkan Reference Lipset, Rokkan, Lipset and Rokkan1967; Rokkan Reference Rokkan1999) and the cumulative impact of these divisions on the politics of the Second Republic (Linz Reference Linz, Linz and Stepan1978). This development stands in sharp contrast with the clientelistic and non-ideological character of the Restoration regime party system (Varela Ortega Reference Varela Ortega1977).
The main empirical expectation driving this analysis is that there should be a strong association between the presence of lay Catholic organizations, very actively promoted by the Church since the second half of the 19th century (De la Cueva Merino Reference De la Cueva Merino, López Villaverde, Botti and de la Cueva Merino2005; Kalyvas Reference Kalyvas1996: 65–66), and the success of conservative parties. The reasons for this association lie in a combination of three factors that were present in Spain and other European countries: the importance of the religious cleavage (Bartolini Reference Bartolini2000), the ability of the Catholic Church to link norms and identities in a conservative frame (Castillo Reference Castillo1979; Riley Reference Riley2010: 76–78), and the strong mobilizational capabilities of lay Catholic organizations that could also promote and stabilize support for confessional and conservative parties (Bartolini Reference Bartolini2000: 22–23, 256; Kalyvas Reference Kalyvas1996: 100). Although consistent with comparative literature on party system formation and historical and empirical accounts on Spanish politics and elections (Linz and de Miguel Reference Linz and de Miguel1977; Riley Reference Riley2010; Schatz Reference Schatz2001), to my knowledge, there is not a systematic empirical analysis of the effects of these factors on the electoral success of the conservative right.
This analysis is structured as follows. In the next section, I present an overview of the political and electoral situation of the Spanish right during the Second Republic. Section two presents the main explanatory factors included in the analysis, identified on the basis of both comparative literature and historical case studies. The third section presents the results of the statistical analyses conducted within this research. The conclusion addresses the main implications of these findings for the understanding of the social bases, electoral dynamics, and lasting potential of conservative forces in Spain.
The situation of the Spanish right during the Second Republic
The proclamation of the Second Republic in 1931 found the Spanish right in complete disarray. The Restoration regime Conservative party collapsed after the Primo de Rivera dictatorship (1923–30), and the right was completely unable to articulate a political platform in the 1931 republican elections. In 1931 the right attained 15 percent of the votes against 85 percent of the votes received by the republican-socialist alliance (Colomer Reference Colomer2003: 90). By contrast, in the 1933 and 1936 elections, right political forces attained around one third of the popular vote (Colomer Reference Colomer2003: 90; Linz and De Miguel Reference Linz and de Miguel1977: 34). The electoral growth of the right was paralleled by an increasing coordination among conservative activists and elites. In the highly fragmented scenario of the 1931 elections, Acción Nacional, the organization created with the strong support of important Catholic organizations (Montero Reference Montero1977: 97–107), was the main conservative party in 4 out of more than 50 electoral districts (Tusell Reference Tusell1982: 87). By contrast, in 1933 the CEDA, created around Acción Popular (the new name of the previous Acción Nacional) had already become a strong nation-wide organization under the leadership of the Law Professor and Catholic activist José M. Gil-Robles (Álvarez Tardío Reference Álvarez Tardío2016), putting together more than half a million militants (Montero Reference Montero1977: 259).
Conservative electoral mobilization ran parallel to the process of polarization experienced during the Second Republic. In this short period, the reforms launched by the initial republican-socialist coalition (1931–36) were met first by strong resistance and then by counter-reforms during the 1934–35 rightist government. These reforms concerned the crucial issues of land reform, labor legislation, Church-state relations, and Catalan regional autonomy. The electoral growth of right parties from 1931 to 1933 resulted from their ability to capitalize on the opposition of substantial segments of Spanish society to social, cultural, and economic change. The crystallization and hardening of the social roots of conservative parties must have been accelerated by the exponential growth of political violence that took place after the October 1934 revolution (Linz Reference Linz, Linz and Stepan1978: 176–83), an uprising that followed the entry of CEDA ministers in the republican government (65 percent of the political deaths that took place during the Second Republic happened during the 1933–35 right government, for just 14 percent during the 1931–33 republican-socialist government) (González Calleja et al. Reference González Calleja, Rus and Pérez2015).
Most often, the CEDA ran in coalition with two smaller organizations, the elitist, monarchist Spanish Renovation (Renovación Española – RE) and the Carlist Traditionalist Communion (Comunión Tradicionalista – CT), a party enjoying wider popular support in the Basque country and Navarre. The central position of the CEDA was reflected in the fact that, in the 1933–36 national legislature, this party had 115 members for 16 of the RE group and 21 of the CT group (Gil Pecharromán Reference Gil Pecharromán1994: 142; Linz Reference Linz and de Miguel1979: 141–47; Montero Reference Montero1977). Despite their electoral cooperation, these three parties were divided on the strategy to follow towards the republican regime. The CEDA adopted a pragmatic position towards the Republic and claimed to accept it on the condition that it moved in the political and programmatic direction advocated by the party. By contrast, RE and CT opposed frontally the Republic and worked consistently to destroy it and replace it with an authoritarian regime (Gil Pecharromán Reference Gil Pecharromán1994: 174–6; González Calleja Reference González Calleja2011). These three parties fitted well, therefore, Linz’s distinction between semi-loyal (the CEDA) and disloyal (RE and CT) oppositions in democratic regimes (Linz Reference Linz, Linz and Stepan1978).
Despite their ideological and strategic differences, the fundamentally confessional CEDA, the radically monarchist and elitist RE, and the reactionary and premodern CT fit well Ziblatt’s (Reference Ziblatt2017: 30) definition of conservative political parties. According to this conceptualization, conservative political parties were characterized by (a) a “core constituency” of “upper class propertied economic or political elites the latter of whom were defined by their institutional ties to the upper-echelons of Europe’s pre-democratic ‘old regime’” and (b) a set of ideas that included anti-egalitarianism, anti-secularism, and the defense of traditional values and institutions. In contrast to centrist republican parties, these three political forces represented consistently conservative (and anti-left) positions in all the main axes of political conflict. Economically, they emphasized the defense of property rights and rejected agrarian reforms and redistributive policies. Culturally, they embraced the values and interests of the Catholic Church and defended a traditionalist and essentialist interpretation of the Spanish identity. Politically, they advocated strong law and order and repressive policies against social protests and mobilizations. Despite their ideological and strategic differences, these three groups formed electoral coalitions with each other and occasionally with more moderate center-right groups (such as the Catalan Lliga, the Basque Nationalist Party, or even center-right republican forces). Their electoral performance is the best indicator of the electoral success of right organizations in the Second Republic. For these reasons, in this analysis, I have focused on the electoral results of these three parties, the CEDA (Acción Nacional in the 1931 elections), RE, and CT, and left aside the performance of minor center-right alternatives, such as the highly personalist Conservative Republican Party.
Establishing the percentage of voters for different political leanings in the Second Republic is far from easy, and any decisions and procedures chosen present potential problems of consistency and validity (González Calleja and Sánchez Pérez Reference González Calleja, Rus and Pérez2018; Linz and de Miguel Reference Linz and de Miguel1977: 33; Villa García Reference Villa García2011). This is partly a result of the nature of the electoral system of the Second Republic, and partly a consequence of the diversity of party groups and the shifting character of political alliances. The electoral system was based on plurality but limited voting and open lists on multimember districts (63 in 1931 and 60 afterward). Women were able to vote in the 1933 and 1936 elections after the approval of the 1931 Constitution. Districts were based on provinces, but cities with large numbers of inhabitants (more than 100,000 in 1931 and more than 150,000 after 1933) constituted separate districts. Voters could vote for 80 percent of the seats in the district, and minority candidates could attain the rest of the seats. In the 1931 elections, in order to be elected, the candidates list had to attain at least 20 percent of the votes cast. In the 1933 electoral reform, this percentage was increased to 40 percent of the votes. If no candidate attained 40 percent of the votes, a second election was necessary. These rules gave a strong advantage to the parties or coalitions that received the highest number of votes, which could attain between 67 percent and 80 percent of the district seats irrespective of how large their advantage vis-à-vis other lists was (Linz Reference Linz and de Miguel1979: 116–17). They also induced the formation of large coalitions between large and minority parties, often ideologically extreme, that could lean the balance in one direction or another (Gil Pecharromán Reference Gil Pecharromán2002: 55 and 177; Linz Reference Linz and de Miguel1979: 118; Montero and Lago Reference Montero and Lago2013: 2589; Villa García Reference Villa García2011: 65–106). In the context of 1930s ideological polarization, the strong representation effects of small voting differences made electoral contests particularly intense. In the case of the right, these rules strongly favored the alliance of the largest conservative party, the CEDA, with the much smaller RE and CT.
Given the complexity of measuring the electoral district-level performance of the right, I have chosen to use the data provided by previous studies focusing on the three national republican elections. For the 1931 elections, I have used the indicator provided by Tusell for the votes for AN (the precursor party of the CEDA) and the Traditionalists (Tusell Reference Tusell1982: 87–8). For the 1933 elections, I have used the percentages of votes for the right coalition (Unión de Derechas) reported by Villa García (Reference Villa García2011). And for the 1936 elections, I have used the indicator provided by Linz and de Miguel for right parties (Reference Linz and de Miguel1977: 42). This indicator is based on Tusell’s data (Reference Tusell1971) and focuses strictly on the results of the CEDA, RE, and CT. Unfortunately, it is not possible to discriminate between the support for the CEDA, RE, and CT, given the fact that in most provinces all these parties ran in coalition. Three districts can illustrate the difficulty of assessing the specific support for each of the right parties. In 1933, in the Coruña district, José María Gil-Robles, the most prominent CEDA candidate, received 113,662 votes, whereas José Calvo Sotelo, the most important RE candidate, received 114,252 votes (Villa García Reference Villa García2011: 469). In the Seville capital district, Jesús Pabón, the main CEDA candidate, received 38,332 votes, whereas the main CT candidate, Ginés Martínez Rubio, received 37,155 votes (Villa García Reference Villa García2011: 480). And in the Vizcaya province, the CT candidate, Marcelino Oreja, attained 20,259 votes, whereas the RE candidate, José María de Areilza, attained 19,100 votes (Villa García Reference Villa García2011: 484). That is, most of the right sympathizers voted consistently for the main candidates of these parties, and their small differences were conditioned by personal characteristics or district idiosyncrasies. In Juan Linz’s words (Linz Reference Linz and de Miguel1979: 118), the real electoral strength of each specific party during the Second Republic may never be known.
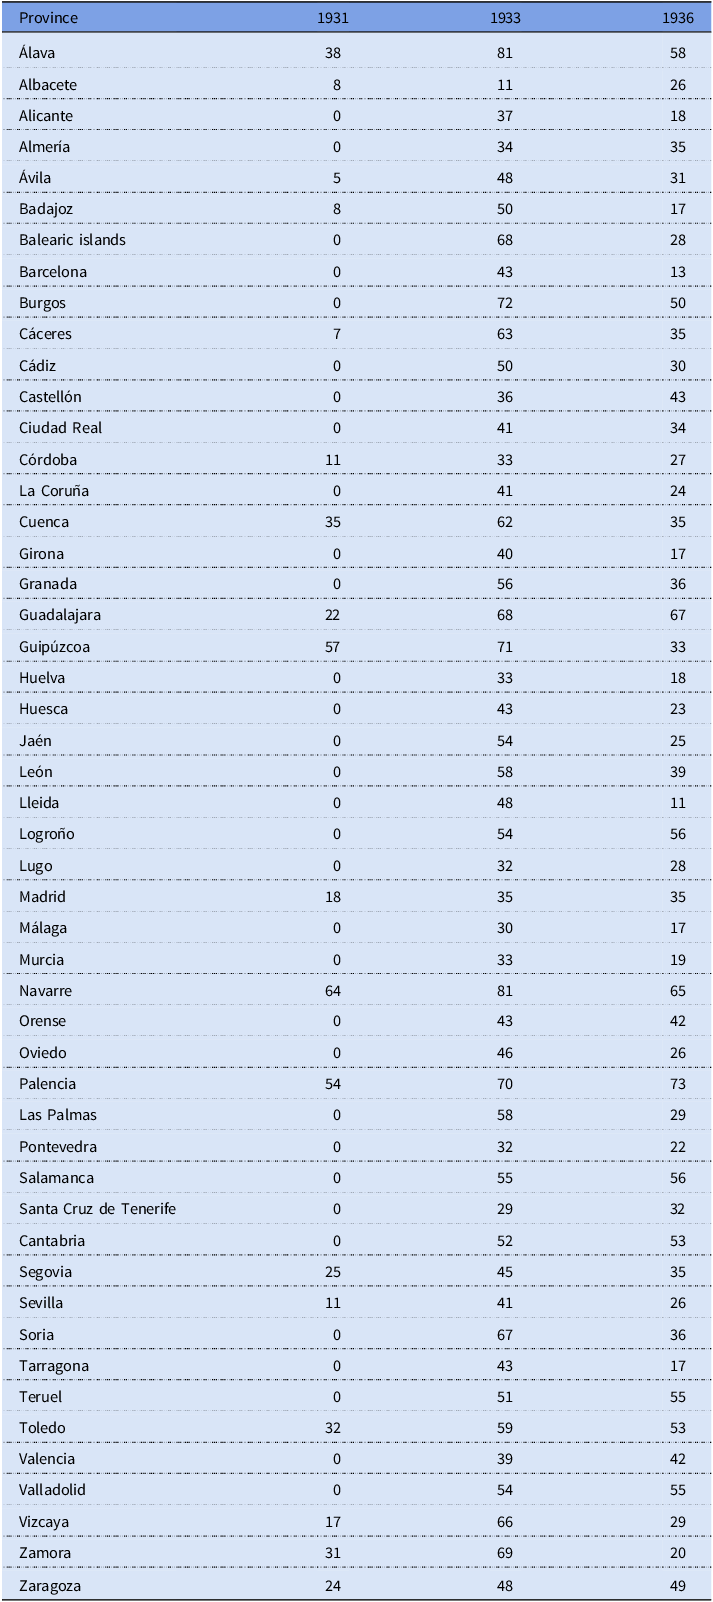
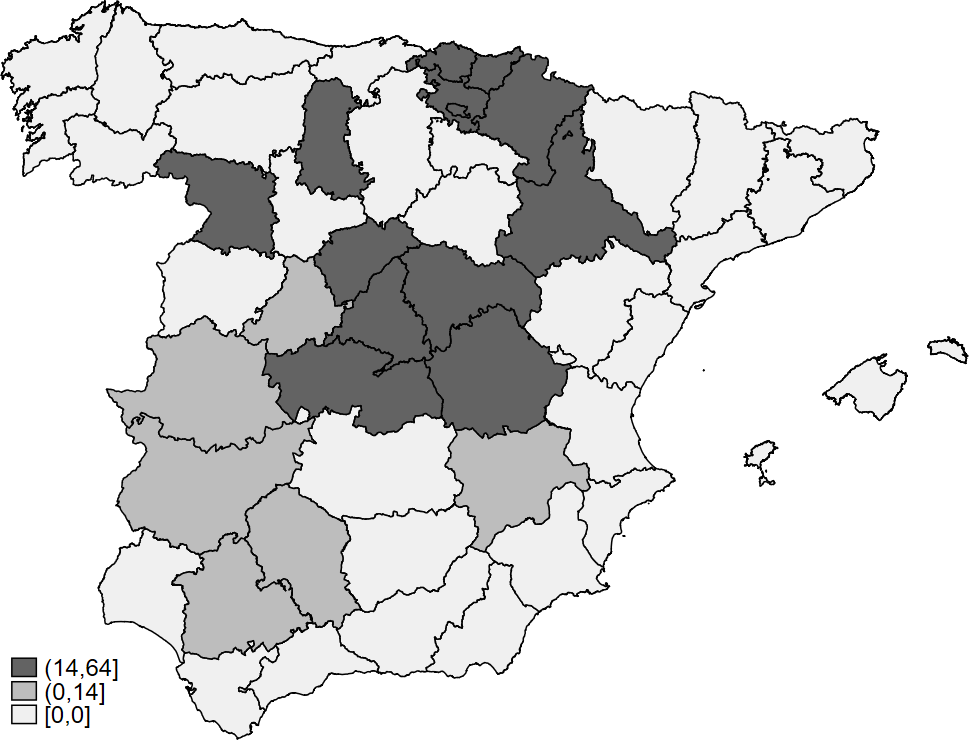
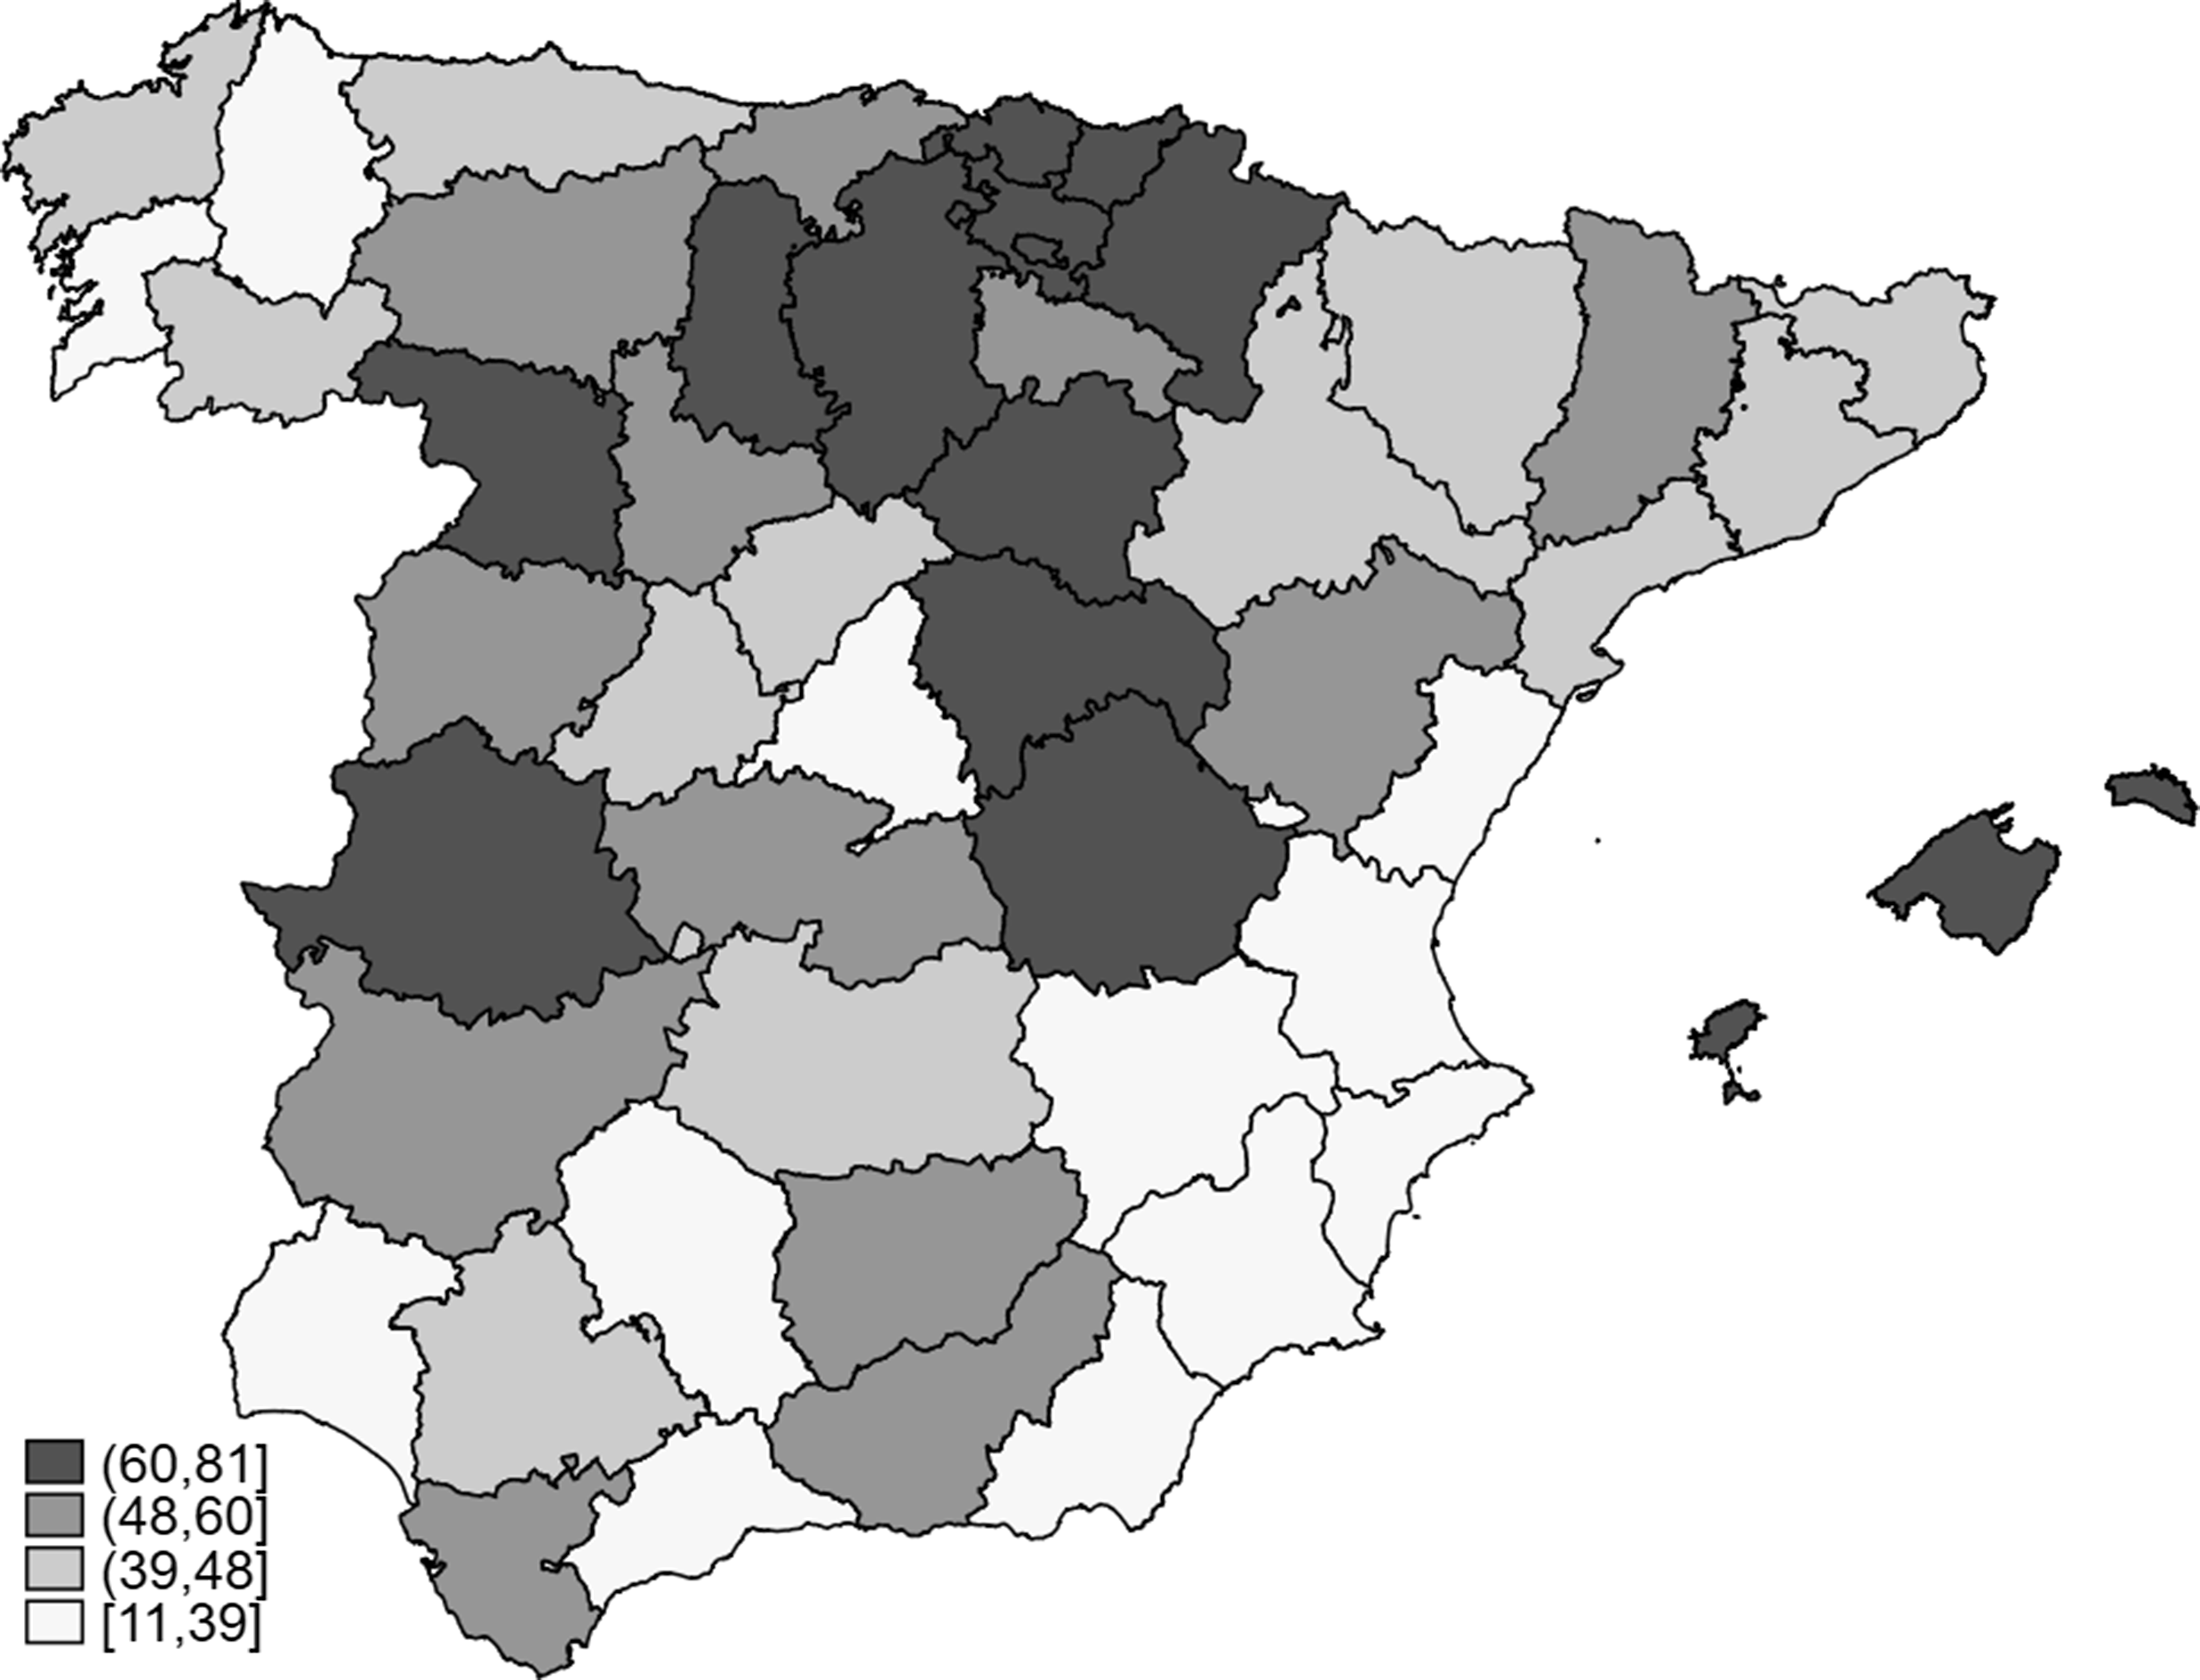
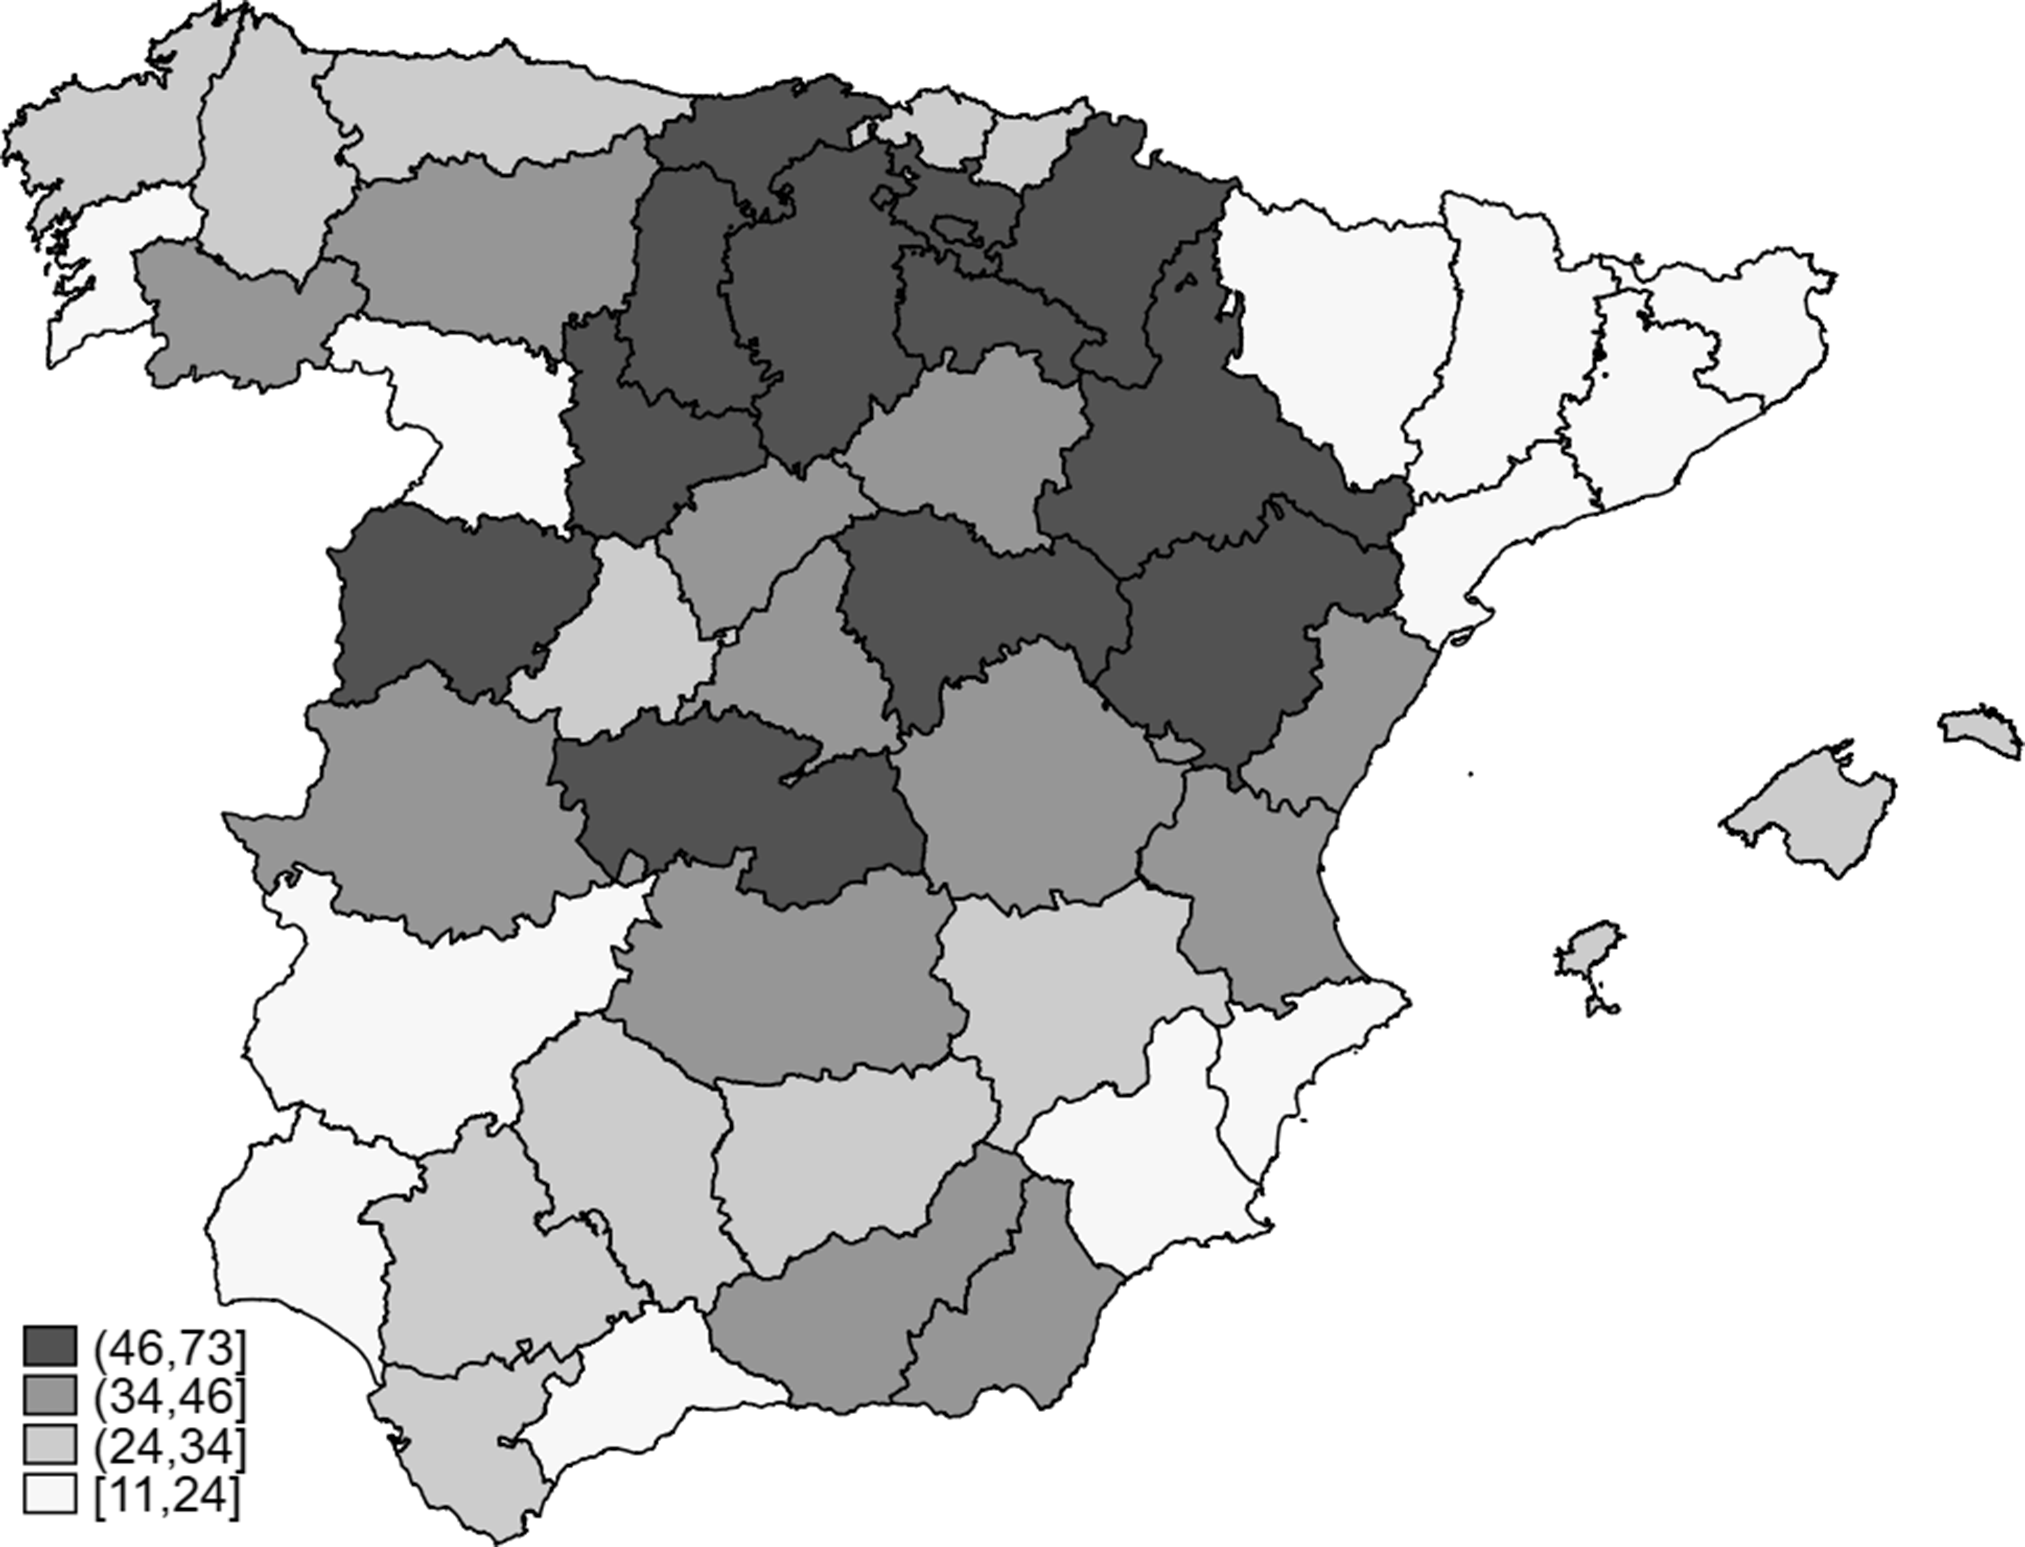
Table 1 reflects the electoral results attained by right candidates, and Figures 1, 2 and 3 show the 1931, 1933, and 1936 electoral results of right parties in the Spanish map (the Canary Islands excluded).Footnote 1
Electoral results of the right in national legislative elections (percentages in the first round)
Percentage of vote for the right in the 1931 elections.
Percentage of vote for the right in the 1933 elections.
Percentage of vote for the right in the 1936 elections.
The social and political determinants of the Spanish conservative vote
The identification of the main social factors affecting the conservative vote is based on Lipset and Rokkan’s analysis of the cleavages structuring party system formation in Western Europe (state/church, land/industry, center/periphery, and owner/worker) (Lipset and Rokkan Reference Lipset, Rokkan, Lipset and Rokkan1967; Rokkan Reference Rokkan1999: 304–7). These cleavages necessarily encompass three constitutive dimensions: socio-structural divisions, divisions on norms and identities, and organizational expressions (Bartolini Reference Bartolini2000: 17; Bartolini and Mair Reference Bartolini and Mair2007: 200). They shape political conflicts and party systems in a lasting way, and therefore go far beyond the importance of specific issues in electoral contests (Bartolini Reference Bartolini, Ramón Montero, Segatti and Calvo2023; Montero Reference Montero, Segatti and Calvo2023). The importance of the cleavages identified by Lipset and Rokkan has been also underlined by historians and political scientists analyzing different aspects of political life during the Second Republic (Domènech and Sánchez-Cuenca: Reference Domènech and Sánchez-Cuenca2021; Linz Reference Linz and de Miguel1979; Montero Reference Montero1977; Schatz Reference Schatz2001; Tusell Reference Tusell1971: 193–250).
Taking Lipset and Rokkan’s comparative framework as the main point of departure of this analysis does not entail entirely accepting their theoretical interpretation on the role of critical junctures nor their historical descriptions on the specific ways cleavages were generated and led to the formation of political parties. For instance, the criticisms formulated by Kalyvas (Reference Kalyvas1996: 13–15) against Lipset and Rokkan’s genetic accounts have been compatible with preserving the core elements of the cleavage-based approach to the formation of European party systems. As in other contributions on party system dynamics, the cleavage framework is used here without specifically addressing the role of critical junctures in party system formation (Kitschelt Reference Kitschelt, Boix and Stokes2007).
In this section, I discuss the main cleavages active in the Spanish party system and present the cleavage indicators used for this empirical analysis. Unfortunately, due to severe data constraints, these predictors are time-invariant. In the case of census data, it is necessary to use the 1930 census, which was the last one conducted before the Second Republic (the next one was carried out in 1940). For other variables (land ownership, Catholic civic associations, and agrarian unionism), it is necessary to rely on single data points provided by researchers on the basis of cadastral information and archival work. Now, given their structural character and the short period of time covered by this analysis, it is possible to assume (perhaps with the exception of the indicators for Catholic activism) very limited levels of variation in these factors.
The first group of explanatory variables relates to the socio-economic characteristics of Spanish territories. First among these economic variables is the size of the industrial sector, which in 1930 occupied 27.2 percent of the Spanish active population (Beltrán Tapia and Martínez-Galarraga Reference Beltrán Tapia and Martínez-Galarraga2020: 173). This percentage obscured large regional disparities separating the very industrialized areas of Catalonia and the Basque country (58.6 percent of the active population in Barcelona and about 38 percent in Guipúzcoa and Vizcaya) from non-industrial Spain (with an average of 20 percent) and provinces like Madrid, lying in an intermediate position (31.2 percent) (Beltrán Tapia and Martínez-Galarraga Reference Beltrán Tapia and Martínez-Galarraga2020: 173). Industrialization went hand in hand with a larger industrial working-class, stronger trade unions, and a diminishing social and political role of rural landowners. In the specific context of the Second Republic, one must also keep in mind that in the 1931–32 period, republican governments introduced labor legislation favoring the bargaining power of workers. Under the leadership of Francisco Largo Caballero, labor minister from 1931 to 1933 and secretary general of the Socialist trade union UGT, the republican government established industrial labor arbitration committees integrated by representatives of owners, workers, and the Ministry of Labor. The new legislation also established the right to strike and introduced health and accident insurance and minimum vacation periods (Gil Pecharromán Reference Gil Pecharromán2002: 151). These reforms led to large wage increases during the Second Republic (Palafox Reference Palafox1991: 191–202), even in the face of capital flight and investment contraction (Palafox Reference Palafox1991: 275–76). Based on these general and context-specific factors, one should expect industrialization indicators to lead to a lower electoral performance of the conservative right.
In the second place, it is important to assess the effects of agrarian class structures and land inequality. Agrarian class conflicts and land reforms played a decisive role in the political life and ultimately, the breakdown of the Second Republic (Linz Reference Linz, Linz and Stepan1978; Malefakis Reference Malefakis1971; Robledo Reference Robledo2002; Simpson and Carmona Reference Simpson and Carmona2020). The intensity of these conflicts resulted from the extreme inequality of land ownership in large Spanish regions. Thus, in 1930, in Southern Spain, 41.2 percent of the landholdings had 250 hectares or more (Malefakis Reference Malefakis1971: 35), whereas the percentage of landholdings equal to or larger than 250 hectares was below 10 percent in the North and 25 percent in Central Spain (ibid.: 35). By contrast, small landholdings prevailed in Northern and Central-Northern Spain and were less frequent in the south of the country. For instance, whereas the area occupied by small landholdings equaled 78.7 percent of the territory in Galicia, 69.2 percent in Vizcaya, and 63.8 percent in León and Burgos, this same variable reached 22.4 percent in Western Andalusia, 26.4 percent in Eastern Andalusia, and 27.5 percent in Extremadura. These figures amounted to 54.4 percent in Catalonia and 51.4 percent in Valencia (Malefakis Reference Malefakis1971: 17). Agrarian reforms were particularly resisted by large- and middle-size landowners. In 1931, a national association of landowners that staunchly opposed land reforms was created, boycotting the republican government legislation whenever possible. The mass-based CNCA also opposed most republican agrarian reforms (González Calleja et al. Reference González Calleja, Rus and Pérez2015). In parliament, representatives of agrarian interests (both from the right and the agrarian party) opposed and occasionally blocked agrarian reforms. This opposition also reached important sectors of the small landowners, which may have also felt attracted by the general pro-agrarian sector policies advocated by the right (Gil Pecharromán Reference Gil Pecharromán2002: 160; González Calleja et al. Reference González Calleja, Rus and Pérez2015). In 1934, the right government reverted many agrarian reforms, evicting tenants and peasants from the land they occupied, returning to the aristocratic owners part of the lands that had been expropriated to them (Gil Pecharromán Reference Gil Pecharromán2002: 204), and blocking the ability of left local governments to intervene in labor contracts and regulation (González Calleja et al. Reference González Calleja, Rus and Pérez2015). Even moderate reforms, like the ones sponsored by the center-right, Christian-democratic minister Giménez Fernández, met with the opposition of conservative sectors. The political importance of agrarian conflicts was also connected to the size of the agrarian sector, which occupied 47 percent of the labor force in 1930 (Simpson and Carmona Reference Simpson and Carmona2020: 182). This percentage varied greatly from region to region, reaching its highest values in New Castile (66 percent), Galicia (65 percent), Navarre (65 percent), and Old Castile (60 percent), and its lowest values in Madrid (11 percent) and the Basque country (35 percent). Overall, and consistently with the results of previous historical studies and empirical analyses, one would expect the right to have worse electoral results in regions where large landholdings prevailed (Malefakis Reference Malefakis1971; Schatz Reference Schatz2001: 151–2, 155).
As pointed out by different comparative studies, the political orientations of middle- and small-size land owners cannot be directly inferred from their economic positions, and depends to a large extent on the characteristics of political structures, cultural identities, religious values, and past political experiences (Kane and Mann Reference Kane and Mann1992: 447–48; Linz Reference Linz1976: 384). Malefakis’s (Reference Malefakis1971: 252) classical study argued that the 1932 republican land reforms created fear and resentment among middle-size owners in territories where no latifundia existed. However, Robledo’s (Reference Robledo2002: 127–29) recent study has shown that the number of middle-size landowners affected by agrarian reforms was extremely small. Furthermore, it must also be kept in mind that a large proportion of peasants in Central and Northern Spain owned very little land and were indeed very poor (Castillo Reference Castillo1979: 30–31).
Now, as indicated above, other social and cultural factors must be taken into consideration when examining the positions of small- and middle-size landowners. In the Spanish case, as Linz (Reference Linz1976: 384) pointed out, the absence of a previous anti-seigneurial revolution and the strong cultural influence of the Catholic Church could have predisposed these rural groups towards conservative positions. To this, one should add the strength of Spanish nationalist feelings and the hostility towards peripheral nationalisms and working-class internationalism in many areas where small and middle-size landowners prevailed.Footnote 2 For these reasons, and irrespective of the objective economic risks posed by land reforms, one can expect conservative discourses on the threats faced by private property, Catholic values, and national unity to have more resonance in territories where small- and middle-size holders prevailed. It is not surprising, therefore, that, as previous studies have underscored, the CEDA found strong support among smallholders in central and northern central Spain (Linz Reference Linz1976: 386 and 427; Schatz Reference Schatz2001). To map the characteristics of agrarian class structures, this analysis uses García-Badell y Abadía’s data (Reference García-Badell y Abadía1960) on the average extension of rural land held by owners in 1959 in all Spanish provinces.Footnote 3
The analysis of the determinants of conservative voting must also take into consideration other potentially relevant social, cultural, and organizational factors. Conservatively oriented social and cultural organizations were crucial for the success of right parties (Bartolini Reference Bartolini2000; Eley Reference Eley1980; Riley Reference Riley2010; Ziblatt Reference Ziblatt2017: 127). The delayed and territorially fragmented character of Spanish modernization certainly constrained the development of civic associations (Riley Reference Riley2010). However, in the conservative political space, these limitations may have been overcome thanks to the crucial role played by activists and organizations linked to the Catholic Church. Kalyvas (Reference Kalyvas1996) has shown the crucial importance of lay Catholic organizations for the mobilization of religious voters and the success of confessional parties. Their role in Spain was enhanced by the importance of the religious cleavage. According to Bartolini’s classification, the Spanish case should be labeled as one of ideological clericalism, that is, a situation characterized by the strong opposition between the Church and liberal and anticlerical forces, the alignment of the Church with conservative groups, and, finally, the engagement of the Church in political conflicts before the emergence of the socialist movement (Bartolini Reference Bartolini2000: 458). Based on Kalyvas’s analytic framework (Reference Kalyvas1996: 25), it is possible to understand how this context led to a rapid transition from the organization of Catholics to their electoral mobilization. In turn, the electoral success of this strategy led to the formation of a confessional and conservative party, the CEDA, whose consolidation would only be interrupted by the 1936 civil war. Of course, this dynamic was facilitated by the previous weakness of conservative partisan organizations.
As Kalyvas has shown (Reference Kalyvas1996: 100–102), lay Catholic associations played a critical role in the process of electoral mobilization. The reason for that lay in several key characteristics of these organizations, such as their strong adherence to shared social and political values, the intensity and stability of their members’ participation, their discipline, and their extended social and territorial penetration. All these characteristics also contributed to the encapsulation of the Catholic electorate and the crystallization of the religious cleavage (Bartolini Reference Bartolini2000: 22–23, 256; Bartolini and Mair Reference Bartolini and Mair2007: 214).
In the first third of the 20th century, the Spanish Catholic milieu was characterized by the presence of a myriad of lay social organizations. Among them, one should mention Acción Católica Española (Spanish Catholic Action), Juventud Católica Española (Spanish Catholic Youth), Congregaciones Marianas (Marian Societies), Asociación Católica Nacional de Propagandistas (National Catholic Association of Propagandists – ACNP), and Confederación Nacional de Obreras Católicas (National Confederation of Female Catholic Workers) (De la Cueva Merino Reference De la Cueva Merino, López Villaverde, Botti and de la Cueva Merino2005). In addition to embracing the religious views of the Catholic Church, these organizations advocated a combative mobilization against secularizing ideas and reforms, always under the banners of Catholicism and Spanish nationalism (De la Cueva Merino Reference De la Cueva Merino, López Villaverde, Botti and de la Cueva Merino2005: 46; Verdoy Reference Verdoy2010: 557–58; Vincent Reference Vincent1996).Footnote 4 Their political involvement was no doubt accelerated by the secular legislation of the Second Republic. In 1932, the Republic approved the dissolution of the Jesuit Order and enacted a divorce law for the first time. In 1933, a law was passed that decreed the suppression of Catholic schools, which at that moment enrolled almost 4,00,000 students. This law eliminated also public funding for the activities and buildings of the Church. In this context, Church authorities called for the social and political mobilization of Catholics to block and revert the Republic secularist reforms (Gil Pecharromán Reference Gil Pecharromán2002: 142–44).
Other social organizations combined the defense of economic interests and Catholic ideas. Perhaps the most important of them was the Confederación Nacional Católico-Agraria (National Agrarian Catholic Confederation – CNCA), a union of agrarian associations created in 1917 with the strong support of the Catholic church and close social actors, such as the elitist Asociación Católica Nacional de Propagandistas (ACNP) and the newspaper El Debate (Castillo Reference Castillo1979: 90–103). In the 1930s, the CNCA had almost 2,00,000 members (Linz Reference Linz and Jerez2013: 270). Both the ACNP and El Debate would play prominent roles in the development of the CEDA. It is very revealing, for instance, that the percentage of CEDA national legislators who belonged to the ACNP was 27.8 percent and 29.5 percent in the 1933 and 1936 legislatures, respectively (Linz and Jerez Reference Linz and Jerez2013: 55). The CNCA purported to defend agrarian interests by protecting national products, promoting favorable legislation, creating credit cooperatives (Cajas de Ahorros), and facilitating to rural workers access to property. It also had the general goals of promoting Catholic values and blocking the growth of class-based unions. The CNCA was a mixed organization aimed at integrating different social strata (owners, tenants, workers), but in fact, it was dominated by staunchly conservative leaders and large landowners. It played an active role in the opposition not only to the left agrarian policies but even to the moderate reforms advocated by Christian-democratic CEDA members, like the minister Giménez Fernández in the period 1934–35 (Castillo Reference Castillo1979: 371–82; Montero Reference Montero1977). The political importance of the CNCA is illustrated by the fact that in 1931, its secretary general was José M. Gil-Robles, the future leader of the CEDA. There is data available on the membership of the CNCA in the 1920s, which makes it possible to measure the organizational power of the catholically oriented large and middle-size landowners. The strength of the CNCA reflects the mutually reinforcing interaction of Catholic institutions and agrarian interests in a logic that was both top-down and bottom-up (Simpson and Carmona Reference Simpson and Carmona2020: 124).
Another important social characteristic affecting the success of conservative parties was the literacy level of Spanish districts. In general, literacy facilitates public communication and increases political sophistication (Converse Reference Converse and Apter1964). It also favors the development of party-voter links based on ideological and programmatic alternatives, thus helping to overcome strictly clientelistic exchanges. Furthermore, to the extent that alphabetization is positively associated with the diffusion of values and identities by state and religious institutions, and given the predominantly conservative, nationalist, and Catholic character of education under the previous Restoration regime, one would expect higher literacy levels to favor the appeal of anti-revolutionary, center-right or right political alternatives. The importance of this explanatory factor is underscored by the fact that Spanish literacy levels consistently lagged behind Western European standards in the 19th and 20th centuries, not reaching the 75 percent threshold until the 1930–40 decade (Gutiérrez and Quiroga Reference Gutiérrez and Valle2023). In the case of Spain, Beltrán Tapia and Martínez-Galarraga (Reference Beltrán Tapia and Martínez-Galarraga2018) show that land inequality had a strong negative effect on literacy levels in the 19th century. They also show that in the in the 19th century there was a positive association between literacy levels and the per capita number of priests (Beltrán Tapia and Martínez-Galarraga Reference Beltrán Tapia and Martínez-Galarraga2018: 99).Footnote 5
Now, one must also consider the plausibly opposed effects of rapid increases in literacy levels as a result of urbanization and modernization. Demands for democratization and even social reform could be felt much more strongly by voters in rapidly modernizing territories, even after controlling for industrialization levels (Lipset Reference Lipset1959: 79–81). As a result, and in contrast to the presumably conservative effects of long-term literacy levels, one would expect increases in literacy to weaken traditional conservative alternatives. Finally, given the crucial importance of center-periphery conflicts in Spain this analysis includes a dummy variable for the presence of languages different from Spanish. Rokkan (Reference Rokkan1999: 171) identified language as one of the most important elements shaping identities and accounting for the persistence of peripheral distinctiveness. The key role of linguistic differences in the activation of peripheral identities has been underlined by different studies on the Spanish case (Linz Reference Linz, Eisenstadt and Rokkan1973; Llamazares et al. Reference Llamazares, Marcos-Marné and Martín-Vallejo2017).
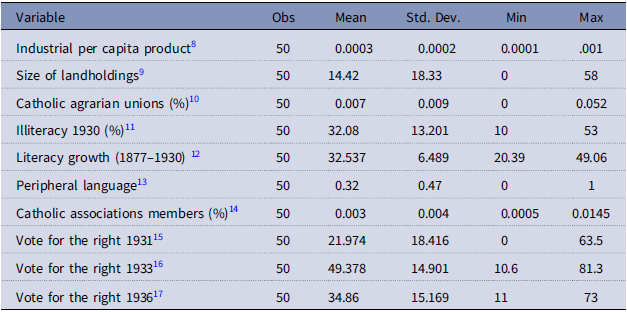
Based on the previous discussion, there are a number of main expectations to be tested in the statistical analysis. In terms of socio-economic factors, it is expected that the higher the industrialization levels, the lower the electoral performance of the right. One would also expect that the higher the average size of landholdings, the lower the electoral success of the right. In terms of the role of associational variables, the stronger the membership of Catholic agrarian unions and Catholic civic associations, the more success one would expect the right to have. In terms of the role of cultural factors, the right could be expected to be more successful in provinces with lower illiteracy rates and weaker in territories with high increases in literacy. Finally, conservative electoral performance would be expected to be poorer in provinces where a language different from Castilian Spanish is spoken. Table 2 displays the descriptive statistics for all the variables included in the analysis.Footnote 6
Descriptive statisticsFootnote 7
Analysis
To assess the role of different social and economic characteristics in the electoral success of the right, I have conducted multivariate regressions on the provincial conservative results at each legislative election.Footnote 18 The purpose of this analysis is not to propose an encompassing explanation of the electoral success of the right (which may be affected by many other factors, including special events and provincial supply side idiosyncrasies) but to assess how structural characteristics conditioned the results of right parties in the 1931, 1933, 1936 elections. This analysis does not aim either at assessing the factors accounting for the general evolution of conservative voting, which might have been affected by political events, economic cycles (Palafox Reference Palafox1991) or, if one extends inferences drawn from other cases (Eley Reference Eley1988: 92), the consequences of the introduction of women’s suffrage after 1931. Far from assuming permanent effects across time, the analysis of these three elections makes it possible to assess how the content and intensity of the associations of right vote and social characteristics evolved across time. In so doing, this analysis takes into consideration the historical nature of political and electoral processes.
Unfortunately, the lack of systematic electoral and census data makes it impossible to address the Modifiable Area Unit Problem (MAUP) (Wong Reference Wong, Fotheringham and Rogerson2009) by replicating analyses at lower territorial levels. This kind of data is not available at the municipal level for crucial explanatory variables. As for the variables for which data can be accessed, it would be necessary to conduct intensive online and offline archival research in order to gather all the information needed. This task must remain the objective of future research. These data limitations also make it impossible to conduct spatially varying coefficient models, as in Slez (Reference Slez2022).
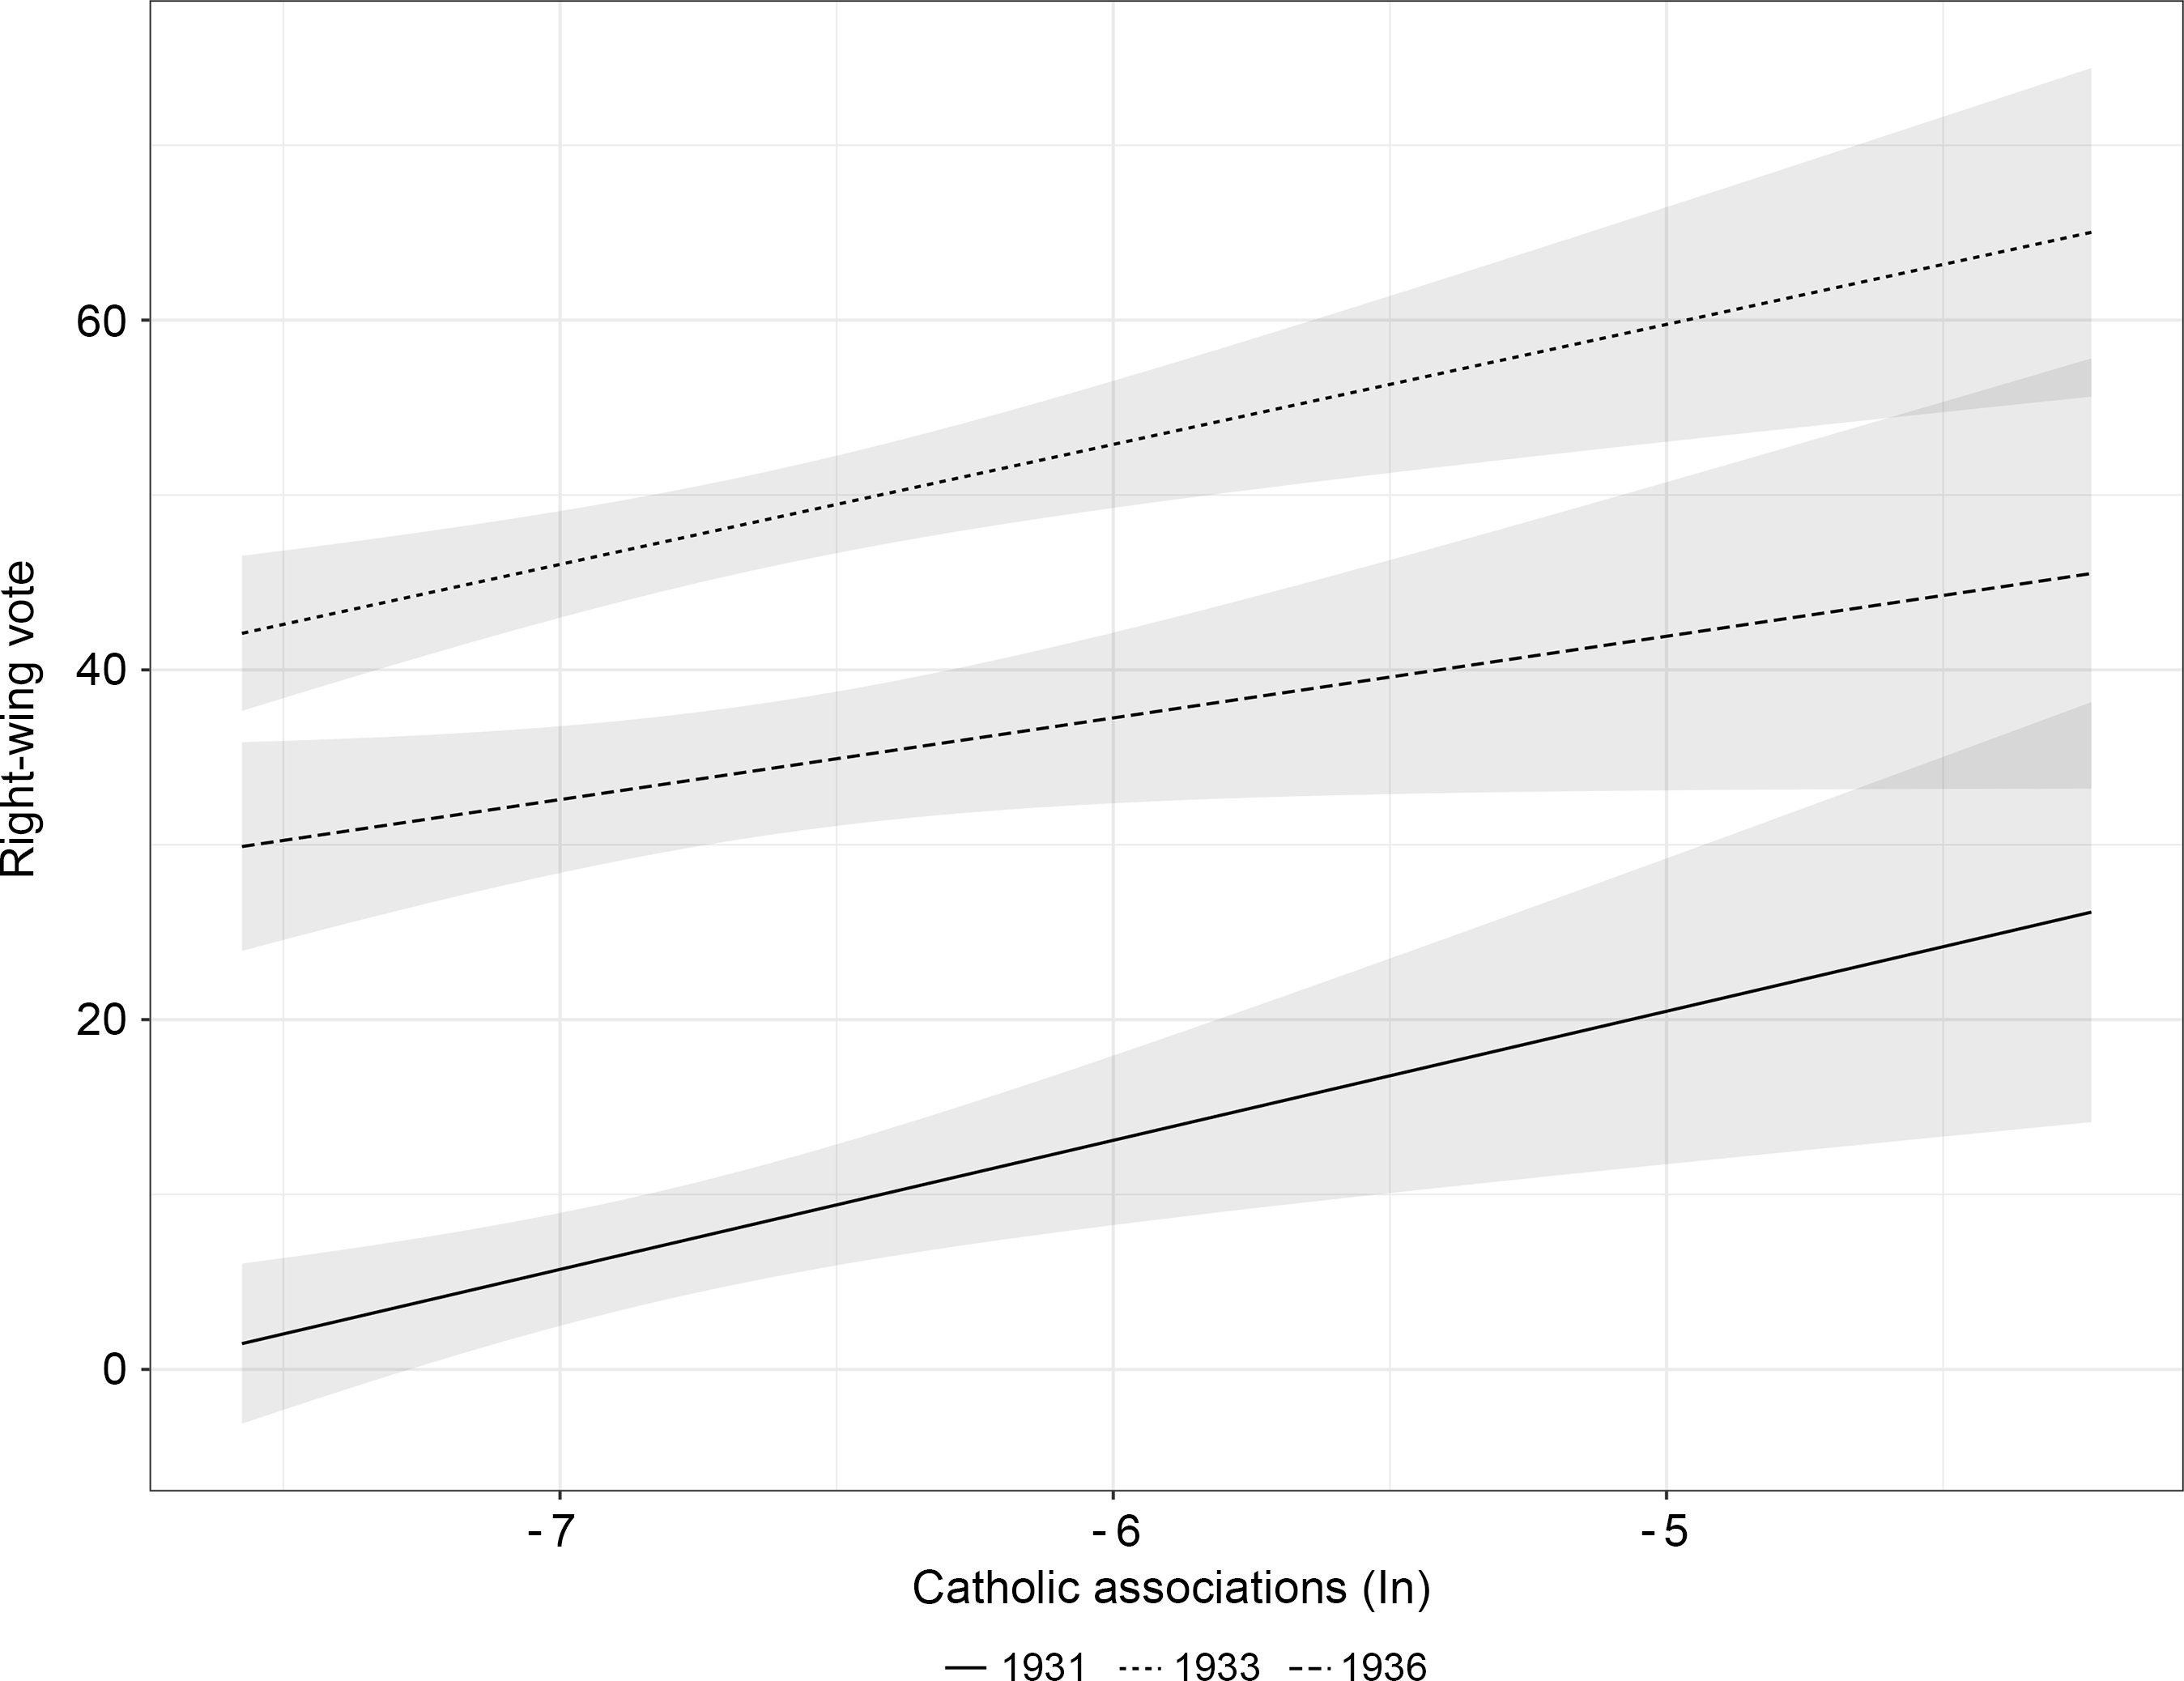
Table 3 reflects the results of the OLS multivariate regressions conducted to account for conservative voting,Footnote 19 and Figures 4–10 display the marginal effects of the independent variables in each election. Statistical results reveal the presence of some clear patterns of association between the conservative vote and the social characteristics of Spanish provinces. As the R 2 values show, the selected structural variables account for a substantial portion of the variation of the conservative vote. In all elections, the vote for the right was positively influenced by the presence of lay Catholic associations. This result is consistent with the discussion in section two on the importance of the religious cleavage. It is also consistent with the expectation of the role played by the Catholic civil society in mobilizing voters hostile to secularizing reforms.
Multivariate regression. Predictors of the electoral performance of the right in the 1931, 1933, and 1936 legislative elections (first round). Observations have been clustered into regions. Robust standard errors in parentheses
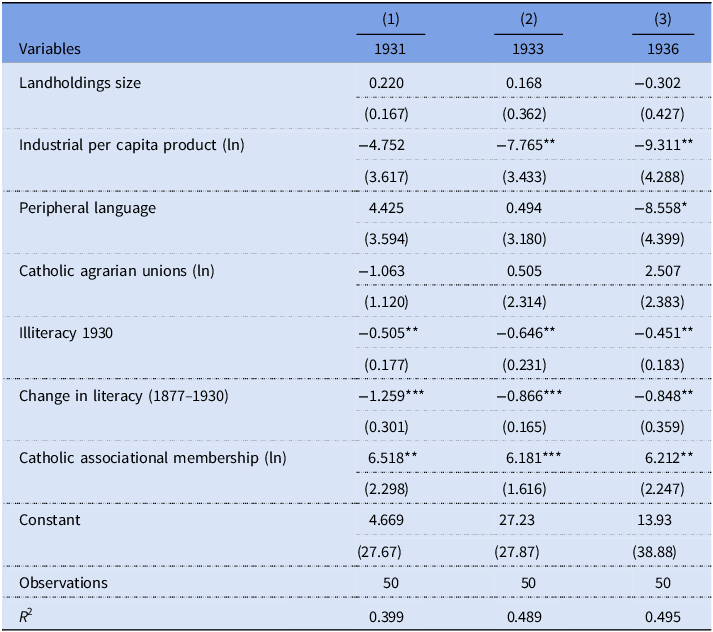
Robust standard errors in parentheses.
*** p < 0.01, ** p < 0.05, * p < 0.1.
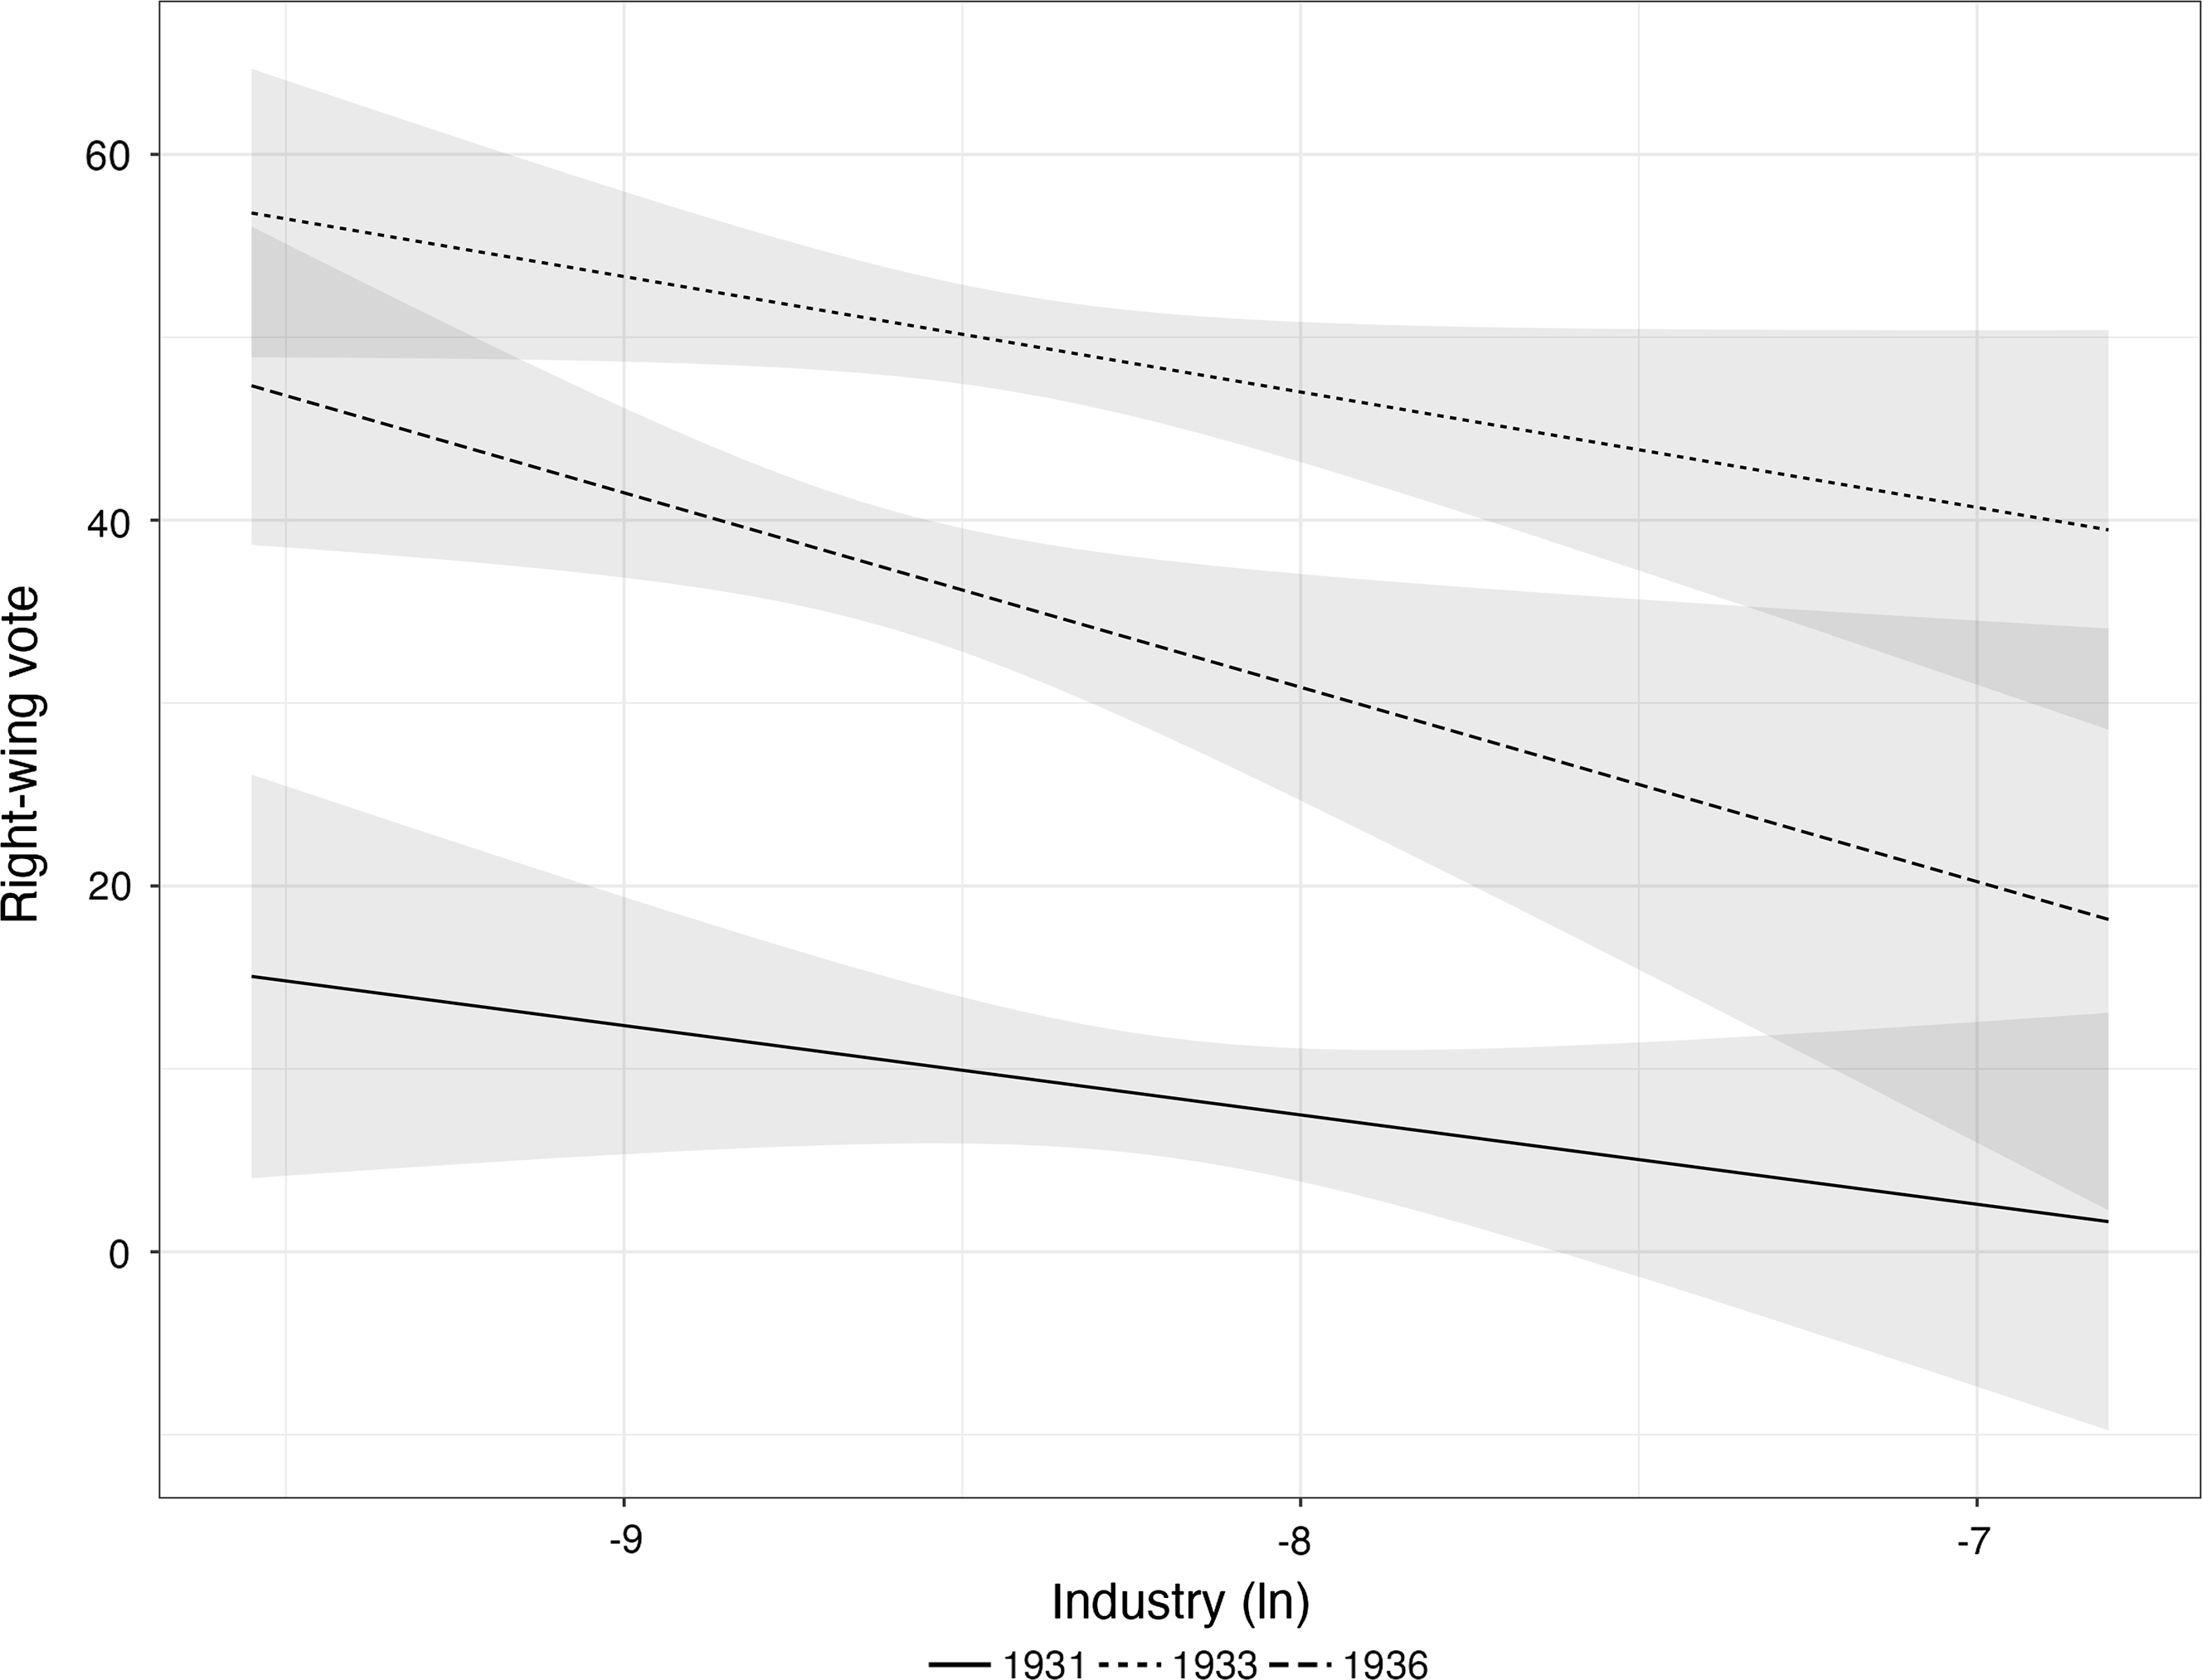
Marginal effects. Industrialization levels and vote for the right.
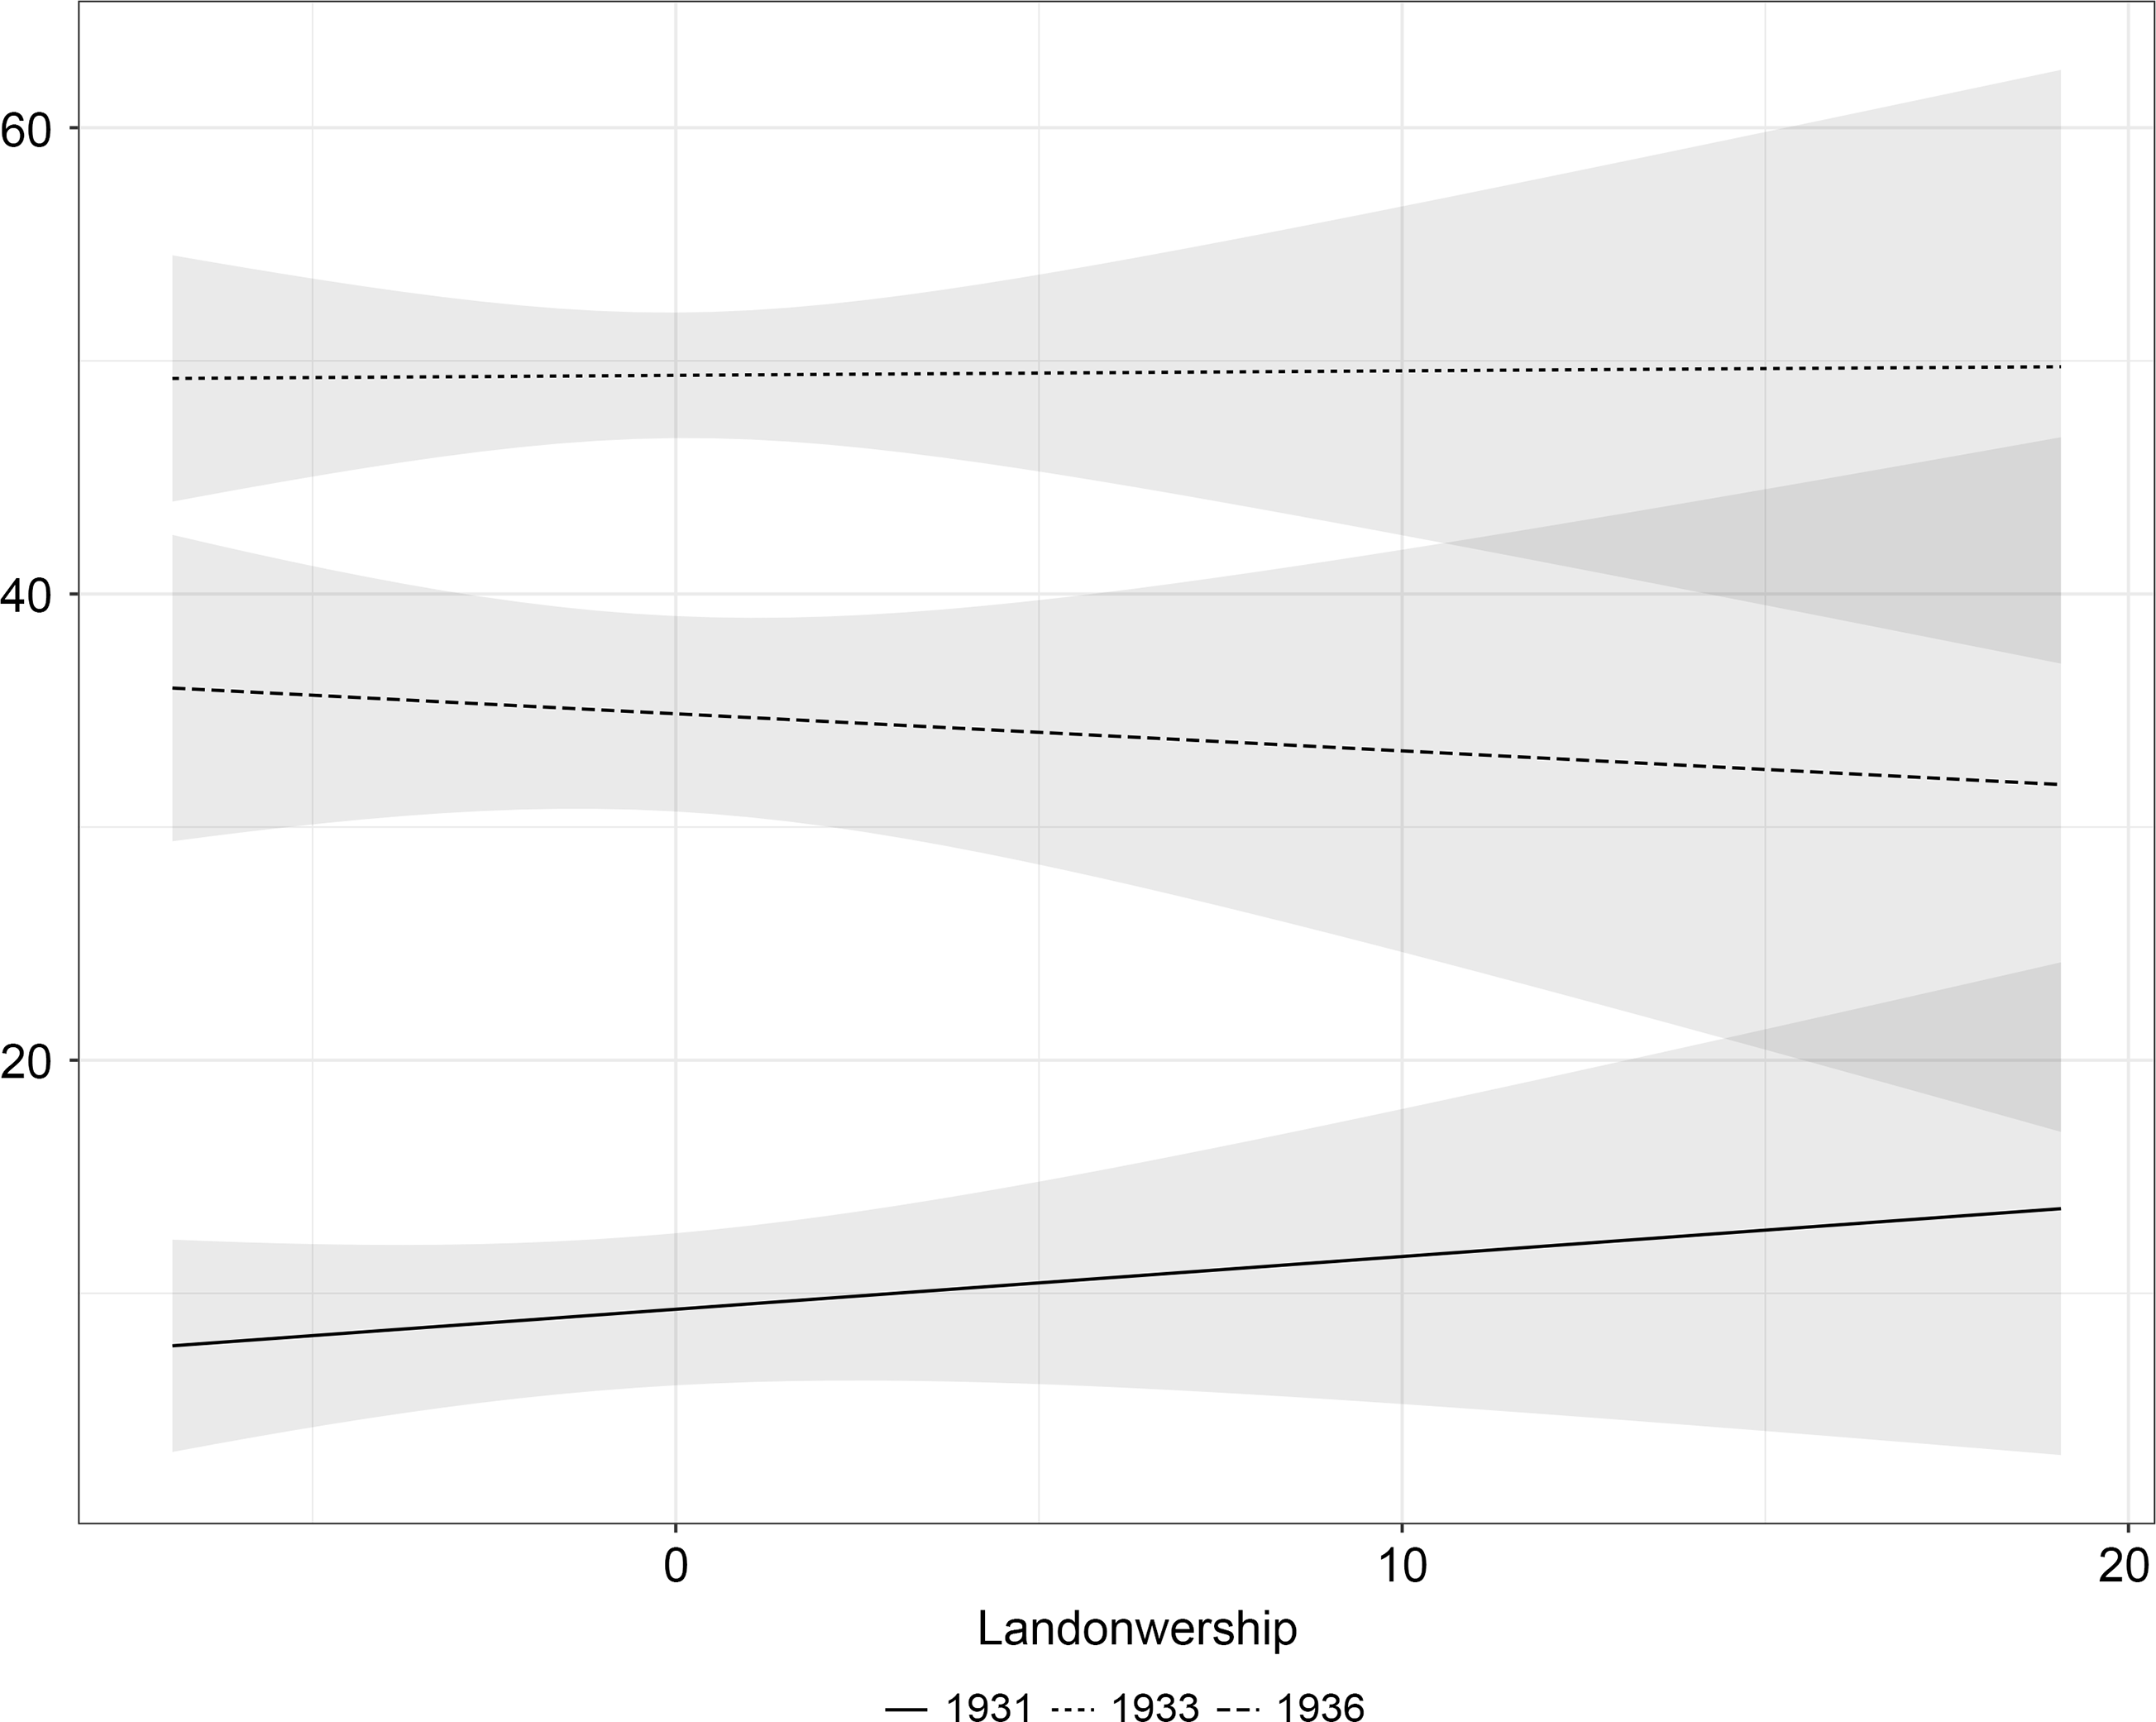
Marginal effects. Size of landholdings and vote for the right.
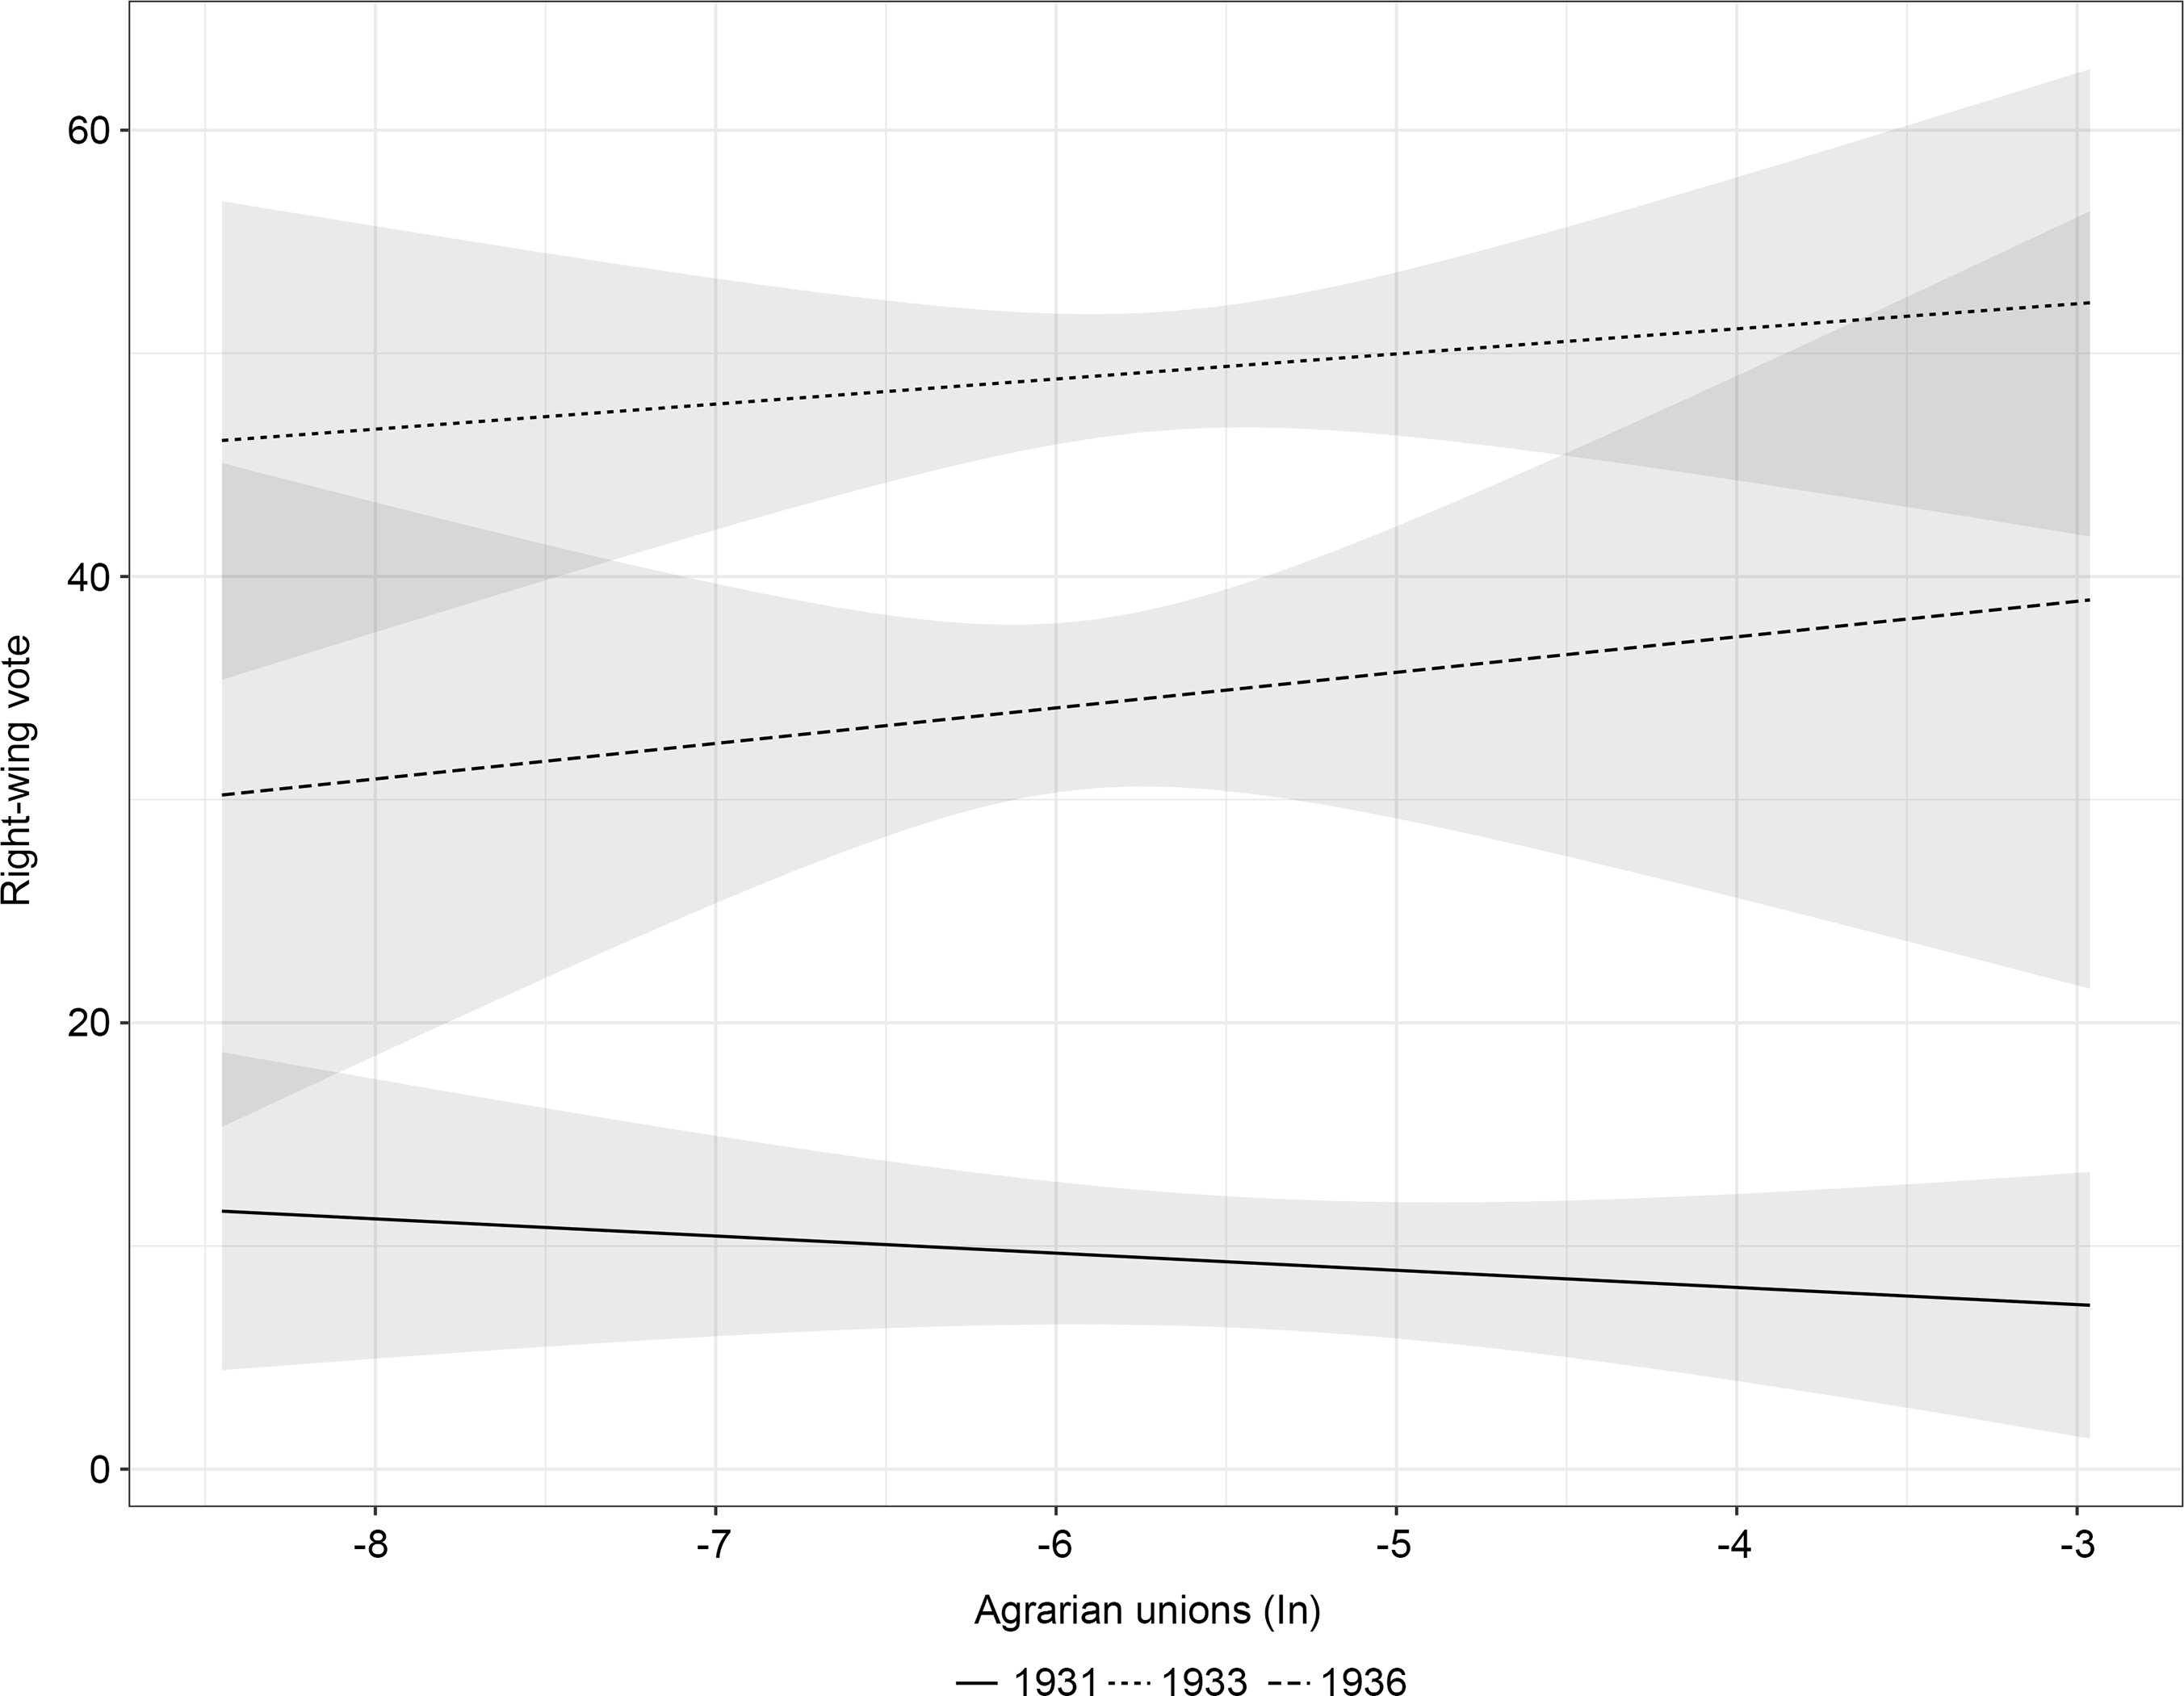
Marginal effects. Agrarian unions and vote for the right.
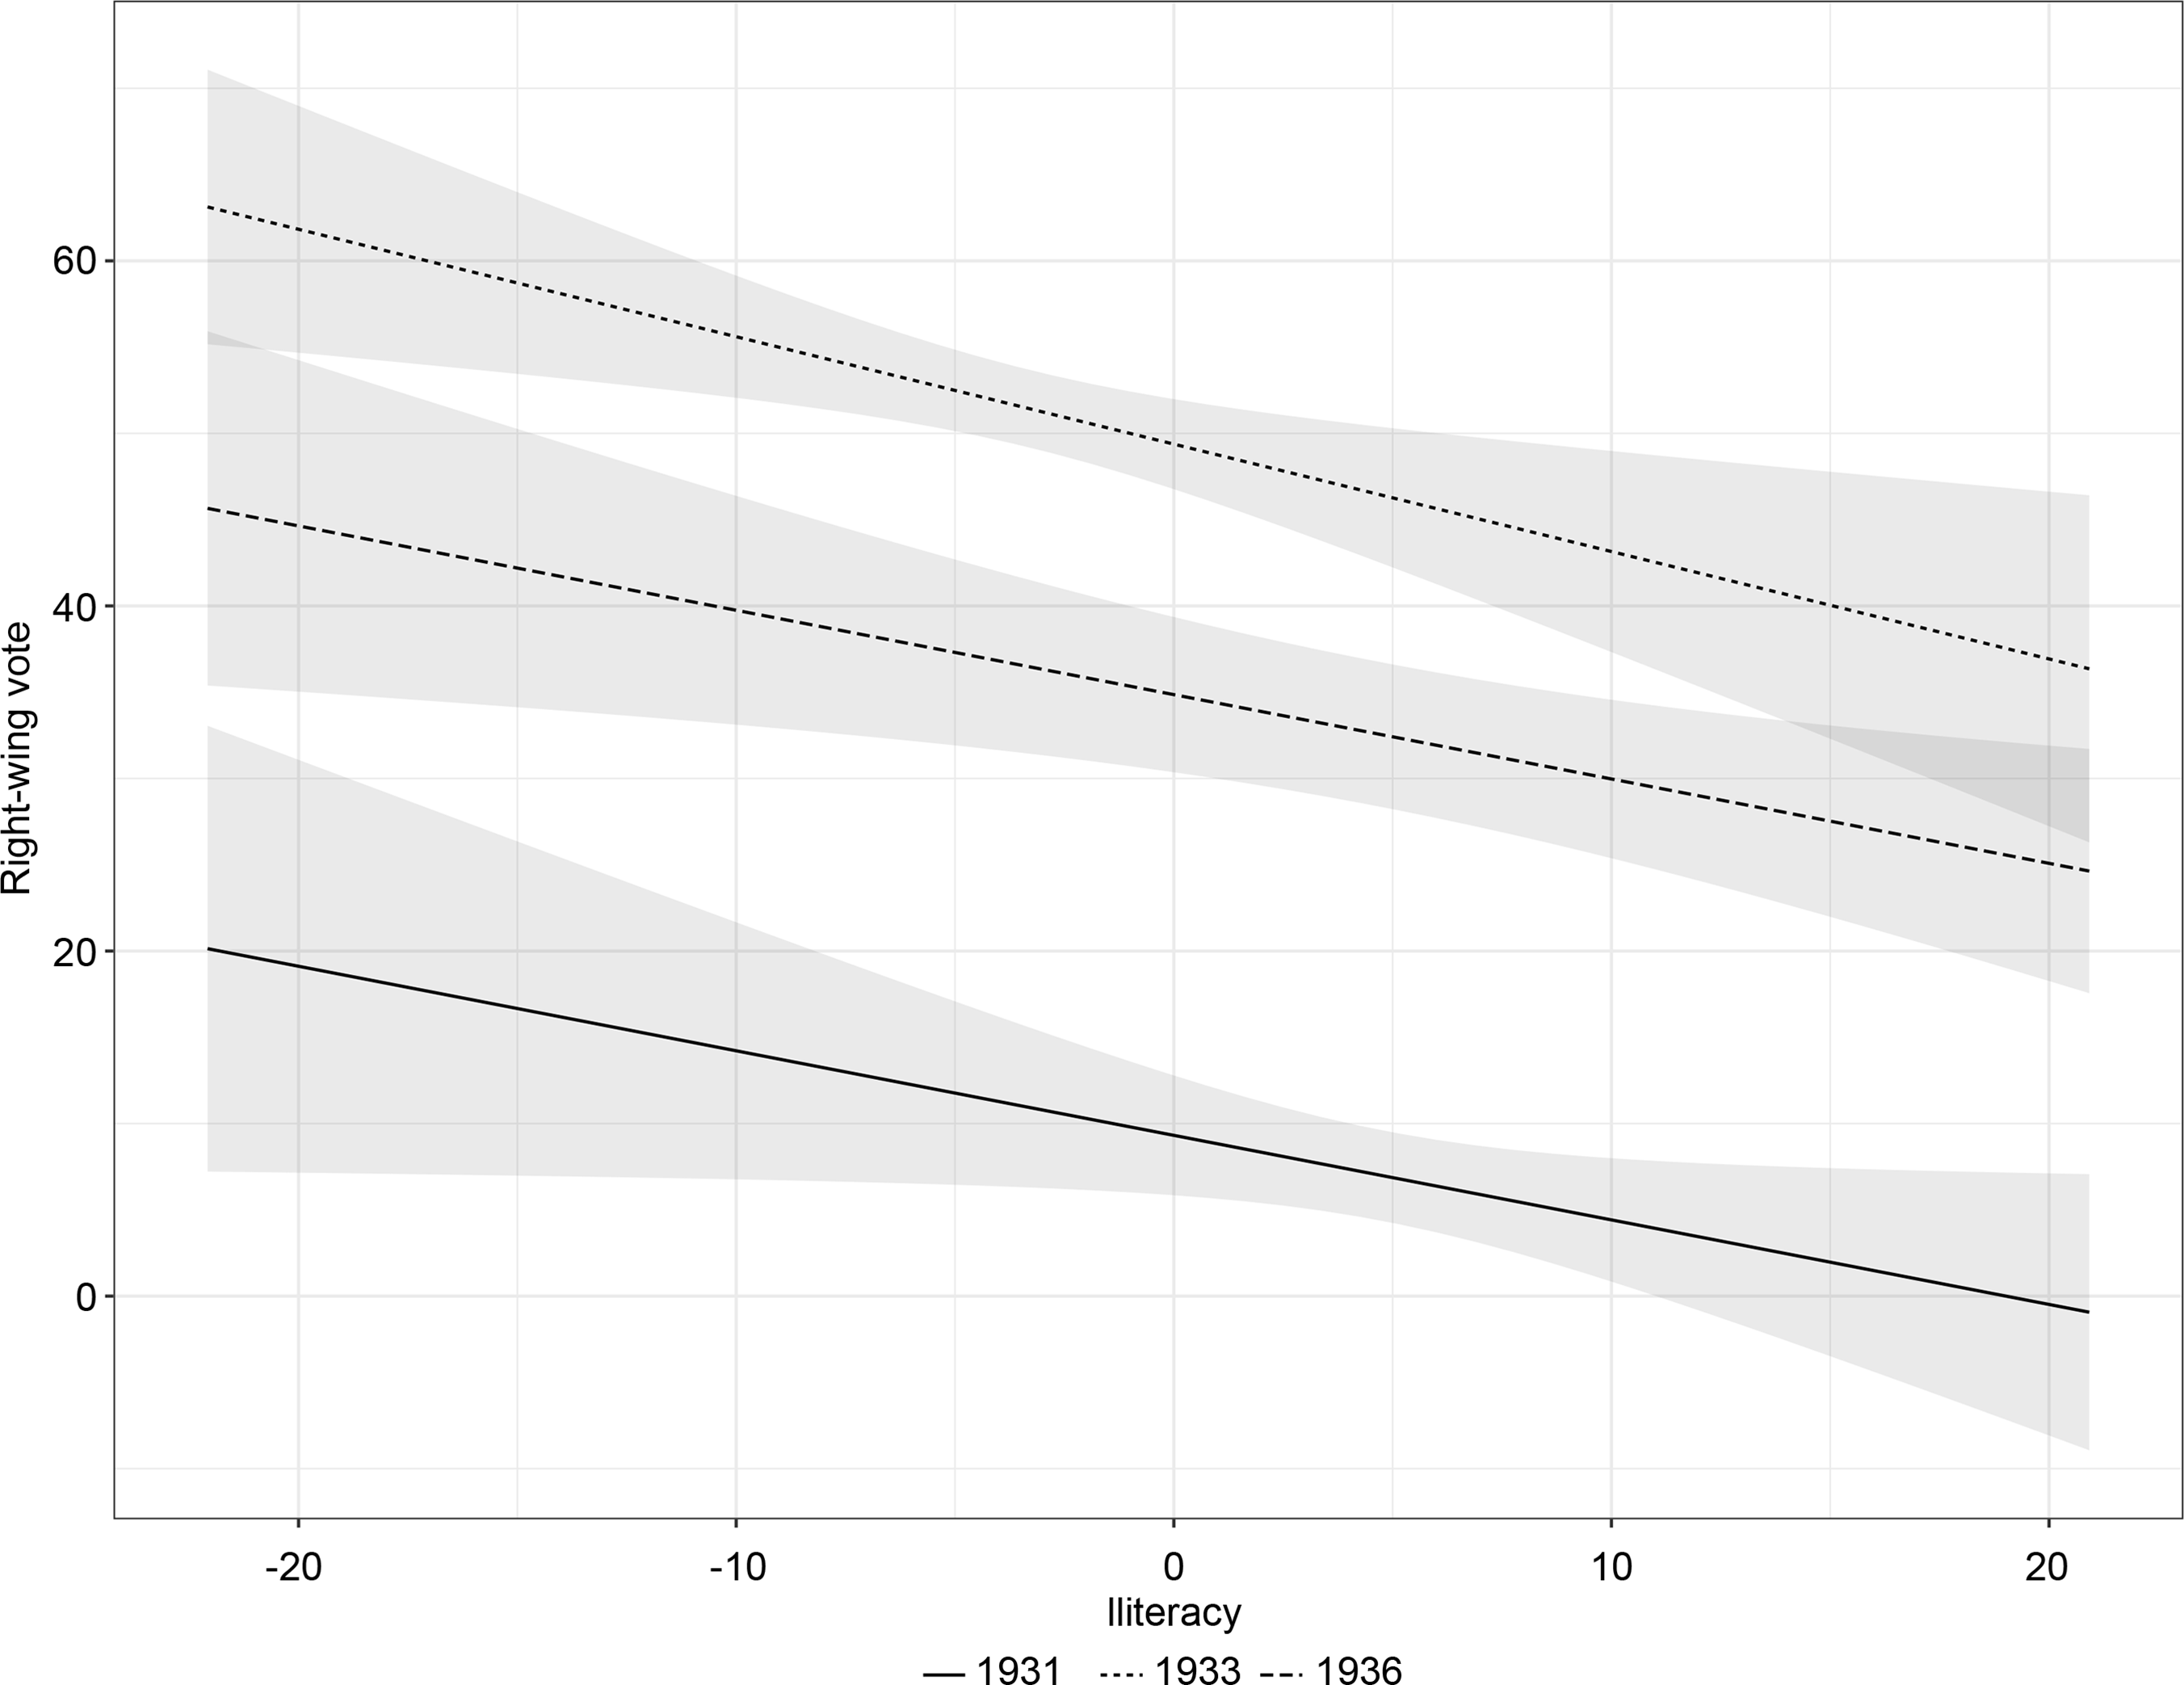
Marginal effects. Illiteracy and vote for the right.
Marginal effects. Literacy growth and vote for the right.

Marginal effects. Lay Catholic associations and vote for the right.
Marginal effects. Peripheral language and vote for the right.
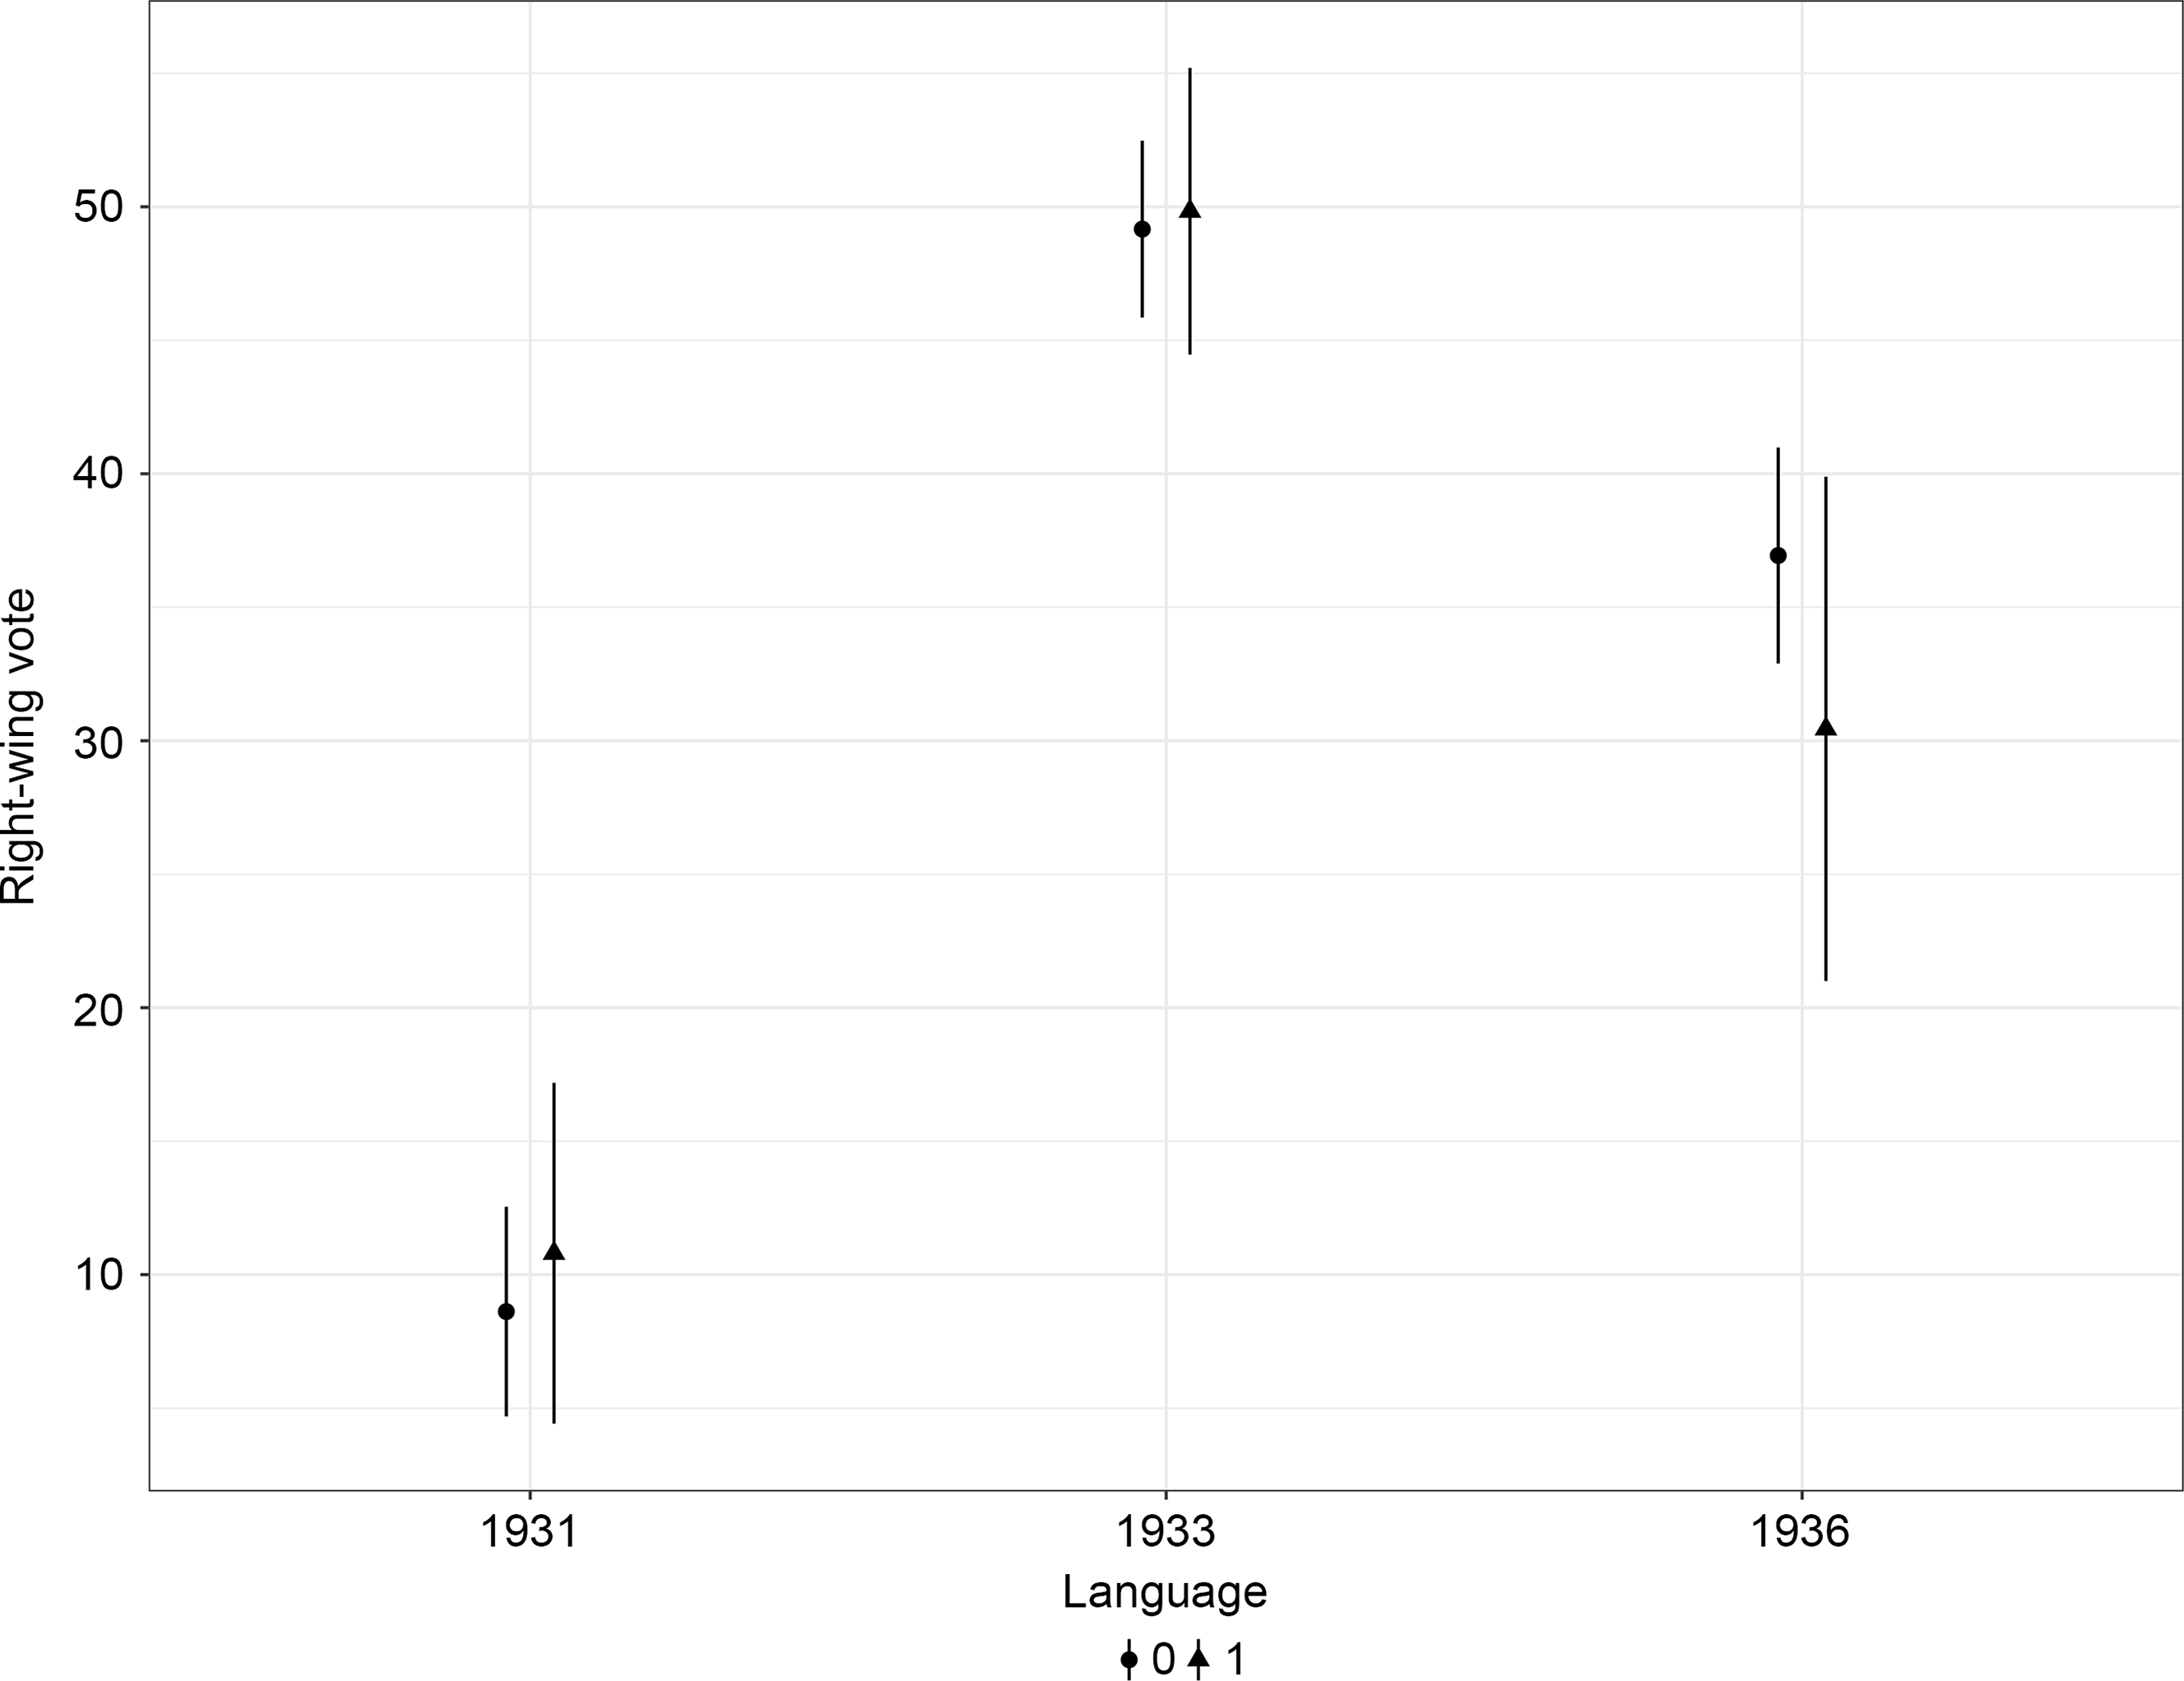
As expected as well, illiteracy levels and growth in literacy levels had negative effects on the vote for the right. The predictors for the literacy variables and lay Catholic associational membership are statistically significant at the .05 level, and their coefficients display relative stability (the larger change concerns the literacy growth coefficient, which decreases without stopping being statistically significant at the 0.05 level). Industrial production negatively affected the vote for the right at the 0.05 level in the 1933 and 1936 elections. This result confirms the expectations laid out previously on the basis of both cleavage formation theory and the labor law reforms implemented by the left republican governments. By contrast, neither landownership patterns nor the Catholic mobilization of agrarian owners conditioned conservative voting in these models. The coefficient for agrarian unions displays more instability, becoming larger and positive in the 1936 elections, but it does not reach statistical significance in these models. Finally, the linguistic distinctiveness indicator is negative and significant at the 0.10 level only in the 1936 elections, a likely result of the polarization of center-periphery conflicts and the growing hostility of the right towards regional autonomy.
The most remarkable negative finding concerns the null effect of provincial landownership patterns.Footnote 20 The effect of this variable could be conditional on other characteristics of the Spanish provinces, such as the percentage of people occupied in the rural sector. However, including interactions between this and other provincial characteristics did not render significant coefficients either. It is also plausible that the electoral effects of landownership patterns could be traced at the local but not at the provincial level. Testing this hypothesis would demand gathering data and conducting analyses at the municipal level, a task that can be addressed only in future research.
The relative importance of these different predictors can also be assessed by examining changes in explained variance after dropping variables from the full equation (see Tables 4–6). In the 1936 elections, the variables that most drastically improve the explanatory power of the OLS regression are, in this order, Catholic associational membership, industrial production, literacy growth, and illiteracy levels. In the 1933 the elections, the variables making a stronger difference are illiteracy, growth in literacy levels, and Catholic associational membership. Finally, in the 1931 elections the variables having stronger effects on conservative voting are literacy growth, Catholic associational membership, and literacy levels. Overall, as expected on the basis of the discussion laid out in section two, these models reveal the key importance of Catholic associational membership and literacy patterns and dynamics for conservative support. The positive effect of lay Catholic associations reveals the crucial role played by Catholic networks and organizations in the electoral mobilization of regional electorates. Literacy variables are of crucial importance also, but the causal mechanisms that led to their electoral effects are more complex and difficult to ascertain. Regarding the effects of previous changes in literacy levels, one can hypothesize that they went hand in hand with cultural modernization, and that this process of cultural change severely damaged support for conservative ideas, even after controlling for other correlates of economic modernization like industrialization levels. As for the effect of long-term alphabetization levels, it might be argued that this variable was already conditioned by other social factors associated with the success of the right, such as the cultural influence of the Church, the extent of agrarian inequalities, and the use of languages different from Castilian Spanish (Gutiérrez and Quiroga Reference Gutiérrez and Valle2023). Still, it must also be taken into account that these models are already controlling for land ownership patterns, the presence of peripheral languages, and the strength of the Catholic civil society. Interestingly enough, after dropping the illiteracy variable from the models, the indicator for agrarian associational membership becomes statistically significant at the 0.05 level in the 1933 and 1936 elections. One can only hypothesize that alphabetization processes taking place before industrialization, which were led either by the state or the Catholic Church, managed to spread traditional values and identities, particularly in contexts that were already fertile ground for these sorts of orientations and ideas (such as the territories of central-northern Spain, where literacy levels were traditionally high). This was not the case, by contrast, when alphabetization progressed at the same time as industrialization developed, in very different social and spatial settings, and also in context in which new and politically disruptive actors (for instance, trade unions) articulated completely different values and identities.
Multivariate regression. Predictors of the electoral performance of the right in the 1931 elections dropping one different variable in each model (with the exception of Model 8). Observations have been clustered into regions. Robust standard errors in parentheses
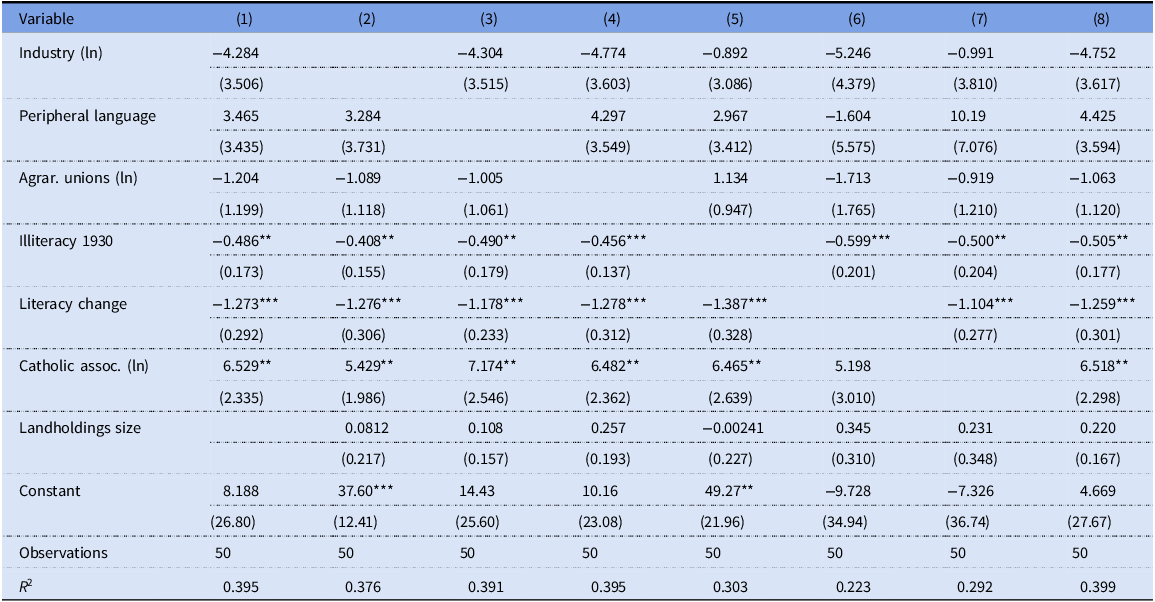
Robust standard errors in parentheses.
*** p < 0.01, ** p < 0.05, * p < 0.1.
Multivariate regression. Predictors of the electoral performance of the right in the 1933 elections dropping one different variable in each model (with the exception of Model 8). Observations have been clustered into regions. Robust standard errors in parentheses
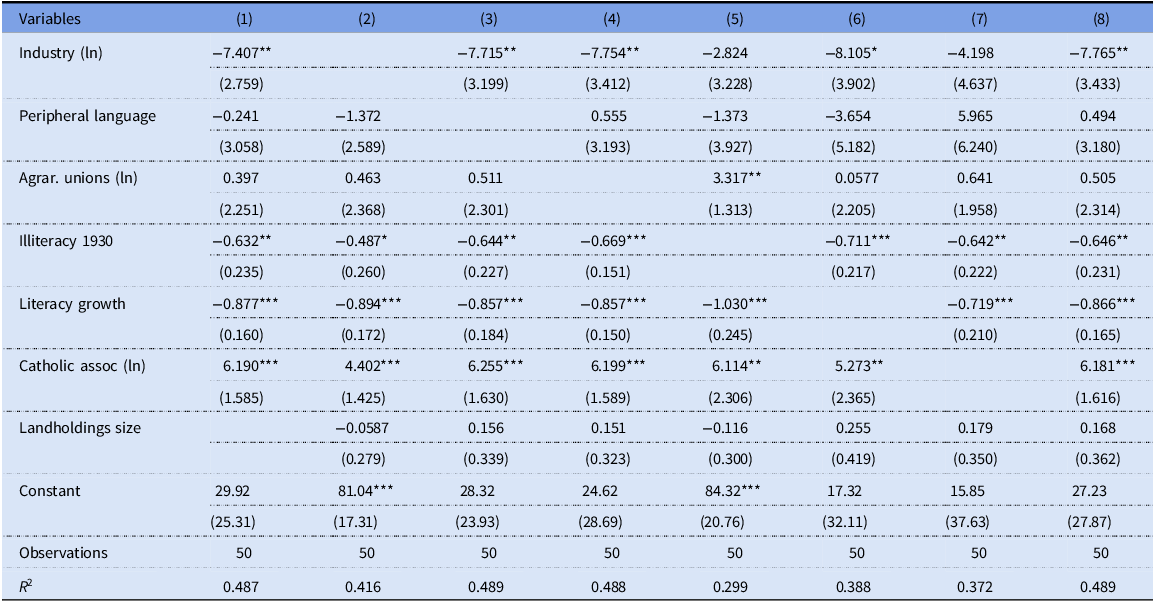
Robust standard errors in parentheses.
*** p < 0.01, ** p < 0.05, * p < 0.1.
Multivariate regression. Predictors of the electoral performance of the right in the 1936 elections dropping one different variable in each model (with the exception of Model 8). Observations have been clustered into regions. Robust standard errors in parentheses
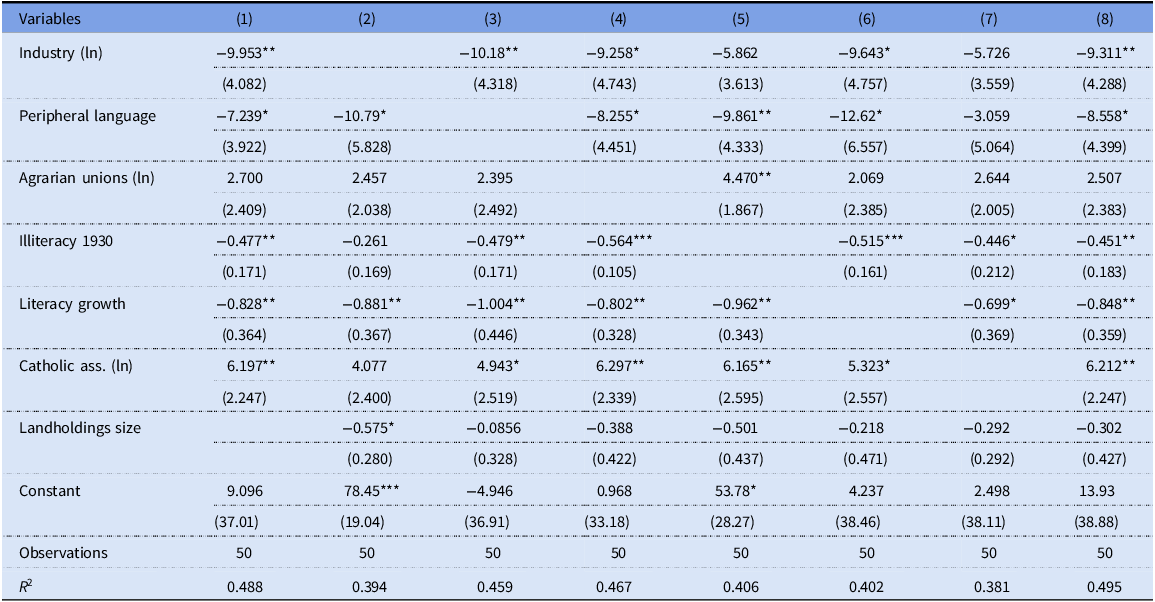
Robust standard errors in parentheses.
*** p < 0.01, ** p < 0.05, * p < 0.1.
Overall, my results confirm some of the expectations laid out in section two, particularly the crucial role played by Catholic activism, industrialization, and alphabetization in the explanation of the conservative vote. More generally, they also show that the conservative right managed to build a powerful base of electoral support in a very short period of time, grounding its success in the structural characteristics of Spanish territories. I now turn to the implications of these findings for understanding the situation of the right in that historical period.
Conclusion
At the beginning of the Second Republic, in 1931, Spanish conservative sectors lacked a stable and socially rooted political organization channeling their interests and ideas. This was the paradoxical result of the absence of a programmatic and competitive party system in the oligarchic and clientelistic Restoration regime (Varela Ortega Reference Varela Ortega1977; Ziblatt Reference Ziblatt2017). Furthermore, as analyzed by Luebbert (Reference Luebbert1991), the weakness of right and center-right actors was accentuated by cultural divisions splitting the middle and upper classes, especially by the center-periphery cleavage pitting Spanish against Catalan and Basque nationalisms. However, despite these initial limitations, the right managed to build a strong electoral coalition in a very short period of time. The analyses included in this paper shed light on this process by identifying the social and structural factors that allowed the right to surmount these initial limitations. These analyses show that conservative support was rooted in a set of interconnected social, economic, and cultural conditions. More specifically, they reveal that literacy levels, modernization processes, and lay Catholic associational life strongly conditioned the conservative success. Of course, this process was driven by both endogenous dynamics and exogenous shocks (Linz Reference Linz, Linz and Stepan1978). The Second Republic was marked by agrarian and religious reforms (1931–32) and counter-reforms (1934–35), as well as by the 1932 failed military coup and the 1934 October revolution and its traumatic sequels. The establishment of authoritarian regimes in Germany and Austria in the 1933–34 period also had a strong polarizing impact. These developments shaped and accelerated the cleavage crystallization process that took place during the Second Republic.
Perhaps one of the most important specific findings of this analysis lies in the strong association between the strength of lay Catholic associations and the electoral results of the right. Historical studies have already shown the key role played by the Catholic Church in the founding and organizational life of the CEDA (Montero Reference Montero1977). Analyses in this paper enrich previous knowledge on this topic by clearly showing the strong connection between conservative electoral performance and the presence of lay Catholic associations. This finding is consistent with Bartolini and Mair’s (Reference Bartolini and Mair2007: 2014) interpretation of the relationships between non-partisan civil society organizations and the formation and stabilization of political cleavages. It also confirms Kalyvas’s analysis (Reference Kalyvas1996) on the role of Catholic organizations in the development of confessional parties in Europe. Organizations connected to the Church and rooted in the state/church cleavage were able to mobilize important segments of the electorate on the basis of a combination of social and symbolic issues that articulated Catholic values and traditional conceptions of the Spanish national identity.
In the ideological frame articulated by the Spanish right, religious secularization, agrarian reforms, and Catalan nationalism had to be interpreted as existential threats to the values of Catholicism, social order, private property, and Spanish national identity. It is also this frame which allowed the right, in Riley’s terms (Reference Riley2010: 32, 194, 215), to achieve intraclass hegemony in most of Spain and interclass hegemony in many central and central-northern provinces. In so doing, conservative political actors managed to overcome the historical constraints identified by Luebbert’s (Reference Luebbert1991) and Ziblatt’s (Reference Ziblatt2017) illuminating analyses of the causes of democratic breakdowns in interwar Europe. By shedding light on the factors affecting the electoral performance of the Spanish right, I introduce important nuances in Luebbert’s and Ziblatt’s interpretations of the causes of conservative weakness and its consequences for democratic consolidation. Still, only by conducting similar analyses in comparable countries will it be possible to assess the generalizability of this paper’s findings.
Acknowledgements
I would like to thank two anonymous reviewers for their helpful comments and suggestions. I also wish to thank Carolina Plaza, Fatima García Díez, Hugo Marcos, Jorge Ramos, José Manuel Gutiérrez, Manuel Alcántara, and Margarita Gómez-Reino for their insights on earlier versions of this work. Special thanks are due to Alvaro Sánchez García for his research assistance and input throughout this project. The first version of this paper was presented at a meeting at the Universidad de Salamanca in September 2022. Funding for this meeting was granted by the Spanish Ministry of Science and Innovation (reference PGC2018–098207–B–I00).
Appendix
Pearson correlations between the independent variables
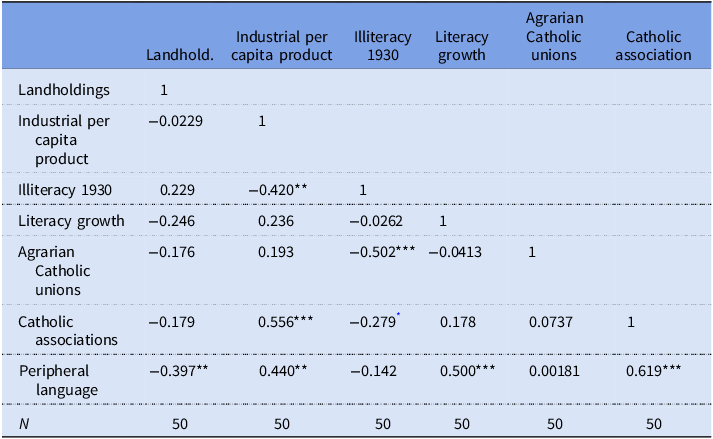
*p < 0.05, ** p < 0.01, *** p < 0.001.


 Open access