

1. INTRODUCTION
The prevailing theory to account for the slipperiness of snow and ice dates back to Bowden and Hughes (Reference Bowden and Hughes1939). Based on tribometer tests, they suggested that self-lubrication from frictional heating accounted for low kinetic (sliding) friction on both snow and ice substrates. Numerous subsequent studies produced results consistent with self-lubrication theory, and it remains widely accepted (Evans and others, Reference Evans, Nye and Cheeseman1976; Colbeck, Reference Colbeck1988, Reference Colbeck1992; Lehtovaara, Reference Lehtovaara1989; Persson, Reference Persson2000; Kietzig and others, Reference Kietzig, Hatzikiriakos and Englezos2010; Nachbauer and others, Reference Nachbauer, Kaps, Hasler, Mossner and Braghin2016; Hasler and others, Reference Hasler2016). Because snow consists of bonded ice grains, studies often assume that ice is an acceptable surrogate to study the mechanics of snow friction. However, snow is porous and much weaker than solid ice, and other mechanisms could play important roles. Here, we specifically focus on snow kinetic friction.
The theory of self-lubrication anticipates a transition of friction modes along a finite-length slider (e.g., ski, sled or test coupon). Dry contact occurs at the front. Further sliding warms and melts persistently contacting snow grains, and the melt layers eventually thicken to support the slider without solid–solid contact.
Little direct evidence exists to confirm the transition from dry to lubricated contact along a slider. In an attempt to verify self-lubrication theory, we were surprised to obtain contradictory results (Lever and others, Reference Lever2018). Our rotary tribometer established uniform friction conditions around a ring of polyethylene sliding over a stationary annulus of compacted snow. Once per slider revolution, a high-resolution infrared (IR) camera imaged the same patch of snow to document warming of the contacting snow grains. We supplemented this real-time thermography with post-test photography and digital microscopy. Interestingly, friction coefficients were low (μ < 0.03) for cases where slider shear produced widespread snow movement with no persistent contacts to melt. More importantly, when the snow grains did not move and persistent contacts evolved, the slider abraded rather than melted the grains at low resistance (μ < 0.05) even for tests exceeding 1200 m of slider travel. In these cases, maximum contact temperatures remained well below 0°C. It was this second observed mode, abrasion rather than melting of persistent snow-grain contacts, that contradicted prevailing theory.
Our objective for the present study was to test more broadly the hypothesis that dry-contact abrasion can govern snow kinetic friction. We explored two complementary lines of evidence: observational and theoretical.
To obtain additional observational evidence, we conducted snow-tribometer tests that focused on coordinating (spatially registering) real-time IR thermographs with post-test digital and scanning-electron microscope (SEM) images of the same snow grains. Our intent was to link the evolving shapes observed in IR during the tests with the flat-topped, snow-slider contacts observed in post-test microscopy. We also sought direct confirmation, via SEM, that the adjacent pore spaces could become filled with collections of abraded ice crystals (i.e., wear particles).
Theory can provide complementary insight into the role of abrasion. Researchers have attempted to quantify the processes thought to play roles within self-lubrication theory (Evans and others, Reference Evans, Nye and Cheeseman1976; Colbeck, Reference Colbeck1988, Reference Colbeck1992; Lehtovaara, Reference Lehtovaara1989; Bäurle and others, Reference Bäurle, Kaempfer, Szabo and Spencer2007; Makkonen and Tikanmäki, Reference Makkonen and Tikanmäki2014). However, the role of dry-contact abrasion has not been explored in detail, and our observations offer new opportunities to constrain theory. It is reasonable to ask, for example, whether theories for dry-contact abrasion and heat transfer would predict that snow grains preferentially abrade rather than melt under the conditions of our tests. We thus applied classical dry-contact abrasion mechanics (Archard, Reference Archard1953) and sliding heat-source theory (Carslaw and Jaeger, Reference Carslaw and Jaeger1959; Tian and Kennedy, Reference Tian and Kennedy1993, Reference Tian and Kennedy1994) to predict snow-grain contact-area and contact-temperature evolution.
We present here the methods used, results obtained and their implications for assessing under what conditions abrasion can govern snow kinetic friction.
2. APPARATUS AND TEST METHODS
We used the same rotary tribometer and IR camera (Supplementary Fig. S1) described by Lever and others (Reference Lever2018). Slider speeds and normal pressures spanned the ranges 0.36–1.4 m s−1 and 0.8–4.5 kPa, respectively. Test temperatures spanned the range −1 to −20°C.
The IR camera was a FLIR A6703sc with 3–5 µm wavelength sensitivity. Its 15 µm pixels provided contact-area resolution of 3 × 10⁻⁶ as a proportion of the 75 mm2 field-of-view. The camera captured an image (thermograph) of the stationary snow surface once per slider revolution (1.24 m) through a slot in the slider. We estimate better than 0.1°C accuracy from −20 to 0°C (Lever and others, Reference Lever2018).
We collected fresh, natural snow during the winters of 2016 and 2017 to prepare the snow samples. We sieved and graded the snow into a tray, compacted it flat and allowed it to sinter 2–5 d. The resulting snow was qualitatively strong (hand snow-hardness of R4; Colbeck and others, Reference Colbeck1990) with bulk densities of 400–500 kg m−3. Samples made from the 2016 snow consisted of well-rounded, coarse grains (0.3–0.4 mm average size), while those made from the 2017 snow had more irregularly shaped, finer grains (0.1–0.3 mm average size).
The IR camera captured the real-time evolution of snow-grain contact areas and temperatures during each test. After each test, we attempted to insert a metal registration pin into the snow, within the field-of-view of the IR camera, without disrupting the snow surface. We were successful on several occasions, which allowed us to coordinate the IR-documented evolved grain shapes with post-test visible-light and SEM micrographs of the same features.
We installed, in the same cold room as the tribometer, a Keyence VHX-2000 digital (visible-light) microscope fitted with a 20–200× zoom lens. We previously observed that for tests where persistent snow-slider contacts evolved, the slider produced a partially glazed snow surface. By tilting the microscope lens and light source away from each other ~20° off vertical, specular reflection revealed the same polished-grain shapes as captured in IR at the end of the test. Microscope imaging typically occurred a few minutes after each test.
We then extracted snow specimens for SEM imaging. These specimens were ~2 cm × 2 cm × 1 cm deep and included the polished surface with registration pin and a separate area that had not been contacted by the slider (between the slider and the snow-tray walls). We placed these specimens in an insulated box containing dry ice and transported them to the SEM facility at nearby Dartmouth College. In a cold room at −30°C adjacent to the SEM, we trimmed the specimens (~1 cm × 1.5 cm × 0.3 mm) to fit onto a copper holder that mated with a cold stage in the SEM. We adhered the snow onto the holder by using a syringe to place a water droplet under a corner, away from the area of interest. We then placed the copper holder into a small box containing liquid nitrogen and carried it to the SEM. It took <5 s to transfer the sample through room-temperature air to the pre-cooled cold stage in the SEM chamber. Overall, ~30 min typically elapsed between the end of a test and the beginning of SEM measurements; during most of this time, the sample was colder than −30°C.
The SEM was a FEI model XL-30 FEG ESEM. It had a liquid nitrogen-cooled C1001 Gatan cold stage, which held the samples between −150 and −170°C during the analyses. We used a 20 keV electron beam. We did not coat the samples but minimized charging by using the environmental mode with N2 gas. We imaged the sample with the gaseous secondary-electron and backscatter detectors.
3. OBSERVATIONS
We conducted friction tests on 16 separate snow samples (Table 1) encompassing 68 combinations of slider pressure, slider speed and ambient temperature. For all tests, the snow samples easily supported the stationary slider, with no obvious compaction or lateral displacement of the snow under static load. Some snow samples were slightly colder than the air temperature at the start of the test, either because we did not allow sufficient time for the sample to equilibrate or because warm outside air entered the cold room during test preparation.
Summary of tribometer tests
Friction coefficients are 30 s average values. Maximum surface temperatures are from IR-camera thermographs.
* Tests conducted on coarse-grain, 2016 snow. All other tests used fine-grained, 2017 snow.
Tests 170518a and b used two snow samples prepared and tested separately.
We observed widespread inter-granular bond failure under the action of slider shear for seven of the 16 snow samples, similar to our previous tests (Lever and others, Reference Lever2018). Based on the IR images, the failures cascaded quickly, requiring only a few slider revolutions to transition from movement of the first grains to movement of all grains in the field-of-view. Three of these failures occurred during the first speed setting (0.36 m s−1) and the other four samples failed at higher slider speeds. Maximum snow-surface temperatures remained well below 0°C, and no persistent contacts developed. We stopped these tests when the displaced snow grains filled the slider view slot.
The remaining nine snow samples resisted slider shear sufficiently for a second mode of behavior to occur: abrasion of snow grains at persistent snow-slider contacts. For these tests, we usually incremented slider speed to 1.4 m s−1 and in some cases added weights to increase normal pressure. Maximum and average snow-surface temperatures increased throughout the tests, consistent with increasing frictional-heat input (Supplementary Fig. S2 shows typical examples). Yet with even persistent snow-slider contacts, maximum temperatures remained well below 0°C, and thus no melt-water layers were produced despite low friction coefficients (μ = 0.022–0.093) and sliding distances exceeding hundreds of meters. Interestingly, friction often increased rapidly at the start of the tests (Supplementary Fig. S2). We previously observed similar behavior (Lever and others, Reference Lever2018) and suggested that the slider initially broke or abraded the relatively few snow-grain contacts but then encountered higher resistance as abrasion increased contact area. Paired with concurrent temperatures, initial and final friction coefficients both showed decreasing trends with increasing temperatures (Supplementary Fig. S3), consistent with other laboratory and field data (Bowden and Hughes, Reference Bowden and Hughes1939; Huzioka and Hikita, Reference Huzioka and Hikita1954; Buhl and others, Reference Buhl, Fauve and Rhyner2001; Lever and Weale, Reference Lever and Weale2012; Lever and others, Reference Lever, Weale, Kaempfer and Preston2016).
Figure 1 shows a set of coordinated IR, digital-microscope and SEM images for a test that had persistent snow-grain contacts (170518a). The sequence of IR thermographs shows the evolution of contacting grain shapes at intervals of tens of meters of slider travel. For this test, air temperature was slightly warmer (−2.5°C) than the starting snow temperature (average −3.9°C). The IR thermographs thus revealed colder snow-grain contacts adjacent to warmer snow and pore spaces. The air apparently warmed the non-contacting snow surfaces and pore spaces, while abrasion exposed colder ice within the contacting grains. At the end of the test, we inserted a metal registration pin and re-imaged the surface in IR before imaging it under the digital microscope and SEM. The polished contacting grains produced specular reflection under the digital microscope (bright areas in Fig. 1f), and the SEM images revealed details of the polished grain tops and lacy deposits (porous structures) of sintered wear particles in the adjacent pore spaces. Supplementary Fig. S4 shows similar coordinated images for another test (170518b). For all tests with persistent contacts, the evolved contacting grains produced specular reflection in visible light, and the corresponding SEM images revealed similarly shaped, flat-topped grains distributed across an apparently common plane of polishing. To our knowledge, these are the first coordinated images of the evolution and post-test structure of actual snow-slider contacts.
Images taken during and after test 170518a. Full-frame IR images a–d taken during the test (red – warmest, blue – coldest) show evolving snow-grain contacts after 61 m, 185 m, 433 m and 813 m of slider travel. A registration pin inserted after the test (right side of e–g) enabled us to identify the same evolved contacts (example circled) on post-test IR image (e), visible-light micrograph (f) and mosaic of SEM micrographs (g). Note the slight melting from pin insertion between the circled feature and the pin. SEM image (h) shows the circled region at greater magnification. The red arrows in (h) point to lacy deposits of sintered wear particles that bridged the pore spaces and were themselves rubbed flat during the test. Surface-deposited ice grains from SEM preparation cast shadows on the flat-topped contact surfaces (blue arrows point to examples). Small (~5 µm) bright spheres on the grains are from condensation during sample transfer into the SEM. Slider travel was from bottom to top on all images, and the circles measure 2 mm diameter on images (a–g).
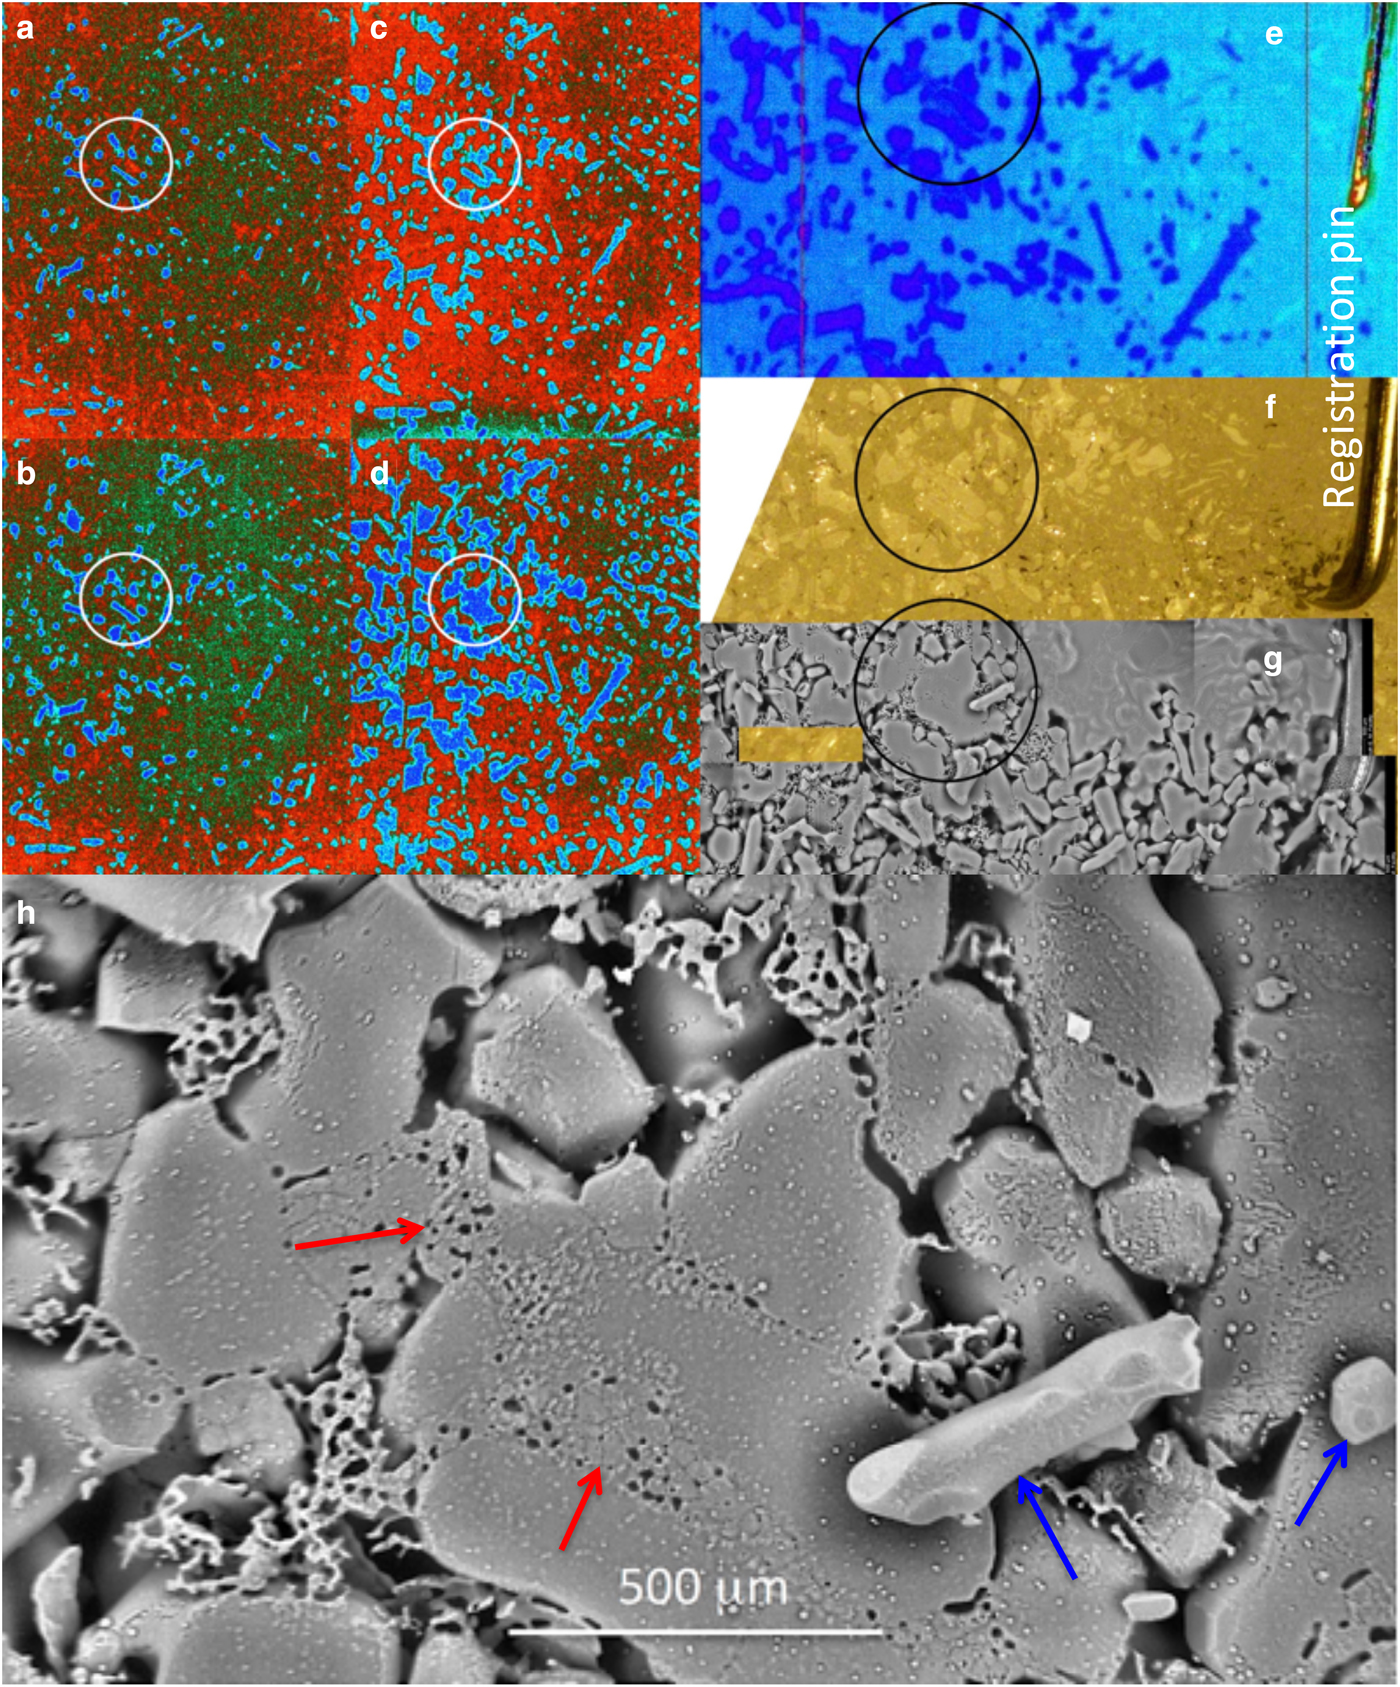
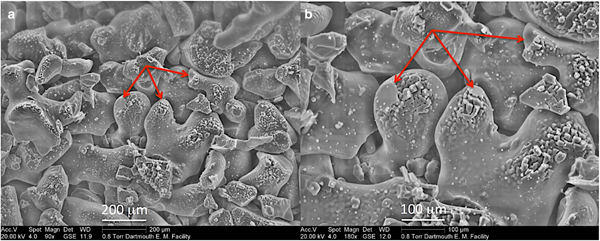
Figure 2 shows enlarged IR images from test 170518b that track the gradual formation of a specific snow-slider contact shape, together with an SEM image of the final shape. The IR images captured the slow merger of initially separated contacts. The SEM image revealed the constituents of this contact shape: solid snow grains abraded flat; below-surface lacy structures of sintered wear particles; surface-flattened lacy surfaces; and fully in-filled flattened deposits that merged with the abraded surfaces of the solid snow grains to create a ‘tiled’ contact surface. Supplementary Fig. S5 shows a similar set of images of the evolution of a contact area from test 170518a. These SEM images show features that are consistent with the abrasion of snow grains and the progressive infilling of the adjacent pore spaces by sintered wear particles. We do not see evidence of melted snow grains or refrozen melt-water in the pore spaces, consistent with IR thermography that measured no pixels warming to 0°C during any of the tests.
Evolution of a contact area from test 170518b (circled area of Fig. S3). Enlarged IR images a–d show the progressive growth and merger of the contacting shapes. The SEM image (e) shows the resulting components that constituted this contact area: enlarged, abraded snow grains (examples outlined in red); fully in-filled ‘tiled’ deposits of sintered wear particles (e.g., red arrows); partially filled, lacy deposits of sintered wear particles (e.g., blue arrows). The asterisks identify a contacting snow grain that progressively enlarged during the test. Slider travel was from bottom to top on all images.
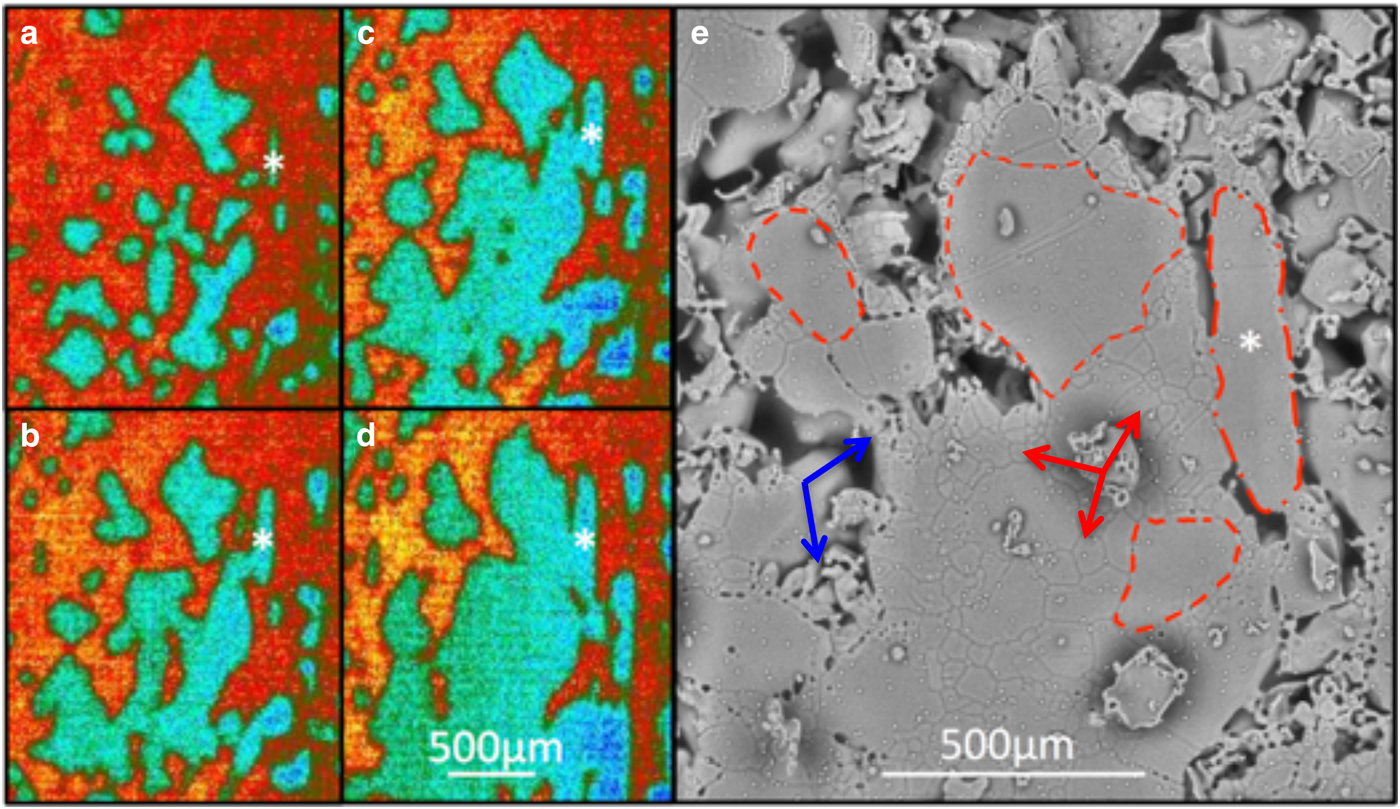
Figure 3 shows SEM images taken after test 170419 that reveal the change from undisturbed, fine-grained snow to the structure of the snow surface under the slider. Flat-topped snow-slider contacts appear as fairly uniform, planar features. These images also show that many deposits of wear particles remained below the plane of the slider, while some deposits sintered into structures that were subsequently abraded or pressed flat by the slider during the test. Together with similar features seen in Figures 1 and 2, these images show that sintering of the wear particles occurred during the test itself and was not an artifact of post-test sample preparation or imaging. Note that the SEM images from test 170419 (Fig. 3) show less evidence of complete infilling of pore spaces compared with those from the tests on 170518 (Figs 1–2 and Figs S4–S5), suggesting a lower abrasion rate. As we shall discuss, the colder test temperature on 170419 likely accounts for the lower abrasion rate.
SEM images taken after test 170419. The upper images are at 90× magnification: (a) undisturbed snow surface away from the slider, showing irregularly shaped fine-grained snow; (b) snow surface under the slider, showing abraded flat-topped grains (uniformly gray shapes) and sintered, lacy deposits of wear particles filling the pore spaces. Enlargements (c) and (d) show, respectively, sintered deposits that were flattened by the slider and deposits that were below the level of the slider plane. Bright, surface-deposited ice debris from SEM sample preparation are also visible overlying flat-topped grains on (b) and (d).

Figure 4 shows SEM images from test 170421, where slider shear produced widespread inter-granular bond failure. The subsequent grain movement broke many of the narrow necks that bonded the grains together. The resulting debris consisted of angular, sharp-edge grains that were distinctly different from the smoother, sintered wear deposits (e.g., Figs 3c, d).
SEM images taken after test 170421. Slider shear cause widespread bond failure and movement of the snow grains. The arrows point to examples of broken necks (flat areas), seen at two magnifications, that had bonded the grains together. Nearby these and other necks are faceted ice crystals that formed when the original snow grains sintered to create the necks (as demonstrated by Chen, Reference Chen2011).

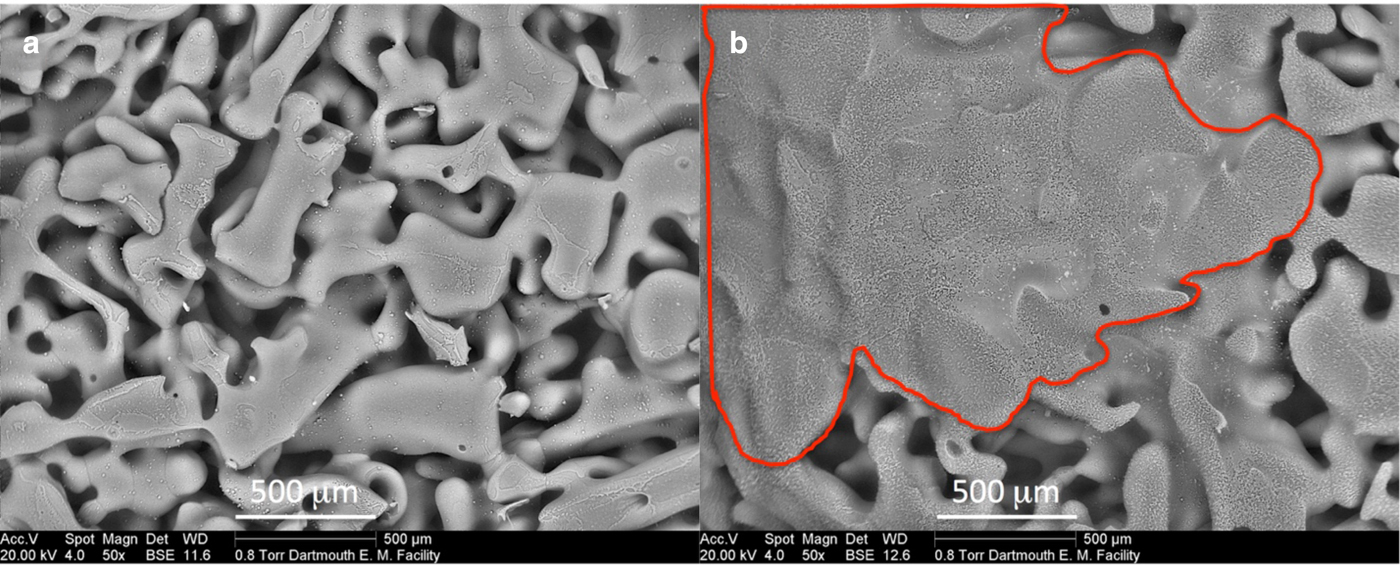
To examine the characteristics that result from snow-surface melting, we momentarily touched an undisturbed section of snow from test 170518b in the sample-prep room at −30°C. Figure 5 shows the SEM resulting images. The melt-water filled the pore spaces and ‘blanketed’ the underlying snow grains, some of whose features can still be seen. The melted grain tops were smooth-edged and continuously connected to the sub-surface refrozen water. These characteristics are quite distinct from those resulting from slider abrasion (Figs 1–3).
SEM images showing characteristics resulting from brief surface melting (post-test 170518b). Compared with nearby undisturbed snow (a), a momentary touch with a bare finger produced sheet melting and refrozen water in the pore spaces at and below the surface (b).
We also used the SEM to characterize the effects of condensation and sublimation on the post-test snow structure (Supplementary Fig. S6). Frost occasionally formed on the snow surface when it took us more than a few seconds to load the sample into the SEM. By increasing the SEM chamber temperature from −150 to −80 °C, we observed that the frost quickly sublimated, and then small interstitial grains became sharp-edged and raggedy looking and eventually disappeared. The surfaces of all the grains became bumpy. Importantly, frost and sublimation effects on the snow surface were readily distinguishable from the characteristics of polished flat-top grains and sintered wear deposits. We minimized frost formation by quickly transferring the mounted samples from the LN2-filled transfer box into the pre-cooled cold stage in the SEM chamber. Importantly, we observed negligible sublimation effects during our normal SEM observations (sample at −150 to −170 °C, chamber pressure 1 mbar, 60–90 min of imaging), consistent with findings from other cryo-SEM studies of ice below −100°C (Davy and Branton, Reference Davy and Branton1970; Waller and others, Reference Waller, Stokes and Donald2005; Weikusat and others, Reference Weikusat2011).
4. CONTACT AREA AND TEMPERATURE MODELING
The IR thermographs provide micro-scale data on the evolution of snow-slider contact area and temperature as functions of slider travel. Combined with tribometer data, air temperatures and snow properties, these data help to constrain models for snow-slider interface processes. We apply here two independent classical models to demonstrate that dry-contact abrasion and heat transfer can reasonably account for the measured contact-area and contact-temperature evolution. While these models simplify the contact mechanics, they provide insight into why abrasion rather than self-lubrication can govern snow friction.
4.1. Measured contact-area and contact-temperature evolution
We used Microsoft Visual Studio 2015 and the FLIR software development kit to access the IR thermographs and prepare them for processing. We then used Open CV, an open source computer vision library, to automate processing of the thermographs to quantify how contact area and contact temperature evolved during the tribometer tests. This involved several steps: importing the 640 × 512 thermograph arrays (temperature at each 15 µm pixel); converting pixel temperatures to gray-scale values (0–256); smoothing the images; applying image-processing algorithms to detect closed contours; measuring the number of contacts, contact areas and average temperatures in each thermograph; producing output files and movies of the results. Because melting did not occur, we could not use a simple 0°C temperature criterion to identify snow-slider contacts. However, the thermographs showed that temperatures were highly uniform (± 0.1°C) within each contact, and that the average temperatures across all contacts were typically very similar (±0.2°C). This allowed us to identify closed contours using temperature-threshold or temperature-interval criteria. The most reliable automated algorithm used maximum stable extremal regions (MSER; Matas and others, Reference Matas, Chum, Urban and Pajdla2002) to detect closed shapes in each gray-scale thermograph that have similar values (Fig. 6). We compared the results for several tests against manual processing of thermographs using ImageJ image-processing software (Rasband, Reference Rasband2012). We estimate ±20% uncertainty in the automated results for the number of contacts and total contact area. Imperfect IR-camera synchronization produced noise in the thermographs that was the main source of uncertainty. We excluded individual thermographs with std dev. >10% of the running-average number of contacts. Trends in the data were readily apparent before and after excluding these thermographs.
Snow-slider contact detection for an IR frame near the end of test 170515. (left) Gray-scale thermograph showing evolved contacts in dark gray. (right) Outlines in white of contacts detected using the automated MSER algorithm.

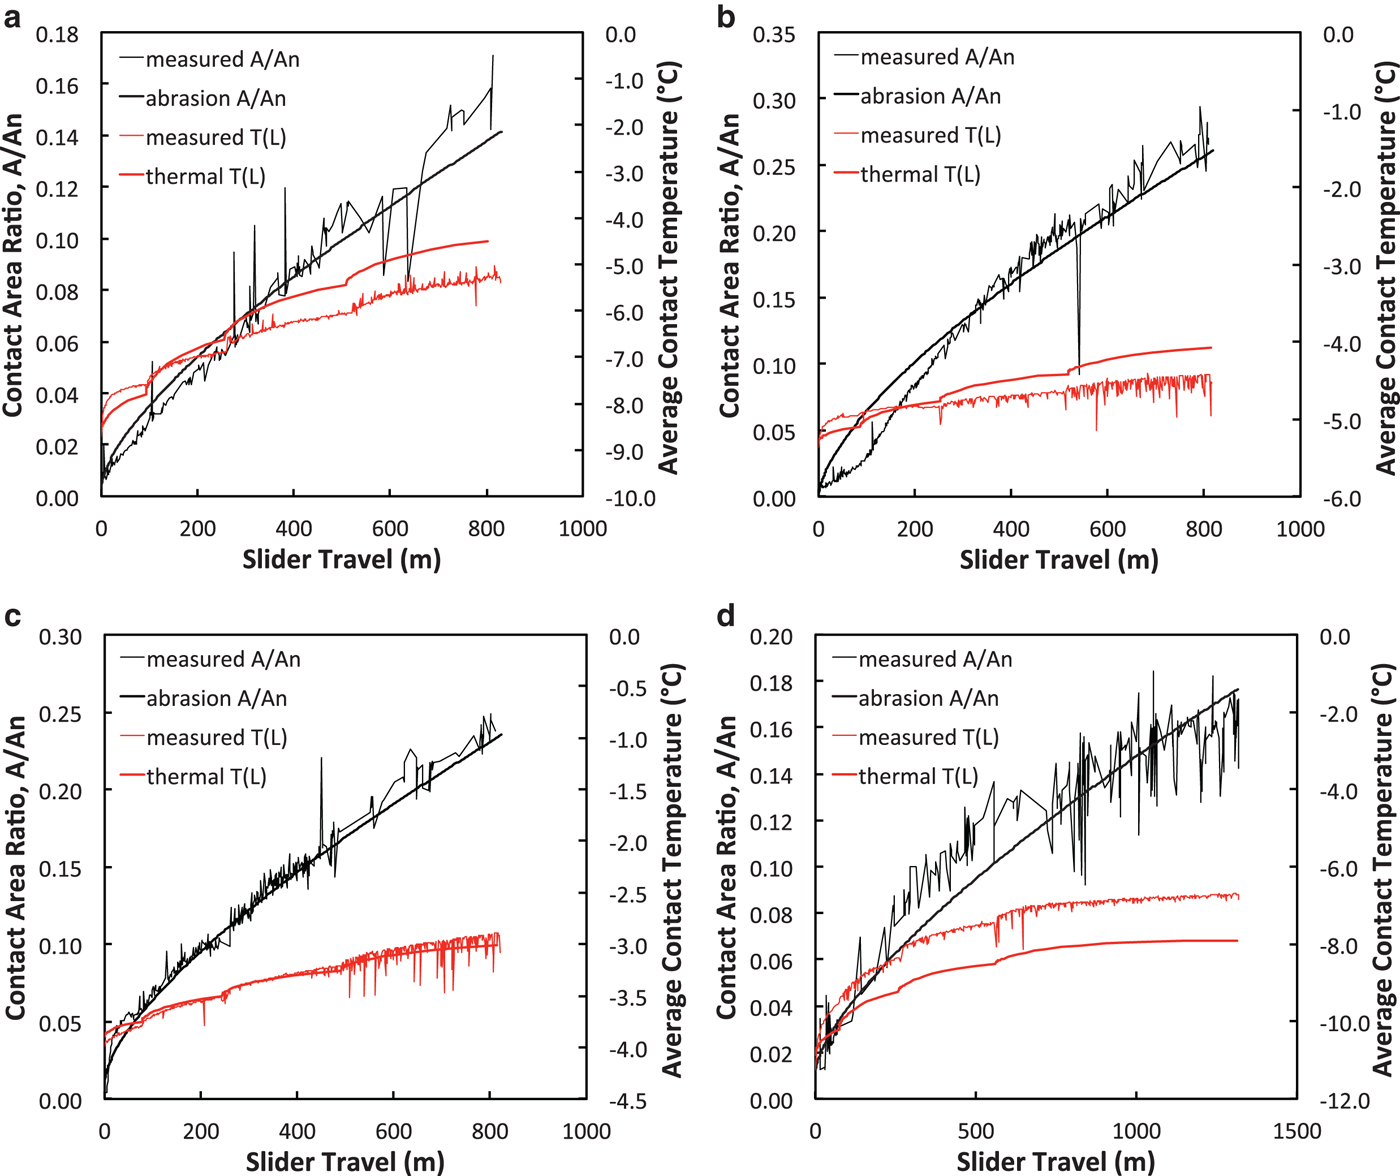
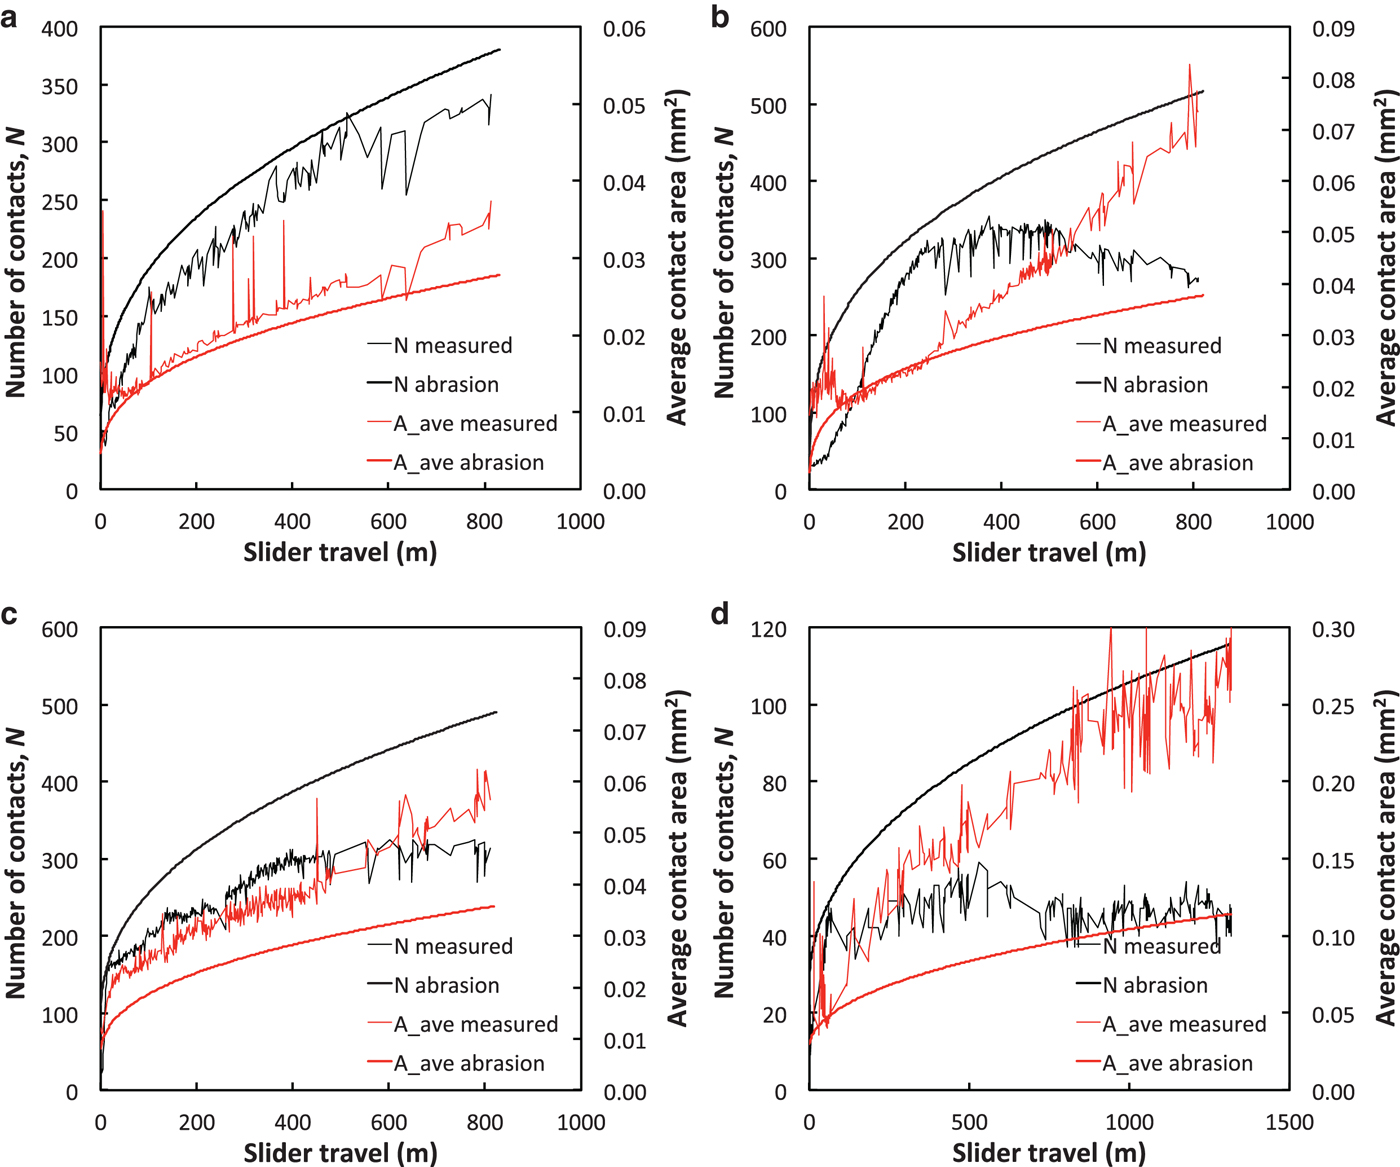
Figure 7 shows examples of the measured evolution of total contact area, A (normalized by nominal area, A n) and average contact temperature, T, vs slider travel, L, for four tribometer tests. These examples are typical of tests with persistent contacts: fairly steady area and temperature increases throughout each test (with noise from imperfect camera sync), and small temperature jumps at slider-speed changes. Figure 8 shows the corresponding evolution of the number of contacts, N, within the view of the IR camera and the average area of the contacts. For tests on fine-grained snow, N typically increased from 30–40 to 300–400 over the first ~400 m of slider travel and then leveled off or decreased slightly as the tests continued. For tests on coarse-grained snow, N increased from 5–10 to 50–100 before leveling off or decreasing slightly after ~400 m of travel. Merging of contacts accounted for the slight decreases in N, either by abrasion of multi-peaked grains or by infilling of pore spaces. To use these data for modeling, we assumed that the snow surface observed by the IR camera was typical of the entire snow-slider interface.
Contact-area and contact-temperature evolution for tribometer tests with persistent contacts. (a) Test 170419; (b) test 170515; (c) test 170518a; (d) test 160613. The smooth curves are area-evolution predictions based on abrasive wear (Equations (8–11)) and contact-temperature evolution based on thermal modeling (Equations (26–30)).
Evolution of number of contacts and average contact area for tribometer tests with persistent contacts. (a) Test 170419; (b) test 170515; (c) test 170518a; (d) test 160613. The smooth curves are predictions based on abrasive wear, Equations (6–11) using the same wear coefficients as Fig. 7. Here, N is the number of contacts within the field-of-view of the IR camera (74.7 mm2).
We processed the 2017 tribometer tests reported here and our 2016 tests described previously (Lever and others, Reference Lever2018). Automated processing of test 160613 produced the same contact-temperature evolution but ~10% higher contact area as reported previously. We manually reprocessed this test and confirmed that automated processing tracked several additional contacts not included in the initial manual processing.
Supplementary Fig. S7 shows the evolution of snow-slider contacts for test 170328, where inter-granular bond failure occurred partway through the test. Until the snow moved, evolution of contact characteristics (area, temperature, number of contacts) was similar to tests with persistent contacts. Once the snow began to move, the number of persistent contacts and the total contact area dropped abruptly.
4.2. Contact area modeling
Archard (Reference Archard1953) presented a family of models to predict the real area of contact between two flat surfaces pressed together and the resulting wear rate (wear volume per unit travel) as they slide past each other. Based on experimental evidence that wear rate is proportional to total load, Archard suggested that plastic deformation at the contacting asperities, coupled with lump removal at the contacts (i.e., wear-particle volume proportional contact radius cubed), provided the most suitable wear model. The resulting Archard Eqn (1) is remarkably simple but has proven effective in predicting wear rates for dry-contact sliding:
 $$W = kP/H,$$
where W is the volumetric wear rate per unit distance of slider travel, P is the slider normal load and H is the indentation hardness of the softer material. The wear coefficient k conceptually represents the probability that a sliding contact will generate a wear particle, and values range from ~10−5 for light wear to 10−2 for heavy wear (Archard, Reference Archard1953; Rabinowicz, Reference Rabinowicz1965).
Note that for single-crystal and polycrystalline ice across a wide range of strain rates, H drops abruptly as temperatures approach 0°C (Butkovich, Reference Butkovich1954; Barnes and Tabor, Reference Barnes and Tabor1966; Offenbacher and Roselman, Reference Offenbacher and Roselman1971). Thus, as snow-grain surface layers warm toward 0°C, their wear rates will accelerate. It is therefore possible that abrasion removes these layers before they warm to 0°C.
Equation (1) predicts the volumetric wear rate, whereas the IR thermographs provide data on the evolution of contact area. We followed the approach of Archard (Reference Archard1953) to convert from volumetric wear to contact area. We assumed that the slider provides a perfectly flat, non-deformable surface and that the snow provides a flat, deformable surface containing a large number of spherical grains of equal radii, R 0. We further assumed that the grains are evenly distributed in depth (z direction) so that there is one grain at each of z = 0, h, 2h, 3h …, etc., where h < < R 0. There are thus M = 1/h grains per unit depth. For a single grain worn to depth z < < R 0, the contact area is A 1 = 2π R 0z, and for multiple grains worn to a total depth z = Nh, the total contact area is
 $$A(z) = 2\pi R_0(h + 2h + 3h + \cdots + Nh),$$
 $$ = \pi R_0Mz^2\, \quad {\rm for}\,{\rm large}\,{\rm} N.$$
Similarly, the wear volume removed from a single grain to depth z is V 1 = π R 0z 2, and for multiple grains worn to a total depth z = Nh, the total wear volume is
 $$V(z) = \pi R_0 [{h^2 + {(2h)}^2 + {(3h)}^2 + \cdots + {(Nh)}^2}],$$
 $$ = \pi R_0Mz^3/3{\rm} \, \quad{\rm for}\,{\rm large}\,{\rm} N.$$
Rearranging Eqn (5) provides the total penetration depth and number of contacting grains for a given wear volume:
 $$z = [3V/(\,\pi {R}_0M)]^{1/3},$$
 $$N = Mz.$$
We calculated the number of grains per unit depth using a mass balance:
 $$M = (1-\alpha )\displaystyle{3 \over {4\pi}} \displaystyle{{A_{\rm n}} \over {R_{0}^{\hskip 3pt 3}}},$$
where α is the snow porosity (~0.5 for our tests) and A n is the nominal slider area (37 090 mm2).
Inserting (6) into (3), the total contact area after sliding distance L is
 $$A(L) = (9 \pi {R}_0 M)^{1/3}V(L)^{2/3},$$
where via the Archard Eqn (1)
 $$V(L) = kP\mathop \int \limits_0^L \displaystyle{{{\rm d}L} \over {H(L)}}.$$
Note that Eqn (10) allows ice hardness H to vary with slider travel as the contacting grains warm up.
We used the measurements by Barnes and Tabor (Reference Barnes and Tabor1966) at high-impact rates (~10−4 s duration) to model the variation in H with temperature. There is a lot of scatter in the data, but Barnes and Tabor noted that the trend shows an approximately linear decrease with temperature from −15°C until about −3°C, after which H drops rapidly as ice temperature approaches 0°C. We used a hyperbolic fit to their hand-drawn trendline to capture these characteristics for T < 0°C (Supplementary Fig. S8):
 $$H(T) = 250\left[ {{\left( {\displaystyle{{273.15-T} \over {273.15}}} \right)}^2-1} \right]^{1/2},$$
where H has units of MPa. We also fit their trendline with a quadratic and found little difference in the resulting model predictions, mainly because contact temperatures did not rise much above −2°C, and the two fits provide similar H values at lower temperatures (Fig. S8).
We implemented Equations (8–11) to predict the evolution of snow-slider contact-area ratio, A(L)/A n, based on dry-contact abrasive wear. The processed IR thermographs (e.g., Fig. 7) provided measured contact-temperature evolution, T(L), which via Eqn (11) provided estimates of snow-grain hardness evolution, H(L), to use in Eqn (10). Based on micro-computed tomographs (Lever and others, Reference Lever2018) and SEM images, we used R 0 = 0.23 mm for coarse-grained snow and R 0 = 0.12 mm for fine-grained snow, which provided values of M = 3.6 × 105 mm−1 and M = 2.6 × 106 mm−1, respectively, via Eqn (8). However, as far as we know, the wear coefficient has not been measured for ice abraded by polyethylene. Rather, we varied k to fit the measured A(L)/A n and assessed whether the results were reasonable based on two criteria: whether the predicted A(L)/A n curves showed similar trends as the measured values (form check); and whether the coefficients were consistent across all tests (scale check).
Figure 7 shows the predicted area evolution for four tribometer tests. The predicted curves track the measured values quite well, and all 15 tests modeled showed similarly good form agreement. This agreement results in part by modeling the decrease in ice hardness as the grains warm, H(T). For constant H, predicted contact area would vary as A(L)~L 2/3 via Equations (9–10) and would fall off more rapidly with L than the measurements. The effect of decreasing H(T) across any given test increases the predicted contact area, as expected.
Figure 8 shows the evolution of the number and average area of snow-slider contacts for the same four tribometer tests. The model over-predicts the number of contacts and consequently under-predicts the average contact area. By assuming spherical grains, the model inherently maximizes the number of contacts for a given snow-pack porosity. Also, it cannot account for merging contacts when irregularly shaped, multi-peaked grains abrade. Importantly, the model does not include merging contacts formed when wear particles infill the pore spaces. We did not vary other model parameters (e.g., R 0, α) to improve these fits.
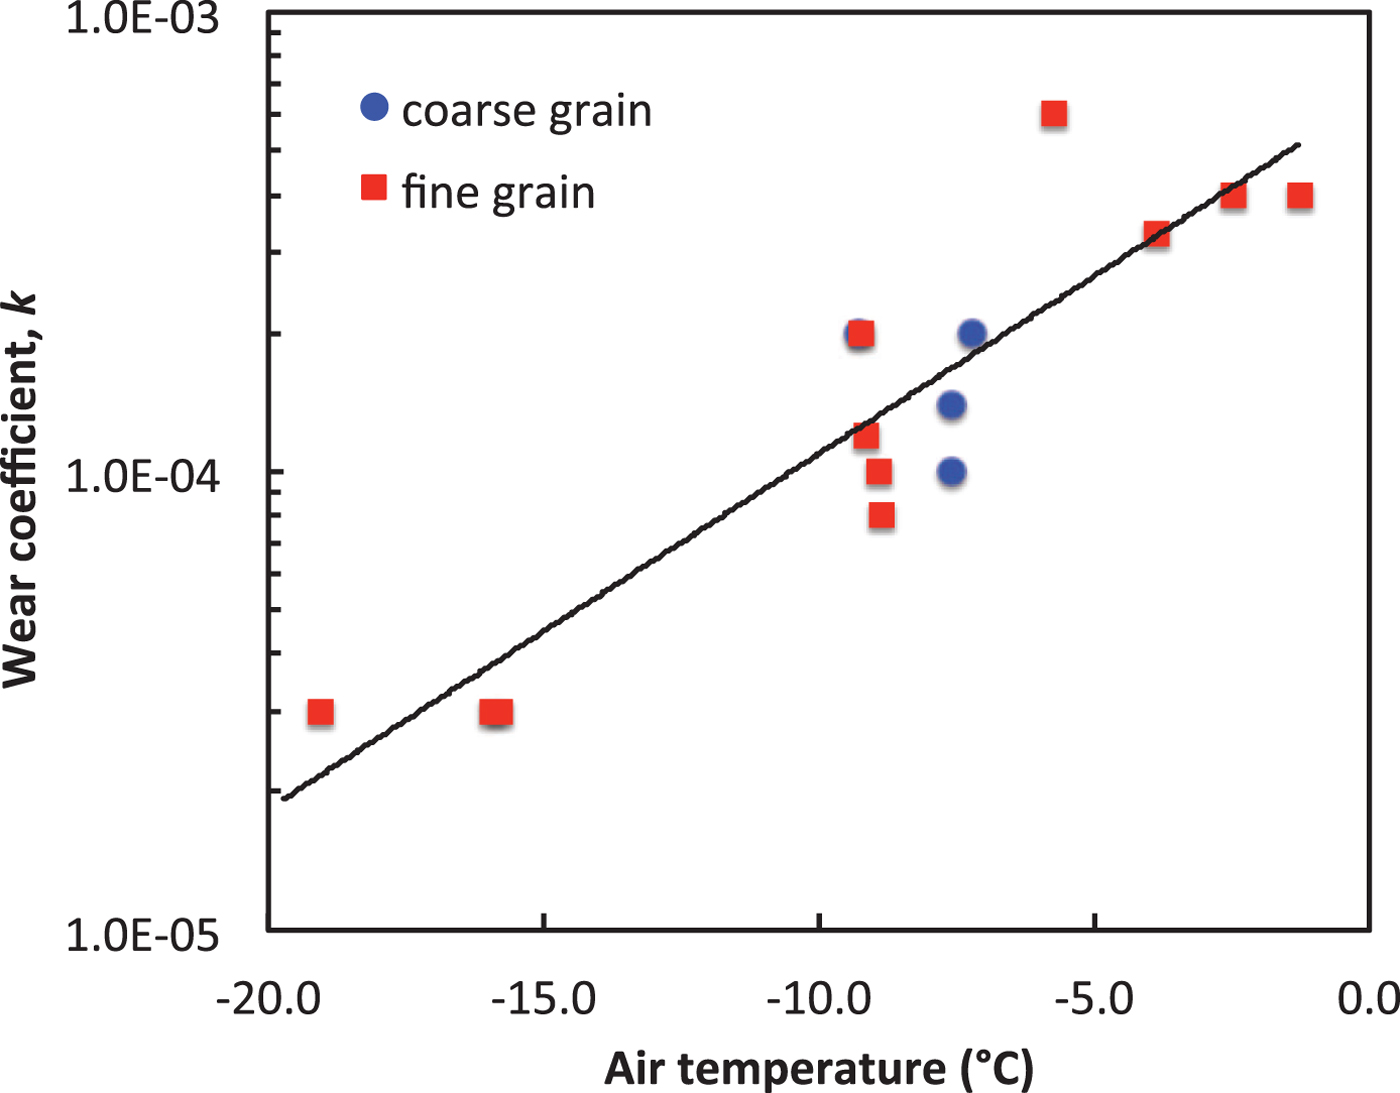
Interestingly, for all 15 tests modeled the best-fit values of k increased systematically with temperature (Fig. 9), ranging from 3.0 × 10⁻⁵ to 6.0 × 10⁻⁴ across the air-temperature range −19 to −1.3 °C. One possible cause is that ice hardness relevant to abrasive wear drops more rapidly with temperature than the modeled form (Eqn (11)), and thus the model required larger k at warmer temperatures to fit the contact-area data. More likely, pore-space infilling by wear particles played a key role. Infilling was more pronounced at warmer temperatures owing to higher wear rates, and the partially or fully infilled (tiled) pore spaces were at similar temperatures as the adjacent worn grains. Consequently, our automated processing included infilled area as contact area. Because the building of contact area by sintered wear particles is not included in the model, it required higher values of k at higher temperatures to fit the measured area evolution.
Increase in best-fit wear coefficient with temperature.
4.3. Contact-temperature modeling
When two nominally flat surfaces slide past each other, frictional heat generated at the contacts conducts into each body. Blok (Reference Blok1937), Jaeger (Reference Jaeger1942), Archard (Reference Archard1959) and Carslaw and Jaeger (Reference Carslaw and Jaeger1959) all examined the rapid surface-temperature rise (flash temperature) that results when a single contact slides across a semi-infinite medium. The flash temperature on each surface depends upon the respective Peclet number, Pe, which for a circular heat source is
 $$Pe = \displaystyle{{UR} \over {2\kappa}}, $$
where U is the speed of the heat source, R is the contact radius and κ is the thermal diffusivity. On the moving source, Pe = 0 and the flash temperature distribution is symmetric about the center of contact. On the stationary body, Pe > 0, the temperature rises rapidly at the leading edge of the contact and the maximum temperature shifts rearward within the contact. Average contact temperatures are not strongly dependent on the shape of the contact (circular, square or elliptical) or the distribution of frictional heat within the contact (uniform or parabolic) for a given heat flux. To partition the frictional heat into each body, Blok (Reference Blok1937) proposed matching maximum temperatures across the contact. Others (Jaeger, Reference Jaeger1942; Archard, Reference Archard1959) suggested that matching average flash temperatures is also reasonable, the approach which we adopted.
Tian and Kennedy (Reference Tian and Kennedy1994) generated approximate solutions for flash temperatures within a contact as smooth functions of Pe. For a circular uniform heat source, the average flash temperature, T ave, in dimensionless form is
 $$\phi _{\rm f}\equiv \displaystyle{{T_{{\rm ave}}K} \over {2Rq}} = \displaystyle{{0.61} \over {\sqrt {\pi \lpar {0.6575 + Pe} \rpar }}}, $$
where K is the thermal conductivity, and q = Q/(πR 2) is the average heat flux into the body. Importantly, Tian and Kennedy (Reference Tian and Kennedy1993) extended sliding-contact heat-transfer theory to consider multiple contacts sliding across finite (rather than semi-infinite) bodies. We applied this approach to the case of interest here: a slider moving across multiple snow-grain contacts.
Figure 10 shows schematics of the snow-slider interface. For finite bodies on each side of a sliding contact, Tian and Kennedy (Reference Tian and Kennedy1993) described the contact temperature, T c, as
 $$T_{\rm c} = T_{\rm b} + T_{\rm n} + T_{\rm f},$$
Schematics of snow-slider interface for thermal modeling. (upper) Plan view shows multiple snow-grain contacts in blue, with red warm patches on the slider resulting from movement. (lower) Side view shows terminology for the temperature rise at each contact: Q s and Q g are the heat flows into the slider and grain, respectively; T b, T n and T f are the background, nominal and flash temperatures in the vicinity of a contact.
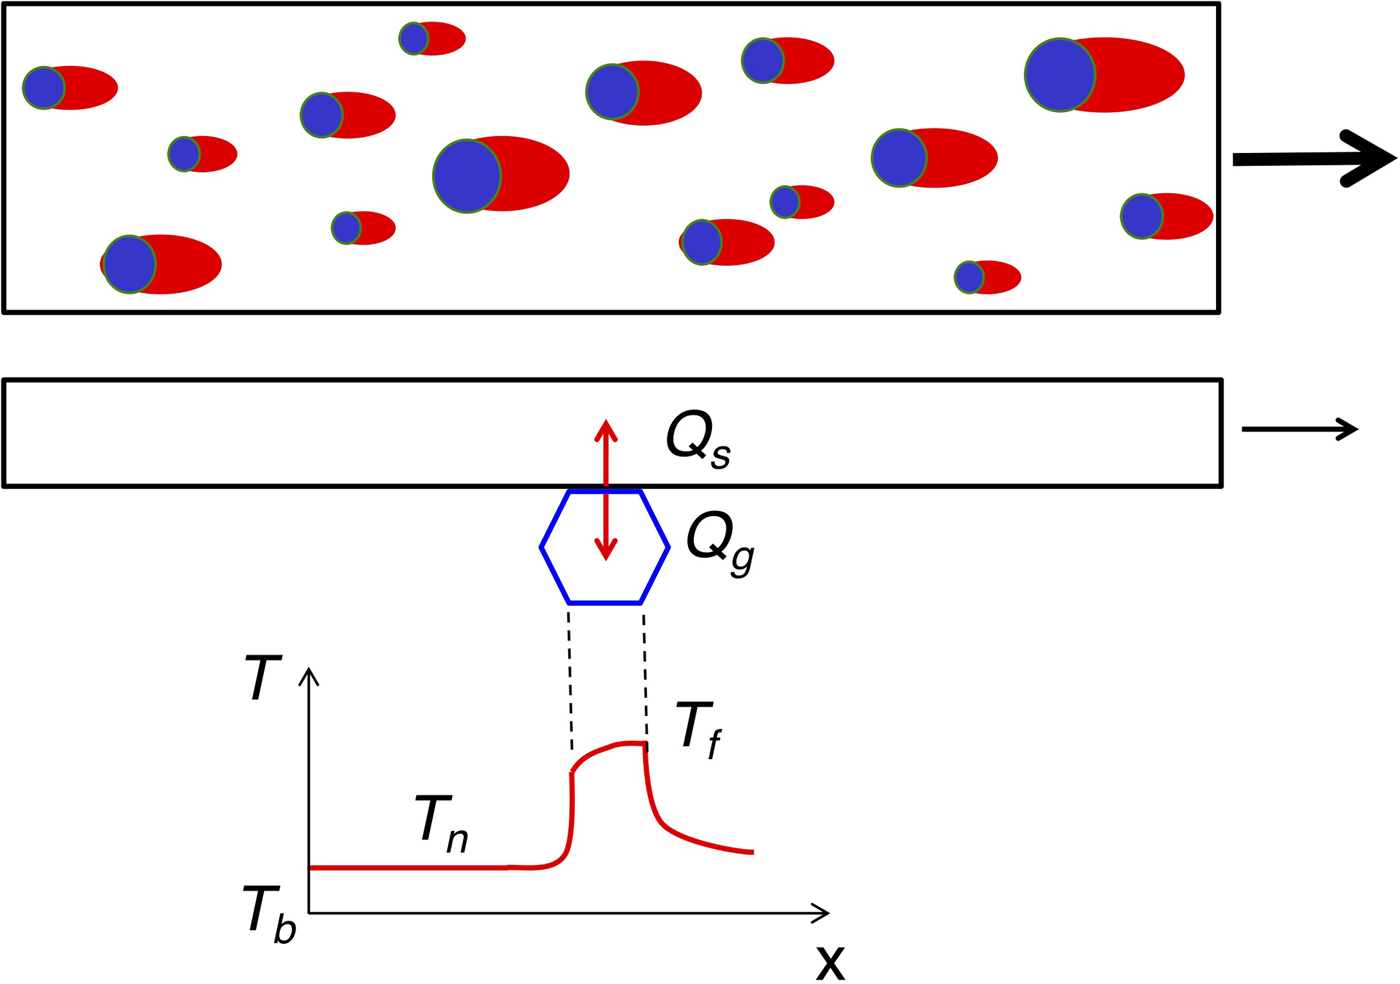
where T b is the background or ambient temperature, T n is the nominal temperature rise resulting from the total heat flow into the body and T f is the flash temperature rise within the contact itself. For recurring or multiple sliding contacts, the total heat flow can appreciably increase T n. For simplicity, we will assume similar background temperatures, so that surface-temperature continuity gives
 $$T_{\rm c} = T_{{\rm ns}} + T_{{\rm fs}} = T_{{\rm ng}} + T_{{\rm fg}},$$
where the additional subscripts s and g refer to the slider and snow-grain, respectively.
The heat budget at a contact provides a second set of equations:
 $$Q_{\rm f} = Q_{\rm s} + Q_{\rm g},$$
 $$q_{\rm f} = q_{\rm s} + q_{\rm g},$$
where Q f is the frictional heat generated at the contact, q f = Q f/A c, q s = Q s/A c and q g = Q g/A c are the frictional, slider and grain heat fluxes, respectively, through the actual contact area, A c.
The IR thermographs provide important insight to apply this theory to our tribometer tests. Temperatures were uniform (±0.1°C) across each contact, and average temperatures varied little from contact to contact (typically ±0.2°C). These characteristics suggest that each contacting grain was in good thermal contact with the slider, and that all contacting grains experienced nominally the same conditions. Thus, the average radius of contact, R, relevant to flash-temperature calculations (Eqns (12–13)) is the average snow-grain contact radius (10–100 µm) rather than the much smaller radii of slider or grain asperities (<1 µm). Furthermore, we may use A c = A, the total contact area as measured during tribometer tests, to distribute the total frictional heat uniformly into each contacting grain:
 $$q_{\rm f} = \mu PU/A_{\rm c} = \mu pU/(A_{\rm c}/A_{\rm n}),$$
where μ is the friction coefficient, P is the total slider normal load and p is the slider pressure.
Tian and Kennedy (Reference Tian and Kennedy1993) explained that the consequence of contacts repeatedly sliding over a finite body is that the heat flow into the body, distributed over the nominal contact area, increases the body's nominal temperature. This situation applies here: the slider repeatedly traverses over thousands of contacting snow grains. Neglecting edge effects, the nominal heat flow into the slider, q′s, is essentially one-dimensional (1-D), delivered through the nominal slider area:
 $${q}^{\prime}_{\rm s} = q_{\rm s}A_{\rm c}/A_{\rm n}.$$
Similarly, the slider continuously provides frictional heat into the stationary, contacting snow grains, which causes a nominal temperature rise within the snow pack as a whole. We will also treat the nominal heat flow into the numerous contacting grains, q′s as 1-D from the perspective of the snow pack. It is delivered through the real contact area, so that
 $${q}^{\prime}_{\rm g} = q_{\rm g}.$$
To calculate the contact temperature (assumed uniform) across the snow-slider interface, we must specify the terms in the temperature-continuity Eqn (15). Equation (13) specifies the flash-temperature contributions, using the real heat fluxes q s and q g in each direction. The nominal-temperature contributions depend on the details of the nominal heat flows. To gain insight into their importance relative to flash temperatures, we initially treat these as the surface temperatures resulting from constant-flux, 1-D transient conduction into semi-infinite bodies (Carslaw and Jaeger, Reference Carslaw and Jaeger1959):
 $$T_{{\rm ns}} = \displaystyle {{2{q}^{\prime}_{\rm s}} \over {K_{\rm s}}}\left( {\displaystyle{{\kappa_{\rm s}t} \over \pi}} \right)^{1/2}\;, \; \; \; T_{{\rm ng}} = \displaystyle{{2q_{\rm g}} \over {K_{\rm g}}}\left( {\displaystyle{{\kappa_{\rm g}t} \over \pi}} \right)^{1/2}.$$
Their corresponding dimensionless forms are
 $$\eqalign{\phi _{{\rm ns}} & \equiv \displaystyle{{T_{{\rm ns}}K_{\rm s}} \over {2Rq_{\rm s}}} = \displaystyle{{{q}^{\prime}_{\rm s}} \over {q_{\rm s}}}\left( {\displaystyle{{\kappa_{\rm s}t} \over {\pi R^2}}} \right)^{1/2}\;, \; \; \phi _{{\rm ng}}\equiv \displaystyle{{T_{{\rm ng}}K_{\rm g}} \over {2Rq_{\rm g}}} \cr & = \left( {\displaystyle{{\kappa_{\rm g}t} \over {\pi R^2}}} \right)^{1/2}.}$$
Inserting Eqns (13) and (22) into Eqn (15) partitions the heat-flux:
 $$QR\equiv \displaystyle{{q_{\rm s}} \over {q_{\rm g}}} = \displaystyle{{K_{\rm s}} \over {K_{\rm g}}}\left[ {\displaystyle{{\phi_{{\rm ng}} + \phi_{{\rm fg}}(0)} \over {\phi_{{\rm ns}} + \phi_{{\rm fs}}(Pe)}}} \right]$$
and the contact temperature rise relative to the background becomes
 $$T_{\rm c} = \displaystyle{{2Rq_{\rm s}} \over {K_{\rm s}}} [\phi_{{\rm ns}} + \phi_{{\rm fs}}(Pe)}] = \displaystyle{{2Rq_{\rm g}} \over {K_{\rm g}}} [{\phi_{{\rm ng}} + \phi_{{\rm fg}}(0)}],$$
where
 $$q_{\rm s} = \displaystyle{{QR} \over {1 + QR}}q_{\rm f}\;, \; \; q_{\rm g} = \displaystyle{1 \over {1 + QR}}q_{\rm f}.$$
We implemented this model for conditions characteristic of our tribometer tests, using typical startup conditions as a baseline case (Table 2). We used the thermal properties of snow at an average density of 450 kg/m3 (Sturm and others, Reference Sturm, Holmgrem, Konig and Morris1997) for the 1-D heat flow into the snow pack. We also used these thermal properties to calculate the grain flash temperatures, although the results are essentially the same using ice thermal properties. For these conditions, Pe = 36 for the moving slider (Eqn (12)), and transient heat transfer dominates over time scales τ = 4h 2/π 2κ of ~150 s for the slider (h = 9.5 mm thick) and 440 s for the snow (h~20 mm).
Baseline parameters for thermal model

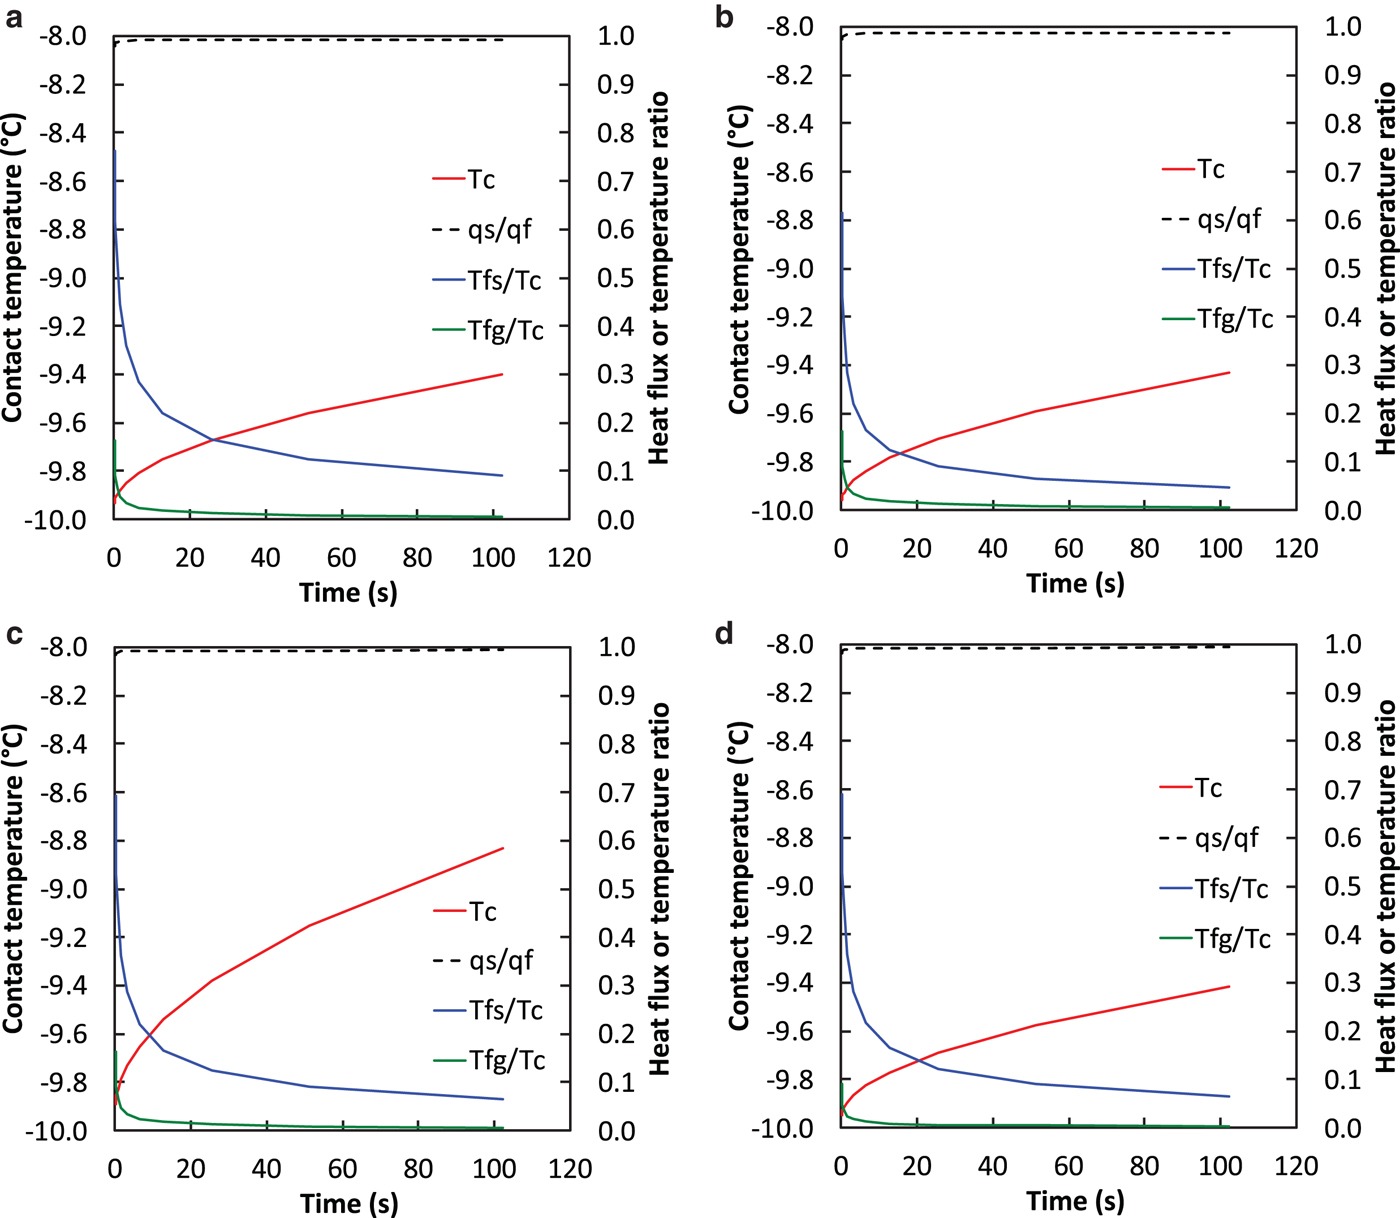
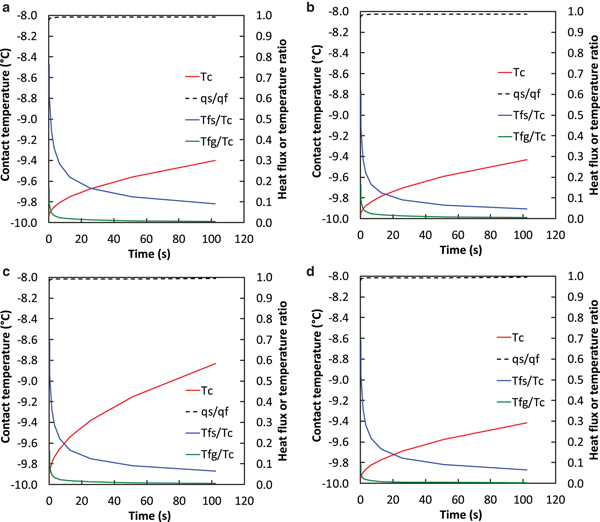
Figure 11 shows the key startup transients (contact-temperature, heat-flux partitioning, flash-temperature contributions) for the baseline case and some variations in baseline parameters. Several points are worth emphasizing. (1) Most of the frictional heat flows into the slider (q s/q f > 0.97). This results from the small initial contact area (A c/A n = 0.01) characteristic of startup conditions. (2) Contact temperatures remain well below 0°C during the 100 s duration simulated, a consequence of the large heat flow into the slider. (3) After the first ~20 s, flash temperatures are small contributions to the contact-temperature rise (T f/T c < 0.2), especially for the snow grains. The nominal temperature rise, resulting from multiple snow-slider contacts, dominates the contact temperature rise. (4) Even during the first 20 s, the flash temperatures are small in absolute terms: T fs < 0.08°C and T fg < 0.02°C for the U = 0.72 m s−1 case and less for the baseline case. The large size of the contacts (relative to asperities) and the low slider speed combine to limit flash temperatures.
Thermal analysis for constant conditions. (a) Baseline parameters (Table 2); (b) higher contact area, A c/A n = 0.02; (c) higher slider speed, U = 0.72 m s−1; (d) smaller contact radius, R = 0.025 mm. T c is contact temperature; q s and q f are the slider and frictional heat fluxes, respectively; T fs and T fg are the slider and snow-grain flash temperatures, respectively.
The small flash-temperature contributions allow us to simplify the thermal model, which offers two benefits: we can more easily see the relationship between system properties and contact temperature, and we can simulate the tribometer tests by assuming piece-wise constant heat fluxes.
For small flash temperatures, the temperature continuity equation becomes
 $$T_{\rm c} = T_{{\rm ns}} = T_{{\rm ng}}.$$
Inserting Eqns (21 and 19) gives
 $$T_{\rm c} = \displaystyle{{2q_{\rm s}} \over {K_{\rm s}}}\displaystyle{{A_{\rm c}} \over {A_{\rm n}}}\left( {\displaystyle{{\kappa_{\rm s}t} \over \pi}} \right)^{1/2} = \displaystyle{{2q_{\rm g}} \over {K_{\rm g}}}\left( {\displaystyle{{\kappa_{\rm g}t} \over \pi}} \right)^{1/2}.$$
The heat fluxes at the contacts partition as
 $$QR\equiv \displaystyle{{q_{\rm s}} \over {q_{\rm g}}} = \displaystyle{\xi \over {A_{\rm c}/A_{\rm n}}},\; \; \; \xi \equiv \displaystyle{{K_{\rm s}} \over {K_{\rm g}}}\left( {\displaystyle{{\kappa_{\rm g}} \over {\kappa_{\rm s}}}} \right)^{1/2}.$$
The baseline thermal properties give ξ = 1.6, and at startup of the tribometer tests A c/A n~0.01, so QR > 100 at startup. Consequently, most of the frictional heat flows into the slider at startup. For QR ≫1, the heat flux distributions (Eqn (25)) become
 $$\displaystyle{{q_{\rm s}} \over {q_{\rm f}}} \sim 1-\; \displaystyle{{A_{\rm c}} \over {A_{\rm n}}}\;, \; \; \displaystyle{{q_{\rm g}} \over {q_{\rm f}}} \sim\; \displaystyle{{A_{\rm c}} \over {A_{\rm n}}}\; {\rm for}\,A_{\rm c}/A_{\rm n} \lt 0.1.$$
As abrasion increases A c/A n beyond ~0.1, proportionally more of the frictional heat flows into the snow grains, but the frictional heat flux itself decreases, via Eqn (18). These two effects counterbalance each other to limit the increase in T c.
The heat fluxes varied during tribometer tests primarily because the frictional power input, Q f, varied with slider speed (neglecting smaller variations in friction coefficients) and because contact area (A c/A n) increased as the grains abraded. We may estimate the contact-temperature evolution by approximating the contact area and friction coefficients as constants (average measured values) during each speed setting. This approximates q f and QR as constants at each speed. Because the tribometer tests lasted longer than the transient time constant for the slider (τ s~150 s), we treat the slider as a finite-thickness slab of polyethylene with its upper surface at the background temperature. The resulting contact-temperature response at each increment of speed is (Carslaw and Jaeger, Reference Carslaw and Jaeger1959)
 $$\Delta T_{{\rm ci}}(t) = \Delta T_{{\rm ssi}}\left[ {1-\displaystyle{8 \over {\pi ^2}} {\mathop \sum \limits_{n = 0}^{\infty}} \displaystyle {1 \over {{\left( {2n + 1} \right)}^{2}}} {\rm e}^{{-{(2n + 1)}^{2}}(t-t_i)/\tau _{\rm s}}} \right],$$
where ti are the times of the speed changes,  $\Delta T_{{\rm ssi}} = \Delta {q}^{\prime}_{{\rm si}} h_{\rm s}/K_{\rm s}$ is the steady-state temperature increment (t-t i > τ) for nominal flux increment $\Delta {q}^{\prime}_{{\rm si}}$. Equation (30) essentially superimposes incremental temperature increases at each speed change caused by incremental heat-flux increases.
Figure 7 shows the resulting predictions for four tribometer tests with persistent contacts. Given the simplicity of this 1-D heat-transfer model, the agreement is quite good. Note that there are no adjustable parameters: the thermal properties for both the snow and slider are from published values, and the tribometer tests provided the measured friction coefficients and contact areas at each speed. Importantly, the model predicts that contact temperatures would not reach 0°C for the conditions tested.
5. DISCUSSION
5.1. Tribometer tests
Three complementary lines of evidence confirm that dry-contact abrasion governed snow friction during our tribometer tests: IR thermographs showed that contact temperatures remained well below 0°C; coordinated SEM images revealed sintered deposits of wear particles that partially or fully filled pore spaces between abraded grains; and thermal modeling predicts that contact temperatures would not reach 0°C for the conditions of our tests. Additionally, dry-contact abrasion mechanics can account for the measured evolution of contact area, although the model can only qualitatively account for the role of pore-space infilling. We will address some details of these lines of evidence and then discuss their implications for snow-friction scenarios of practical interest.
We previously described calibration techniques and test data that indicate ±0.1°C accuracy for the IR-camera temperature measurements (Lever and others, Reference Lever2018). We also extensively argued that the camera would have measured melting of contacting snow grains had it occurred. To summarize these arguments: cooling during slot passage was negligible, as were pressure-melting effects; the camera had much finer spatial resolution (15 µm) than the grain-top contact areas envisioned in self-lubrication theory; we saw no evidence of wide-spread sub-pixel melting; the sub-surface mixing of IR emissions depressed measured temperatures by <0.02°C. Because ice and liquid water have similar emissivity in the 3–5 µm range, a 0°C liquid layer on top of 0°C contacting snow grains would reduce this latter error and thereby improve the camera's ability to detect melting. Additionally, melting or freezing would not have affected the camera's accuracy, because the corresponding radiation effects lie in the wavelength range 20–43 µm (Tatarchenko, Reference Tatarchenko2010). Not a single IR-camera pixel reached 0 ± 0.1 °C during our previous tests or those reported here. This is strong evidence that water films did not form as envisioned by self-lubrication theory. Rather, the contacting grains showed polishing across a common plane that is consistent with dry-contact abrasion.
The coordinated IR, digital microscope and SEM images allowed us to track the evolution of contacting snow grains from the start of a test through to their final structural appearance. These images also revealed characteristics consistent with dry-contact abrasion. Although only available post-test, the SEM images showed partially or fully infilled areas that were pore spaces in mid-test IR images. These observations are best explained by deposition and sintering of wear particles during the test. The slider generated wear particles at contacting grains and deposited them within the pore spaces, where they sintered to form lacy structures that bridged between grains below the plane of the slider (Fig. 3d). Further infilling formed surfaces that were, in turn, abraded and flattened by the slider (Figs 1h, 2e, 3c, Fig. S4i). In some locations, wear particles filled the pore spaces between abrading grains to form larger, tiled contact areas (Fig. 2e, Fig. S5d). The area of abrading grains also increased if their horizontal cross-sections increased with depth (Fig. 2). The coordinated IR and SEM images provide evidence that both of these processes increased snow-slider contact area. To our knowledge, these are the first coordinated images of the evolution and post-test structure of actual snow-slider contacts. Importantly, the newly identified process of infilling of pore spaces by sintered wear particles could play a key role in limiting contact temperatures and thereby limiting the scope of self-lubrication.
The SEM images revealed no features characteristic of refrozen meltwater. The tops of the contacting grains showed no refrozen water pockets left over from removal of the slider at the end of the test. The edges of contacting grains showed no smearing and refreezing of water in the direction of slider travel (e.g., lobate or rounded edges), and the snow-grain surfaces adjacent to pore spaces showed no evidence of water flow downward from the plane of the slider.
The scale of the sintered structures warrants mention. The SEM images showed lacy structures within the pore spaces that had 10–20 µm constituent elements (e.g., Fig. 3d). However, the wear particles were likely similar in size to the wavelengths of visible light (380–700 nm) because the polished grains produced specular reflection (Bowden and Tabor, Reference Bowden and Tabor1950). This size is also consistent with the average roughness of the polyethylene slider (0.65 µm) and its glossy appearance. Sintering of sub-micron ice particles could involve several mechanisms (Blackford, Reference Blackford2007), but it is likely to proceed much faster than test times. If vapor transport is the dominate mechanism (Hobbs and Mason, Reference Hobbs and Mason1964), we estimate that the sintered neck between two 0.5 µm-diameter wear particles would reach their full diameters in ~0.5 s at −20°C and 0.05 s at −3°C. The coordinated images confirm that sintering must have occurred during the test itself, because the slider flattened and polished many of these deposits. The uniformity of contact temperatures across the resulting tiled areas indicates that the sintered deposits were in good thermal contact with the slider and probably supported some slider load.
Most of our SEM work sought to reveal features on the order of 1–100 µm in size (grain tops, sintered structures, etc.). We did not specifically seek to identify longitudinal grooves in the contacting grains created by slider asperities, although we would likely have taken higher magnification images had we seen remnants of such grooves. Based on slider roughness, these groove widths would also have been sub-micron when first created. However, vapor transport or other sintering mechanisms would have quickly muted such fine grooves. Furthermore, if a layer of abraded particles remained on the grains after the tests, sintering would have quickly merged them with the grain tops to yield smooth, apparently groove-free surfaces. In either case, higher magnification SEM images would probably not have revealed slider-generated grooves.
We applied classical sliding-heat-source theory to model the slider-snow interface. The 1-D heat transfer model does not reflect the complexities of the system, but we think it captures the basic processes. An essential characteristic is that the slider is continuously in contact with thousands of snow grains. Consequently, the frictional heat flux significantly increases nominal temperatures in both the slider and snow as the test proceeds. Initially, a relatively small snow-grain contact area must warm a much larger area of slider to a common contact temperature. Thus, most of the frictional heat initially flows into the slider rather than the snow grains. As the contact area increases through abrasion and infilling, the split in heat fluxes becomes more even, but the frictional flux itself decreases, which tends to limit predicted contact temperatures. Flash temperatures are either small in magnitude (early times) or small relative to nominal surface temperatures; they can, therefore, be ignored to model the tribometer's thermal behavior. The overall agreement of this simple model with measured contact temperatures is quite good given that it has no adjustable parameters. It predicts that indeed contact temperatures would remain well below 0°C for the conditions of our tribometer tests.
Our thermal model predicts small flash-temperature contributions in part because good thermal contact occurs across snow-grain contacts, and these contacts are large relative to typical surface asperities. At high Pe, T fs~R −3/2 for a given heat flow Q s into the slider. It seems likely that good thermal contact reflects polishing and heat transfer by a layer of fine wear particles. The Archard equation predicts, and our data show, that snow-grain wear rates significantly increase as contact temperatures approach 0°C. The resulting layer of wear particles between the contacting surfaces would produce good thermal contact.
Importantly, a layer of fine wear particles could act as a dry lubricant (Heshmat, Reference Heshmat1991; Heshmat, Reference Heshmat1995; Wornyoh and others, Reference Wornyoh, Jasti and Higgs2007). This idea offers an alternative to explain why snow is slippery in the absence of self-lubrication. Theories that examine the production and loss of dry wear particles at sliding interfaces warrant consideration for snow friction (Godet, Reference Godet1984; Iordanoff and others, Reference Iordanoff, Berthier, Descartes and Heshmat2002; Fillot and others, Reference Fillot, Iordanoff and Berthier2007).
5.2. Skis and sleds
The thermal theory presented here reveals an important result for skis and sleds: previous measurements of snow-slider interface temperatures effectively confirmed the lack of self-lubrication. Measurements on skis (Colbeck and Warren, Reference Colbeck and Warren1991; Colbeck and Perovich, Reference Colbeck and Perovich2004; Schindelwig and others, Reference Schindelwig, Hasler, Van Putten, Rohm and Nachbauer2014) and sleds (Lever and Weale, Reference Lever and Weale2012; Lever and others, Reference Lever, Weale, Kaempfer and Preston2016) have consistently shown that contact temperatures remain below 0°C under the action of sliding friction. Colbeck and Perovich (Reference Colbeck and Perovich2004) showed that sunlight absorption can bring contact temperatures closer to 0°C, but ski runs conducted at night raised contact temperatures to only −7.8°C from −9.2°C. Colbeck and Warren (Reference Colbeck and Warren1991) measured ski-snow contact temperatures on hard-packed snow that rose 3–5°C but remained well below 0°C. Interestingly, they measured the warmest contact temperatures on soft, fresh snow where inter-granular bond failure would likely have impeded the formation of persistent contacts.
The usual interpretation of sub-zero contact temperatures is that the sensors averaged the interface temperatures over areas much larger than the melted snow-grain contacts (Colbeck and Warren, Reference Colbeck and Warren1991; Colbeck, Reference Colbeck1992). However, our thermal model indicates that flash temperatures are small, and thus nominal temperatures closely approximate contact temperatures. Consequently, thermocouples with sensing heads flush with the bottom of a ski or sled (Colbeck and Warren, Reference Colbeck and Warren1991; Colbeck and Perovich, Reference Colbeck and Perovich2004; Lever and Weale, Reference Lever and Weale2012; Lever and others, Reference Lever, Weale, Kaempfer and Preston2016) actually measured the snow-slider contact temperatures. To date, these measurements have shown that contact temperatures do not reach 0°C under a variety of sled and ski conditions of practical interest.
We re-examined interface-temperature measurements obtained on flexible fuel sleds in Antarctica (Lever and Weale, Reference Lever and Weale2012) and Greenland (Lever and others, Reference Lever, Weale, Kaempfer and Preston2016). Our contact-area measurements and abrasion modeling suggest that each cm2 of sled area experienced the passage of 104–105 snow-grain contacts per second at towing speeds of 3 ms−1. These multiple sliding contacts would have produced nominally uniform thermal conditions across each longitudinal position along the sled. Depending on ambient temperatures, contact area probably rose rapidly at the front of the sleds as the contacting grains warmed and abraded and wear particles filled some pore spaces. We modeled these two sets of field tests, assuming steady-state thermal conditions for the sled and transient conditions for the snow.
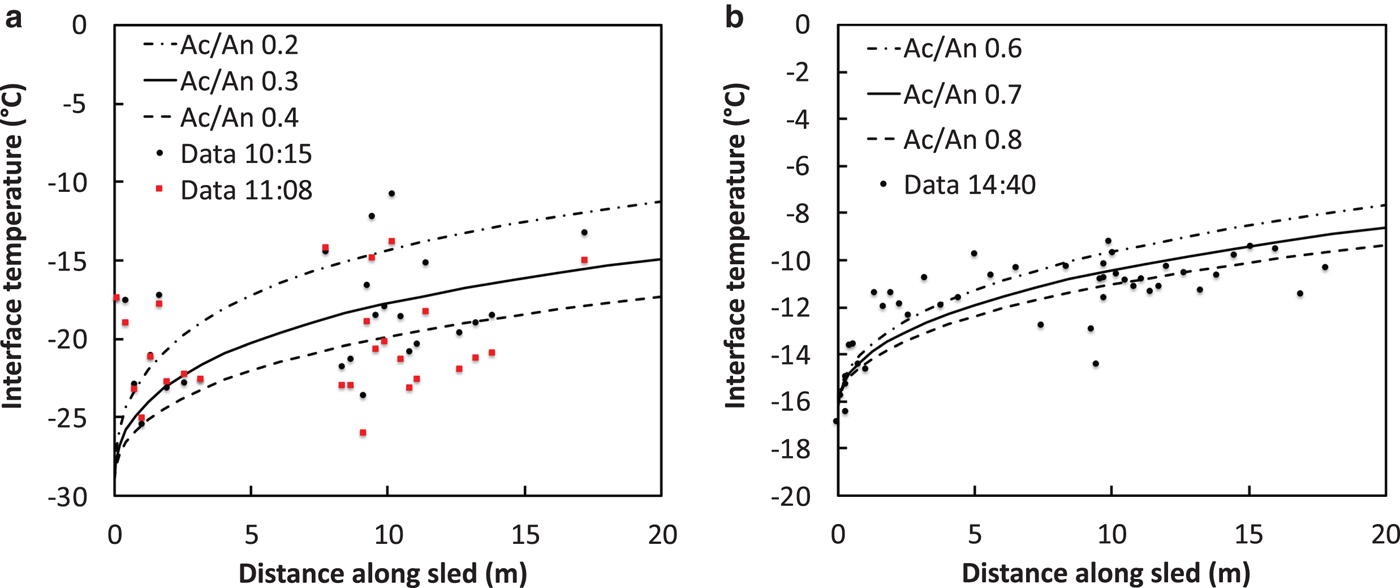
Fig. S9 shows photos of these dual-bladder fuel sleds, and Table S1 provides the parameters used to model their thermal response to sliding friction. For the sled, t > τ in Eqn (30), and for the snow t = x/U in Eqn (21), where x is longitudinal position along the sled. Figure 12 shows the resulting predictions at several values of constant A c/A n compared with 2 min average temperature profiles. The model here uses snow properties for the nominal temperature rise, assuming quasi-steady heat flow, q g, and ice properties for the snow-grain flash temperatures. Again, the model predicts that flash temperatures are negligible along the sled and are small contributions (<0.3°C rise) for the snow grains. Importantly, the model predicts that interface temperatures remain well below 0°C for reasonable values of A c/A n. Near-surface snow densities were ~300 kg m−3 in both locations, but the snow in Greenland was warmer than that in Antarctica and thus abrasion should have produced higher contact area. Average model values of A c/A n = 0.3 for Antarctica and 0.7 for Greenland are consistent with this effect. Note that the measurements show significant spatial variations that likely resulted from coupling of contact temperatures, wear rates and contact areas to vary the local friction and local heat fluxes. While modeling this coupling is beyond the present scope, it should be feasible to do so if we can establish a link between wear rates and dry-lubricant friction using third-body approaches.
Model predictions for steady-state temperature profile along Polar sleds. (a) 19 October 2009 in Antarctica, −29°C air temperature; (b) 7 May 2010 Greenland, −17°C air temperature.
We also applied the model to mimic steady-state alpine skiing: U = 20 m s−1, L = 2 m, p = 2.5 kPa, μ = 0.02, R = 5 × 10⁻⁵ m, T air = −8°C. Figure 13 shows the predicted temperature profiles using A c/A n = 0.2 ± 0.1. For these conditions, most of the frictional heat flows into the snow, and q g~constant. Flash temperatures on both the ski and the snow are negligible (<0.1°C), and the temperature profile approximates the (x/L)1/2 dependence associated with the transient response of the snow. Contact temperature at the rear of the ski does not reach 0°C unless A c/A n < 0.06, and the midpoint of the ski does not reach 0°C unless A c/A n < 0.03. While these might be reasonable values for hard-packed snow at the front of a ski, accelerated abrasion should significantly increase contact area before temperatures reach 0°C.
Model predictions for conditions mimicking alpine skiing.

While a detailed review is beyond our scope here, we may qualitatively account for why previous snow-friction models predicted that self-lubrication governs applications such as skiing. Models by Colbeck (Reference Colbeck1988, Reference Colbeck1992), Lehtovaara (Reference Lehtovaara1989) and Bäurle and others (Reference Bäurle, Kaempfer, Szabo and Spencer2007) included the heat flux from dry-contact friction at the front of a slider. However, they did not consider that dry contact would inherently wear the snow grains, and contact area would increase substantially as contact temperatures approached 0°C. Indeed, we are unaware of any previous snow-friction model that included the effects of abrasive wear in the dry-contact zone.
Colbeck (Reference Colbeck1988, Reference Colbeck1992) predicted dry contact along only 0.4% of a 2 m ski at −10°C and perhaps 4% at −40°C, for skiing at 10 m/s and assuming constant contact area of A c/A n = 10−3. However, predicted dry-contact length increased with area-ratio squared, so for A c/A n~0.01–0.1 this model would predict dry contact along all or most of the ski, similar to our results. Lehtovaara (Reference Lehtovaara1989) also assumed constant contact area in the dry-contact zone, given by the area needed to support the skier at pressure equal to snow-grain hardness adjusted by an empirical ‘pressure parameter’. Lehtovaara neglected heat flow into the slider and obtained a similar expression as Colbeck to predict dry-contact length proportional to contact-area squared. Although Lehtovaara noted that dry friction could dominate skiing at low contact pressures (i.e., high area ratio) and low velocities, model results suggested that mixed dry and lubricated contact would occur for most skiing conditions. Both Colbeck and Lehtovaara formulated thermal models based on nominal temperature rises but did not recognize that under these conditions thermocouples embedded at the interface would measure the actual snow-grain contact temperatures.
Bäurle and others (Reference Bäurle, Kaempfer, Szabo and Spencer2007) formulated a numerical simulation of a slider on ice that they felt would apply to skiing. They used test data from a 4 cm-long polyethylene slider repeatedly passing over an annulus of ice to tune the model, with constant A c/A n = 0.1–0.2. Interestingly, measured interface temperatures remained below 0°C throughout their tests. Their model did not evolve contact area from small starting values, which would have initially directed most of the frictional heat into the slider. Consequently, their model predicted nearly instant formation of constant-thickness water films, while the test data showed that friction began low and increased an order-of-magnitude during the first few seconds of the test. Also, the data showed and the model predicted higher interface temperatures at the front of the slider than the rear. They did not explain how self-lubrication theory can account for these effects.
6. CONCLUSIONS
We presented three complementary lines of evidence, namely IR thermographs, coordinated SEM images and thermal modeling, to support the conclusion that dry-contact abrasion, not self-lubrication, governed the friction behavior of our tribometer tests. As we found previously, real-time IR-based contact temperatures remained well below 0°C for all test conditions. The coordinated IR, digital-microscope and SEM images revealed that two processes contributed to the growth of snow-slider contact area: abrasion of the contacting ice grains and infilling of pore spaces by sintered wear particles. The rate of abrasive wear for sliders over snow had not been quantified in the literature, and the observed infilling by sintered particles is a new contribution to the mechanics of snow friction. Our coordinated images and classical abrasion modeling indicate that both processes accelerate as temperatures approach 0°C. The resulting removal of the warmest layers of contacting ice grains, the flux of warm wear particles into pore spaces and the building of tiled contact area all tend to decrease interface temperatures.
The IR thermographs provided an important constraint on thermal modeling: the grain tops were in good thermal contact with the slider, and thus contact areas were much larger than snow-grain or slider asperities. The resulting thermal model of the tribometer tests, based on classical theory for multiple sliding contacts, indicates that flash temperatures were small contributions, most of the heat initially flowed into the slider, and that the nominal temperature of the slider closely approximated the actual contact temperature at any time. Essentially, frictional heat must warm 100% of the moving slider to the same contact temperature as the small-area, persistently heated snow grains. This model confirms that the snow-grain contacts would not warm to 0°C even during our long-duration tribometer tests.
The dominance of nominal-temperature increases over flash temperatures has important implications for field measurements: thermocouples embedded at the base of skis or sleds will measure the actual contact temperatures of the snow grains. Thus, existing measurements of ski and sled interface temperatures indicate that contact temperatures do not reach 0°C during sliding conditions of practical interest. Although the thermal model does not yet include coupling of temperature, wear rates, contact area and friction, it provides reasonable agreement with measured interface temperatures of Polar sleds, and confirms that these temperatures do not reach 0°C.
Self-lubrication theory anticipates a transition from dry to lubricated contact along a slider. The evidence presented here suggests that dry-contact abrasion and heat flow can prevent this transition from occurring for snow-friction scenarios of practical interest. The mechanics of wear particles generated between the slider and contacting snow grains, and particularly their role as a dry lubricant, could hold the key to understanding why snow is slippery in the absence of self-lubrication.
SUPPLEMENTARY MATERIAL
The supplementary material for this article can be found at https://doi.org/10.1017/jog.2018.97
ACKNOWLEDGEMENTS
The authors thank J. Hodge, D. Punt, C. Donnelly and C. Williams for their efforts to upgrade the tribometer and associated instrumentation and the CRREL refrigeration staff for maintaining our cold rooms throughout the extended test period. We also thank Dr T. Kaempfer for noting that predicted interface temperatures for Polar sleds were well below 0°C and Dr S. Daly for suggesting that moving heat-source theory should apply to snow friction. We are grateful for funding provided by the US Army Engineer Research and Development Center, Military Engineering Program under the Basic Research Portfolio.


 Open access