


In 1993, a political empire that had ruled in Italy since the end of the Second World War was rapidly crumbling: the centre coalition, dominated by the Christian Democrats (Democrazia Cristiana, DC). Vast swathes of politicians were being arrested in the wake of the “Clean Hands” (Mani Pulite) investigations.
These investigations would unearth extensive corruption across the entire political and bureaucratic apparatus and a ubiquitous system of bribes that included “maxi-bribes” worth hundreds of millions of Euros (L’Espresso 2017). The system depended upon a highly interconnected network of deputies and public officials at all levels of government who collaborated for their mutual benefit. A compelling example of the connection between deputies and local administrators is offered in the testimony of a constructor over the tender for the 1990 football World Cup. The constructor noted how he met with two deputies in Rome, Vincenzo Scotti and Ugo Grippo, both members of the DC, who asked if he was interested in the tender, and then directed him to municipal secretary (segretario comunale) Vincenzo Diretto (also of the DC), and to a series of representatives from other parties who controlled other municipal secretaries. All of these representatives asked for large sums of money in exchange for the timely approval of the contracts (Allum Reference Allum1997). For this system to work, it was necessary for those elected at subnational levels, who in turn elected mayors and regional presidents, to be subordinated to political leaders. Their compliance was ensured by the control that political leaders had over the municipal sections of the DC. Indeed, DC deputy Alfredo Vito told judges in his testimony that the composition of electoral lists was predetermined in most municipalities, as was access to municipal councils (Allum Reference Allum1997).
An important way to maintain this power structure was the ability to reinvest resources at the local level. This is exemplified well by the behaviour of De Lorenzo of the Italian Liberal Party (Partito Liberale Italiano, PLI). His party’s headquarters in Naples also housed the regional, provincial, and municipal secretaries, as well as the leader’s office. Here, individuals in need of help would come and the relevant files and permits would be managed by a handful of functionaries. This was enabled by contact with hospital directors, university professors, and health functionaries. When De Lorenzo became Health Minister, he used these networks to reinforce his relations with pharmaceutical industries and appointed individuals from these same networks to his Ministry (Musella Reference Musella2000). His corrupt activities were mostly concentrated in the public administration, for instance in the approval and pricing of pharmaceuticals, which involved the payment of sizeable bribes. Another exemplary case is that of Antonio Gava (DC), who used his support base within the party to ensure the election of Ciriaco De Mita as national party leader and, in return, was awarded the role of Minister for Post and Telecommunications after the 1983 election. This position enabled him to widen his clientelistic network, as he nominated 3,808 people of Neapolitan origin under his Ministry. Naturally, this had knock-on effects, for example with his personal secretary then managing to hire 40 falsi invalidi (individuals pretending to have disabilities to fill posts reserved for this category) from his town of origin to the same Ministry (Allum Reference Allum1997).
In such a case of systemic corruption, events or actions that attempt to quash corruption can have counterproductive effects. With this study, I aim to contribute to our understanding of public sector corruption by testing whether a shock to accountability (I define more precisely what I mean by this in ‘Accountability and corruption displacement’ section) at the national level leads to corruption displacement. My findings show that when scrutiny of national deputies in a given electoral district increases, corruption amongst local public officials in the same district increases. I argue that this can occur through a range of mechanisms, including the newly created national political vacuum leaving bureaucrats freer to consolidate their own sphere of influence and surrogacy behaviours such that bureaucrats effectively stand in for their political principals. Such phenomena were made possible, I posit, thanks to a de facto system of political appointments, meaning that accountability mechanisms were not functioning correctly.
The specific institutional setting, Italy in the 1980–1990s, allows for the analysis of how changes in national-level accountability influence local corruption. It provides the opportunity to exploit the multiple levels of government in Italy to offer within-country evidence of how corruption functions and cuts across administrative levels. I contribute to the existing literature by showing how corruption displacement can occur in response to broader accountability shifts, not only to targeted anti-corruption policies. Such cases are not easy to come by due to the occult nature of corruption practices and the need for a shock to national-level accountability. The setting also provides another important opportunity: being able to measure the indictment rates of public officials, something that is infrequent in other contexts, especially at the local level.
Accountability and corruption displacement
Accountability is a notoriously slippery concept, but in this case will be understood as “the relationship between an actor and a forum, in which the actor has an obligation to explain and justify his or her conduct, the forum can pose questions and pass judgment, and the actor may face consequences” (Bovens Reference Bovens2007, p. 452). The case under analysis – presented in greater detail in ‘National politics in crisis: the ‘Clean Hands’ investigations’ section – sees a sudden increase in judicial, media, and citizen scrutiny of the activities of the state. As such, the type of accountability under analysis is arguably a mixture of horizontal and diagonal accountability, where horizontal accountability is a relationship between equal institutions (different branches of government, the judiciary, and the executive), and diagonal accountability “represents the extent to which actors outside of formal political institutions (e.g. the media and civil society) hold a government accountable” (Lührmann et al. Reference Lührmann, Marquardt and Mechkova2020, p. 812). Henceforth, for brevity’s sake I will refer simply to ‘accountability’ rather than always specifying this mixture of horizontal and diagonal accountability. Another key concept I will be employing is that of corruption. Under analysis are corruption indictments at both the national (deputies) and the local level (public officials). I adopt Transparency International’s definition of corruption, namely “the abuse of an entrusted power for private gain.” In the case of national deputies, they are mostly investigated for what would be considered grand corruption or “[c]orruption that pervades the highest levels of a national Government, leading to a broad erosion of confidence in good governance, the rule of law and economic stability” (Rose-Ackerman Reference Rose-Ackerman and Williams2000), whereas at the local level, the indictments in my sample can be characterised as petty corruption or the “[e]veryday abuse of entrusted power by public officials in their interactions with ordinary citizens, who often are trying to access basic goods or services in places like hospitals, schools, police departments and other agencies” (Transparency International 2021).
Although the overlap between these types of corruption is minimal in legal terms in my sample (i.e., deputies are indicted for different types of crimes than local public officials, I return to this in ‘Data and methods’ section), there is no clear distinction between the two types of corruption. It is not obvious where petty corruption ends and grand corruption begins: “[v]ery junior officials, for example, who demand illicit payments from citizens may be doing so because they have to pay a cut of their take to their senior managers, who pay a cut to their superiors, reaching all the way up to the most senior state officials” (Abjorensen (Reference Abjorensen2014) [p. 21], see also Bohórquez and Devrim (Reference Bohórquez and Devrim2012)). As we will see, corruption in the Italian bureaucracy in the 1980–1990s was extremely widespread and characterised by precisely these types of hierarchical, multilevel relationships.
Yet, a fundamental question remains: how, in an established democracy, does corruption amongst political representatives and public officials survive? Despite the theoretical role of elections as sanctioning devices for voters to be able to hold their representatives to account (Barro Reference Barro1973; Ferejohn Reference Ferejohn1986; Przeworski et al. Reference Przeworski, Stokes, Stokes and Manin1999), there is evidence that, broadly, electoral punishment of corruption is rather mild (De Vries and Solaz Reference De Vries and Solaz2017; Bauhr and Charron Reference Bauhr and Charron2018) and that voters will continue to support corrupt governments under certain circumstances. Footnote 1 For example, in contexts where government institutions are weak and patron-client relationships strong, Manzetti and Wilson (Reference Manzetti and Wilson2007) argue that voters are more likely to support a corrupt leader from whom they expect to receive tangible benefits. Moreover, a voter’s identity – for example being a patronage-insider or a copartisan (De Figueiredo et al. Reference De Figueiredo, Hidalgo and Kasahara2011) or having an ethnic affiliation to an incumbent – affects how likely she is to turn a blind eye to corruption (Chang and Kerr Reference Chang and Kerr2009). Bauhr and Charron (Reference Bauhr and Charron2018) summarise existing explanations as to why citizens do not “throw the rascals out” as being due to a lack of information, a lack of institutional opportunities to do so, or because they do not prioritise anti-corruption efforts [p. 419].
Further to electoral accountability being rather ineffective when it comes to combating corruption, it has also been shown in numerous contexts that even targeted anti-corruption policies can have significant adverse effects. For example, Dávid-Barrett and Fazekas (Reference Dávid-Barrett and Fazekas2020) present evidence from over one hundred developing countries that an anti-corruption reform decreased corruption in the specific area it targeted, but led to the displacement of corruption to other areas that cancel out the positive direct effects of the reform. Similar adverse effects have been found by scholars examining anti-corruption measures in Brazil (Castiglioni et al. Reference Castiglioni, Cepaluni and Hidalgo2019), Uganda (Peiffer et al. Reference Peiffer, Armytage and Marquette2018), Malawi (Zimmerman Reference Zimmerman2014), and Romania (Fisman and Golden Reference Fisman and Golden2017; Borcan et al. Reference Borcan, Lindahl and Mitrut2017). A review of the evidence on corruption in developing countries by Olken and Pande (Reference Olken and Pande2012) confirms that officials often find alternate strategies to pursue rents when faced with anti-corruption policies.
I contribute to these literatures by showing in a within-country context, where key institutional and cultural features remain constant, how accountability increases can have adverse effects on corruption. As such, I build on existing knowledge by providing empirical evidence that in contexts characterised by systemic corruption, not only targeted anti-corruption policies can have corruption displacement effects, but broader accountability shifts too. Moreover, I show how this displacement occurs across national-local levels of government and theorise multiple channels through which such an effect may obtain.
Institutional features of Italy
In order to understand the relationship between accountability and corruption in Italy in the 1980s–1990s, it is important to describe some key institutional features. During the period in question in Italy, at the national level, an open list proportional (OLP) electoral rule was in place. The party system of the time was also exceedingly stable. The same party, the DC (in coalition with smaller parties), was in government from 1947 to 1994. This resulted in a democracy that was “‘blocked’, noncompetitive and [with] a governing class [that] continued to be unaccountable” (d’Alimonte Reference d’Alimonte2005, p. 253). OLP systems provide incentives for politicians to cultivate the personal vote (Carey and Shugart Reference Carey and Shugart1995) as voters have influence over the order in which candidates are elected. Furthermore, OLP electoral systems are associated with higher levels of corruption (Chang and Golden Reference Chang and Golden2007), precisely due to their incentives to foster the personal vote.
With regard to subnational government, there are three levels in Italy: regions, provinces, and municipalities. These levels are directly linked to national politics in that local politicians frequently run under the flag of the national parties. For example, in the 1990 municipal elections in Milan there were candidates running under the name of all the major national parties of the time: Democrazia Cristiana, Partito Comunista Italiano, Partito Socialista Italiano, Lega Nord, and Partito Repubblicano Italiano. The national committee of the party in question vets and authorises the local candidate to run on their platform, thus giving local voters a heuristic to assess what a given candidate stands for and who she is associated with on the national political stage. There are different areas of competence that dictate which governmental level administers which services. More information about the functioning of subnational government in Italy is available in the Appendix (Section 1.1).
Prior to “Clean Hands,” Italian deputies engaged in extensive patronage practices, appointing public officials on a nonmeritocratic basis (Zuckerman Reference Zuckerman1979; Golden Reference Golden2003). Public offices during this period were granted an unusual amount of discretion despite (or perhaps due to) excessively detailed and copious legislation (Predieri Reference Predieri1963; Golden Reference Golden2003). This manifested itself in myriad ways of working the system such that the Italian bureaucracy became an immense reservoir of patronage (Chubb Reference Chubb1982; Golden Reference Golden2003). There are too many nefarious hiring techniques described in the qualitative literature to be able to cover them all here, so I shall provide a selection of compelling examples. The first is known as “titularisation” and is described concisely in the following steps:
“…candidates are employed on a temporary basis, normally in a peripheral field office; more and more people are hired; after a given time, usually about five years, a law is passed by parliament that changes the employment contract, making it permanent for thousands or hundreds of thousands of employees” (Cassese Reference Cassese1993, p. 325). Footnote 2
Another similar technique, “svolgimento di mansioni superiori,” Footnote 3 circumvents the requirement for a public competition by advertising nonadministrative positions (e.g., clerks, typists, ushers, janitors, labourers) that can be hired on a direct personal basis (Chubb Reference Chubb1981, p. 113). In her case study of Palermo, Chubb finds that “[o]f 3,056 positions in the city government in 1976, 2,514 were nonadministrative; only 542 required public competitions” (Chubb Reference Chubb1981, p. 113).
It has been estimated that between 1973 and 1990, 350,000 individuals were recruited to the public administration without entrance exams – subsequently having their posts made permanent through special laws – thereby bypassing regular procedures, as compared to 250,000 individuals who were recruited regularly (Cassese Reference Cassese1993, p. 325). This intensive use of patronage hiring also extended to public holding companies such as IRI, ENI, and EFMI Footnote 4 where figures close to the DC held prominent leadership positions. Moreover, high-level politicians were directly engaged in managing and directing local administrative activities:
“Members of the national government were also involved in transactions […] at the local level. The former Prime Minister […] Bettino Craxi […] personally directed the affairs of the Socialist party’s Milan organisation: this organisation, in turn, played a leading part in extracting bribes from those firms which obtained contracts for building the local underground system” (Müller Reference Müller2000, p. 150).
This translated into significant numbers of public officials being de facto political appointees, even if the de jure system would see them as appointed meritocratically. I discuss these extensive patronage practices and party infiltration of almost every facet of the state’s activities in the Appendix (Section 2).
These practices resulted in an inflated and inefficient bureaucracy. To this day, the quality of Italy’s public administration is widely pilloried and satisfaction with public services as well as trust in governing bodies are consistently low (Transparency International 2013; Eurofound 2016). Golden (Reference Golden2003) argues that Italy’s “bad bureaucracy” has been purposefully fostered by deputies in order to offer constituent services to navigate the dysfunctional system and boost their personal vote. Footnote 5
Mechanisms and hypotheses
We have seen, then, that there were a series of conditions in place in Italy in the 1980–1990s that would undermine the correct functioning of the accountability mechanisms that should characterise an established democracy (for more details see the Appendix, Section 2). Combined with theory and evidence that elections can be ineffective as devices to hold politicians to account for their actions and that corruption displacement is a real risk in contexts where systemic corruption exists, which mechanisms might be at work behind an accountability-driven corruption displacement effect?
I limit myself to describing two channels, which seem most likely given the context. Footnote 6 They both pertain to the political vacuum created at the national level by the “Clean Hands” investigations whereby the accused deputies were (temporarily or otherwise) distanced from office due to their being investigated for corruption. The first channel is that bureaucrats become freer to consolidate their own autonomous sphere of influence in the system of corruption whilst national deputies are in crisis. Footnote 7 Public officials have multiple incentives to increase their role in corrupt exchanges: first, a remunerative benefit in that they receive side payments for their work on top of their salary. Second, the opportunity to administer favours for oneself for professional or political (if one is in local political office or is interested in entering politics) gain. Scholars of corruption in Italy have recognised (in a descriptive spirit, not focusing on accountability and displacement) precisely such a “new,” more decentralised form of corruption following “Clean Hands” (more on this in ‘Discussion’ section), whereby public officials stepped into the political vacuum left by the investigations, increasing their bargaining power with respect to politicians and, subsequently, their ability to extract resources through corrupt exchanges (Della Porta and Vannucci Reference Della Porta and Vannucci2007, Reference Della Porta, Vannucci, Tänzler and Maras2016b; Asquer Reference Asquer2013).
The second channel works through what I term “surrogacy” behaviours, whereby bureaucrats effectively stand in for investigated deputies. Public officials who wish to stay in the good graces of their political principals (the widespread patronage practices of the time meant that significant numbers of bureaucrats were personally indebted to national deputies for their positions) continue to distribute electoral favours to maintain key constituencies. This is widely documented in the qualitative literature: “[t]he raccomandazione by which the public employee accedes to the object of his aspirations is only the first link in a chain of reciprocal obligation that will progressively bind him ever more irrevocably to his patron and protector” (Chubb Reference Chubb1982, p. 98). Footnote 8 Thus, the public official has a strong incentive to ensure that favours continue to be administered to constituents. As Oliveros (Reference Oliveros2021) argues, patronage contracts are “self-sustaining over time” [p. 382] because public officials believe that their jobs are dependent on the success of their (incumbent) patrons. Footnote 9
This channel links to the literature on brokers or mediators in clientelistic relationships between politicians and voters. Public officials, here, are hypothesised to act as agents of the politician, collecting and responding to the requests of voters. Recent literature has enriched our understanding of clientelistic exchanges (Gingerich and Medina Reference Gingerich and Medina2013; Stokes et al. Reference Stokes, Dunning, Nazareno and Brusco2013; Weitz-Shapiro Reference Weitz-Shapiro2012; Rodrigo Zarazaga Reference Rodrigo Zarazaga2014) by focusing on political brokers or “ground-level intermediaries between parties and voters […] who can identify the needs of clients, distribute goods, and monitor behavior” (Holland and Palmer-Rubin Reference Holland and Palmer-Rubin2015, p. 1187). Such figures are hypothesised to become especially important in times of scandals when a political vacuum is created “by virtue of their capacity to cushion the uncertainties associated with the illegal nature of [corrupt] exchanges” (Della Porta and Vannucci Reference Della Porta and Vannucci2016a, p. 171).
An increase in local-level corruption would be expected via this “surrogacy” channel, as prior to “Clean Hands” deputies would look to personally manage as many electoral favours possible to claim credit directly and obtain preference votes. Qualitative evidence shows that “every public official from the national deputy to the municipal assessor maintains copious and detailed files recording every favour ever performed. These files […] are then activated during every electoral campaign” (Chubb Reference Chubb1982, p. 174). There is evidence that national deputies were able to influence even the highest ranked public officials (see the Appendix, Sections 1.3 and 2), who are the figures who would be best placed to “take over” from deputies during a period of incapacitation. It is important to recognise, however, that the impact of patronage certainly varied according to both the level of government and the type of public body under consideration. More high-ranking public officials are more difficult to appoint through patronage and control than low-ranking officials, and public holding companies were infamously under political control in the 1980–1990s in Italy, whereas this was less true of other administrative bodies such as the judiciary.
These two channels would also have been self-reinforcing in that individuals who accept a public position through patronage and understand “the rules of the game” are likely to spontaneously start making their own deals, to advance professionally. This mechanism is succinctly expressed by the ex-DC mayor of Reggio Calabria: “[o]ne of the people I initiated into taking mazzette [bribes] afterwards started to make small deals of his own, gli “assolo” [solos] as they’re called in the jargon” (Licandro and Varano Reference Licandro and Varano1993, p. 48). As such, corrupt exchanges take on a life of their own as officials appointed through patronage and organised into multilevel hierarchies (Appendix, Section 2) seek to administer favours and collect votes or money.
This leads to my first hypothesis that:
H1: An increase in national accountability is associated with corruption displacement to local levels of government
This implies that I expect to see an increase in local-level corruption in those electoral districts affected by “Clean Hands.” My second, competing, hypothesis is instead that:
H2: An increase in national accountability has no effect on local-level corruption
My findings overwhelmingly support the first hypothesis. I find a substantial and robust increase in local-level corruption in the electoral districts affected by the investigations.
National politics in crisis: the “Clean Hands” investigations
“Clean Hands” unveiled the existence of Tangentopoli (“Bribesville”) and upended the Italian political status quo. The investigations have been described as a “political earthquake” (Gundle and Parker Reference Gundle and Parker2002) and ultimately resulted in the discrediting and dissolution of the two main ruling parties (DC and PSI) and a major reform of the electoral system in 1993. Figure 1 summarises the political events that are of relevance to this article.
Timeline of political events in Italy in the 1980s–1990s.

A fundamental feature of the political situation depicted above for my research design is the timing and composition of the 1987 and 1992 governments. The standing government (X legislature, election: 14–15 June 1987) and the following government (XI legislature, election: 5 April 1992) were both composed of the same “kinds” of politicians. Looking at the lower house (Camera), 73% (457/630) of politicians were re-elected from the X to the XI legislature. Empirically, this means that ceteris paribus many more cases of (allegedly) corrupt activity are able to be identified, creating a discontinuity in the unearthing of corrupt actions by deputies, whilst the composition of deputies who were in office in the XI legislature remained stable.
I exploit this to provide a credible causal estimate of local public officials’ responses to a national political scandal using a Difference-in-Differences (DiD) estimation strategy. It is important to note that I am studying the period prior to the reform of the municipal, provincial (1993, Legge 81), regional (1995, Legge Tatarella), and national (1993, Legge Mattarella) electoral rules. These reforms came as a response, at least in part, to “Clean Hands” and were intended to decentralise and personalise politics in an attempt to counter the partitocrazia – partyocracy or “absolute domination which Italy’s political parties […] exercised over civil society and public institutions” (Donovan Reference Donovan1995, 62) – that had characterised the Prima Repubblica (1948–1994) (see the Appendix, Section 2).
Data and methods
I measure the impact of an increase in national-level accountability (“Clean Hands”) on local-level malfeasance. My DiD research design allows me to do this by comparing districts that are affected by the investigations with those that are not, over time. It removes biases in post-intervention period comparisons between the treated and control groups that could result from permanent differences between those groups.
Data
Thus, I require data on both national deputies and local public officials over time, including accusations as part of “Clean Hands” and a local-level corruption measure. First, focusing on the national level, I collect demographic data (age, gender, district of election etc.) from Gagliarducci et al. (Reference Gagliarducci, Nannicini and Naticchioni2011) for Italian Members of Parliament from 1987 to 2008. These data are supplemented with the same information for the 2013 election. Footnote 10 Thus, I have detailed individual-level data on the universe of elected politicians from all levels of government from 1984–2013 in Italy.
Second, still at the national level, I bring in Golden (Reference Golden2014)’s dataset of Italian parliamentary malfeasance. This dataset contains information on all requests by the Italian judiciary to remove parliamentary immunity (richieste di autorizzazioni a procedere, RAP) from deputies elected in 1948 through 1992, including the nature of the judicial charges, the partisan affiliation of the deputy charged, the deputy’s electoral district and legislature, etc.. The Italian constitution (Article 68) required that the Ministry of Justice transmit requests to remove immunity to parliament in order to investigate a legislator for suspected criminal wrongdoing or in order to proceed with an arrest warrant. A majority vote by the floor of the relevant chamber was required to lift immunity. The kinds of corrupt practices that the deputies in my sample undertook fall snugly into the category of government allocations to special interests. The most frequent allegation was “violation of the regulations on public financing of political parties,” Footnote 11 with “abuse of office” and “corruption for an act contrary to official duties” running close behind (Chang et al. Reference Chang, Golden and Hill2010, p. 182).
Third, focusing on the subnational level, these datasets are supplemented with local administrative data held by the Italian Institute of Statistics (ISTAT) and manually collected by the author from the ISTAT archive in Rome. These data include the number of “corruption crimes” indicted and regard public officials (not citizens). Footnote 12 These “corruption crimes” are expressly classified as “crimes against the public administration” (Codice Penale 1930a). Public officials (pubblici ufficiali) are defined by the Italian Penal Code as those who “exercise a public function, be it legislative, judicial or administrative” (Codice Penale 1930b), Footnote 13 for example judges, technical consultants, health inspectors, policemen, employees of municipal governments (Codice Penale 1930b). Footnote 14 Local politicians (such as mayors or councillors) are also included in this category. Given that there is so much variation in the types of roles covered in my sample, I consequently adopt a broad term to refer to them: specifically, public officials, which also closely reflects the notion laid out in the Italian penal code. The Corruption Indictments variable that is used as the dependent variable in my main specifications captures illegal activities such as embezzlement, misappropriation of yield to the detriment of the government, extortion, and bribery agreements. Footnote 15
I match these data sources at the electoral district level, to create a corruption score Footnote 16 for all the provinces within a district (see Figure 3 for a treatment map and the Appendix, Section 3 for more details). To be able to do so, I geocode the municipalities and provinces across the datasets, matching them to the electoral districts. Thus, a deputy can be linked to the corruption performance of the bureaucracies in the provinces within her electoral district. Descriptive statistics are presented in Table 1.
Summary statistics

Note: Electoral District refers to the electoral districts for Italy’s national legislative elections. In the estimations, the baseline region for comparisons for Macro Regions of Italy is the North. All variables are described in ‘Dependent variable’. ‘Theoretical covariates’ and ‘Additional covariates’ sections.
Empirical strategy
My identification strategy, a DiD design, exploits the timing of the 1987 and 1992 elections and the fact that the composition of both governments is very similar. I run the following regression model:
 $${Y_{dt}} = \alpha + \gamma trea{t_d} + \lambda pos{t_t} + {\delta _{DiD}}(trea{t_d} \times pos{t_t}) + \beta X_{dt}^\prime + {e_{ct}}$$
where ${Y_{dt}}$
is the number of individuals with Corruption Indictments in the local bureaucracies of a given district d and year t,
${Y_{dt}}$
is the number of individuals with Corruption Indictments in the local bureaucracies of a given district d and year t, $trea{t_d}$
is a dummy variable equal to 1 for a district that experienced an increase in the indictment rate of national deputies following “Clean Hands” and 0 for a district that experienced no meaningful increase,
$trea{t_d}$
is a dummy variable equal to 1 for a district that experienced an increase in the indictment rate of national deputies following “Clean Hands” and 0 for a district that experienced no meaningful increase, $pos{t_t}$
is a dummy variable equal to 1 if the deputy was elected after the scandal (1992) and 0 if elected before the scandal,
$pos{t_t}$
is a dummy variable equal to 1 if the deputy was elected after the scandal (1992) and 0 if elected before the scandal, $trea{t_d} \times pos{t_t}$
indicates treated electoral districts for postscandal years.
$trea{t_d} \times pos{t_t}$
indicates treated electoral districts for postscandal years. ${\delta _{DiD}}$
is the DiD estimator that captures the effect of the investigations on the levels of corruption in the local public administrations.
${\delta _{DiD}}$
is the DiD estimator that captures the effect of the investigations on the levels of corruption in the local public administrations. $X_{dt}^\prime$
is a vector of district-level controls (discussed in ‘Additional covariates’ section) measured for each district in each year.
$X_{dt}^\prime$
is a vector of district-level controls (discussed in ‘Additional covariates’ section) measured for each district in each year.
With respect to the “parallel trends” assumption, the most critical of the DiD assumptions in terms of internal validity: here, the assumption means that the districts with no increase in the indictment rate of national deputies (control) and those with an increased indictment rate (treated) were moving in parallel in terms of local public official corruption crimes ahead of the 1992 scandal. A visual inspection of the data, as presented in Figure 2, as well as analyses introducing lag years to the main model to test for pre-trends (Figure 4) strongly support parallel trends in the treated and control groups. The other assumptions required to justify inference from the DiD model are discussed in the Appendix (Section 4).
Parallel trends.

Dependent variable
The dependent variable in my models, Corruption Indictments (mean: 66.80, S.D.: 82.55), captures the number of local public officials who were indicted for corruption in an electoral district. I stress that these are indicted crimes and, as such, it must be recognised that the measure captures not only corruption in the province concerned, but also the effort and efficiency of the national and local authorities in combating corruption. I am able to account for efficiency through the Length of Judicial Proceedings (see ‘Additional covariates’ section), but capturing the effort of state authorities is, unfortunately, more problematic. Although I have no way of empirically capturing the effort that individual prosecutors put into fighting corruption, I hope that some contextual information (Appendix, Section 1.2) about the judiciary will assuage concerns about a differential amount of effort across prosecuting authorities in Italy. To the degree that one might be concerned about systematic differences in the amount of information available to judicial authorities across the country about corruption crimes, I seek to account for this through district and regional-level fixed effects (Table 2) and an analysis factoring in historical organised crime presence (Appendix, Table A2).
The effect of “Clean Hands” on local-level corruption, difference-in-differences estimations
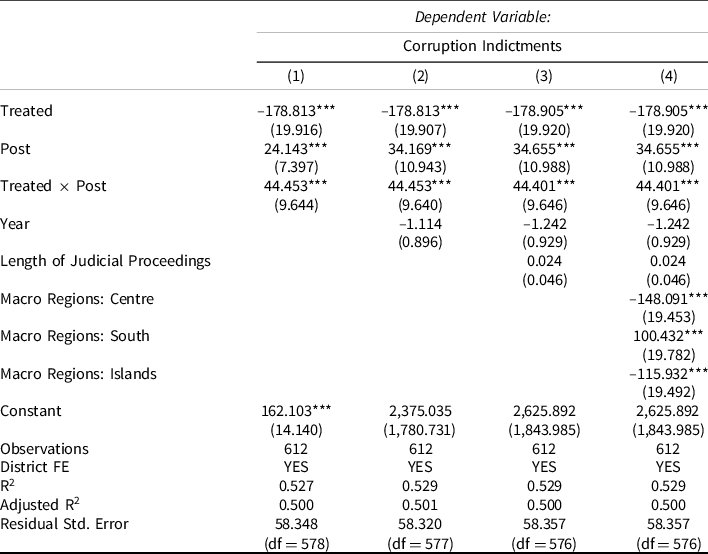
Note: DiD and control variable coefficients from OLS regressions of the effect of “Clean Hands” on the number of local public officials indicted for corruption crimes. Descriptive statistics for all variables are presented in Table 1. *p < 0.1; **p < 0.05; ***p < 0.01.
Judicial statistics on indictments are an imperfect measure of the underlying phenomenon of corruption. They capture only when a corruption crime is discovered rather than realised and they likely only capture a small percentage of the actual corruption crimes being undertaken. However, if one assumes, ungenerously, that the judiciary is even only slightly effective at identifying and investigating corruption, one can expect such statistics to mark a lower bound of the amount of corruption that is really occurring.
I argue that corruption crime indictments are one of the best measures that we have at our disposition, particularly for noncontemporary periods. Data on verdicts of political or administrative corruption are not very informative in the sense that corrupt activities are notoriously difficult to prove and punish adequately, in the Italian context. Davigo (one of the principal investigators leading “Clean Hands”) in fact noted that Italy makes fewer corruption convictions than Finland and that the province of Reggio Calabria (an area notorious for corruption) has had only two convictions for corruption in twenty years. Footnote 17 Indeed, as Decarolis et al. (Reference Decarolis, Fisman, Pinotti and Vannutelli2020) put it, “corruption cases are generally complex, and convictions relatively rare. This is particularly true in Italy […] [f]or these various reasons, official data on (convicted) offenders may greatly understate the extent of corruption” [p. 12].
Indictments also allow for the measurement of specific types and perpetrators of corruption, which would not be possible with, for example, survey data capturing perceptions of corruption (Heywood and Rose Reference Heywood and Rose2014). Moreover, survey-based perception measures of corruption have a series of weaknesses (see Golden and Picci Reference Golden and Picci2005, pp. 39–41) that make them suboptimal for addressing the research question I pose. Whilst there are excellent new ways to capture corruption in the Italian context (e.g., corruption risk indicators (Decarolis and Giorgiantonio Reference Decarolis and Giorgiantonio2020) or measures of how discretionary mechanisms affect corruption (Decarolis et al. Reference Decarolis, Fisman, Pinotti and Vannutelli2020)), unfortunately they do not exist for the time period under analysis here.
Theoretical covariates
Assessing whether local public officials respond to national political scandals involves a comparison of districts that were and were not exposed to the accountability shock, before and after the scandal. Thus, I include a dummy variable, Treated, to indicate those districts that were “treated” with an increase in the indictment rate of national deputies following the investigations (1) and those that were not (0). This measure, created using the RAP data, captures the increase in horizontal (judicial scrutiny) accountability that “Clean Hands” involved, given that diagonal (media or civil society scrutiny) accountability is difficult to capture empirically in this setting. Figure 3 presents the treated and control districts geographically (for details on how the indictment rate is calculated see the Appendix, Section 3 and Table A3). This Treated variable is interacted with a dummy indicating whether the time period is before or after the outbreak of the scandal in 1992, Post. Thus, the interaction term Treated*Post captures the effect of an increased indictment rate at the national level – the accountability effect – in the post-“Clean Hands” period on local-level Corruption Indictments.
Map of treated and control districts.
Dark grey districts: treated, light grey: control. Circles represent treatment intensity.

A potential confounding factor for my treatment would be if the “Clean Hands” investigations were originally driven by the same underlying interest in eradicating corruption at both the local and national levels. To speak to this, I have to lean on qualitative evidence that the “Clean Hands” investigators were initially interested in targeting illegal party financing in the upper echelons of the party administrations. The investigations were not a nationwide effort to root out corruption across the board. They were the work of a specific and small Footnote 18 “pool” of investigators and were shaped by the zeal and specific interests of individual investigators. At the beginning of “Clean Hands” (when my treatment is defined), the investigators thought that they were dealing with a phenomenon of illegal party financing that only affected certain political parties’ leaderships and certain businesses with extensive ties to the public administration, only to later discover the reach and intensity of the corrupt networks (Davigo Reference Davigo2021). Indeed, “Clean Hands” has been called “the biggest missed opportunity in Italian history” (Di Pietro cited in Amato (Reference Amato2013), translation by the author Footnote 19 ) precisely because the investigations failed to target the root of corruption. By focusing on politicians’ grand corruption, the investigations left the petty corruption that pervaded all levels of government to flourish.
In fact, experts argue that following “Clean Hands,” corruption actually worsened due to a legal system that made it very hard to punish corrupt individuals and the involvement of organised crime in local politics and public administration (La Voce 2015; Il Fatto Quotidiano 2015). Silvio Berlusconi later made judicial reform a top priority in order to rein in magistrates such as those involved in “Clean Hands” who he saw as “overweening and politically biased” (Dickie Reference Dickie2004). He also rendered judges’ work more difficult by introducing ‘several ad personam’ laws, aimed at shielding Berlusconi from certain charges, but ultimately generating an increase of the potential impunity for all white-collar criminals” (Vannucci Reference Vannucci2016, pp. 65–66). Moreover, it is argued that the investigations and their ineffectiveness in terms of translating indictments into guilty verdicts led to an increased “sense of impunity” amongst the leading actors in corrupt activities (Della Porta and Vannucci Reference Della Porta, Vannucci, Tänzler and Maras2016b, p. 145).
Additional covariates
My main statistical models include three control variables. My model already includes fixed effects at the district level (capturing time-invariant features of each district), so these additional control variables are intended to account for time-varying factors that are unrelated to the investigations, but might affect local-level corruption.
The first is a linear year trend, Year, to help rule out the possibility that the treatment and control districts were already on different growth trajectories in terms of Corruption Indictments before “Clean Hands.”
The second measures the average length of penal trials, that is to say the “ratio of the number of pending judicial proceedings, at the beginning and the end of each year, to the number of judicial proceedings started and completed in the same year” (Acconcia and Cantabene Reference Acconcia and Cantabene2008). I use this measure, Length of Judicial Proceedings (mean: 152.66, S.D.: 60.50), to capture the efficiency of local public administrations.
The third variable controls for the Macro Regions of Italy (1 = North, 2 = Centre, 3 = South, 4 = Islands), Footnote 20 given the varying levels of economic development and intensity of corruption that are associated with the country’s different regions, with the South of the country being associated with higher corruption than the North (Banfield Reference Banfield1958; Golden and Picci Reference Golden and Picci2005).
Results
Results are presented in Table 2. The coefficients themselves report, for a one-unit change in the independent variable, the estimated number of local public officials with Corruption Indictments in a given electoral district, holding the other independent variables in the model constant. All specifications support the first hypothesis, providing evidence that local-level corruption increases in districts where the indictment rate of national deputies increased following the scandal (i.e. where there was an accountability shock). The DiD estimator is consistently positive and statistically significant.
Illustrating with my preferred model (Column 4), the Post variable in isolation reports the mean difference in Corruption Indictments in the control group before and after “Clean Hands” and, as such, tells us what happens to the outcome variable in the absence of an accountability shock. In this case, it is associated with an increase of 35 local public officials facing Corruption Indictments. The interaction term of interest Treated*Post is associated with an increase of 44 local public officials facing Corruption Indictments. This can be interpreted as the treatment effect of the “Clean Hands” accountability shock. It tells us that after the shock, treated districts were affected differently to control districts – experiencing an increase in the number of corruption indictments as compared to control districts.
The average number of local public officials with Corruption Indictments per electoral district is 67 (as reported in Table 1), 44 prior to “Clean Hands” and 95 afterwards. To exemplify the magnitude of the effect, I shall take the (treated) electoral district of Milano-Pavia, the district described in the introduction, and apply the average changes expected in my model. Milano-Pavia had a preperiod average of 63 local public officials with Corruption Indictments, which would be expected to increase to 142 in the postperiod (the effect of the passage of time, in the absence of “Clean Hands,” +35) after having been exposed to the accountability treatment (+44). This is a sizeable effect given that Corruption Indictments has a standard deviation of 83, meaning that in the Milano-Pavia example the treatment effect size (+79) would be almost equivalent to an increase of a full standard deviation.
Results for control variables provide some interesting insights into the effect of district-level features on public administration corruption. The linear Year time trend has no statistically significant effect on the number of local public officials with Corruption Indictments. Neither does Length of Judicial Proceedings, my measure of local bureaucratic efficiency. The Macro Regions of Italy variable takes the North of the country as its baseline comparison group and indicates that the Centre is associated with a decrease of 148, the South with an increase of 100, and the Islands with a decrease of 116 local public officials with Corruption Indictments. This is in line with a wealth of evidence that the South of the country is especially prone to using patronage practices (Graziano Reference Graziano1973; Golden Reference Golden2003).
I cannot rule out the possibility that part of my effect is “mechanical” in that “Clean Hands” investigators may have looked into cases at the local level that were linked to national deputy indictments. Such effects are potentially long-lasting in that it may take some time for investigating judges to uncover evidence and then make subsequent local indictments. Large, well-established corruption networks are notoriously difficult to expose and eradicate. Leaning on my data, as presented in Figure 2, what I can show is that many years after the investigations, the level of local-level corruption in treated districts remains at a much higher overall level than pre-“Clean Hands.” This is suggestive of a new equilibrium for corruption: if the effect was purely mechanical, we would expect local-level corruption to return to roughly previous levels following an increase shortly after the investigations. Such a conclusion is in line with existing (descriptive) literature that argues that corruption changed form and arguably worsened in the years and decades following “Clean Hands” (Vannucci Reference Vannucci2012; Busso et al. Reference Busso, Martone and Sciarrone2018).
Robustness tests
To explore the robustness of my findings, I undertake several types of tests. The first group of tests are presented in Table 3. In Columns 1 and 2, I lag the dependent variable by one and two years in order to account for concerns that there may be a delay in when corruption crimes occur and when the Italian justice system indicts an individual (see the Appendix, Section 1.2). The DiD interaction terms remain positive and statistically significant, and the magnitude of the effect is very similar to that in my main models. In Column 3, I use an alternative measure of Corruption Indictments, namely the number of charges (rather than persons) made at the local level in a given district (excluding minors and unknown perpetrators). Again, the DiD interaction coefficient remains positive and statistically significant. In Column 4, I run a proof of concept model in which I replace my usual dependent variable with an alternative measure of corruption that gives me the important opportunity to see whether my result holds with an alternative measure. The variable is Omissione di atti d’ufficio (omission of official acts) which can be part of corruption investigations as it pertains to the omission, refusal or delay of official acts which may occur if a public official wishes to obstruct access to information due to a corrupt exchange. Reassuringly, the effect goes in the same direction and is of a similar magnitude to my main models, despite not being statistically significant (details in the Appendix, Section 5). Finally, in Column 5, I am able to undertake a placebo test using a variable that is unrelated to corruption, namely Violenza o minaccia a un pubblico ufficiale (the use of violence or threat against a public official) and for which no statistically significant effect is found.
Robustness tests: lagging the dependent variable, alternative dependent variable, proof of concept (omission), and placebo test (violence)

Note: DiD and control variable coefficients from OLS regressions of the effect of “Clean Hands” on the number of local public officials indicted for corruption crimes. Models and variables are described above. *p < 0.1; **p < 0.05; ***p < 0.01.
The second group of tests are summarised in Figure 4 and probe pretreatment dynamics. Figure 4 presents the interaction coefficients generated by replicating Column 4 of Table 2 and introducing year dummies for all the years prior to “Clean Hands.” The fact that none of the lag year interactions have an effect on local Corruption Indictments reassures us that there are no pretreatment effects contaminating the effect of the 1992 scandal.
Lag year interactions to test for pretreatment effects.

The third group of tests are a series of sensitivity tests and are presented in the Appendix, Table A2.
Discussion
My results support a vision of systemic corruption, where it becomes a collective action problem (Persson et al. Reference Persson, Rothstein and Teorell2013) under institutions and practices that undermine the principle of impartiality (Rothstein and Teorell Reference Rothstein and Teorell2008). When one channel for malfeasance is blocked, the machine readjusts itself to continue to meet demand. The players who constitute the network coordinate across levels of government to ensure that their interests are protected. The factors underlying the pervasive corruption in Italy during this period were not addressed by “Clean Hands.” As Vannucci (Reference Vannucci2016) puts it, “[j]udicial inquiries can only scratch the surface of illegality, they can hardly modify the invisible structure of nonwritten norms, expectations and values which rules in the realm of systemic corruption” [p. 66].
The “Clean Hands” investigations, then, provide an example of how institutional mechanisms can fail to control corruption in an advanced democracy (Vannucci Reference Vannucci2009, p. 234). Even political competition, the stalwart of democratic proponents, failed to improve the situation, with corruption being practised as way to finance voter mobilisation (Della Porta and Vannucci Reference Della Porta and Vannucci1994). The increase in national accountability led to an equilibrium change, with the locus of corruption shifting and new forms of corruption emerging. As such, I build on the existing literature by providing empirical evidence of corruption displacement in response to not only targeted anti-corruption interventions, but also to wider shifts in accountability.
Busso et al. (Reference Busso, Martone and Sciarrone2018) analyse corruption charges across the First and Second Republics and fnd that, whilst such charges decreased overall, there was an increase in charges of association. Thus, following “Clean Hands,” political leaders were no longer as central to the corruption crimes, but were regardless part of them. After “Clean Hands,” the majority of corruption crimes no longer concerned party financing, but became dominated by personal use. Footnote 21 This phenomenon came hand in hand with a process of decentralisation that increased delegated competencies and resource concentration to the local levels of government. As national-level corruption crimes decreased, those occurring at the municipal and regional levels increased. In fact, it seems that one of the keys to success for actors who survived involvement in the investigations was precisely being able to move across levels of government. Busso and Scaglione (Reference Busso, Scaglione and Sciarrone2017) find that 55.8% [p. 228] of the politicians (in this case looking at both national and local politicians) whose careers spanned both the pre- and post-“Clean Hands” periods held positions in at least two levels of government. The idea being that their ability to move across levels enabled them to retain and advance their political careers, despite involvement in corruption investigations.
Although my results are drawn from a specific historical and cultural situation, the conditions created in Italy in the 1980–1990s could easily be replicated in all manner of contexts. In terms of scope conditions, we could reasonably expect similar corruption displacement results to obtain in contexts characterised by strong party stability, electoral rules featuring the personal vote, a politicised bureaucracy, and the presence of systemic corruption. Such contexts, where citizens seem to accept bad governance and to prefer particularism to broadly beneficial policies, are not uncommon. As recently as 2017, Italy has been categorised as a “flawed democracy” (The Economist Intelligence Unit 2017), like 34.1% of the world’s countries covering 44.8% of the world’s population. Systemic corruption is also known to be widespread across the globe and is not “cured” by democratisation (Keefer and Vlaicu Reference Keefer and Vlaicu2008; Persson et al. Reference Persson, Rothstein and Teorell2013; D’Arcy Reference D’Arcy2015). We know that where political patronage’s scope is large, appointments are used both for political control and to reward supporters in exchange for votes and services (Kopecký et al. Reference Kopecký, Meyer Sahling, Panizza, Scherlis, Schuster and Spirova2016), as we see in the Italian case.
Conclusions
Using the case of Italy in the 1980–1990s, I have argued that the “Clean Hands” investigations sharply increased the level of scrutiny faced by national politicians, leading to a sudden rise in deputies being held to account by their voters. I find that in those (treated) districts where the indictment rate of national deputies increases following the scandal, local-level corruption increases significantly as compared to nontreated districts. I have hypothesised that this displacement could have occurred through numerous channels, including bureaucrats becoming freer to consolidate their own autonomous sphere of influence and bureaucrats acting as surrogates for investigated politicians, thanks to the political vacuum left by “Clean Hands.”
My data and research design make it possible to capture in an aggregate manner, with a nonsubjective measure, a phenomenon that is difficult to observe: corruption displacement. My results demonstrate that an increase in accountability alone is not enough to counteract systemic corruption. Once a system of corruption is established, scrutinising one level of government more closely or even renewing the political leadership will not solve the problem and can even worsen matters as forms of malfeasance mutate to avoid detection.
In terms of practical lessons, my results reveal a system of multilevel coordination that sidesteps traditional accountability mechanisms. This kind of widespread coordination needs to be addressed not via single, targeted interventions, but a battery of reforms including important horizontal accountability mechanisms. For example, the role of independent watchdogs to monitor public administration reforms and outputs (at all administrative levels) to ensure that meritocratic rules and regulations are effectively being implemented could be instrumental in ensuring that patronage hiring does not take place. Indeed, the series of reforms of the public administration in the 1990s that attempted to tackle corruption by introducing a form of spoils system at all levels of government unanimously failed. Only more recently in Italy has a horizontal response to corruption been instigated, in the form of the creation of the National Anti-Corruption Agency in 2014, which has powers to monitor the activities of the public administration.
One limitation of my data is that I cannot directly test the mechanisms through which political principals and public agents coordinate. The effect of increased accountability at the national level on local-level corruption is powerful, but I am unable to precisely identify how this increase takes place. Another limitation relates to the role of the media in shaping the public agenda. Popular interest in political issues, especially scandals, waxes and wanes as a consequence of media coverage. Thus, it is possible that the relationship between politicians and public officials is mediated by the intensity of exposure that the public is given to different political events or scandals, with variation in the possibility for coordination as a function of intensity of media coverage.
These limitations, however, present openings for important future research into how networks of illicit government activity form and how their decision-making processes function. In terms of the first limitation, actors could be identified by using legal documents chronicling cases of malfeasance, perhaps supplemented by expert interviews. Decision-making processes could be gleaned from network analysis and text analysis of depositions or interviews with involved actors. The validity and accuracy of such information are always open to debate, but the effects of such networks are hugely costly, widespread, and tend to affect the poorest individuals the most (OECD 2014; World Bank 2018). With respect to the second limitation, an important advance would be to incorporate the fact that not all political scandals are equally newsworthy into a theoretical model of how interactions between deputies, bureaucrats, and the electorate unfold. Future studies may thus develop such a theory and incorporate measures of media attention as mediating variables into their explanatory models.
In short, as corruption itself becomes more sophisticated in response to anti-corruption policies across the globe, I argue that the endeavour to identify aggregate patterns of malfeasant behaviour and better understand how such networks form and operate is more urgent than ever. My article contributes to this task by leveraging within-country variation in accountability to document corruption displacement and better understand how malfeasant actors can leverage multiple levels of government to circumvent increased scrutiny.
Supplementary material
To view supplementary material for this article, please visit https://doi.org/10.1017/S0143814X22000113
Data availability statement
Data Availability Statement: Replication materials are available in the Journal of Public Policy Dataverse at https://doi.org/10.7910/DVN/VNU0MX
Acknowledgements
I would like to thank Michele Castiglioni, Tony Bertelli, Christian Schuster, George Krause, Jennifer Selin, Carl Dahlström, Peter John, Asmus Leth Olsen, Miriam Golden, Tommaso Nannicini, Paola Profeta, Patrick Wolf, Paolo Berlardinelli, and participants at APSA 2018, MPSA 2019, and the Quality of Government Institute’s Seminar Series at the University of Gothenburg for useful comments. I would also like to thank the ISTAT library team for their collaboration for my collection of the local bureaucratic corruption data and Magistrato Ordinario Angelo Farina for sharing his expertise. Excellent research assistance was provided by Laura Serra. Any errors that remain are my own.


 Open access