

Introduction
Algorithms are playing an increasingly important role in the modern economy and, more recently, civic life. Online search engines, digital media, and e-commerce websites have long made use of recommendation systems to filter, sort, and suggest the products and media we consume on the internet. However, with the rise of social media and scientific developments in artificial intelligence research, algorithms have started to impact how decisions are made in entirely new domains. The influence of algorithms can be found in the structure of our social networks, whom we marry, what news articles we see, and what jobs we get.
As algorithmic suggestions and decisions have proliferated, so too has an awareness – and, increasingly, wariness – about the impact that algorithms are having on society. This has included specific concerns about racial disparities in the predictive accuracy of recidivism prediction instruments (Reference Angwin, Larson, Mattu and KirchnerAngwin et al. 2016), gender bias in how digital job advertisements are placed (Reference Lambrecht and TuckerLambrecht and Tucker 2016), the ability of dynamic pricing algorithms to discriminate indiscriminately (Reference Miller and HosanagarMiller and Hosanagar 2019), the role of news-filtering algorithms in polarizing our political discussions (Reference PariserPariser 2014), and a general concern about the ethics of using the unprecedented power of artificial intelligence for private and governmental surveillance (Reference TufekciTufekci 2017; Reference ZuboffZuboff 2019). All of this attention has led to an increased scrutiny of not just the institutions behind these technologies, but also the mathematics of the specific algorithms driving these systems and the decisions of the people engineering them.
As such, articulating and understanding the roles that algorithms play in shaping our society is no longer an academic exercise. In April 2019, a group of US Senators proposed the “Algorithmic Accountability Act” (AAA), in which they raised concern about the potential for “automated decision systems” to exhibit bias and discrimination (among concerns such as privacy and security) (Reference BookerBooker 2019). Their proposed remedy would require firms to conduct “impact assessments” of their internal algorithms and security systems. Despite the inherent complexities involved in assessing the impact of algorithmic social systems, this process may soon be a legally required undertaking for many organizations. As we begin to debate, study, legislate, and influence the role of algorithms in our society, it is essential to have a common (and commonsense) characterization of how algorithmic social systems function. What are the inputs of these systems? What influence do these inputs have on outcomes of interest?Footnote 1 What properties, rules, or dynamics of these systems generalize across different contexts?
In this chapter, we introduce a framework for understanding and modeling the complexities of algorithmic social systems. While some commentators have directly implicated “algorithms,” “machines,” “software,” and “math” as the primary source of concern in many systems, we believe this language masks what are sometimes the most important dynamics for determining outcomes in these systems (Reference EubanksEubanks 2018; Reference KnightKnight 2017; Reference O’NeilO’Neil 2017). Algorithms do not emerge out of thin air; their impact is driven by not just the mathematics behind them, but also the data that feed them, and the systems they interact with. We use this framework to propose a description of algorithmic systems being comprised of three fundamental factors: The underlying data on which they are trained, the logic of the algorithms themselves, and the way in which human beings interact with these systems (see Figure 4.1). Each of the individual factors in these systems plays an important role and can, in various circumstances, have the largest responsibility in determining outcomes. Furthermore, as we will demonstrate concretely, the interactions between the various components can also have significant impact, making targeted interventions difficult to evaluate ex ante and cross-context comparisons difficult to generalize between different circumstances.
The results of algorithmic systems can be attributed to their underlying data, the mathematical logic of the algorithms, and the way people interact with these factors.

As researchers attempt to study algorithmic social systems and lawmakers get closer to drafting legislation that regulates the inputs and outputs of these systems, we believe it is important to consider the challenges of ascribing blame, liability, and responsibility in the many circumstances in which automated decisions play a significant role. Our framework provides a scaffolding on which analysis of any algorithmic social system can be conducted. While we advocate for nuance and rigor in the assessment of algorithmic systems, we are not suggesting that such systems are simply too complex to understand, analyze, or influence. Indeed, the purpose of our framework is to encourage researchers, policymakers, and critics to (first) identify each of three components – data, algorithms, and people – when discussing the prospect of intervening in an algorithmic social system and (second) ensure the responsibilities and intended consequences of such interventions are well-articulated for each of the system’s components. This framework provides a principled starting point for modeling the key factors involved with complex algorithmic systems.
Case Study: Filter Bubble
To illustrate the utility of our framework for understanding the impact of algorithms in a particular context, we focus our attention on a hotly debated topic in the social sciences in recent years: The phenomenon of “filter bubbles” and the role that algorithms have played in creating them.Footnote 2 In the United States,Footnote 3 social media and search engines are increasingly prominent sources of news, with up to two-thirds of Americans relying on social media for news in their daily lives (Reference MoonMoon 2017). However, many commentators have raised concerns about the way in which these news platforms fragment our social fabric: Because psychometric algorithms at large tech companies are able to learn users’ preferences over time, the more people use these tools, the less likely it is that they will come across articles from perspectives that are different from their own (Reference PariserPariser 2014; The Economist 2017). The Obama Administration raised concern about this phenomenon in their 2016 White House Report on “Big Data”, in which they specifically referred to algorithms “that narrow instead of expand user options” as being a “hard-to-detect flaw” in the design of personalized services (Obama 2016). Especially given the scholarship on the increase in political polarization in the United States over the last several decades, we are at a moment when shared values and information environments are already under threat (Reference SunsteinSunstein 1999; Reference Achenbach and ClementAchenbach and Clement 2016). Any role that algorithms and technology platforms play in increasing social fragmentation – for example, by exclusively serving conservative news to conservative users and liberal news to liberal users – is worth investigating and understanding.
Such an understanding will be necessary if our goals – as individuals, scholars, activists, and policymakers – are to mitigate the negative consequences of online filter bubbles. The importance of developing a clear understanding of online platforms’ roles in the filter bubble phenomenon is underscored by a recent legislative proposal, introduced on the floor of the United States Senate in November 2019, named the “Filter Bubble Transparency Act” (FBTA). Separate from the Algorithmic Accountability Act, and designed specifically with the consumers of social media and political news in mind, this legislation has a stated purpose of guaranteeing Americans the right to “engage with a [media] platform without being manipulated by algorithms driven by user-specific data” (US Senate 2019).
In their attempts to legislate the use of personal data by internet platforms, the authors of the bill distinguish between two types of “user-specific” data: That which were “expressly provided by the user to the platform” for the purpose of an “algorithmic ranking system,” and that which were not. The bill specifies that platforms are allowed to use the list of accounts that someone subscribes to on social media to determine what content they will see. However, any filtering, ordering, or ranking of someone’s content feed – outside of chronological ordering – would require that platforms show “a prominently placed icon” near their content feeds. This icon would serve two primary purposes: (1) inform users that their feeds are being filtered based on their user-specific behavioral data and (2) allow users to select between an algorithmically ranked feed and a chronological feed.Footnote 4
Given the name of the bill itself, the implicit assumption of these regulations is that requiring platforms to be more transparent and giving users the option to avoid algorithmic filtering will alleviate some problems associated with digital filter bubbles. But to what extent are these assumptions true? In an effort to enrich our understanding of how this and other potential interventions might affect users’ online browsing behaviors, we review relevant research on the roles of people, data, and algorithms in determining filter bubble effects on social media and content aggregation platforms.
Review of Related Literature
We review several empirical studies that attempted directly to compare the effects between different factors in our framework applied to digital media platforms. These studies give us some insight into how significant each of the factors are in determining the extent of the filter bubble effect by attempting to quantify the political diversity of internet users’ media consumption.
We begin by considering research on users of Facebook, the largest social media network in the world and often the focus of discussions about digital filter bubbles. While much of the platform’s data are kept proprietary, researchers at Facebook published a large-scale study of real-user behavior in 2015 (Reference Bakshy, Messing and AdamicBakshy, Messing, and Adamic 2015). By looking at the behavior of 10.1 million active Facebook users in the US who self-reported their political ideology (“conservative,” “moderate,” and “liberal”), the researchers analyzed how the social network influences its users’ exposure to diverse perspectives. The researchers then calculated what proportion of the news stories in these users’ newsfeeds was crosscutting, defined as sharing a perspective other than their own (for example, a liberal reading a news story with a primarily conservative perspective).
To evaluate the impact of Facebook’s newsfeed algorithm, the researchers identified three factors that influence the extent to which we see crosscutting news. First, who our friends are and what news stories they share; second, among all the news stories shared by friends, which ones are displayed by the newsfeed algorithm; and third, which of the displayed news stories we actually click on. Note that this systematic approach to decomposing the impact of the newsfeed algorithm is similar to the data-algorithm-people framework we proposed earlier. In the context of a social media newsfeed, the primary data that feed into Facebook’s algorithm are the articles shared by one’s network. The algorithm then chooses which articles to display, from which individual users select a subsample of articles to click on and read. Each of these steps interacts in a dynamic process that determines the intensity of our ideological segregation.
By systematically comparing the extent to which exposure to crosscutting news is affected by each step in this filtering process, the researchers were able to quantify how much each factor affected the ideological diversity of news consumption on Facebook. If the second step – the newsfeed algorithm itself – is the primary driver of the echo chamber, this would suggest that Facebook’s design choices and the specific logic of its filtering algorithms play a significant role in driving online polarization. By way of contrast, if the first or third steps are more responsible for the filter bubble, it would suggest that the data and ways we interact with algorithmic suggestions are more significant than the algorithms themselves. Of course, this would not absolve Facebook from all responsibility in the development of filter bubbles, but it would suggest that focusing on algorithms specifically as the primary driver of polarization would be a parochial way of understanding the problem.
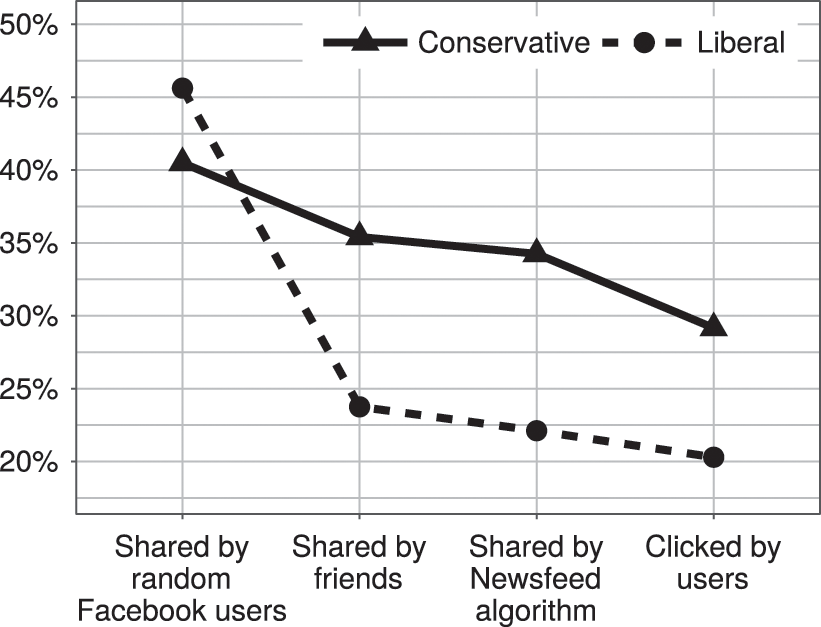
Interestingly, it is this latter hypothesis that was borne out by Facebook’s study. The researchers found that if users acquired their news from a randomly selected group of Facebook users, nearly 45 percent of stories seen by liberals and 40 percent seen by conservatives on Facebook would be crosscutting. However, because users come across stories from their self-selected network of friends, the researchers found that only 24 percent of news stories shared by liberals’ friends were crosscutting and about 35 percent of stories shared by conservatives’ friends were crosscutting. The friends people choose to associate with on Facebook play a dramatic role in reducing the diversity of news we see on the platform (relative to what is shared by the broader US population). Because we are more likely to be connected to friends with interests similar to our own (a phenomenon known as “homophily”), the news items those friends share are more likely to agree with our preexisting ideological positions than a random sample of news items across Facebook (Reference McPherson, Smith-Lovin and CookMcPherson et al. 2001).
The study also found that the newsfeed algorithm did reduce the proportion of crosscutting news stories (to 22 percent for liberals and 34 percent for conservatives). However, the magnitude of this reduction was significantly smaller than that attributable to the self-selection process in the first step. Facebook’s algorithm does exacerbate the filter bubble, but not by much. The last step in the filtering process – the extent to which we actually click on crosscutting news stories – further reduces the ideological diversity of our news. But again, the magnitude of this effect is modest: The final proportion of crosscutting news stories we click on is 21 percent for liberals and 30 percent for conservatives (see Figure 4.2).
Summarized results of “Exposure to ideologically diverse news and opinion on Facebook” (based on data presented in Science, 2015).
Given that the research cited above was conducted in-house by Facebook social scientists, critics may be skeptical of these findings. However, the results described above are consistent with another recent study on the topic of filter bubbles. Using an independently gathered dataset on web-browsing behavior, Reference Flaxman, Goel and RaoFlaxman, Goel, and Rao (2016) were able to isolate the impact of social media on news consumption patterns relative to other channels, such as news aggregators, search engines, and direct referrals (e.g., through bookmarks or typing specific websites into the browser’s address bar).
While this cross-channel comparison is different from the specific filtering effects of Facebook’s newsfeed analyzed by Bakshy et al., there are important similarities in the high-level findings. Flaxman et al. compare ideological exposure between four different channels of online news consumption, with varying levels of algorithmic influence: direct referrals (visits to self-selected news sites, with mostly editorial curation), news aggregators (whose recommendations are almost entirely driven by algorithmic selection), and search engines and social media (both of which are influenced by users’ choices themselves – what they search for and who they befriend – and algorithmic curation). In this research, the authors find interesting nuances around the differences between news and opinion articles and the importance of defining what metrics we use to quantify ideological polarization. But among their primary findings is that “the vast majority of online news consumption is accounted for by individuals simply visiting the home pages of their favorite, typically mainstream news outlets.”
While it is not possible to disentangle the specific effects of algorithmic selection vs. the effects of homophily in social networks in this study, we can compare the researchers’ findings between pure algorithmic curation (on news aggregators) and self-initiated browsing behaviors (through direct referrals). It turns out that, particularly for “hard news,” the algorithmically curated news feeds had content that was less ideologically polarized, resulting in users being exposed to more crosscutting content on these platforms than their personal browsing behaviors. As before, this research suggests that individuals’ own ideological preferences – and how those preferences translate into behavior in social networks and online browsing behaviors – play a larger role in the filter bubble effect than the results of algorithmic curation.
Another related set of studies, from our research group in 2010 and 2014, evaluated media consumption patterns of more than 1,700 iTunes users (Reference Fleder, Hosanagar and BujaFleder et al. 2010; Reference Hosanagar, Fleder, Lee and BujaHosanagar et al. 2014). We measured the overlap in media consumed by users – in other words, the extent to which two randomly selected users listened to any overlapping set of songs. If users were fragmenting due to algorithmic recommendations, the overlap in consumption across users would decrease after they start receiving recommendations. However, in our findings, we found that recommendation algorithms increased the average overlap of digital media consumption. This increase occurred for two reasons. First, users simply consumed more media when an algorithm found relevant media for them. If two users consumed twice as much media, then the chance of them consuming common content also increased. Second, algorithmic recommendations helped users explore and branch into new interests. While one might be concerned that these new interests were fragmented across many genres, our evidence suggests recommendation algorithms systematically push users toward more similar content. This is partially due to the fact that these algorithms exhibit a popularity bias, whereby products that are already popular are more likely to be recommended (Reference Fleder and HosanagarFleder and Hosanagar 2009). Because algorithms tend to push different people toward the same content, even after controlling for the volume-effect of recommendations, the algorithm had the effect of increasing consumption overlap among users. In aggregate, this means that algorithms increase the probability that you share a musical interest with another random user in the system. That the effects of algorithms can appear to increase fragmentation in one context (social media) and decrease it in another (digital media) suggests we need to be careful about making cross-context generalizations in this discussion. We will revisit (and attempt to provide insight into) this observation in a simulation analysis below, but we now discuss several recent studies that address an important limitation of research discussed thus far.
While all of the aforementioned studies are useful for illuminating the empirics of media consumption patterns on the internet, their research questions are, fundamentally, ones that compare the effects of data, people, and algorithms on fragmentation. This is different from asking what the effects would be if we were to counterfactually manipulate these factors (while attempting to hold others constant). In particular, an important component of these systems not explicitly discussed yet is that the design, logic, and mathematics of recommendation algorithms can have significant effects on fragmentation. This is demonstrated by Reference Garimella, De Francisci Morales, Gionis and MathioudakisGarimella et al. (2017), who designed an algorithm specifically to reduce users’ political polarity by exposing them to diverse content. Further, recent game-theoretic work on the digital filter bubbles – which models the dynamics of network formation, the economic incentives of content producers, and horizontal differentiation among user preferences – also suggests that different algorithm designs can both enhance and mitigate filter bubble effects in different contexts (Reference Berman and KatonaBerman and Katona 2019).
Despite their insights, a limitation of these studies is that they were not able to study how their proposed interventions behave in the wild. However, there are some studies in which the specific roles of different recommendation algorithms are evaluated in close-to-real-world environments. Reference Graells-Garrido, Lalmas and Baeza-Yates.Graells-Garrido et al. (2016) experimentally changed the graphical interface of a Chilean Twitter service designed to surface and recommend new content for its users to read. The authors randomly assigned users to different variations of the site’s graphical interface and different versions of the service’s recommendation algorithm. Interestingly, while the algorithm the authors designed to increase users’ network diversity was successful in exposing users to more politically diverse accounts, it performed worse than a (homophilic) baseline algorithm in getting users to accept its recommendations. This finding points to the importance of considering the downstream effects on all components of this algorithmic social system; simply changing one factor (algorithm design) may be offset by the differential way that other factors respond (e.g., people’s uptake of a new algorithm’s recommendations).
This point is also demonstrated by a study that attempted not to change the algorithms used on social media platforms, but rather by directly increasing the political diversity of users’ social graph (an intervention on the data component in our framework). In this work, researchers incentivized Twitter users to follow a bot account that reshared posts from accounts of elected officials and opinion leaders of the political party opposite from their own (Reference Bail, Argyle, Brown, Bumpus, Chen and Fallin Hunzaker et alBail et al. 2018). While this intervention expanded the political diversity the accounts users followed, this exposure to opposing opinions actually reinforced users’ original political identities, causing liberals to hold more liberal views and conservatives to have more conservative views.
We have so far looked at studies that have counterfactually changed users’ recommendation algorithms and network structures, but what about the effects of attempting to change people’s behaviors directly? Indeed, implicit in the transparency requirement proposed in the FBTA is the assumption that the behavior of the people using social media and content platforms would be different if they had more information. Informing users that their feeds are being algorithmically filtered might cause them to become more aware of the things they click, like, and react to, or opt to use a different (perhaps purely chronological) type of content filtering.
While we know little about the targeted effects of this specific type of transparency on social media users’ browsing behavior, we can look at some research that has attempted similar behavioral interventions. In Reference Gillani, Yuan, Saveski, Vosoughi and RoyGillani et al. (2018), researchers recruited Twitter users to use a “social mirror” application that was designed to reveal the structure and partisanship of each participant’s social network. By being made aware of the homogeneity of their network, the authors hypothesized that they could “motivate more diverse content-sharing and information-seeking behaviors.” Unfortunately, the results of the study were largely null, indicating that even behavioral interventions specifically designed to mitigate filter bubble effects have limited effects. If nothing else, this research points to the likelihood that the transparency component of the FBTA’s proposal will have little effect on changing consumer behavior on digital content platforms.
The Interaction Between Algorithms and Data
Taken together, the research discussed above demonstrates that the algorithms, underlying data, and human behaviors all have roles to play in the fragmentation debate. Especially when analyzing individual aspects of a single algorithmic social system, our three-factor framework provides useful context for understanding the dynamics at play between users, their data, and the algorithms they interact with. However, the juxtaposition of findings from the two separate contexts analyzed in this research – digital music and political news – highlights an important phenomenon: In some contexts, algorithmic recommendations can (modestly) increase fragmentation, while in other contexts, algorithms decrease fragmentation. This is not necessarily the understanding portrayed in some popular press, which has suggested that algorithms are a (if not the) primary culprit to blame for filter bubbles (Reference GuptaGupta 2019; Reference HernHern 2017; Reference LazerLazer 2015). There are many factors varying across the studies cited above, but this simple observation about the apparent heterogeneity in algorithmic effects suggests that discussions of digital filter bubbles without systematic and contextual nuance may lead us to make simplistic conclusions.
In line with this observation, we wish to highlight the need for rigor and caution in applying policy changes or recommendations across different contexts. As US legislators edge closer to directly intervening in the way online platforms recommend and curate digital media, it is important to recognize the challenges associated with crafting regulations that accomplish their intended goals. To illustrate these complexities, we will show specifically how the interactions between the various factors in algorithmic systems can play significant roles in system outcomes. In particular, we will show how applying the same (relatively minor) changes to the underlying logic of a recommendation algorithm in different contexts can have dramatically different results on the users’ emergent level of fragmentation. In addition to contextualizing the seemingly contradictory findings of the research cited earlier, this analysis demonstrates that, especially when several factors are changing simultaneously between contexts, one-size-fits-all approaches for addressing concerns about the digital filter bubble will likely fail.
Simulation Analysis
The research cited above suggests that complex interactions between the factors in an algorithmic social system may exist, but the contexts are too disparate for any systematic analysis. Ideally, we would like to experimentally vary the nature of the data, people, and algorithms in these environments to understand how they may interact. This motivates the development of a simulation framework, which we outline below. To make our rhetorical case for the importance of interaction effects across different contexts, we will only have to vary two of the three factors (the specific mathematics of the algorithms that determine which media are recommended and the underlying data that serve as inputs to the algorithms). But we emphasize how in between most real-world systems, all three factors will vary simultaneously, only adding to the complexities involved in making any unilateral policy recommendations across contexts.
Our framework is designed to capture many of the most important dynamics of how recommendation algorithms and consumers interact through time. In particular, we will model a set of consumers with idiosyncratic preferences, interacting with an online media platform in which their consumption patterns are influenced by the platform’s recommendations (similar to how news is recommended on Facebook or books and movies are recommended on Amazon). As with recommendation algorithms in real life, the recommendations one user receives in our simulation are also influenced by the consumption patterns of other users on the platform. This introduces a complex set of dynamics that make it difficult to predict a priori how one algorithm will affect system outcomes compared to another. As mentioned, we will study how this system evolves under different assumptions about the internal logic of the recommendation algorithm and the nature of the data on which these algorithms are trained.Footnote 5 We will specifically compare how two different recommendation algorithms affect fragmentation in environments that are more or less polarized. While there are many ways to describe “fragmentation,” in this setting we use a measure of “overlap” between users’ media consumption patterns. In our context, overlap will measure the extent to which a user in one ideological group consumes the same content as users from an alternative ideological group (roughly based on the conservative-liberal dichotomy in American politics). We discuss precisely how our simulation works in more detail below.
Simulation Setup
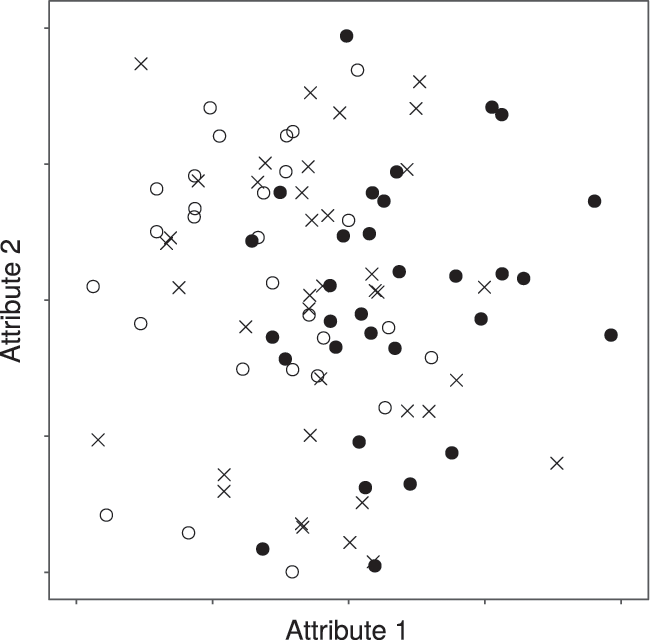
Our simulation is built around a two-dimensional “ideal point model” (Reference Kamakura and RajendraKamakura 1986). The two dimensions represent two abstract product attributes in this market. To capture the notion of political polarity, we will think of the X-dimension in our analysis as being analogous to one’s location on a scale from progressive to conservative. The Y-dimension can then be thought of as representing an abstract auxiliary attribute associated with digital media. (In the real world, these may be target age group, degree of sensationalization, writing style, etc.) An example of the data that serve as input to this model is shown in Figure 4.3. The preference of an individual consumer is represented by their position in this space (their “ideal point”); the products available for consumption in this market are also characterized by their coordinates in attribute space. This system allows us to model consumer utility as a function of the distance between their ideal point and the item they consume. In this model, users probabilistically consume items that are closer to them with a higher chance than they consume items that are further away.Footnote 6
Sample draw of consumers and items
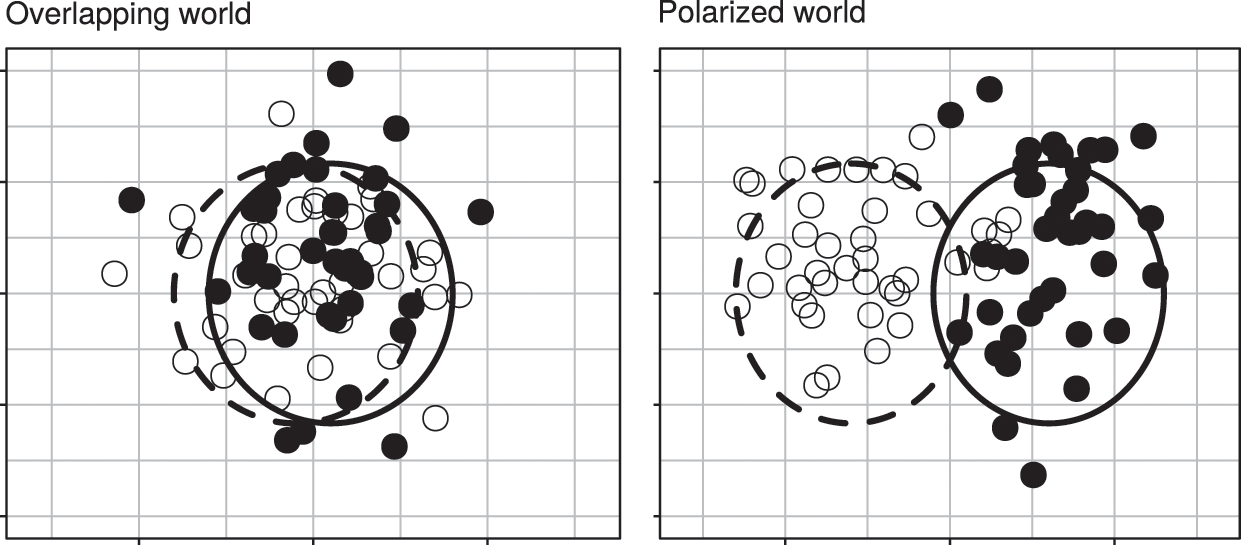
We first describe how we manipulate the ambient data-generating process for our simulation. In particular, we will vary the degree of underlying polarization present in the political environment. This manipulation is designed to account for the fact that some forms of media (like political news) may be inherently more fragmented/clustered along item attributes than others. To model this in our simulation, we first divide consumers into two nominal groups: White and black. In one set of simulations, we will assume that there is very little difference in political preferences among these two groups; but in another set of simulations, we will assume that these two groups’ preferences follow a bimodal distribution, with white congregating around one extreme and black congregating around the opposite extreme. We label these initial conditions as “overlapping” and “polarized”, respectively (see Figure 4.4). Effectively, these two different preference distributions help create two very different input datasets of media preferences for training our system’s recommendation algorithms.
Sample draws of consumer ideal points in overlapping (left) and polarized (right) contexts
One of the primary motivations for the use of recommendation systems in practice is that it is not possible for consumers to perform an exhaustive search of the item space. This means that – at least initially – consumers should only be aware of a subset of products in the market. We capture this in our model by only allowing consumers to purchase products in their “awareness set.” Initially, this set includes only products that are either close to the consumer in attribute space or close to the origin. This reflects the notion that consumers are likely to be aware of items in their own “neighborhood” and those that are most popular in the market overall.Footnote 7 Because consumers are not aware of all items in the market, we will use a recommendation algorithm to add items into each consumer’s consideration set over time.
Importantly, by performing this analysis via simulation, we can vary the both the ambient data environment of different contexts and the nature of an algorithm’s internal logic. Further, we can do this in more systematic ways than the empirical studies described earlier were able to do. The first algorithm we will use is the classic, nearest-neighbor collaborative filter (“people like you also bought X”). This is a deterministic algorithm that first selects the ten “most similar” users to a particular focal user (using mathematical definitions of “similarity” based on historical purchases), and then recommends the most popular item among this set of neighbors. We will then use an extension of the collaborative filter that uses stochastic item selection: Rather than recommending the most popular item in each neighborhood, as is done by the classical method, the stochastic algorithm recommends each item with a probability that is proportional to its popularity among a user’s most similar neighbors. This algorithm is designed to mitigate the problem of “popularity bias” in collaborative filters alluded to earlier; for our purposes, the stochastic collaborative filter provides a small twist on the classical algorithm that allows us to investigate how different algorithms behave in and interact with different contexts.
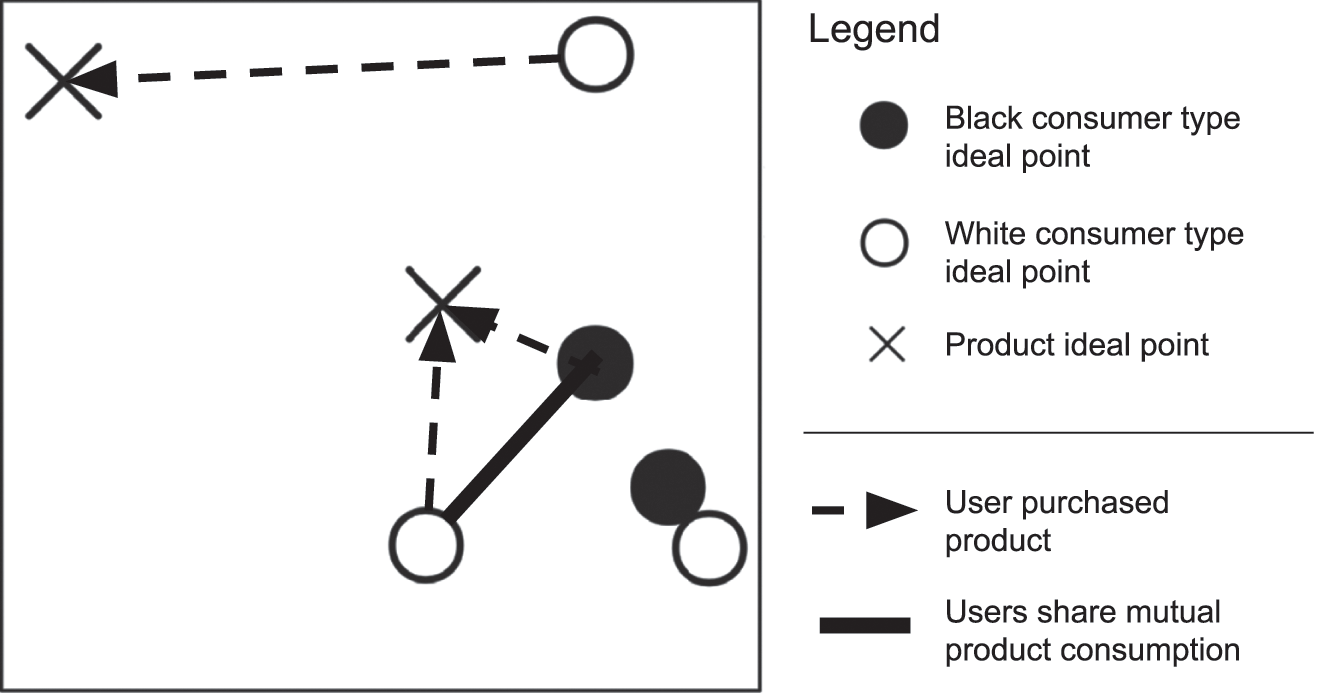
In keeping with our interest in analyzing polarization in digital media consumption, we will use this simulation framework to measure how each combination of empirical context and algorithm logic affects aggregate measures of fragmentation between white and black consumer types. We do this by operationalizing the notion of “commonality” or “overlap” by first constructing a network in which each consumer is a node and edges are added between two nodes whenever two users consume the same item (see Figure 4.5). Thus, users who consume similar items will have stronger ties in this network than users who do not share any mutually consumed items. Our final quantitative measure of overlap will be the percentage of edges in the entire network that are between users of different types (i.e., we count the number of connections between white and black users, and divide this by the total number of connections in the network).Footnote 8
When two users consume the same item, we add a network connection between them. We measure the number and proportion of edges between users of different types.
In summary, we have a 2-by-2 experimental setup (overlapping vs. polarized context; classical vs. stochastic collaborative filter) that we carry out according to the following procedure:
1. Overlapping vs. polarized preference distribution chosen.
2. Deterministic vs. stochastic collaborative filtering algorithm chosen.
3. Consumer and item positions drawn in attribute space (according to assumption about preference distribution made in step 1).
4. Consumers initially made aware of small subset of items.
5. Each user is recommended an item by adding it to their awareness set (recommended items are selected based on each users’ consumption history, according to the algorithm selected in step 2).
6. Each user probabilistically selects one item to consume from their awareness set, with higher weights given to those items that are closer to the user in attribute space.
7. Recommendation algorithm updates nearest neighbor calculations based on new consumption data.
8. Steps 5–7 repeat for 500 iterations.
9. Polarization metrics calculated for co-consumption network between consumers.
Simulation Results and Discussion
We have plotted the numeric results of our simulations in Figure 4.6, in which we have graphed the proportion of cross-type edges (our measure of overlap/commonality) for each of the four experimental conditions.
Proportion of cross-type edges (measure of overlap) in 2-by-2 simulation experiment
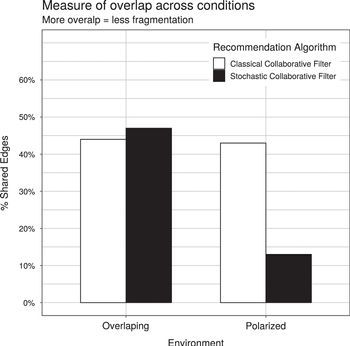
First, note how moving from a classical to stochastic collaborative filter (comparing colors within groups) has differential effects depending on the underlying data distribution. In the polarized world, the stochastic algorithm decreases commonality among dissimilar users (the proportion of cross-type edges goes from 43 percent to 13 percent), whereas this same change in the world with overlapping groups increases commonality (the proportion of cross-type edges goes from 44 percent to 47 percent). Similarly, when we hold the algorithm constant (comparing across groups for the same colors), moving from the polarized world to the overlapping world has a marginal effect on commonality when the classical algorithm is used, but this shift has a substantial effect on commonality when the stochastic algorithm is used.
These observations demonstrate that understanding the impact of either data or algorithms requires us to consider their effects jointly, with a focus on how they interact with one another. While this is a simple simulation in a microenvironment with several artificial assumptions, the implications of these results should inform our macro-discussion about echo chambers (and algorithmic systems) generally. Indeed, even in this simplistic, simulated world in which only a small number factors are varying, we observe complex interactions between data and algorithms. In real-world environments, the algorithms are more opaque, the data are more massive, and users exhibit more complex patterns of behavior. All of these factors only increase the complexity of the social system and suggest a need for an even greater appreciation of the intricacies associated with the interactions between all factors involved. On the whole, we believe these results suggest that, if policymakers are not careful about recognizing the distinct dynamics at play in different media contexts, they run the risk of exacerbating problems in one context while attempting to fix them in another.
While these interactions may indeed be complex, our framework provides a basis for understanding how the same changes in one context can have opposing effects in a different context (as we observed in the previously discussed studies on newsfeed and digital music fragmentation). We hope our simulation highlights both the importance of using a systematic framework for understanding algorithmic effects and – due to the presence of potentially significant interactions between factors in algorithmic systems – the importance of not overgeneralizing findings from one context or implementing policies that indiscriminately affect systems with differing characteristics.
Conclusion
In sum, the framework we propose here provides a way to decompose and contextualize current concerns around the negative impacts of algorithmic suggestions and decisions. We apply the framework to look at the growing concerns that social newsfeed algorithms are driving increased political polarization. We find that algorithms can play a role but focusing exclusively on them while ignoring the manner in which data, algorithms and people interact can paint an incomplete, and even misleading, picture when attempting to understand the effects of each component across different contexts. By systematically decomposing the causes of filter bubbles, we are able to provide a more complete characterization of the problem and facilitate the development of meaningful policy changes for moving forward.
As we attempt to engineer our algorithmic systems, the algorithms themselves certainly deserve a high degree of scrutiny. But it is important to not forget the role of other components of the system. As our analysis has shown, the same algorithm can have dramatically different effects depending on the context in which it is applied, and the same input data can have varying results depending on the algorithm that is acting on the data.
We conclude by suggesting that adding more context – both sociological and technological – to these discussions provides the most meaningful way forward for ensuring algorithms have a positive effect on society. By decomposing, quantifying, and ultimately understanding the complex dynamics that exist between humans and algorithms, we will be able to more efficiently diagnose, inform, and improve these systems. In this chapter, we have suggested a starting place for this process, which is for researchers to focus on both the individual roles of and the interactions between people, data, and algorithms in algorithmic social systems. We argue that, if we are to successfully steer these systems toward socially beneficial outcomes, it will be critical to appreciate the complexities between these systems and to avoid reaching for simplistic generalizations about the dynamics at play within them.


 Open access