

South Asia is home to approximately 273 million cattle, representing a wide range of indigenous and crossbred cattle. Major cattle breeds include high-yielding Holstein Friesian (HF) crossbreds, as well as native breeds such as Sahiwal, Red Sindhi, Gir, Tharparkar and various local Zebu types (Samanta et al., Reference Samanta, Ali, Jahan and Hassan2020; Alam et al., Reference Alam, Schlecht and Reichenbach2022). The region also has the highest cattle density globally, ranging from 70 to 137 cattle per square kilometre, compared to the world average of 29. This substantial cattle population plays a vital role in ensuring regional food and nutrition security, producing an estimated 151–155 million tonnes of milk and approximately 9.5 million tonnes of meat annually (FAO, 2023). Beyond food production, the livestock sector supports the livelihoods of over 500 million people in South Asia, either directly through farming or indirectly through input supply, processing, transport and marketing (Samanta et al., Reference Samanta, Ali, Jahan and Hassan2020). However, while crucial to food systems and livelihoods, this large cattle population is also a major source of enteric methane (EntCH4), a potent greenhouse gas produced during ruminant digestion.
Feeding practices and fodder quality are key drivers of EntCH4 emissions in cattle (Singh et al., Reference Singh, Kushwaha, Nag, Bhattacharya, Gupta, Mishra and Singh2012; Thoma et al., Reference Thoma, Popp, Shonnard, Nutter, Matlock, Ulrich, Kellogg, Kim, Neiderman, Kemper, Adom and East2013; Kumari et al., Reference Kumari, Dahiya, Kumari and Sharawat2014). High-yielding HF cattle from the temperate region typically consume 22–25 kg of dry matter (DM) per day, resulting in daily milk yields of 28–44 kg (Van Wesemael et al., Reference Van Wesemael, Vandaele, Ampe, Cattrysse, Duval, Kindermann, Fievez, De Campeneere and Peiren2019; Toghiani et al., Reference Toghiani, VanRaden, VandeHaar, Baldwin, Weigel, White, Peñagaricano, Koltes, Santos, Parker Gaddis and Tempelman2024). In contrast, South Asian cattle (HF cross) consume an average of 8–11 kg of DM per day (Alam et al., Reference Alam, Krupnik, Sharmin, Islam and Groot2024, Reference Alam, Velayudhan, Roessler, Yin, Parthipan, Mech, Soren, Malik, Rao, Bhatta, König and Schlecht2025) to produce daily 9–10 kg milk (Bhuyan et al., Reference Bhuyan, Habib, Mukta, Siddiki, Alam and Rashid2021; Hossain et al., Reference Hossain, Kabir, Amin, Deb, Amanullah, Afroz and Alam2021; Velayudhan et al., Reference Velayudhan, Yin, Alam, Brügemann, Sejian, Bhatta, Schlecht and König2023; Yousefian et al., Reference Yousefian, Alam, Ramappa, Schlecht and Dittrich2024; Alam et al., Reference Alam, Velayudhan, Roessler, Yin, Parthipan, Mech, Soren, Malik, Rao, Bhatta, König and Schlecht2025). This reflects a marked difference in feed conversion efficiency: high-yielding temperate cattle produce about 1.75–2.00 kg of milk per kg of DM intake, compared to 0.90–1.00 kg of milk per kg DMI in South Asian dairy production systems (Habib et al., Reference Habib, Rashid, Islam, Majumder, Islam, Ahmed and Alam2018; Velayudhan et al., Reference Velayudhan, Yin, Alam, Brügemann, Sejian, Bhatta, Schlecht and König2023; Alam et al., Reference Alam, Krupnik, Sharmin, Islam and Groot2024). This disparity is largely driven by breed and diet quality. Diets of high-producing temperate cattle generally contain about 16.4% crude protein (CP) and 31.4% neutral detergent fibre (NDF) on a dry matter basis (Melgar et al., Reference Melgar, Lage, Nedelkov, Räisänen, Stefenoni, Fetter, Chen, Oh, Duval, Kindermann, Walker and Hristov2021). In contrast, fodder grain mixed diets in South Asia contain only 3–10% CP and 17.34–82.19% NDF, depending on fodder type, growth stage and concentrate ratio (Hussain et al., Reference Hussain, Mufakhirah and Durrani2009; Alam et al., Reference Alam, Krupnik, Sharmin, Islam and Groot2024). These nutritional differences are also reflected in EntCH4 emissions. Indigenous and crossbred cattle in India have been found to emit 225–250 g EntCH4 per day (≈81–90 kg per year), corresponding to about 28.12 g EntCH4 per kg of milk produced (Paul et al., Reference Paul, Meena, Meena, Sirohi, Oberoi, Jha and Singh2019). However, the temperate high-yielding dairy systems typically show only about half of this emission intensity (Niu et al., Reference Niu, Kebreab, Hristov, Oh, Arndt, Bannink, Bayat, Brito, Boland, Casper, Crompton, Dijkstra, Eugène, Garnsworthy, Haque, Hellwing, Huhtanen, Kreuzer and Kuhla2018; Van Wesemael et al., Reference Van Wesemael, Vandaele, Ampe, Cattrysse, Duval, Kindermann, Fievez, De Campeneere and Peiren2019). Nevertheless, reported values can vary considerably because estimates are strongly influenced by the measurement approach. Direct measurement techniques such as sulphur hexafluoride (SF₆) tracer, respiration chambers and GreenFeed system are generally more accurate but are costly and time-consuming. In many countries – including Bangladesh – no studies have yet reported direct measurements of EntCH4. Consequently, national and regional inventories commonly rely on predictive models to estimate EntCH4 emissions (Garg et al., Reference Garg, Sherasia, Phondba and Hossain2014).
Building on this reliance on modelling, most prediction models use DM intake (DMI) or gross energy intake (GEI) as the main predictors (Moraes et al., Reference Moraes, Strathe, Fadel, Casper and Kebreab2014; Patra, Reference Patra2017) for national-level estimation. The Intergovernmental Panel on Climate Change (IPCC) recommends global-default approaches – most prominently the Tier 2 method – to ensure consistency across countries. However, the accuracy of IPCC-based estimates has been questioned for tropical systems, where feed quality and animal productivity differ substantially from temperate conditions (Ribeiro et al., Reference Ribeiro, Rodrigues, Maurício, Borges, e Silva, Berchielli, Valadares Filho, Machado, Campos, Ferreira, Guimarães Júnior, Azevêdo, Santos, Tomich and Pereira2020; Shi et al., Reference Shi, Ma, Mi, Yang, Jing, Yang, He, Li, Pinares-Patino, Samuels, Li, Ma and Long2025). In response, several tropical-specific models – such as those developed by Patra (Reference Patra2017), Ribeiro et al. (Reference Ribeiro, Rodrigues, Maurício, Borges, e Silva, Berchielli, Valadares Filho, Machado, Campos, Ferreira, Guimarães Júnior, Azevêdo, Santos, Tomich and Pereira2020) and Alam et al. (Reference Alam, Schlecht and Bateki2026) – have been proposed for national level estimation to better reflect local feeding environments and production realities. Yet, differences in input data, underlying assumptions and parameterization often lead to substantial variability among model outputs. Moreover, many of these tropical models are derived from relatively narrow datasets, limiting their ability to capture the considerable heterogeneity in feeding systems, breeds and management practices across South Asia. In this context, there is a clear need to evaluate how well these models perform when applied across diverse South Asian production environments. A comparative assessment using feeding-trial data from India, Pakistan and Bangladesh would be particularly informative, as these three countries together account for approximately 75% of milk and 52% of meat production in the South Asian region. Such an evaluation would provide robust evidence on the suitability of tropical methane prediction models for regional applications and highlight where further refinement is required.
To address this gap, the present study uses standardised cattle feeding-trial data from published research conducted in Bangladesh, India and Pakistan. Specifically, the study addresses the following research questions: (a) What are the estimated EntCH4 emissions when feeding-trial data are used in different prediction models? (b) How do estimated emissions vary across models without considering the effect(s) of breed, body weight, cattle type and milk-yield? (c) Which model, or combination of models, provides the most reliable estimates for South Asian cattle production systems?
Materials and methods
Ethics statement
Since all the data used in this study came from previously published research articles, approval from an Animal Care and Use Committee was not required for the present effort.
Study area
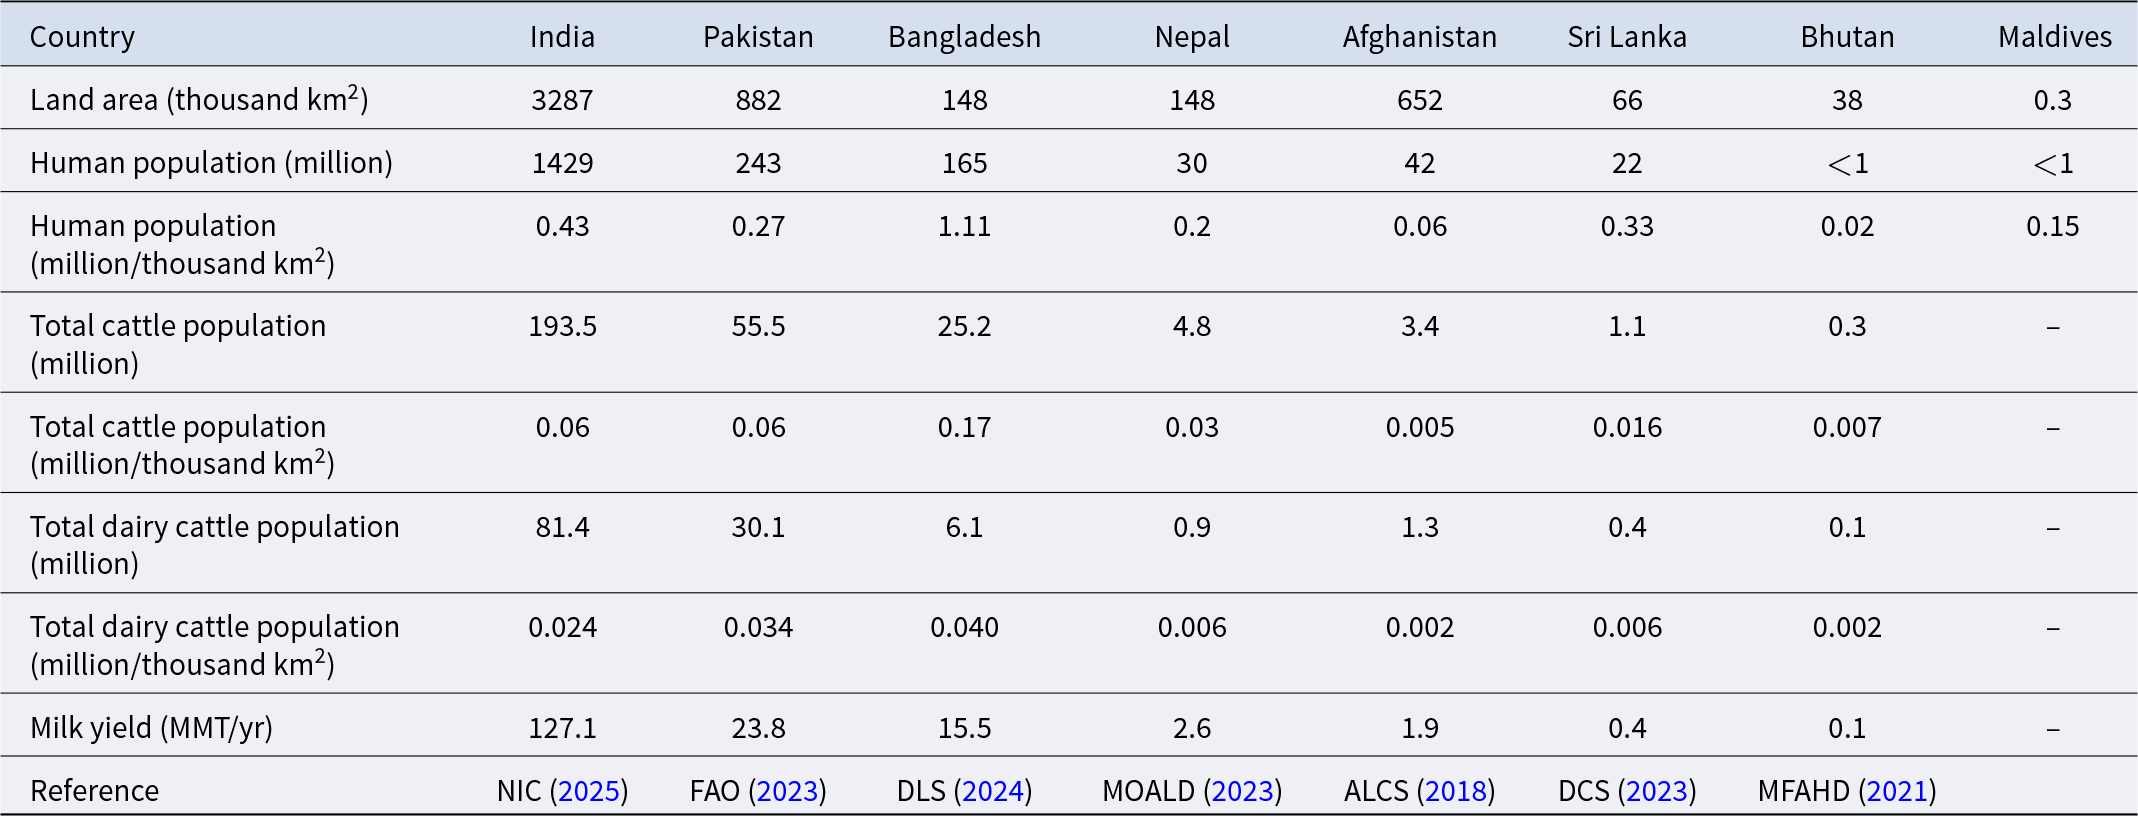
The study data were collected from the published literature of the research work conducted in the South Asian countries (Bangladesh, India, Pakistan, Sri Lanka, Bhutan, Nepal and Afghanistan). The Maldives has an exceedingly small cattle population and mostly relies on imported dairy and beef. For this reason, we exclude the Maldives from the study. The South Asian countries exhibit a great extent of variability in geography, from high mountains to low-lying coastal regions, but the economy all over is dominated by agriculture (Shahzad et al., Reference Shahzad, Waheed, Sharif, Ghafoor and Rafique2024). These countries were selected for their agricultural similarities, and they share a closely related climatic zone as well, which is tropical and sub-tropical in nature. There also prevails a similarity in animal rearing and feeding management (Samanta et al., Reference Samanta, Ali and Bokhtiar2019). The South Asian countries are densely populated with humans and livestock (Table 1). All these characters comply with the requirements for a possible comparative analysis under similar regional conditions.
List of South Asian countries with their human population, land area, total cattle population, total dairy cattle population and annual milk yield

MMT, million metric tons.
Literature search and selection
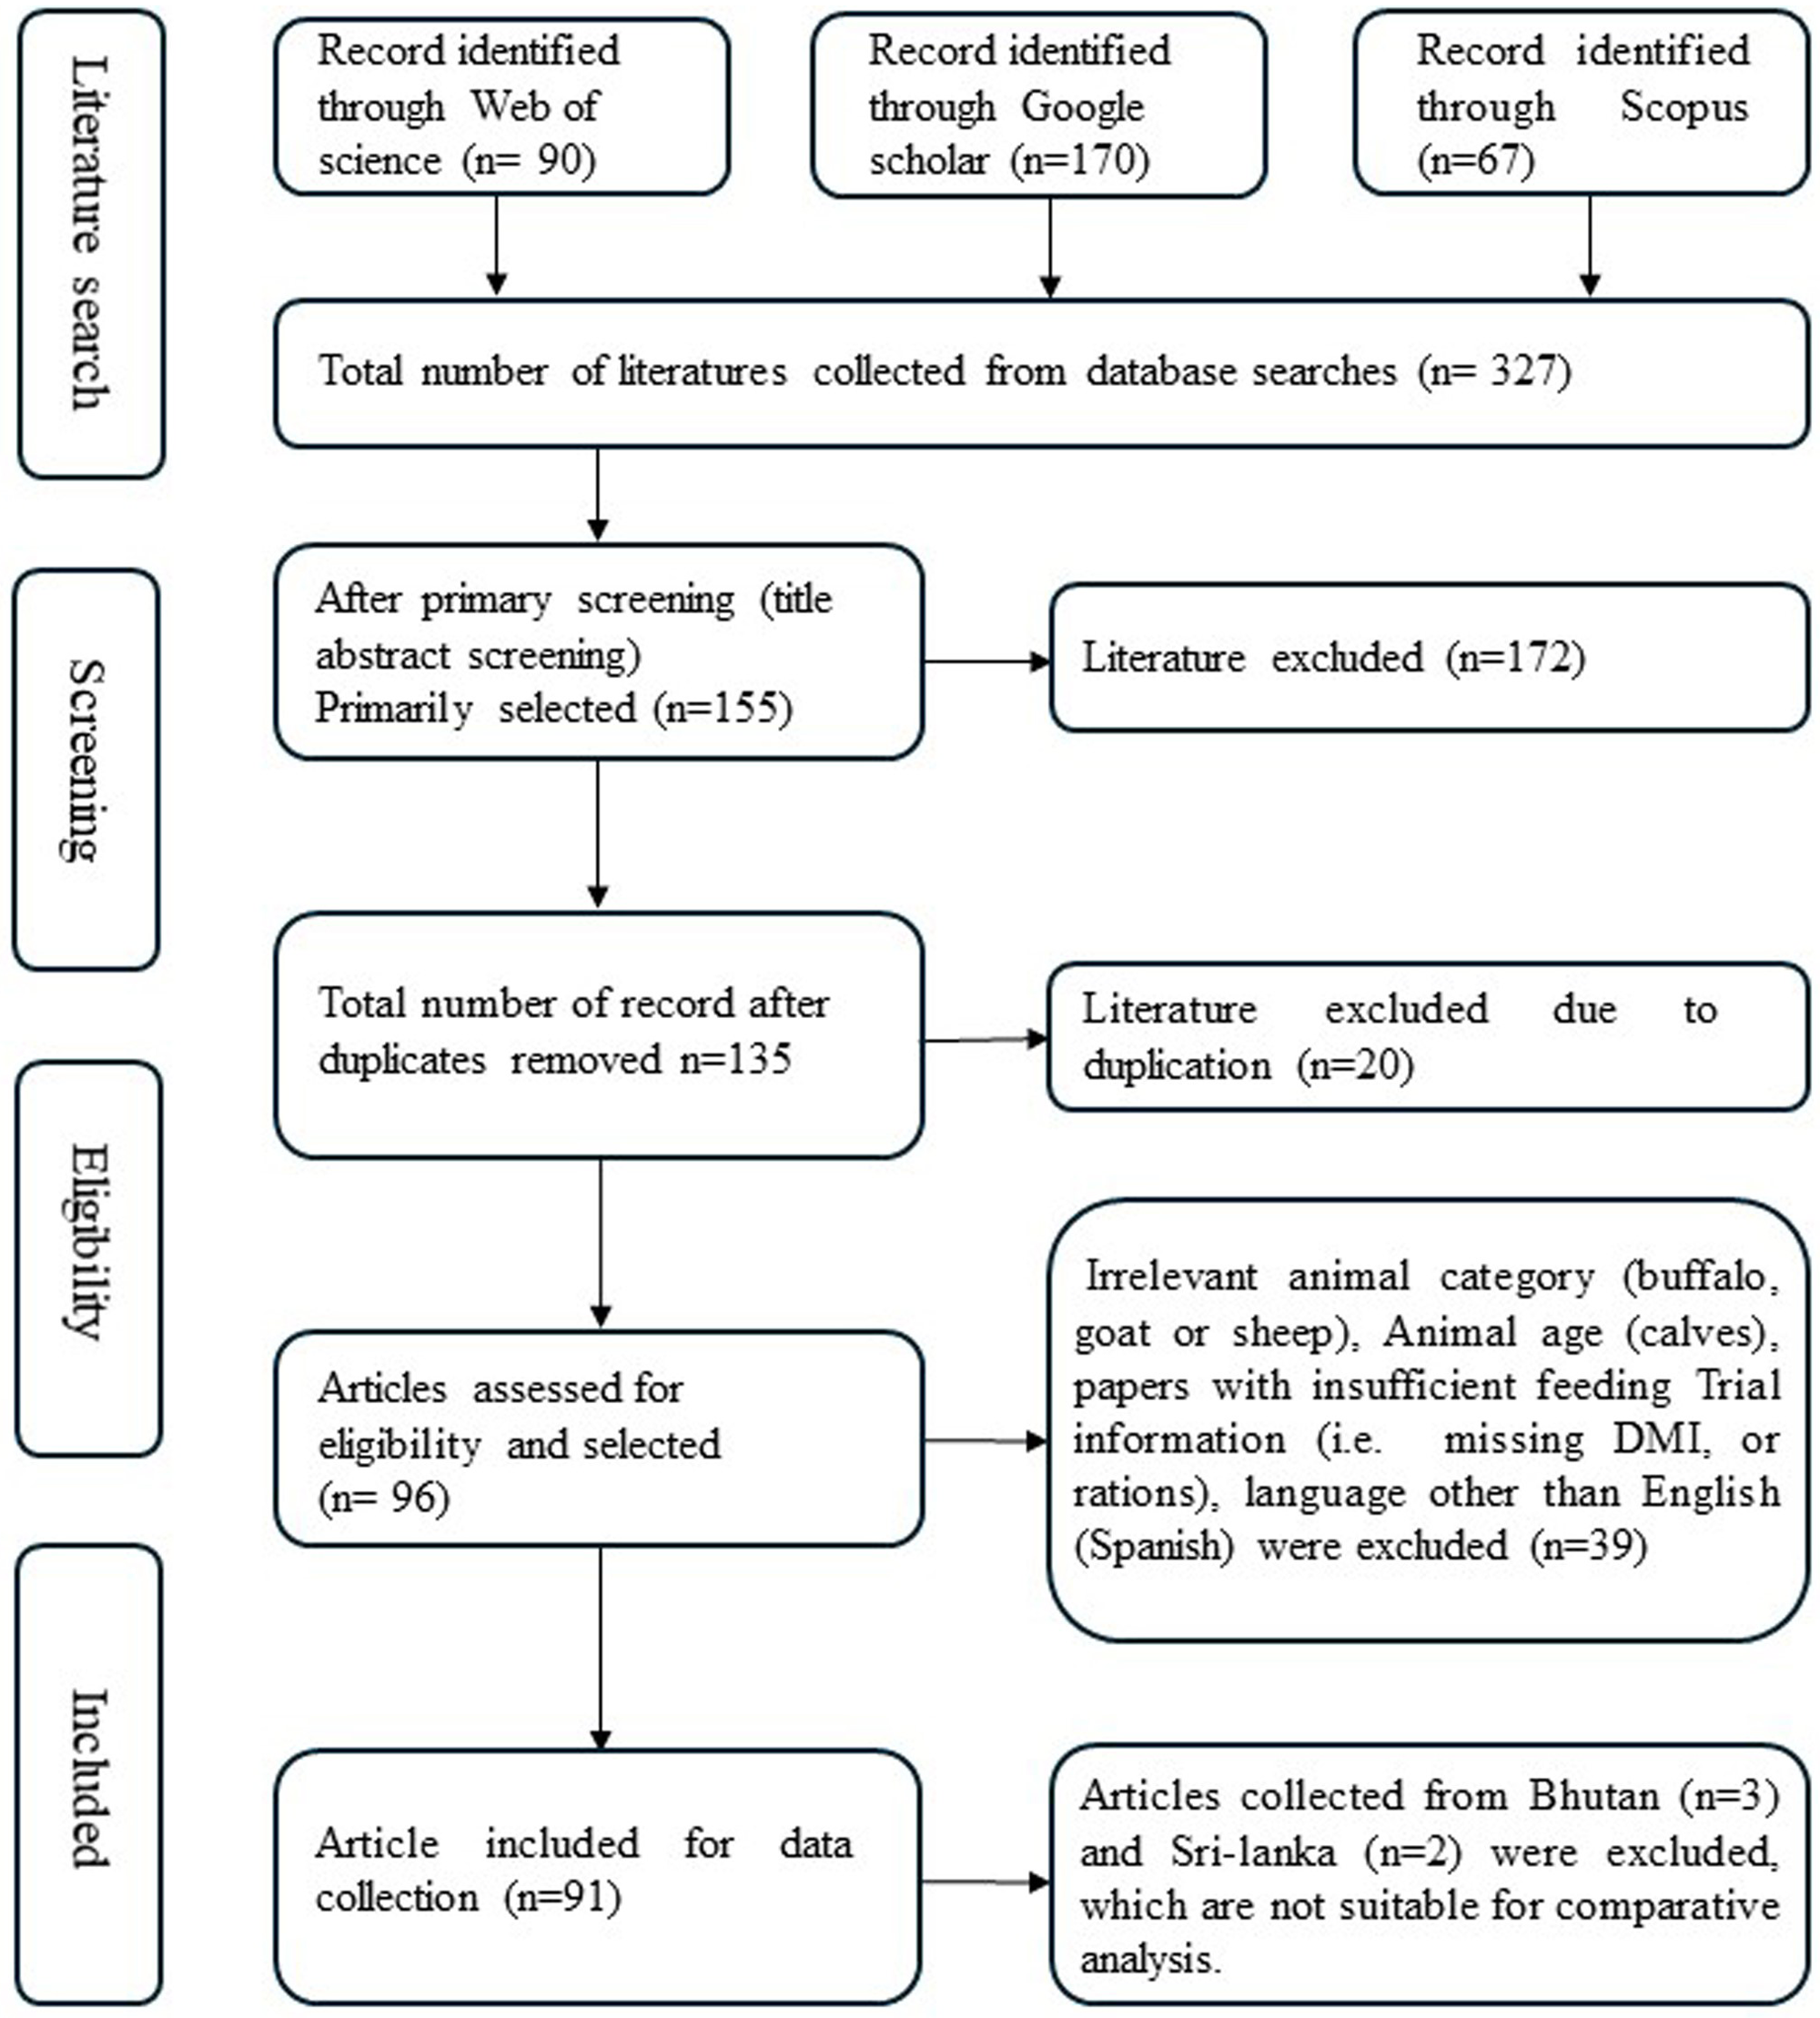
An extensive online literature search was conducted using Google Scholar, Scopus and the Web of Science databases to identify relevant peer-reviewed journal articles, reports and dissertations. The search strategy employed the following combination of keywords and Boolean operators: (feeding trial OR feed trial OR feeding strategy) AND (dairy cattle OR dairy cow) AND (enteric methane OR methane emission) AND (cattle feed OR livestock feed) AND (South Asia OR South Asian countries OR Bangladesh OR India OR Pakistan OR Nepal OR Bhutan OR Sri Lanka OR Afghanistan). The search primarily focused on feeding trials involving dairy cattle, including both lactating and non-lactating animals. No temporal restrictions were applied, as the time of publication was not considered relevant to the scope of this study. The search aimed to be comprehensive, covering all the available literature that met the inclusion criteria. Firstly, we only selected articles that were published in English to remove the language barrier. All the studies were conducted in South Asian countries; otherwise, they were excluded. We only focused on specific literatures that contain the following information: (i) country of study, (ii) control & treatment group or treatment group, (iii) feeding standard (National Research Council [NRC], Agricultural Research Council [ARC], etc.), (iv) number of animals, (v) lactation status, (vi) breeds name, (vii) name of the feed ingredients (with amount or ratios) used in feeding trials and (viii) DMI, GEI and milk yield. Research papers involving mixed animal groups were excluded, as their data were typically combined as well. Finally, 91 articles were included for quantitative analysis, consisting of literature from India (n = 59), Bangladesh (n = 20) and Pakistan (n = 12). Literature collected from Bhutan and Sri Lanka was excluded due to a scant number of eligible literatures, which makes it difficult for comparative analysis with the other three countries. We did not find enough relevant literature from Nepal and Afghanistan; for this reason, these two countries were also excluded from this study. The processes of literature identification, screening, eligibility assessment and inclusion followed the PRISMA guidelines (Fig. 1) as described by Moher et al. (Reference Moher, Liberati, Tetzlaff and Altman2010).
Flow diagram illustrating the screening and selection process for cattle feeding-trial data in South Asian countries, adapted from the PRISMA guidelines (Moher et al., Reference Moher, Liberati, Tetzlaff and Altman2010).

Data extraction
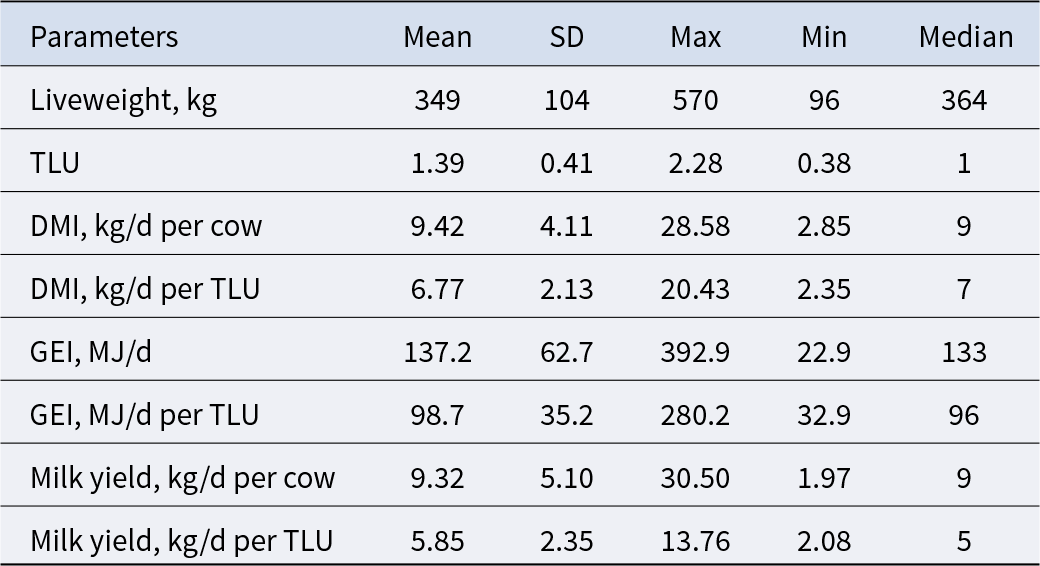
From the selected literature, the necessary data were systematically extracted using a structured collection template made with Microsoft Excel. We collected the data, including reference, country of study, location inside the country, treatment group, feeding standard (NRC, ARC), number of animals, lactation status, breed, body weight (kg), milk yield (kg/d), DMI (kg/day) and GEI (MJ/d) (Table 2, Supplementary Tables- S1 and S2). Animal diet parameter averages are also shown in Table 2. Along with these data, we also collected milk fat and protein percentages, if presented in the literature. The missing GEI in the literature was calculated using a feed database (https://www.feedipedia.org), and some are found in published research articles. Gross energy (GE) of feed was calculated using an established equation. Then the GE of feed was multiplied by DMI to estimate GEI. The formulae used are:
1. GE, Mcal/kg = CP% × 0.056 + fat% × 0.094 + (100 − CP% − Fat% − ash%) × 0.042 (Weiss and Tebbe, Reference Weiss and Tebbe2018)
2. TDN (%) = 40.23 + 0.1969 (CP) + 0.428 (NFE) + 1.19 (EE) − 0.1379 (CF) (Fonnesbeck et al., Reference Fonnesbeck, Wardeh and Harris1984)
3. ME (Mcal/kg) = (1.01 × (TDN% × 0.04409) − 0.45) (NRC, 2001)
4. GE = ME/0.526 (Woolwise, 2012)
Descriptive statistics of animal and diet parameters for cattle in the evaluation database for model evaluation (n = 1684)

n, number of cattle heads; SD, standard deviation; Max, maximum value; Min, minimum value; DMI, dry matter intake; GEI, gross energy intake; TLU, tropical livestock unit (1 TLU = 250 kg live body weight), MJ = Megajoule, d = day.
ME, metabolizable energy; TDN, total digestible nutrients; CP, crude protein; NFE, nitrogen-free extract; EE, ether extract; and CF, crude fibre.
We used the formula based on available data in the selected articles. If the article reported CP, fat and ash concentration (%), then we have calculated GE directly from the data (Equation 1). In very few cases, data on CP, fat and ash content of the ration were unavailable; instead, the papers reported CP, NFE, EE and CF percentages. Therefore, we need to use an alternative formula to calculate TDN first (Equation 2), and then the formula for TDN to ME (Equation 3) and ME to GE (Equation 4) were used.
Selection of models
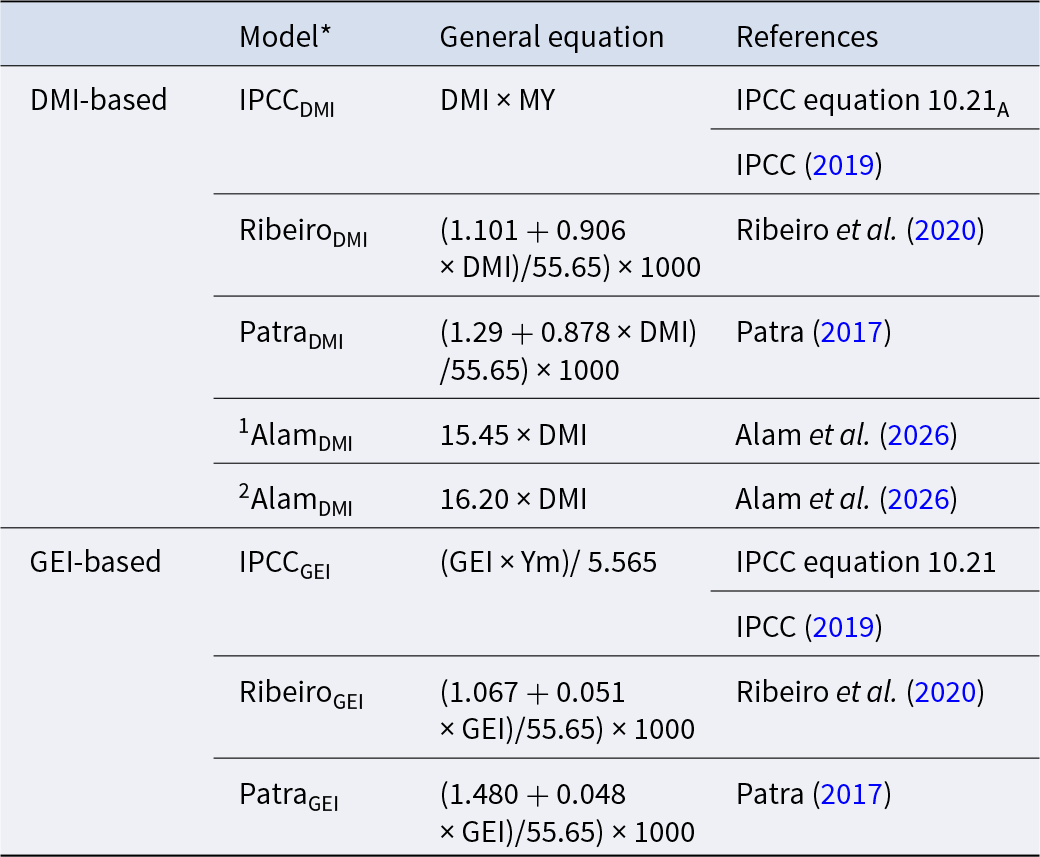
Twelve models developed or validated using (sub-) tropical datasets were identified and further reviewed to identify models most suitable for the South Asian countries. Given the need for parsimonious models based on data easily obtainable on-farm, we retained only models based on DMI and GEI with the best fit statistical performance (i.e., higher Concordance Correlation Coefficient [CCC] and Coefficient of determination [R 2], lower Root Mean Square Error [RMSPE]). Such variables are the most direct predictors of methanogenesis in ruminants, reflecting both the quantity and energy density of feed consumed (Ramin and Huhtanen, Reference Ramin and Huhtanen2013; IPCC, 2019). Accordingly, eight models (Table 3) were retained for further evaluation in the present study. Models which predict EntCH4 emissions based on DMI included: IPCC (2019), i.e., IPCCDMI; Ribeiro et al. (Reference Ribeiro, Rodrigues, Maurício, Borges, e Silva, Berchielli, Valadares Filho, Machado, Campos, Ferreira, Guimarães Júnior, Azevêdo, Santos, Tomich and Pereira2020), i.e., RibeiroDMI; Patra (Reference Patra2017), i.e., PatraDMI; and Alam et al. (Reference Alam, Schlecht and Bateki2026), i.e., AlamDMI. Those predicting EntCH4 based on GEI included: IPCC (2019), i.e., IPCCGEI; Ribeiro et al. (Reference Ribeiro, Rodrigues, Maurício, Borges, e Silva, Berchielli, Valadares Filho, Machado, Campos, Ferreira, Guimarães Júnior, Azevêdo, Santos, Tomich and Pereira2020), i.e., RibeiroGEI; and Patra (Reference Patra2017), i.e., PatraGEI. The models RibeiroDMI and RibeiroGEI were developed based on data from 11 studies involving Brazilian cattle. In these studies, CH4 emissions were measured using the SF6 tracer technique and the GreenFeed system. The models PatraDMI and PatraGEI were derived from 35 studies conducted across cattle fed tropical forage diets in India, Brazil, Australia and Zimbabwe. The model AlamDMI was derived from 28 studies conducted across cattle fed tropical forages in India. Methane measurements in these studies were done using the SF6 tracer technique and respiration chambers.
Models selected for enteric methane emission estimation in tropical regions

Note: *The model outputs are given in g CH4 per head per day, converted from the original units where necessary. DMI, dry matter intake (kg/head/day); MY, methane yield conversion factor from DMI to g CH4 (21.4 g CH4/kg DMI); Ym, CH4 conversion factor from feed GE to g CH4 (6.5% of the gross energy in feed); GEI, gross energy intake (MJ/head/day); 55.65, energy content of methane (MJ/kg CH4); 1000, converts kg CH4 to g CH4. The GEI in the IPCCGEI and RibeiroGEI models is calculated indirectly, whereas PatraGEI is based on feeding trial data.
Statistical analysis
After data extraction, statistical analysis was conducted to estimate the overall effect of dietary and regional factors on EntCH4 emissions from dairy cattle in South Asia. The one-way analysis of variance (ANOVA) and pairwise comparison were performed using R statistical software (Version: 2025.09.2+418) (RCoreTeam, 2021), which are well-suited for handling heterogeneous datasets and complex models. Each variable was tested for normality, and ANOVA was applied to assess the difference in methane emission estimates in all eight models across country (India, Pakistan and Bangladesh), Breed (Crossbred, HF, Indigenous and Sahiwal), production type (lactating, non-lactating) and milk yield group. The milk yield group was determined using a boxplot. Animals with milk yield values below the 25th percentile were classified as low yield, those between the 25th and 75th percentiles as moderate yield, and those above the 75th percentile as high yield. Least square means were calculated for all variables using the ‘emmeans’ package (Midway et al., Reference Midway, Robertson, Flinn and PeerJ2020). For creating a common comparative base, the body weight of the animals were converted to tropical livestock unit (TLU) which is equal to 250 kg of live weight. Pairwise comparisons were conducted using compact letter display from the ‘multcomp’ package (Hothorn et al., Reference Hothorn, Bretz, Westfall, Heiberger, Schuetzenmeister, Scheibe and Hothorn2016). The p-values were adjusted using the Benjamini–Hochberg false discovery rate procedure. Statistical significance was declared at p < 0.05. Agreement among the models (model performance) was tested using the concordance correlation coefficient using ‘DescTools’ (Signorell, Reference Signorell2014) and Bland–Altman analysis using base R functions. Data handling and manipulation were conducted using the ‘readxl’ package (Wickham et al., Reference Wickham, Bryan, Kalicinski, Valery, Leitienne, Colbert, Hoerl, Miller and Bryan2019), the ‘dplyr’ package (Wickham et al., Reference Wickham, François, Henry, Müller and Vaughan2023) and the ‘tidyr’ package (Wickham, Reference Wickham2014). In the absence of a reference model, the ranking was done based on a combination of ranking agreement statistics, bias and consistency across pairwise comparisons. A one-at-a-time sensitivity analysis was done to evaluate the robustness of the emission factor derived from the DMI- and GEI-based models. To perform the analysis, the baseline emission factor values were varied by ±10%. For each scenario (+10%, −10%), a one-way ANOVA was done to assess the difference among the prediction models. After ANOVA, the estimated marginal means were calculated using the ‘emmeans’ package (Midway et al., Reference Midway, Robertson, Flinn and PeerJ2020). Pairwise comparisons among models were performed, and significance was determined at p < 0.05.
Results
Estimation of enteric methane emissions for cattle
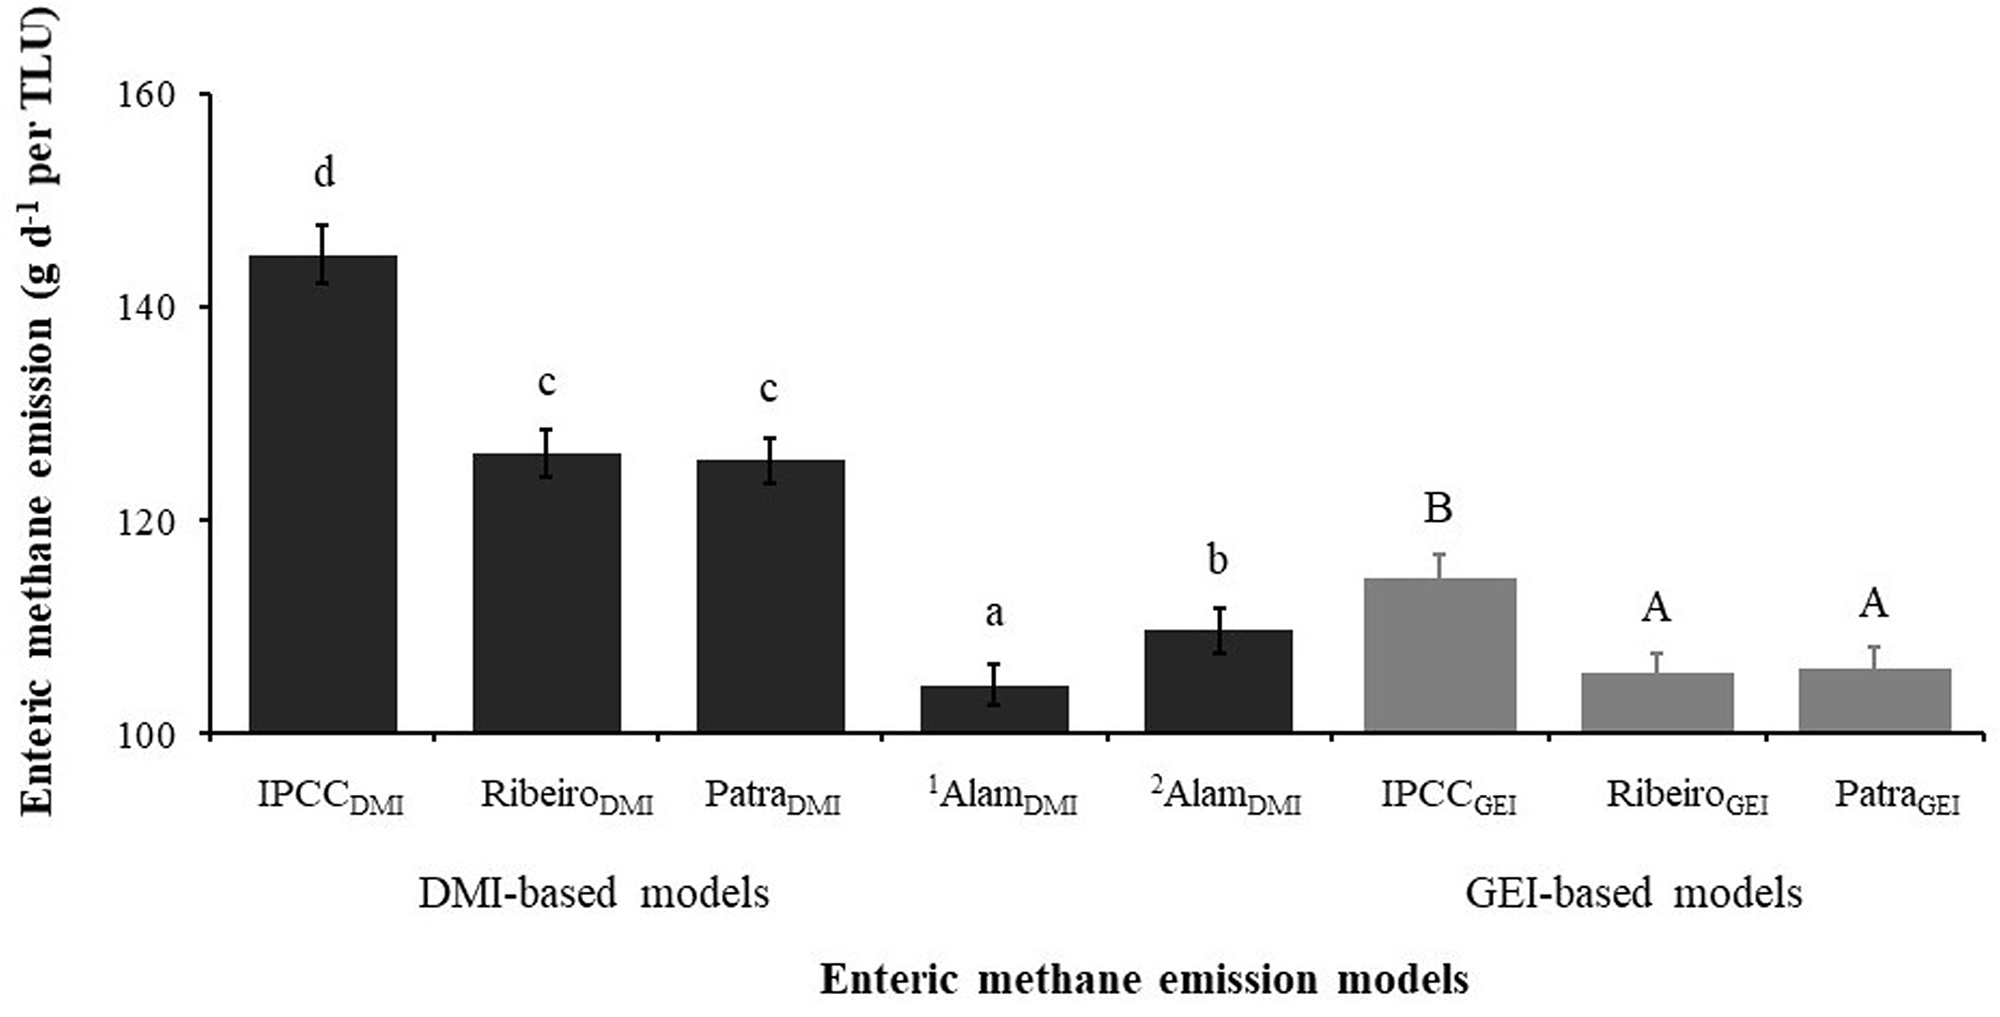
Among the DMI-based models, the IPCCDMI model gave estimates (145 g/d/TLU) that were 13% higher than the RibeiroDMI and PatraDMI models estimates (126 g/d/TLU), 21% higher than the 1AlamDMI model (110 g/d/TLU) and 32% higher than the 2AlamDMI model (105 g/d/TLU) (Fig. 2). In GEI-based models, one TLU yielded 115 g EntCH4 in a day as per the IPCCGEI model, which was 8–9 g higher than the PatraGEI model and RibeiroGEI model.
Average enteric methane emission (g/d/TLU) predicted by DMI-based and GEI-based models across feeding-trial datasets from South Asian cattle. Bars represent mean values, and error bars indicate standard errors of the mean. Different superscripts indicate significant differences among models within each group (p < 0.05); lowercase letters (a–d) refer to DMI-based models, and uppercase letters (A–B) refer to GEI-based models. TLU = 250 kg live body weight.

Estimation of enteric methane emissions: factor-wise variations
Estimation of enteric methane emissions across the countries
Noticeable variation existed in EntCH4 emission estimates across the models and countries (Table 4). Under the DMI-based IPCC model, the EntCH4 emission estimated for Pakistan (165 g/d/TLU) was 19% and 13% higher than that of India (139 g/d/TLU) and Bangladesh (146 g/d/TLU), respectively. The same scenario was found in the RibeiroDMI model, which estimated 15 g higher emission for Pakistan (137 g/d/TLU), compared to India (122 g/d/TLU). 1AlamDMI model showed sharper contrast with Pakistan (119 g/d/TLU), which was 18 and 14 g higher than India and Bangladesh, respectively. A similar pattern was also observed for the 2AlamDMI model. In the GEI-based model, the same trend was evident, where Pakistan showed consistently higher emissions than India and Bangladesh. The GEI-based IPCC model estimated 16% and 17% higher emission in Pakistan (134 g/d/TLU), compared to India and Bangladesh, respectively.
Estimation of enteric methane emissions (g/d/TLU) from cattle in India, Pakistan and Bangladesh using models based on DMI and GEI

SEM, standard error of means; tropical livestock unit (TLU), 250 kg live body weight.
Note: A, B and C indicate significant differences (p < 0.05) among prediction models within the same country (row-wise comparison) for DMI-based or GEI-based models. a, b and c indicate significant differences (p < 0.05) among countries within the same prediction model (column-wise comparison).
Across DMI-based models, EntCH4 emission estimates differed significantly among models for all three countries (Table 4). The IPCCDMI model produced the highest emissions, RibeiroDMI and PatraDMI yielded intermediate values, and the AlamDMI models generated the lowest estimates. Overall, the difference between the lowest- and highest-emitting models was approximately 28%. Across GEI-based models, EntCH4 emission estimates differed significantly among models for India. The IPCCGEI model produced the highest emissions, RibeiroDMI and PatraDMI yielded lowest estimates. Overall, the difference between the lowest- and highest-emitting models was approximately 15%.
Enteric methane emissions estimation across breeds
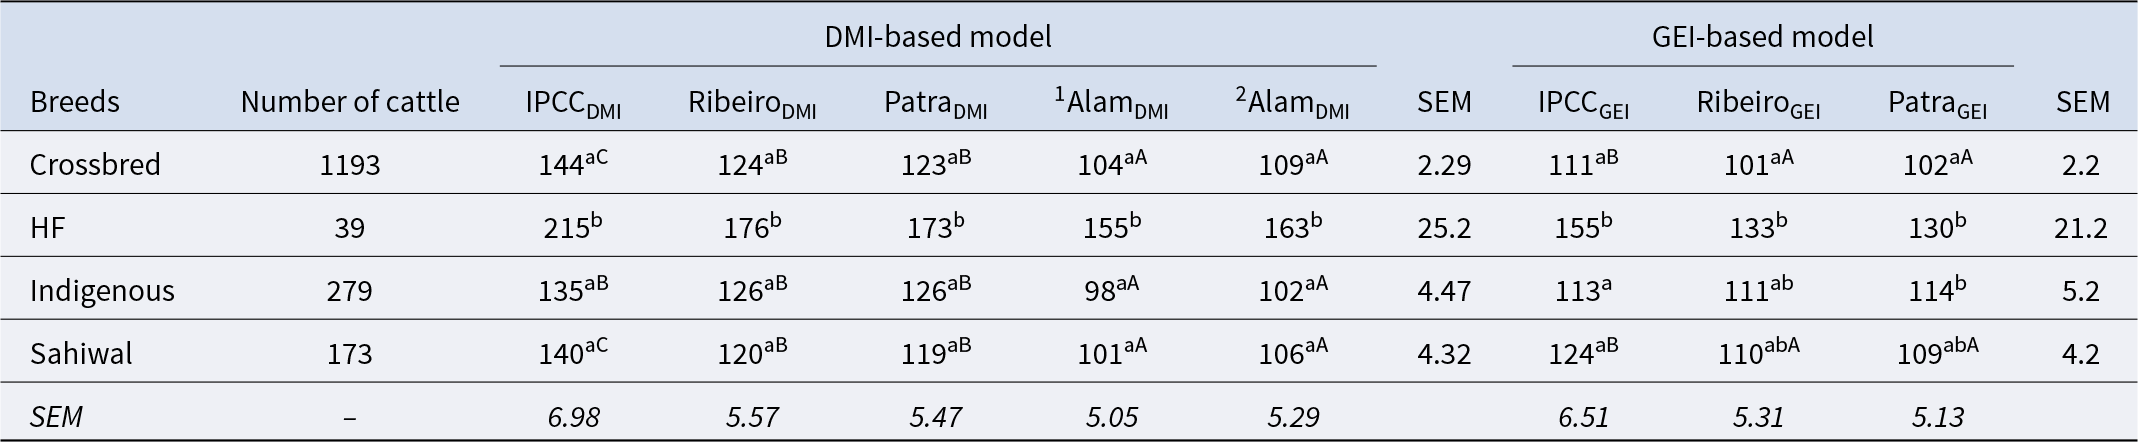
Among the breeds, HF consistently showed the highest EntCH4 emissions, and this pattern was consistent across all DMI-based and GEI-based models (Table 5). For the IPCCDMI model, emissions from HF cattle (215 g/d/TLU) were found 33%, 37% and 35% higher than that of the crossbred, indigenous and Sahiwal cattle, respectively. In the Ribeiro and Patra models, HF emitted 40–46% higher than crossbred, indigenous and Sahiwal cattle. The crossbred, indigenous and Sahiwal cattle across the DMI-based models gave similar results. For both the Alam’s models, HF emissions were found to be 33–37% higher than those of the other breeds. For the IPCCGEI model, HF emitted 71–80 g higher than other breeds. For the RibeiroGEI and PatraGEI models, HF emissions were found to be 47–56 g higher than those of the other breeds.
Estimation of enteric methane emissions (g/d/TLU) from available cattle breeds in South Asia (India, Pakistan and Bangladesh) using models based on DMI and GEI

SEM, standard error of means; tropical livestock unit (TLU), 250 kg live body weight.
Note: A, B and C indicate significant differences (p < 0.05) among prediction models within the same breed (row-wise comparison) for DMI-based or GEI-based models. a, b and c indicate significant differences (p < 0.05) among breeds within the same prediction model (column-wise comparison).
Among the DMI-based models, for crossbreds, the IPCCDMI model produced 14–28% higher emissions than RibeiroDMI, PatraDMI, 1AlamDMI and 2AlamDMI models. For Indigenous, the IPCCDMI estimates were 7–27% higher than those of the other models, and for Sahiwal, the difference was ranged from 14% to 28%. Among the GEI-based models, for crossbreds, the IPCCGEI model produced 7–9% higher emissions than the RibeiroGEI and PatraGEI models, which was 11 - 12% in Sahiwal breed.
Enteric methane emissions estimation across cattle type and production status
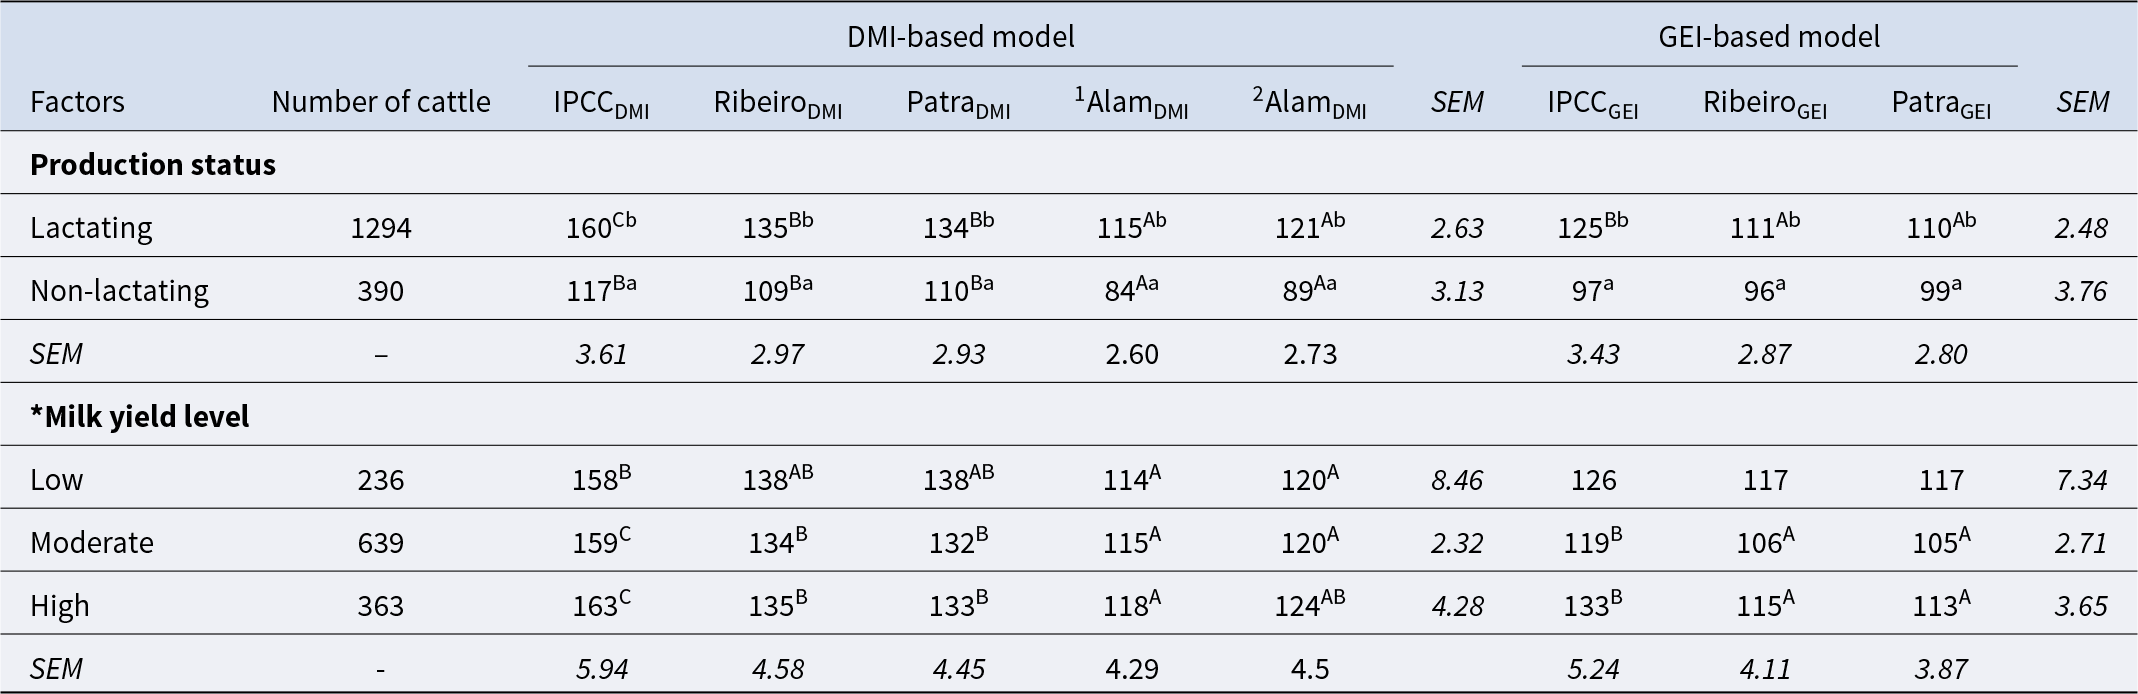
In terms of EntCH4 emissions, lactating cows emit more than non-lactating cows (Table 6). Among the DMI-based models in lactating cattle, the IPCCDMI model produced 16–28% higher emissions than RibeiroDMI, PatraDMI, 1AlamDMI and 2AlamDMI models, and for non-lactating cattle, the difference ranged from 7% to 28%. Similarly among the GEI-based models, the IPCCGEI model estimated 11–12% higher emissions in lactating cow compared to the RibeiroGEI and PatraGEI models.
Estimation of enteric methane emissions (g/d/TLU) on production status and milk yield levels using models based on DMI and GEI

SEM, standard error of means; tropical livestock unit (TLU), 250 kg live body weight.
Note: A, B and C indicate significant differences (p < 0.05) among prediction models within the same production status or milk yield level (row-wise comparison) for DMI-based or GEI-based models. a, b and c indicate significant differences (p < 0.05) between production status or milk yield level within the same prediction model (column-wise comparison).
*Milk yield level: Low milk yield ranges from 2.0 to 5.9 l of milk per cow per day, moderate milk yield ranges from 6.0 to 11.7 l of milk per cow per day and high milk yield ranges from 11.8 to 19.8 l of milk per cow per day.
Among the DMI-based models in low-yielding cattle, the IPCCDMI model produced 13–28% higher emissions than RibeiroDMI, PatraDMI, 1AlamDMI and 2AlamDMI models, and for moderate and high-yielding cattle, the difference ranged from 16% to 28% and 17% to 28%, respectively. However, RibeiroDMI and PatraDMI were statistically found similar to the IPCCDMI. Among the GEI-based models, for moderate-yielding cattle, the IPCCGEI model produced 11–12% higher emissions than the RibeiroGEI and PatraGEI models; for high-yielding cattle, the IPCCGEI model produced 14–15% higher emissions than the RibeiroGEI and PatraGEI models. No significant differences were observed among the low-, moderate- and high-yield groups within any of the models.
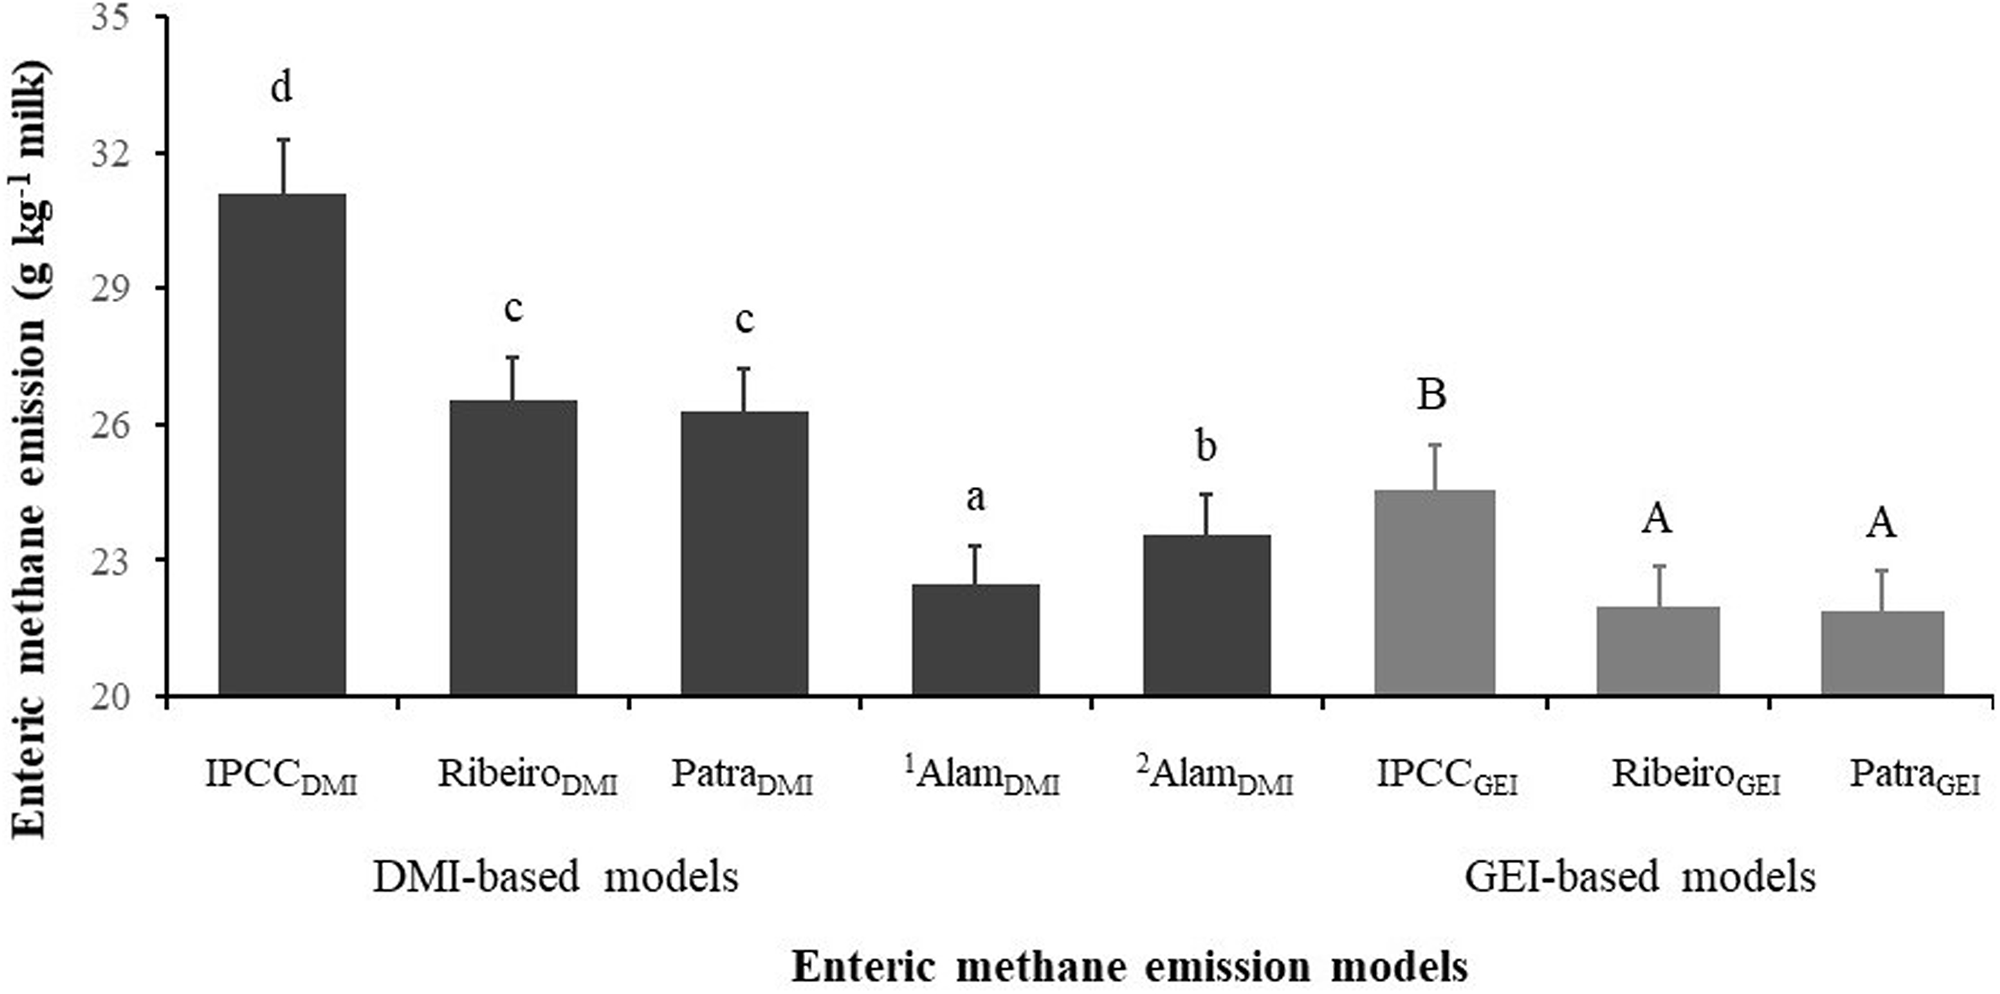
Across the DMI-based models, emissions also varied when expressed per kilogram of milk, ranging from 22.5 to 31.1 g/kg milk and, for GEI-based models, ranged from 21.9 to 24.5 g/kg milk (Fig. 3). The Ribeiro and Patra model did not show any significant difference when emission is calculated per kilogram of milk; on the contrary, the IPCC and Alam model varied significantly.
Average enteric methane emission (g/kg milk) predicted by DMI-based and GEI-based models across feeding-trial datasets from South Asian cattle. Bars represent mean values, and error bars indicate standard errors of the mean. Different superscripts indicate significant differences among models within each group (p < 0.05); lowercase letters (a–d) refer to DMI-based models, and uppercase letters (A–B) refer to GEI-based models.

Yield corrected methane emission of different cattle breeds
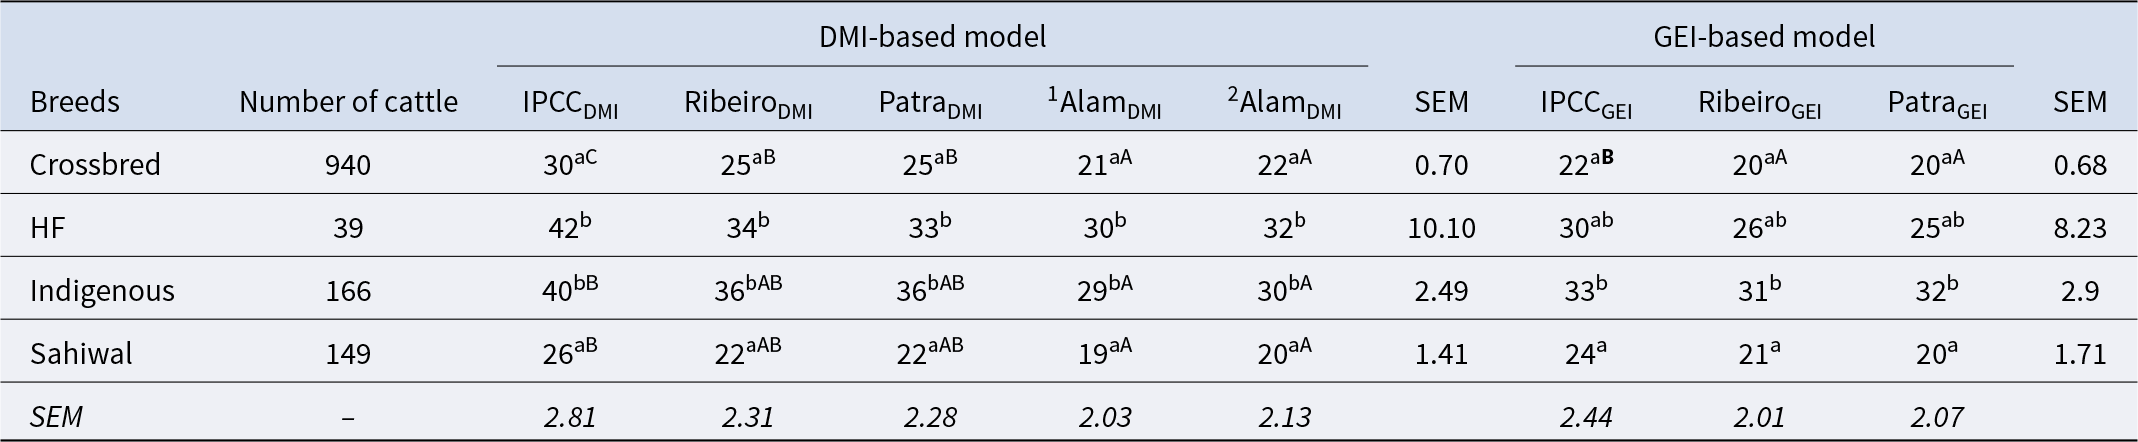
Yield-corrected enteric methane emission varied across breeds and prediction models (Table 7). DMI-based models predicted higher emissions compared to the GEI-based model. Among the breeds, HF showed higher emission across all the models; on the other hand, Shawial and crossbred showed lower values. For example, emissions ranged from 21 to 30 g/kg milk under DMI-based models and 20 to 22 g/kg milk under GEI-based models for crossbred cattle. In contrast, HF cattle showed higher values, ranging from 30 to 42 (DMI-based) and 25 to 30 (GEI-based). In general, HF cattle were significantly different from other breeds.
Enteric methane emission (g/kg milk) for different cattle breeds estimated using DMI-based and GEI-based prediction models

SEM, standard error of mean.
Note: A, B and C indicate significant differences (p < 0.05) among prediction models within the same breed (row-wise comparison) for DMI-based or GEI-based models. a, b and c indicate significant differences (p < 0.05) among breeds within the same prediction model (column-wise comparison).
Model performance
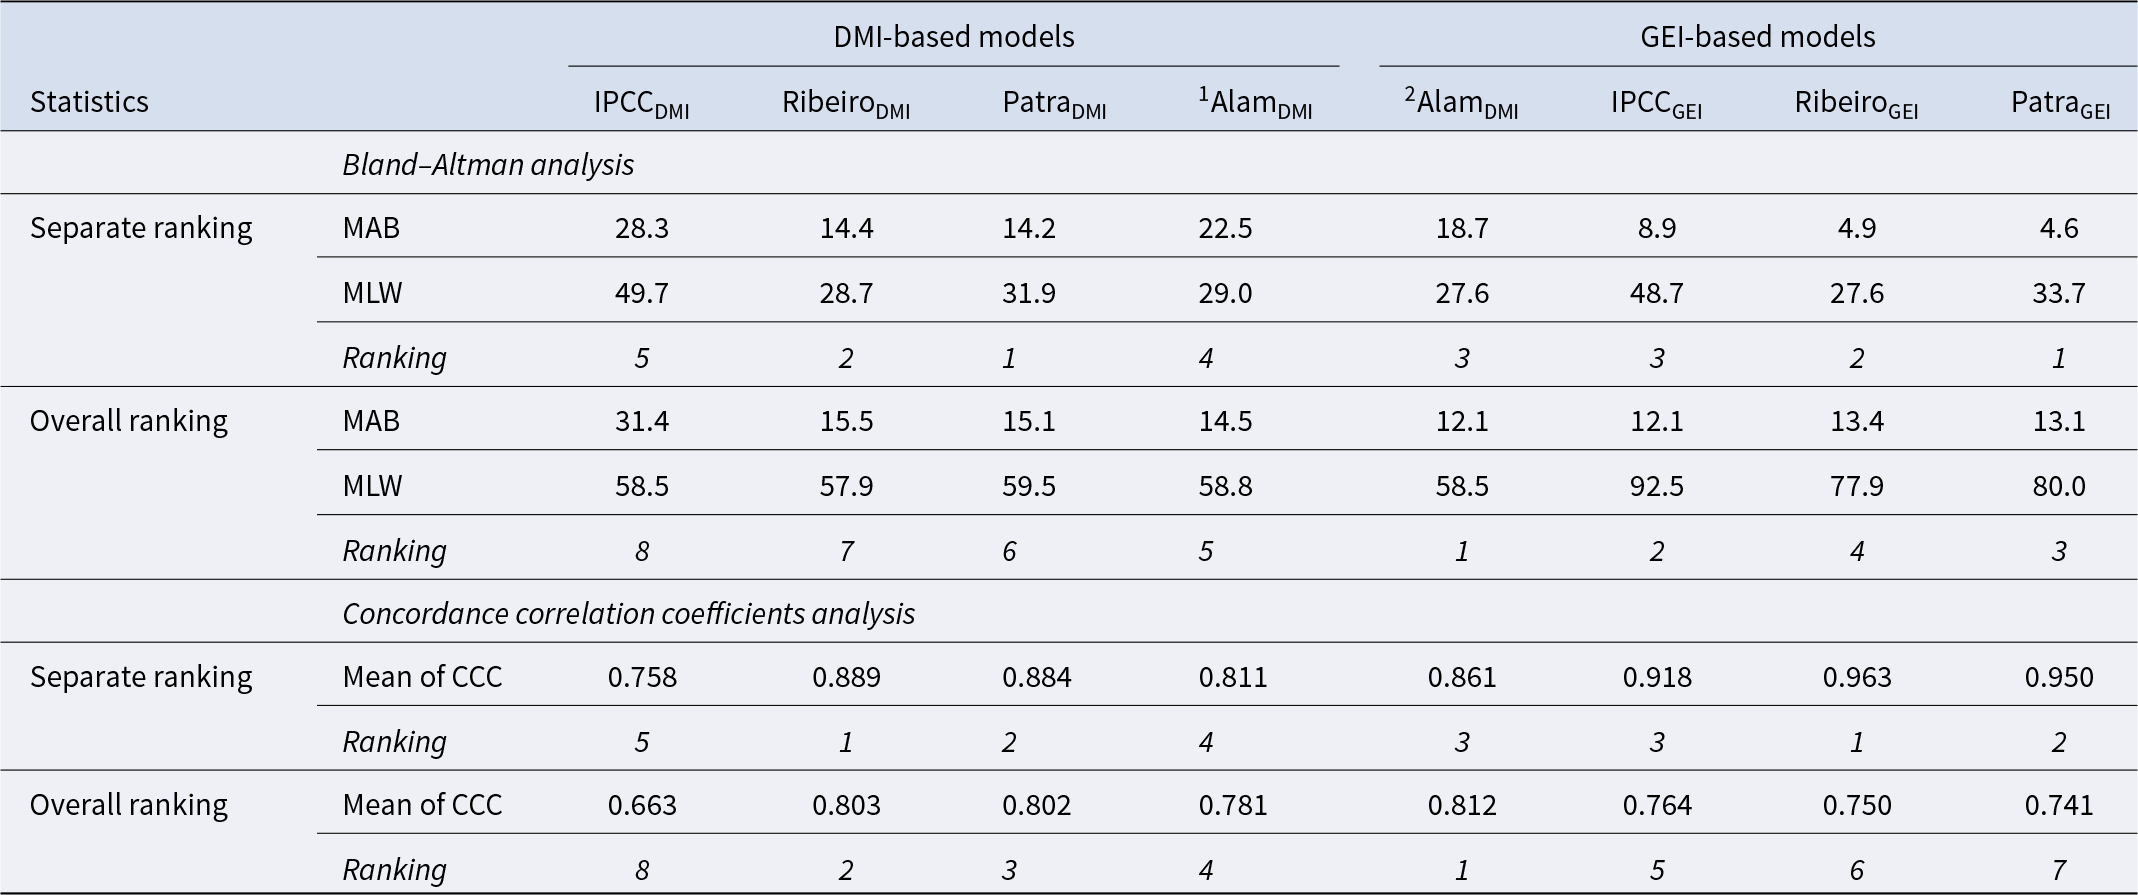
The model’s performance was ranked by Bland–Altman and CCC analysis (Table 8). In both cases, the Ribeiro and Patra model performs better than the IPCC, and Alam model holds the top performing position. However, the Alam model showed a consistent and moderate performance. IPCC models tend to overestimate methane emissions and hold the lowest performing position in the case of tropical regions.
Performance comparison of enteric methane prediction models based on DMI and GEI, using Bland–Altman statistics (mean absolute bias: MAB, mean width of the limits of agreement: MLW) and concordance correlation coefficients (CCC)

Sensitivity analysis
Sensitivity analysis using ±10% sample variation confirmed that the overall comparative pattern among emission factor models was robust (Table 9). In all scenarios, IPCC-based estimates remained the highest, while Alam-based models consistently provided the lowest emissions. Patra and Ribeiro models remained statistically comparable across scenarios. However, the distinction between the two Alam DMI-based formulas was sensitive to sample variation: while the original dataset indicated a significant difference between 1AlamDMI and 2AlamDMI, the ±10% scenarios grouped both Alam models, suggesting that their difference is not stable under moderate sample perturbation. Overall, the sensitivity assessment supports the robustness of the main conclusions, while indicating uncertainty regarding the relative performance between the two Alam variants.
Baseline model estimates and sensitivity analysis (±10%) of enteric methane emission factors (per TLU) predicted using DMI-based and GEI-based models

SEM, standard error of mean.
Note: A, B and C indicate significant differences (p < 0.05) among prediction models across rows within the DMI-based models. a, b and c indicate significant differences (p < 0.05) among prediction models across rows within the GEI-based models.
Discussion
Factors influencing model estimates and emission patterns
The tendency of the IPCCDMI model to show higher EntCH4 emissions compared to other models likely stems from the methane yield value recommended for South Asia in the 2019 IPCC refinement (21.4 g/kg DMI). This default value is substantially higher than the methane yields reported for cattle in South Asian countries, which typically range from 9.47 to 17.37 g/kg DMI (Nampoothiri et al., Reference Nampoothiri, Mohini, Malla, Mondal and Pandita2018; Leitanthem et al., Reference Leitanthem, Chaudhary, Maiti, Mohini and Mondal2023; Reddy et al., Reference Reddy, Chaturvedi, Chaudhary, Kala and Thamizhan2023). Such differences probably reflect contrasts in diet quality and composition, animal performance and the conversion factors used in developing regional versus IPCC default estimates (Appuhamy et al., Reference Appuhamy, France and Kebreab2016; Niu et al., Reference Niu, Kebreab, Hristov, Oh, Arndt, Bannink, Bayat, Brito, Boland, Casper, Crompton, Dijkstra, Eugène, Garnsworthy, Haque, Hellwing, Huhtanen, Kreuzer and Kuhla2018; IPCC, 2019). The higher estimates from the IPCCGEI model likely arise from the default methane conversion factor (Ym) and the generalized assumptions used to estimate GEI (IPCC, 2019). The IPCC defaults were developed mainly from datasets dominated by temperate production systems, where diet quality and intake levels are typically higher. When applied to South Asian conditions, these values might overestimate both GEI and the proportion of energy lost as methane, leading to higher predicted emissions than those generated by the RibeiroGEI and PatraGEI models.
Country-level emissions were about 19% higher in Pakistan than in India and Bangladesh, which may be partly explained by differences in TLU, DMI and GEI among countries (Table S1). Nutritional differences among commonly used feedstuffs may also contribute to this variation. Although India, Pakistan and Bangladesh rely on similar feeds – such as Napier and maize grasses and crop residues (e.g., rice and wheat straw) – their nutrient composition varies markedly. For example, CP and NDF contents range from 6.0% to 9.5% and 56% to 72% in Pakistan (Hussain et al., Reference Hussain, Mufakhirah and Durrani2009; Hanif and Akhtar, Reference Hanif and Akhtar2020), 6.1% to 9.1% and 50% to 66% in India (Das et al., Reference Das, Kundu, Kumar and Datt2015; Singh et al., Reference Singh, Singh, Koli, Anele, Bhadoria, Choudhary and Ren2023) and 3.5% to 6.0% and 65% to 77% in Bangladesh (Rahman et al., Reference Rahman, Alam, Amin and Das2010; Selim et al., Reference Selim, Hasan, Rahman, Rahman, Islam, Bostami, Islam and Tedeschi2022), respectively. Such variation in diet quality likely influences both intake and methane yield, contributing to the observed differences in emissions across countries.
Beyond the quantity of feed and its nutrient composition, breed also plays an important role in EntCH4 emissions. Even when animals receive similar diets, genetic differences among breeds can influence feed utilization and rumen fermentation, leading to variation in emission output (Münger and Kreuzer, Reference Münger and Kreuzer2006). Emissions are further affected by production status, with differences between lactating and non-lactating cattle, and by milk-yield level, where low-, moderate- and high-producing cows exhibit distinct metabolic demands that shape intake and emissions (Ulyatt et al., Reference Ulyatt, Lassey, Shelton and Walker2002; Kennedy et al., Reference Kennedy, Lahart, Herron, Boland, Fleming and Egan2024; Starsmore et al., Reference Starsmore, Lopez-Villalobos, Shalloo, Egan, Burke and Lahart2024). In our study, HF cattle emitted 40–60% more than the other breeds. This pattern appears to be linked to their higher productivity and intake, as HF animals had 33–37% greater DMI per TLU, 20–28% higher GEI per TLU and 17–45% higher milk yield per TLU (Table S1). Across the breeds, emissions were also found to be higher in HF cows when the emissions were calculated per kilogram of milk (Table 7). This result should, however, be interpreted with caution, as the number of HF observations was smaller than that for the other breeds, which may have influenced the estimates.
Enteric methane emission varies significantly when expressed per kilogram of milk (Fig. 3). The DMI-based model showed greater variation than the GEI-based models. These patterns are consistent with previous evidence that well-adapted indigenous cattle generally emit less methane than exotic breeds, reinforcing the role of genotype and environmental adaptation in shaping emission profiles (Shi et al., Reference Shi, Ma, Mi, Yang, Jing, Yang, He, Li, Pinares-Patino, Samuels, Li, Ma and Long2025).
Estimates for lactating cattle from India ranged from 110 to 160 g/d/TLU across both DMI- and GEI-based models (Table 6). These values are broadly comparable with emissions measured directly using the SF₆ tracer technique, which was 129–151 g/d/TLU for a similar production system reported by Garg et al., (Reference Garg, Sherasia, Phondba and Hossain2014). For non-lactating cattle, however, the modelled estimates (96–117 g/d/TLU) were slightly higher than the values obtained from respiration chamber (85–101 g/d/TLU) studies by Sherasia et al. (Reference Sherasia, Pandya, Parnerkar, Prajapati and Murty2018), possibly reflecting differences between experimental conditions and field situations. Unfortunately, due to the unavailability of direct measurement data from Bangladesh and Pakistan, similar validation could not be conducted for those countries. When emissions were compared across milk-yield level, no significant differences were detected among low-, moderate- and high-yielding cows, although the high-yield group showed numerically greater emissions. A similar pattern was reported by Reichenbach et al. (Reference Reichenbach, Mech, Pinto, Malik, Bhatta, König and Schlecht2023).
Model performance in the absence of direct measurements
Without direct emission measurements-particularly for Bangladesh and Pakistan-true validation of model efficiency and accuracy is not feasible. Nevertheless, the consistent pattern observed in this study, with IPCC models overestimating emissions by approximately 7–28% compared with the Alam models across different factors, demonstrates that the Alam models are more appropriate for nationwide estimation in these countries. This interpretation is also supported by the fact that the Alam equations were developed using feeding-trial data from Indian dairy systems (Alam et al., Reference Alam, Schlecht and Bateki2026). However, it should be acknowledged that part of our dataset overlapped with the studies used to develop some of the models (approximately 27% overlap for the Patra model and 46% for the Alam models). This overlap may introduce bias, as the models are being evaluated using data that are similar to those employed during their calibration. Due to the absence of direct measurement data, model performance was further assessed through comparison of the models themselves using Bland–Altman and concordance analyses (Table 8). These comparisons provide additional insight into relative model behaviour where direct validation is not feasible.
Limitations
Despite the breadth of the dataset, several limitations should be acknowledged. Most feeding-trial studies originated from India, whereas data from Bangladesh and Pakistan were comparatively scarce, which may affect cross-country comparisons. In addition, many trials did not report key variables, such as feed digestibility, forage-to-concentrate ratios, or management practices, all of which can influence methane emissions. Some models also required inputs (e.g., GE intake) that were not consistently available and, therefore, had to be estimated, introducing additional uncertainty. Finally, because direct measurement data were lacking, the model rankings derived from Bland–Altman and concordance analyses should be viewed as indicative rather than definitive.
Conclusions
This study demonstrates that estimates of EntCH4 emissions for South Asian cattle vary substantially depending on the prediction model applied. Dry matter intake-based equations developed by IPCC consistently produced the highest values, whereas tropical-calibrated models such as Alam and Patra generated more moderate and biologically realistic estimates. Emissions also differed across countries, breeds and production levels, and even varied when expressed per kilogram of milk, underscoring the influence of both animal and production system characteristics.
Compared with DMI-based approaches, GEI-based models showed greater stability and less dispersion, indicating their suitability where reliable energy-intake data are available. Overall, the results suggest that temperate-derived IPCC default equations tend to overestimate methane emissions in South Asian low-input cattle farming systems. Adopting region-specific or tropical-calibrated models, therefore, appears essential for improving the accuracy of national greenhouse gas inventories and for guiding more effective, locally relevant mitigation strategies in the region.
Supplementary material
The supplementary material for this article can be found at https://doi.org/10.1017/S0022029926102374.
Competing interests
The authors have declared that, to their knowledge, there are no competing financial interests or any other personal relations that could have emerged to influence the result reported in this paper.
Author contributions
G.H.: Methodology, Software, Visualization, Investigation, Formal analysis, Data curation, Writing – original draft. S.A.: Conceptualization, Visualization, Methodology, Investigation, Software, Formal analysis, Data curation, Validation, Writing – review & editing. A.I.: Data curation, Writing – review & editing. M.A.S.: Data curation, Writing – review & editing. I.J.: Data curation, Writing – review & editing. M.A.S.K.: Supervision, Validation, Writing – review & editing. M.A.I.: Conceptualization, Methodology, Supervision, Validation, Writing – review & editing.
Declaration of generative AI and AI-assisted technologies in the writing process
AI and AI-supported tools were used only to correct English words, but have no role in any other part of the study.
Data availability
All the data used for this study can be accessed via https://doi.org/10.25625/XJFBV9.




 Open access

