

Introduction
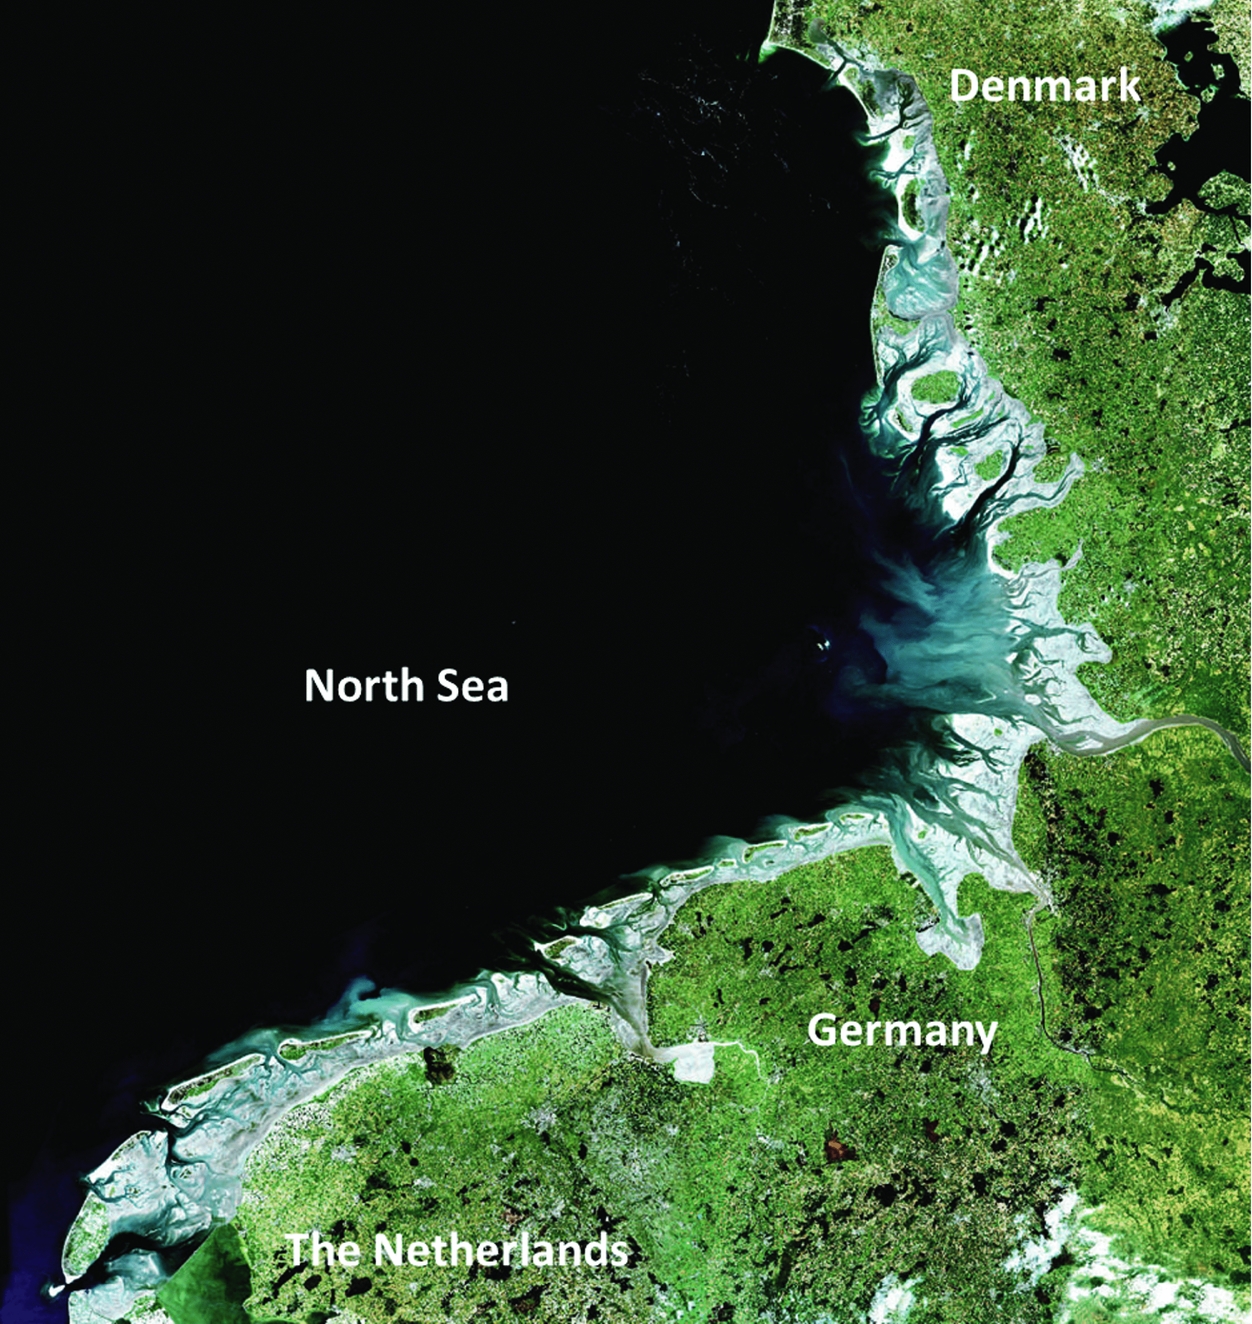
The Wadden Sea, extending from the Netherlands to Denmark, contains the largest coherent tidal flat area in the world (Fig. 1). The conservation of this unique tidal landscape of high ecological value is under pressure of climate change and human activities (see e.g. CPSL, 2001, 2005, 2010; Deltacommissie, 2008; Kabat et al., Reference Kabat, Jacobs, Hutjes, Hazeleger, Engelmoer, Witte, Roggema, Lammerts, Bessembinder, Hoekstra and Van den Berg2009; Schüttenhelm, Reference Schüttenhelm2017). Knowledge of the future development of the Wadden Sea system is of vital importance for the management of the system, concerning flood defence strategy, regulation of gas and salt mining and environmental protection.
The Wadden Sea (based on picture from www.waddensea-secretariat.org).
Historically, the morphological development of the Wadden Sea system has been closely related to sea-level rise (SLR). This system, consisting of barrier islands separated by tidal inlets and back-barrier basins with channels, tidal flats and salt marshes, formed after c.7000 years ago under the influence of a rising sea level. The development of back-barrier basins is determined by the balance between sediment accretion (depending on sediment import from the North Sea) and the rate of relative SLR (Nichols, Reference Nichols1989). Beyond a critical rate of relative SLR, sediment import becomes insufficient for the seabed to follow the rising sea level, resulting in drowning of the basins (Stive et al., Reference Stive, Roelvink, De Vriend, Louisse, Stive and Wiersma1990; Van der Spek & Beets, Reference Van der Spek and Beets1992; Van Goor et al., Reference Van Goor, Zitman, Wang and Stive2003; Deltacommissie, 2008; Carrasco et al., Reference Carrasco, Ferreira and Roelvink2016). It is anticipated that worldwide SLR will accelerate, although exact rates are still uncertain; values between 0.30 and 3m until 2100 have been presented in the literature (Meehl et al., Reference Meehl, Stocker, Collins, Friedlingstein, Gaye, Gregory, Kitoh, Knutti, Murphy, Noda, Raper, Watterson, Weaver, Zhao, Solomon, Qin, Manning, Chen, Marquis, Averyt, Tignor and Miller2007; Church et al., Reference Church, Clark, Cazenave, Gregory, Jevrejeva, Levermann, Merrifield, Milne, Nerem, Nunn, Payne, Pfeffer, Stammer, Unnikrishnan, Stocker, Qin, Plattner, Tignor, Allen, Boschung, Nauels, Xia, Bex and Midgley2013; KNMI 2017; Le Bars et al., Reference Le Bars, Drijfhout and De Vries2017). In addition to global sea-level changes, local sea-floor subsidence due to gas and salt extraction can aggravate the changes. In the eastern part of the Dutch Wadden Sea, an extra subsidence of 0.32m by 2050 due to gas extraction is expected (Hoeksema et al., Reference Hoeksema, Mulder, Rommel, De Ronde and De Vlas2004).
More recently, the morphological development of the Dutch Wadden Sea system has also been strongly influenced by human activities (Oost, Reference Oost1995; Elias et al., Reference Elias, Van der Spek, Wang and De Ronde2012). Closure of the Zuiderzee with a dam (completed in 1932) still influences the development of the western part (Elias, Reference Elias2006; Elias et al., Reference Elias, Van der Spek, Wang and De Ronde2012). Land subsidence due to gas and salt mining (Fokker et al., Reference Fokker, Van Leijen, Orlic, Van der Marel and Hanssen2018) already results in a high rate of relative SLR in some of the Wadden Sea basins. Sand nourishment along the North Sea coasts of the majority of the barrier islands since 1990, to ensure the long-term safety against flooding, introduces an artificial sediment supply to the system. This additional sediment source could have influenced the morphological development so far (Van der Spek & Lodder, Reference Van der Spek, Lodder, Wang, Rosati and Cheng2015; Elias & Van der Spek, Reference Elias and Van der Spek2017) and may have an increasing impact in the future as larger nourishment volumes are most likely needed. In the last century, local human activities have been more important than SLR in driving the morphological development of the Dutch Wadden Sea system (Elias et al., Reference Elias, Van der Spek, Wang and De Ronde2012).
Future morphological development cannot be predicted without considering the impact of human activities, both in the past and in the future. In contrast to climate change and the associated acceleration in SLR, local human activities cannot be considered purely external driving forces for the morphological development. Instead, they should be considered an interacting factor within the system. Human activities influencing the morphological development also depend on the morphological development. For example, the present measurement-and-control protocol that regulates gas and salt mining in the Dutch part of the Wadden Sea is based on the principle that the total relative SLR rate, i.e. the SLR rate plus the basin-averaged rate of land subsidence caused by gas and/or salt mining, must stay within a certain limit (‘Hand on the Tap’ principle; see De Waal et al., Reference De Waal, Roest, Fokker, Kroon, Muntendam-Bos, Oost and Van Wirdum2012). This limit rate is based on the (maximum) long-term average sedimentation rates in the Wadden Sea basins. Another example is the amount of sand nourishment for maintaining the North Sea coast of the barrier islands, which is, amongst other things, determined by the sand transport between the North Sea and the Wadden Sea.
The interaction between the morphological development and human activities complicates the prediction of future geomorphological states. However, these morphological predictions are necessary since human action will be essential to guarantee safety against flooding, protect natural values and optimise economic use. The recent worldwide concern about acceleration of SLR and the ongoing discussions on gas and salt mining in the Dutch Wadden Sea also make these predictions urgent.
In this paper, projections are given for the future morphological state of the Dutch Wadden Sea in the years 2030, 2050 and 2100. The projection method used is based on a review of the observed morphodynamic development and sediment budgets, analysis of the underlying physical processes and mechanisms and morphodynamic modelling. The projection method contains two elements: critical rate of SLR for drowning and a way to evaluate loss of intertidal flat area based on the rise of low water level. Finally, critical knowledge gaps and suggestions for future research on this subject are presented.
The Wadden Sea system
The Wadden Sea is a unique coastal wetland, consisting of an uninterrupted stretch of tidal flats and barrier islands that span a distance of nearly 500km along the northern coasts of the Netherlands and the North Sea coast of Germany and Denmark (Fig. 1). SLR has been a primary driver in the formation of the present-day Wadden Sea. Over a period of more than 7000 years a wide variety of barrier islands, channels, sand and mud flats, gullies and salt marshes formed under a temperate climate, rising sea level and, especially during the last century, human interventions. However, (accelerated) SLR may threaten the Wadden Sea's future sustainability. Field observations suggest that some systems remain stable as sediment import and tidal-flat and salt marsh accretion can keep pace with certain rates of relative SLR (Nichols, Reference Nichols1989; Van der Spek & Beets, Reference Van der Spek and Beets1992; Canon et al., Reference Canon, French, Spencer, Reed, Möller, Pye and Allen2000; Morris et al., Reference Morris, Sundareshwar, Nietch, Kjerfve and Canon2002; Madsen et al., Reference Madsen, Murray, Andersen and Pejrup2007; Bartholdi et al. Reference Bartholdi, Bartholdi and Kroon2010), while other systems degrade and finally drown (Kentish, Reference Kentish2001; Van Wijnen & Bakker, Reference Van Wijnen and Bakker2001).
A general understanding of the Wadden Sea system adapting to sea-level rise
Valuable lessons on the effects of SLR on the natural system can be learned from the past, as the formation and subsequent evolution of tidal basins under the influence of rising sea levels largely determined the Holocene evolution of the Dutch coast (Zagwijn, Reference Zagwijn1986; Van der Spek, Reference Van der Spek1994, Reference Van der Spek, Flemming and Bartholomä1995; Beets & Van der Spek, Reference Beets and Van der Spek2000; Vos, Reference Vos2015; Pierik et al., Reference Pierik, Cohen, Vos, Van der Spek and Stouthamer2017). Several cycles of marine ingression and subsequent basin sedimentation, and sufficient sediment supply to retain or even prograde the coastline due to the presence of major sediment sources, finally filled in the entire western part of the Dutch coastal plain. Van der Spek (Reference Van der Spek1994) summarises: rising sea levels and/or land-surface subsidence create storage potential in the coastal plain, leading to ingression by the sea. Available accommodation space induces net landward sediment transport and basin infilling. Erosion of the adjacent shorelines contributed significantly to the sediment supply, leading to landward retreat of the entire barrier–inlet-basin system with conservation of its basic characteristics (see e.g. Van Straaten, Reference Van Straaten, Swennen, De~Wilde and Haeck1975; Flemming & Davis, Reference Flemming and Davis1994; Flemming & Bartholomä, Reference Flemming and Bartholomä1997). Sediment supply along the Wadden Sea was sufficient to retain the extensive systems of tidal flats and salt marshes over the past 7000 years, but insufficient to fill in the basin completely (see e.g. Beets & Van der Spek, Reference Beets and Van der Spek2000; Van der Molen & Van Dijck, Reference Van der Molen and Van Dijck2000).
In this simple conceptual model, the long-term development of barrier island – back-barrier basin systems like the Wadden Sea depends highly on this balance between change in accommodation space and sediment supply. An abundant supply will lead to infilling of the basins and even progradation of the coast (Nichols, Reference Nichols1989). A deficient sediment supply will prevent infilling of the basins and will lead to landward shift of the coastal system with relative SLR. Such a model is not only applicable to systems in their natural state, but is also applicable in the Anthropocene, when human activity starts to have a dominant influence on climate and environment.
From the Middle Ages onward, dyke construction along the mainland, (partial) damming of estuaries and the building of closure dams (Oost, Reference Oost1995; Van der Spek, Reference Van der Spek, Flemming and Bartholomä1995; Elias & Van der Spek, Reference Elias and Van der Spek2006) fixed the basin dimensions, and eventually, after the closures of the Zuiderzee and Lauwerszee, the Dutch Wadden Sea as we know it today was formed. On the seaward side, the barrier islands are effectively kept in place by hard structures at some of the island tips and the coastal policy of Dynamic Preservation. This policy prescribes that the North Sea coastlines of the barrier islands may not retreat landward of a reference line that is based on their 1990 position (Van Koningsveld & Mulder, Reference Van Koningsveld and Mulder2004). As the basin and barrier dimensions are basically fixed in position, the effects of SLR now have to be resolved within the fixed dimensions of the Wadden Sea. The historically observed roll-over mechanisms of landward barrier and coastline retreat in case of sediment deficit (Van Straaten, Reference Van Straaten, Swennen, De~Wilde and Haeck1975; Flemming & Davis, Reference Flemming and Davis1994; Flemming & Bartholomä, Reference Flemming and Bartholomä1997) cannot be sustained. Net sediment import through the tidal inlets and sediment delivery onto the tidal flats need to be at least equal to the relative SLR, in order to maintain the intertidal morphology. In reality the net sediment import needs to exceed these rates as sediments are still needed to compensate for the effects of human intervention and in particular for the closure of the Zuiderzee (Elias et al., Reference Elias, Van der Spek, Wang and De Ronde2012). As sediments can only be imported through the tidal inlets, the sediment transport capacity into the basin plays an important role. Even with ample supply of sediment, an insufficient sediment transport capacity will eventually lead to drowning of the system.
Observations – the present-day Wadden Sea (1927–2015)
Based on the research carried out within the framework of the Coastal Genesis Programme (research project Kustgenese; see e.g. Stive & Eysink, Reference Stive and Eysink1989), Stive et al. (Reference Stive, Roelvink, De Vriend, Louisse, Stive and Wiersma1990) concluded that the Dutch Wadden Sea imports sediment from the North Sea coast. This conclusion is mainly based on a conceptual model for the long-term development of the Dutch coastal system under the influence of SLR: ‘A characteristic feature of the Wadden Sea region is its continuous sedimentation of the tidal flats in order to keep pace with relative SLR, and its siltation along the Wadden shores. These processes are responsible for an important influx of sand, which is basically delivered by the adjacent coastal system. This is the cause of a structural retreat of the Wadden island shores.’ Stive et al. (Reference Stive, Roelvink, De Vriend, Louisse, Stive and Wiersma1990) thus identified the Wadden Sea as a major sediment sink in the Dutch coastal system and they ascribe this as an effect of the relative SLR based on consideration of the very long (geological) timescale.
General setting
Figure 2 provides a clear overview of the tidal inlets and basins that form the present-day Dutch Wadden Sea (from left to right Texel inlet (1), Eierlandse Gat Inlet (2), Vlie Inlet (3), Ameland Inlet (4), Frisian Inlet (5), Groninger Wad (6) and the Ems–Dollard Estuary (7)). With the exception of the Ems–Dollard Estuary, the inlets comprise relatively large ebb-tidal delta shoals and narrow and deep inlet channels that are connected to extensive systems of branching channels, tidal flats and salt marshes in the back-barrier basins. The back-barrier area of the eastern part (Ameland Inlet, Frisian Inlet and Groninger Wad) is relatively narrow and shallow, with comparatively large tidal-flat areas and small channels; the ratio of intertidal area versus total surface area varies between 0.6 and 0.8 (Stive & Eysink, Reference Stive and Eysink1989). In the western part, the basins are wider and the ratios of intertidal area versus total surface area are 0.3–0.4. Tidal divides between the basins are formed where the tidal waves travelling through two adjacent inlets meet and sedimentation due to near-zero velocities results in tidal-flat accretion (Fig. 2). These tidal divides are often considered to form the boundaries of the separate inlet systems and are located somewhat eastward of the centre of the barrier islands due to the differences in tidal amplitude between the neighbouring inlets (Wang et al., Reference Wang, Vroom, Van Prooijen, Labeur and Stive2013) and the prevailing eastward wind direction (FitzGerald, Reference FitzGerald1996). These tidal divides are useful to partition the Wadden Sea into smaller basins, but model studies (e.g. Duran-Matute et al., Reference Duran-Matute, Gerkema, de Boer, Nauw and Gräwe2014) illustrate that net flow is present between the individual basins and may be larger than commonly assumed.
Changes in channels and shoals in the Dutch Wadden Sea over the period 1927–2016. Upper panel: Bathymetry representative for the 1927–1935 time frame (prior to closure of the Zuiderzee). Middle panel: Recent bathymetry based on surveys over the years 2011–2016. Lower panel: Sedimentation–erosion pattern over the interval 1927–2016.

The tidal flats are mainly composed of sand (~90%; grain size 0.15–0.20mm) and fine-grained muddy sediments (~10%), with decreasing grain-size diameters away from the inlet (Van Straaten, Reference Van Straaten1961; De Glopper, Reference De Glopper1967; Flemming & Ziegler, Reference Flemming and Ziegler1995; Nyandwi, Reference Nyandwi, Alexander, Davis and Henry1998; Bartholomä & Flemming, Reference Bartholomä and Flemming2007) due to the settling lag effects of suspended sediments (Van Straaten & Kuenen, Reference Van Straaten and Kuenen1957; Postma, Reference Postma1961; Groen, Reference Groen1967). The ebb-tidal deltas primarily consist of sand (0.10–0.40mm). Similar sand is found in the channels within the basins.
Both tides and waves play an important role in shaping and maintaining the Wadden system. In general, following the classification of Davis & Hayes (Reference Davis and Hayes1984), the inlets of the Dutch Wadden Sea qualify as mixed-energy wave-dominated, even under spring-tide conditions. The mean tidal range increases from 1.4m in the southwest at Den Helder to 2.5m in the east at the Eems–Dollard, and continues to increase eastwards. The tidal processes of flooding and draining are the driving force for the fractal channel patterns in the basin (Cleveringa & Oost, Reference Cleveringa and Oost1999; Marciano et al., Reference Marciano, Wang, Hibma and De Vriend2005).
The North Sea wave climate mainly consists of locally generated wind waves with an average significant wave height of 1.37m and corresponding peak wave period of c.7s.
Tide gauge measurements over the last 120 years reveal a fairly constant average increase of the mean sea level (MSL) of 0.20m per century along the entire Dutch coast (Deltacommissie, 1960; Baart et al., Reference Baart, Van Gelder, de Ronde, Van Koningsveld and Wouters2012).
Morphodynamic changes
On a geological timescale the Wadden Sea is still a young landscape, being formed over a period of around 7000 years. Under a temperate climate, a rising sea level and, especially during the last century, human interventions, the individual inlets and basins with their distinct channels and shoals have been formed. Since the Middle Ages, anthropogenic activities have started to increasingly influence the natural dynamics. Rising sea levels, but also land subsidence due to peat compaction, excavation and drainage for agricultural use, may have played an important role in the formation and expansion of the western part of the Wadden Sea and Texel Inlet. Dyke construction and reclamation of flooded areas began around the 10th century, intensified in the 16th century, and with the closures of the Zuiderzee (completed in 1932) and Lauwerszee (1969), the Wadden Sea as we know it today was formed (see Oost, Reference Oost1995; Van der Spek, Reference Van der Spek, Flemming and Bartholomä1995; Elias & Van der Spek, Reference Elias and Van der Spek2006; Elias et al., Reference Elias, Van der Spek, Wang and De Ronde2012).
Especially the closure of the Zuiderzee has had an important effect on the morphological changes in the western Wadden Sea and the sediment budget as a whole (Fig. 2). A detailed overview of the morphological changes over the 1935–2005 time frame was presented by Elias et al. (Reference Elias, Van der Spek, Wang and De Ronde2012). The addition of more recent measurements to provide the sediment budget through 2012 (Figs 2 and 3; based on the volumes presented in Nederhoff et al., Reference Nederhoff, Smits and Wang2017) does not alter the main findings. In the section below we summarise the findings of the 2012 study, but volumes are updated to reflect the most recent values.
Computed volume changes of (A) the individual tidal inlets (md: Texel Inlet; eld: Eierlandse Gat Inlet; vlie: Vlie Inlet; ame: Ameland Inlet; frz: Frisian Inlet) and (B) the western (westwad), eastern (eastwad) and total Wadden Sea (totwad), based on Nederhoff et al. (Reference Nederhoff, Smits and Wang2017). The dashed lines indicate the volumes presented by Elias et al. (Reference Elias, Van der Spek, Wang and De Ronde2012). Bottom panels (C): Hypsometric curves for (left to right) the Dutch Wadden Sea as a whole and its western and eastern part (upper row) and blow-ups of their intertidal parts (lower row).
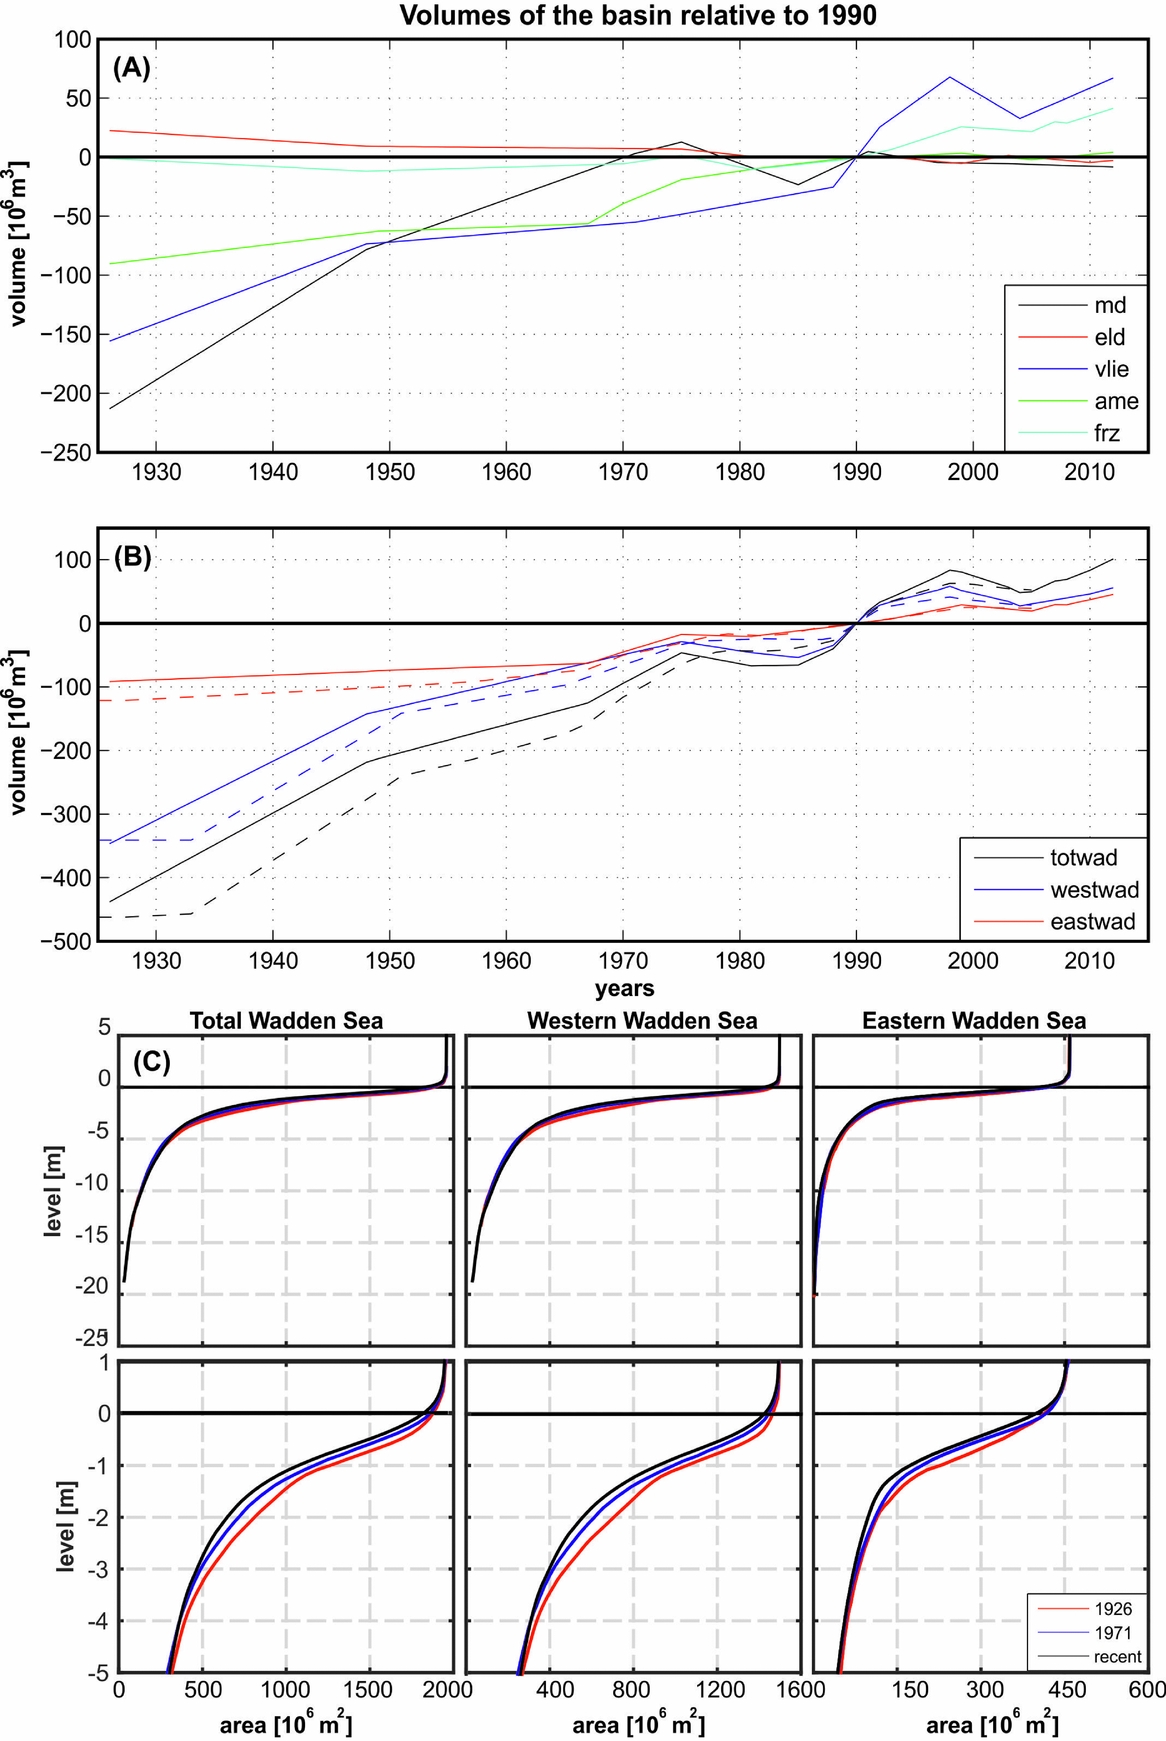
Elias et al. (Reference Elias, Van der Spek, Wang and De Ronde2012) conclude that over the interval 1935–2005 abundant sediment supply, primarily by eroding ebb-tidal deltas, has so far delivered sufficient sediment to increase the sediment volume in the Dutch Wadden Sea. Over the period 1927–2012 a near-linear increase in gross volume of about 550 million m3 (5.9 million m3a−1) was observed. The value increases to 650 million m3 if sand mining and dredging and dumping are accounted for (Elias et al., Reference Elias, Van der Spek, Wang and De Ronde2012).
This sediment gain was more than sufficient to compensate for the recorded SLR of c.0.14m in the Wadden Sea. Complete compensation of this SLR of 0.14m would only have taken a sediment volume of c.280 million m3. Elias et al. (Reference Elias, Van der Spek, Wang and De Ronde2012) also show that the largest part (nearly 75%) of the volume change occurs in the western Wadden Sea, where the influence of human interventions is dominant and the large infilling rates in closed-off channels, and along the basin shorelines (coasts of Friesland and Noord-Holland), rather than a gradual increase in tidal flat heights, render it likely that this sedimentation is primarily a response to the closure of the Zuiderzee and not an adaptation to SLR. The intertidal flats, however, have been extending in all basins; the hypsometric curves show a clear increase in level (Fig. 3).
The closures of the Zuiderzee and Lauwerszee have both caused sedimentation in the channels of the corresponding basins. However, the sedimentation in the basins of Texel and Vlie Inlets occurred almost entirely in the shallow parts, above MSL-6m, whereas the sedimentation in the basin of Frisian Inlet occurred over the whole subtidal part. This difference can be explained by the fact that the closure of the Lauwerszee caused a substantial decrease of the tidal prism of Frisian Inlet, rendering the tidal channels oversized, whereas the closure of the Zuiderzee only had very limited influence on the tidal prisms of Texel and Vlie Inlets.
The observed stability of the bed in the basins of Vlie Inlet, Frisian Inlet and at the Groninger Wad and Ems–Dollard Estuary (Fig. 2) illustrates that sediment delivery was sufficient to compensate for increased accommodation space due to subsidence of the seabed. In these basins, gas extraction should have created an estimated 38 million m3 extra increase in water volume in the tidal basins and along the North Sea coast of Ameland. However, no indications of subsidence of the seabed have been observed. We assume that this increase in accommodation space in these basins has almost instantaneously been filled in with sand imported from the North Sea coastal zone.
Elias et al. (Reference Elias, Van der Spek, Wang and De Ronde2012) showed that sedimentation has been taking place in all the Dutch Wadden Sea basins except Eierlandse Gat (see Figs 3 and 4). The average accretion rates per basin over the period 1935–2005 are all much higher than the rate of relative SLR of about 2.0mma−1. These import figures are significantly influenced by human interventions (Elias et al., Reference Elias, Van der Spek, Wang and De Ronde2012). The three basins with the highest sedimentation rates, viz. Texel and Vlie Inlets (both 4.69mma−1) and Frisian Inlet (6.66mma−1), have been influenced by large-scale interventions in the recent past. Texel and Vlie Inlets were impacted by the closure of the Zuiderzee in 1932. Frisian Inlet was strongly influenced by the closure of the Lauwerszee in 1969. The Ameland basin has not been subjected to interventions and shows the lowest accretion rate (2.52mma−1). Along the North Sea coast of the islands, outside the tidal inlets, erosion is observed in the same period. The total amount of erosion along the North Sea coast is about the same as the total amount of sedimentation in the Wadden Sea basins (Fig. 4). Note that the basins of Texel and Vlie Inlets are not separated and that their development is connected. The bulk of the volume change can be directly related to the abandonment and subsequent erosion of (parts of) the ebb-tidal deltas following the closures of the Zuiderzee and Lauwerszee. Their rapid adjustments and the large accretion numbers in the affected tidal basins prove that the human interferences are the dominant driver for the observed changes. Elias et al. (Reference Elias, Van der Spek, Wang and De Ronde2012) thus confirm the conclusion of Stive et al. (Reference Stive, Roelvink, De Vriend, Louisse, Stive and Wiersma1990) that the Wadden Sea is an important sediment sink in the Dutch coastal system but they emphasise the effects of human interferences in addition to the effects of relative SLR.
Sedimentation (+) and erosion (−) rates over the period 1935–2005, based on the results of Elias et al. (Reference Elias, Van der Spek, Wang and De Ronde2012), expressed in million m3a−1 (the first number in a polygon). The second numbers indicate vertical accretion rates in mma−1 in the back-barrier basins or erosion rates of the North Sea coasts of the barrier islands in ma−1 (calculated by assuming 20m active depth). Note that the basins of Texel and Vlie Inlets are in reality connected and that their development should be considered as such.

Sediment-sharing system
Introduction
Scale relations, both in time and space, in sediment-sharing systems are a major topic in tidal inlet research. On various levels of aggregation, the Wadden Sea as a whole, the separate tidal inlets and basins and even the individual channels and shoals, these systems continuously exchange sand between their elements. Each (sub)system continuously strives to maintain a dynamic equilibrium between its morphology and the forcing conditions. A distortion of the equilibrium state, either natural or man-made (and sometimes both), induces exchange of sediment between the elements until the equilibrium state is restored. Individual channels and shoals may find equilibrium on short timescales (days to decades), individual inlets may find equilibrium on timescales of decades to centuries, while the complete Wadden Sea may seek but never find equilibrium as it takes centuries to millennia to complete. It is important to realise that despite morphologic equilibrium, which means that net changes in sediment volume are small, there is a continuous exchange of sand fractions, which is illustrated by the increase in sediment sorting with time as discussed by Krögel (Reference Krögel1995) and Bartholomä & Flemming (Reference Bartholomä and Flemming2007).
The shift from natural processes to human-influenced changes makes predictions on future development of the Wadden Sea as a whole difficult, since our datasets are too short to fully determine the processes and mechanisms underlying the changes on these larger scales, and hence predict a new future equilibrium.
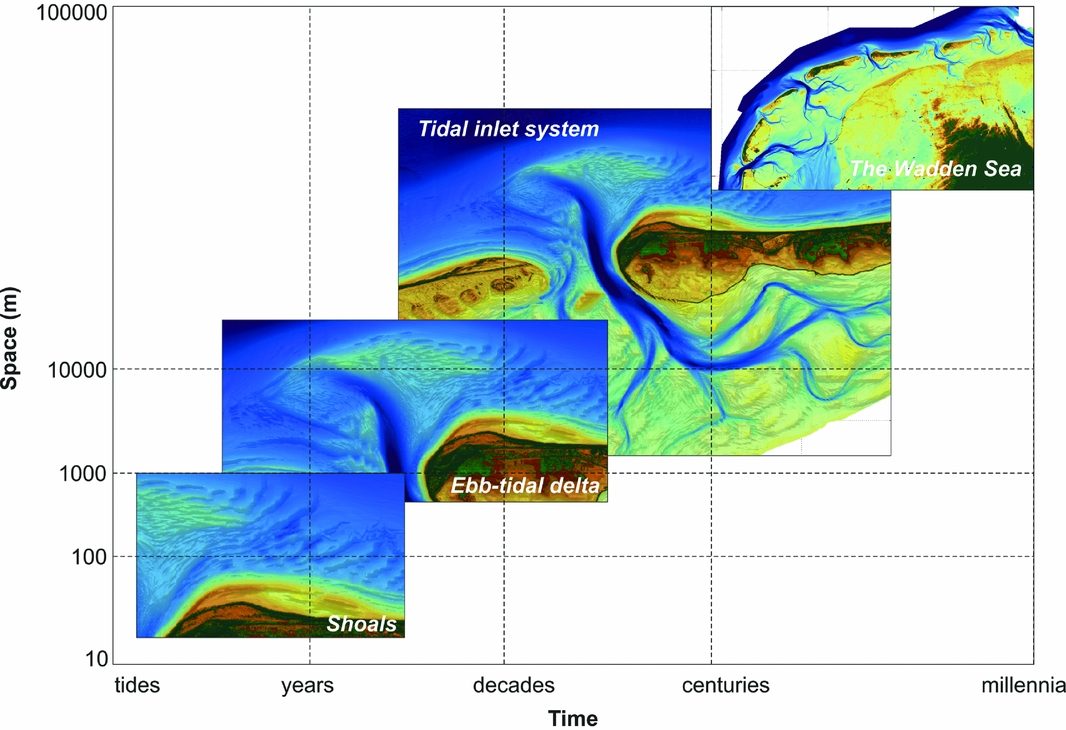
In order to provide structure in the large range, both in time and space, of morphodynamic responses and developments that can occur, De Vriend (Reference De Vriend1991) introduced the concept of the scale cascade (Fig. 5). An important finding is that not every process is important for each morphological scale of interest, which allows us to focus on the relevant processes only once we can distinguish between dominant forcing process and ‘noise’. The scale cascade also allows us to structure, summarise and thereby better understand the observed morphological development of the system. We hypothesise that if we better understand the evolution of the individual tidal inlet systems and the relevant processes, in combination with various forms of modelling, we can make an improved prediction of the future state of the Wadden Sea as a whole.
A scale cascade illustrating the relations between the various morphological elements of the Wadden Sea (as an example the Ameland tidal inlet is used for the smaller scales). From Elias (Reference Elias2017), based on De Vriend (Reference De Vriend1991).
Sediment-sharing system Wadden Sea
The sediment-sharing system of the Wadden Sea consists of the barrier islands, the inlet and its associated ebb-tidal delta and the tidal basin that includes tidal flats and channels (Fig. 6). Its main characteristic is the net sediment import from the North Sea coastal zone. Since no rivers debouch into the Wadden basins (with the exception of the Ems Estuary and Texel Inlet that receives fresh water but no sediment from Lake IJssel), alluvial sediment input can be ruled out and all sediment has to be imported from the North Sea. As already indicated, the evolution of a coastal system under the condition of a rising sea level depends on the balance between the creation of accommodation space for sediment, that can be considered sediment ‘demand’, and the rate of sediment supply to fill that space (based on Nichols, Reference Nichols1989). In a ‘surplus’ situation the accommodation space is filled in and the coastal system will finally accrete seaward, whereas in a ‘deficit’ state coastal erosion is not sufficient to fill the space and the coastline will recede landward. When we apply this principle to the Wadden Sea, the accommodation space in the basins is the driving ‘demand’ and the sediment import by the tidal inlets is the supply. Note that a ‘surplus state’ will in the end lead to (almost) complete infilling of the tidal basin and disappearance of the intertidal morphology. Hence, a small deficit in the sediment budget of a tidal basin is a prerequisite for the continued existence of intertidal flats.
Schematic overview of the elements, sources, sinks and their linkages that form the sediment-sharing system of the Dutch Wadden Sea. ETD stands for ebb-tidal delta. The indicated basins are: Texel Inlet (a), Eierlandse Gat Inlet (b), Vlie Inlet (c), Ameland Inlet (d), Frisian Inlet (e) and the Groninger Wad and Ems Estuary (f). Moreover, the state of the sediment budget is indicated. The western Wadden Sea (Texel Inlet, Eierlandse Gat Inlet and Vlie Inlet) is transport-limited: the annual import volume does not depend on the dimension of the accommodation space in the basins. The eastern Wadden Sea (Ameland Inlet, Friesche Zeegat Inlet and Groninger Wad) is accommodation-limited. There is little accommodation space and consequently there is little net sediment import.

Sediment ‘demand’
The accommodation space in a back-barrier basin gradually increases due to (1) a rise in mean sea level and (2) regional subsidence of the seabed due to isostatic compensation, tectonics and compaction of sedimentary layers in the subsurface (see the individual sections on these subjects in Fokker et al., Reference Fokker, Van Leijen, Orlic, Van der Marel and Hanssen2018). Both components contribute to an increase in water depth and are lumped into relative SLR. Additionally, local subsidence due to gas and salt extraction (currently occurring in the basins of the Ameland and Frisian Inlets and the Groninger Wad) increases accommodation space at a higher rate. Finally, abrupt changes in the accretionary status of a basin can be caused by the impact of interventions. For example, the closure of the Zuiderzee transformed the back-barrier basins of Texel and Vlie Inlets from lagoonal areas with relatively small intertidal parts and dominated by the transit of the tide into the Zuiderzee, into two tidal basins with a large sediment deficit (compare the situations 1927/1935 and 2011/2016 in Fig. 2).
Sediment supply
The ebb-tidal deltas of Texel and Vlie Inlets and the Zoutkamperlaag (Fig. 2) have been the major sources of sand for the Dutch Wadden Sea over the last 85 years (Elias et al., Reference Elias, Van der Spek, Wang and De Ronde2012). Whether this will be the case in the future is unclear since the morphodynamic changes in these areas are reaching a near-equilibrium state (see Elias & Van der Spek, Reference Elias and Van der Spek2017, for an analysis of Texel Inlet). The erosion of the North Sea shorelines of the barrier islands, especially the tips of the islands if not protected, and the Noord-Holland coast is an additional sediment source; the sand is predominantly transported into the tidal inlets by littoral drift. Since coastal erosion is compensated with sand nourishments, the latter are becoming a sediment source as well. Currently, sand is nourished on the beach and shoreface of the barrier islands and in the future possibly on ebb-tidal deltas. Finally, the seabed further offshore is potentially a source of sediment, although this is a largely unknown component.
Strong winds will result in higher waves along the North Sea coast of the barrier islands and in the ebb-tidal deltas, which will increase the suspended sand concentrations and, consequently, the import of sand into the tidal basin with the flood tide.
The supply of sand to the tidal basins not only depends on the volume of sand available along the North Sea shoreline, including the ebb-tidal deltas, but also on the transport capacity of the processes in the tidal inlet. In cases of a large accommodation space and a sufficient sand volume along the North Sea coast, as was the situation at Texel and Vlie Inlets after the closure of the Zuiderzee, we still see a more or less linear increase in sediment volume in the basins (Fig. 3a and b). Apparently, there is a maximum transport capacity that limits the rate of sediment transport into the basins (Lodder, Reference Lodder2015).
The import of mud into the Wadden Sea contributes to the infilling of the accommodation space as well. Mud is suspended in the coastal water that enters the basins and is transported along the Holland coast to the Wadden Sea. The mud concentration of water entering the Wadden Sea does not depend on local sources. The deposition of mud depends on the energy conditions in the basin: it will settle only under quiet conditions.
Redistribution in basins
Sand that is imported into the Wadden Sea will be transported further into the basin through the tidal channels and finally end up on the tidal flats. Tides, waves and wind are the three forcing processes behind the water and sand movement in the Wadden Sea. These processes are capable of transporting large quantities of sand back and forth, quantities that are an order of magnitude larger than the net displacement of sand. Although an inlet system in the Wadden Sea is often considered as a semi-enclosed system, it is important to realise that back-barrier basins of the adjacent inlets are not separated from each other in most cases. The tidal watersheds are considered as the borders between the basins but exchange of water and sediment over these tidal watersheds does take place (Zimmermann, Reference Zimmermann1974; De Boer, Reference De Boer1979; Vinther et al., Reference Vinther, Christiansen, Bartholdy, Sorensen and Lund-Hansen2004; Duran-Matute et al., Reference Duran-Matute, Gerkema, de Boer, Nauw and Gräwe2014). Moreover, the locations of the tidal divides are not fixed but can change in time, especially after major human interferences (Van der Spek, Reference Van der Spek, Flemming and Bartholomä1995; Vroom, Reference Vroom2011; Wang et al., Reference Wang, Vroom, Van Prooijen, Labeur and Stive2013).
The above-sketched sediment-sharing system of the Dutch Wadden Sea is depicted in Figure 6. It shows the sediment source area, viz. the Noord-Holland coast, the barrier islands, the bounding tidal inlets with their ebb-tidal deltas, and the connected, sediment-demanding tidal basins of Texel Inlet (a), Eierlandse Gat Inlet (b), Vlie Inlet (c), Ameland Inlet (d), Frisian Inlet (e) and the Groninger Wad and Ems Estuary (f). The exchange of sediment between the different elements, both inside the Wadden Sea and along the North Sea coast, is indicated with arrows.
Residual sediment transport through the inlet: the relevant processes and mechanisms
Net sediment import into a tidal basin is the difference between the sediment transport through the tidal inlet during flood and that during ebb. It is important to understand the physical processes and mechanisms causing this residual sediment transport.
Physical processes influencing sediment transport in tidal inlet systems like those in the Wadden Sea include flow driven by tide, wind and freshwater input, as well as short waves. Because of the limited freshwater input, the amount of water flowing into a basin during flood differs little from the amount of water flowing out of the basin during ebb. This also applies for sediment transport, implying that the residual transport through a tidal inlet concerns a small difference between two relatively large gross transports. The relatively small residual sediment transport throughe.g. a tidal inlet is caused by some subtle mechanisms. These mechanisms, that have been studied extensively (Van Straaten & Kuenen, Reference Van Straaten and Kuenen1957; Postma, Reference Postma1961; Groen, Reference Groen1967; Dronkers, Reference Dronkers1986; Friedrichs & Aubrey, Reference Friedrichs and Aubrey1988; Gatto et al., Reference Gatto, Van Prooijen and Wang2017) are briefly described in the following. Which mechanism dominates the resulting sediment transport in individual tidal inlets is not clear. It is noted that in literature the mechanisms are explained in different ways, some in a Lagrangian framework and others in an Eulerian framework. Especially in the early days, various mechanisms, e.g. the effects of settling lag and scouring lag, are often explained in a Lagrangian framework (see e.g. Van Straaten & Kuenen, Reference Van Straaten and Kuenen1957; Postma, Reference Postma1961). Explained in an Eulerian framework, these mechanisms are classified differently; see Gatto et al. (Reference Gatto, Van Prooijen and Wang2017) for an overview. In the description below we focus on the Eulerian framework.
A distinction can be made between barotropic and baroclinic mechanisms. The barotropic mechanisms include:
Residual flow
Residual flow causes a residual sediment transport in the same direction, and the tidal flow fluctuations strengthen it (Van de Kreeke & Robaczewska, Reference Van de Kreeke and Robaczewska1993; Chu et al., Reference Chu, Wang and De Vriend2015). Residual flow through a tidal inlet can be due to the following causes:
• Freshwater input. River discharge causes a seaward residual flow in an estuary. For the Dutch Wadden Sea the discharge of fresh water is very limited, except that from the Ems Estuary and Lake IJssel which influences especially Texel Inlet.
• Compensation flow caused by Stokes drift. The tide in the Wadden Sea is in between a standing wave and a progressive wave. The Stokes drift causes a landward water flux which is compensated by a seaward-directed residual flow. The Stokes drift depends on the morphology of the back-barrier basin. The residual sediment transport through the inlet due to this mechanism will therefore be mainly influenced by the morphological development of the basin and the inlet.
• Meteorological effects. Wind can have a substantial influence on the hydrodynamics in the Wadden Sea area and thereby also on the residual sediment transport, especially during and just after storm events. Wind-driven flow can significantly influence the tidal flow pattern, which may result in import through one inlet and export through another inlet. Set-up or set-down of the water level in the Wadden Sea due to wind and air-pressure change can also influence the flow through the inlet, especially after a storm/strong-wind event. Furthermore, wind generates waves in the tidal basin that also influence the sediment transport processes. These effects are also dependent on the morphology of the back-barrier basins.
Tidal asymmetry
Due to deformation during propagation in shallow seas, a tidal wave becomes asymmetric: in a flood-dominant system the period of rising water levels becomes shorter whereas the period of falling water levels increases. This causes flood velocities to increase and ebb velocities to decrease. In an ebb-dominant system the opposite is true. Asymmetry in tidal flow velocities causes residual sediment transport and, consequently, import or export of sediment through tidal inlets, even though there would not be any residual water flux through the inlets. Tidal asymmetry comprises:
• Asymmetry in peak flow velocities during flood and ebb associated with asymmetry in flood- and ebb durations. If the flood period is shorter than the ebb period, the peak flow velocity during flood will be higher than that during ebb. This results in an import of sediment to the Wadden Sea because of the strongly nonlinear relationship between flow velocity and sediment transport.
• Asymmetry in the durations of high-water (HW) and low-water (LW) slacks. A longer HW slack than LW slack causes import of fine sediment because the sediments in suspension have more time to settle during HW slack (see Dronkers, Reference Dronkers1986).
Both types of tidal asymmetries are also influenced by the morphology of the back-barrier basin. This means that residual sediment transport through the inlet due to tidal asymmetries will depend on the morphological development in the basin as well.
Jet-flow asymmetry
Asymmetry in the velocity of the flow jet that develops in the inlet gorge results in a net sediment import. Oertel (Reference Oertel, Aubrey and Weishar1988) describes the tidal flow leaving the constricted inlet as a jet flow. The jet erodes material from the inlet gorge and carries it away from the inlet. The material is deposited in the far-field region of the jet. During the opposing tidal phase the flow towards the inlet is more uniformly distributed, which results in generally lower flow velocities and distinct zones of ebb- and flood-dominant flow and sediment transport near the inlet. The sediment deposited in the far-field zone of the jet will not be returned to the inlet by the weaker currents of the opposing flow and hence ‘escapes’ from the inlet. This results in net export to the ebb-tidal delta as well as net import into the basin. However, on the ebb-tidal delta the waves are continuously redistributing and recirculating the sediments and transporting sediments back to the inlet. In the basin such a mechanism does not exist and with the predominant wind and local wave direction directed away from the inlet, this results in a net import of sediments into the basin.
Spatial asymmetry in net sediment transport and deposition
Detailed analysis of the three-dimensional current patterns in Texel Inlet shows that the northern part of the inlet that includes the main ebb channel is ebb-dominant, whereas flood currents dominate in the southern part of the inlet (Elias, Reference Elias2006; Elias & Van der Spek, Reference Elias and Van der Spek2017). This causes a net flux of sand along the southern shore which is not counteracted by sediment fluxes in the ebb direction. Moreover, sediment that is carried into the tidal basin by flood currents is deposited during the following slack water. Since the flood waters are entering both channels and tidal flats, the sediment is distributed over a large area. During the following ebb, the tidal flats are drained comparatively slowly and only part of the deposited sediment is removed and transported seawards again. This enhances the net gain of sediment in the basin.
Dispersion
Tidal flow functions as a mixing agent for dissolved and suspended matters, causing a residual transport in the direction opposite to the concentration gradient. This is one of the mechanisms causing residual sediment transport from the ebb-tidal delta to the basin (and thus causing import) of Texel Inlet because stirring by waves causes higher sediment concentrations on the ebb-tidal delta (Elias, Reference Elias2006). This will hold for other inlets as well.
The analysis of sand transport in tidal inlets with a process-based model (see e.g. Elias, Reference Elias2017) indicates that net transport into the basin occurs even in ebb-dominant channels. Stepwise landwards transport of suspended sand occurs during successive tides, which is simply explained by settling lag- and scour lag mechanisms.
The working of these mechanisms also depends on the sediment properties. This means that the importance of a mechanism is different for the different sediment fractions. In particular, a distinction should be made between mud and sand. Mud can only accumulate in areas of low energy level (due to flow and waves). Import of mud through an inlet will therefore depend on the amount of such accumulation areas within the back-barrier basin.
The baroclinic mechanisms are caused by the effects of density flows as a result of spatial gradients in salinity and water temperature. Density flow can cause residual circulations with, e.g., flow near the bed directed landwards and at the water surface directed seawards. Such a circulation results in a landward residual sediment transport because the sediment concentration is higher in the lower part of the water column than in the higher part (see e.g. Winterwerp et al., Reference Winterwerp, Vroom, Wang, Krebs, Hendriks, Van Maren, Schrottke, Borgsmüller and Schöl2017). For an inlet in which the back-barrier basin receives substantial freshwater input, such as Texel Inlet via Lake IJssel, the effect of density flows can be significant (Elias, Reference Elias2006).
The other Dutch and many German Wadden Sea inlets do not receive substantial freshwater input. Even for those inlets, discussions on whether the barotropic or the baroclinic mechanisms are dominant are still going on (Wang et al., Reference Wang, Hoekstra, Burchard, Ridderinkhof, De Swart and Stive2012). The most recent study based on field measurements suggests that the baroclinic mechanisms are less important than the barotropic ones (Becherer et al., Reference Becherer, Flöser, Umlauf and Burchard2016). Moreover, the relative importance of the two types of mechanisms can also be evaluated by considering the effects of the closures. It is evident that the closures of, e.g., the Zuiderzee and the Lauwerszee have caused increased sediment import to the corresponding basins. In Elias (Reference Elias2006) it is shown that the freshwater discharge of Lake IJssel, supplied through the sluices can introduce a significant increase in sediment import in Texel Inlet. However, it is not likely that this is the dominant mechanism, since the increased sediment transport after closure of the Zuiderzee is better explained by the effects of barotropic mechanisms.
Figure 7 shows as an example how the processes and mechanisms relevant for residual sediment transport are influenced by human interference. Due to the closure of the Lauwerszee the flow velocity in the channel Zoutkamperlaag was substantially decreased in magnitude. This influenced the mechanism dispersion, causing sedimentation in the channels in the basin and thus import of sediment. Furthermore, the tidal flow through the inlet became clearly asymmetric in the sense that the peak velocity during flood became clearly larger than the peak velocity during ebb. Also this change caused import of sediment into the basin. This change in tidal asymmetry was due to the fact that the closed-off part contained relatively more intertidal flats (Wang et al., Reference Wang, Louters and De Vriend1995), which is in agreement with the theory on how the morphology of a tidal basin influences tidal asymmetry (Friedrichs & Aubrey, Reference Friedrichs and Aubrey1988).
Influence of the closure of the Lauwerszee on the water level (top) and flow velocity (bottom) at the inlet of Zoutkamperlaag (based on Wang et al., Reference Wang, Louters and De Vriend1995).

Channel–shoal interaction
The (inter)tidal flats in the Dutch Wadden Sea consist mainly of fine-grained sand with average grain sizes of c.0.100–0.200mm (De Glopper, Reference De Glopper1967), a range that is found in other intertidal areas as well (e.g. Eastern Scheldt Estuary, SW Netherlands, Kohsiek et al. Reference Kohsiek, Mulder, Louters and Berben1987; The Wash, UK, Collins et al., Reference Collins, Amos, Evans, Nio, Schüttenhelm and Van Weering1981; Skallingen, Denmark, Christiansen et al., Reference Christiansen, Vølund, Lund-Hansen and Bartholdi2006). Note that in this section the words ‘shoal’ and ‘tidal flat’ are used as synonyms. About 70% of the intertidal surface area in the Dutch Wadden Sea consists of sand deposits. Mud flats are found on the sheltered lee sides of the barrier islands and in front of the land-reclamation works along the mainland dikes. The grain-size distributions of the sediments are sorted according to the energy gradient in the basins: the general trend shows a decrease in both tidal and wave energy and, hence, in grain size from the inlet to the landward side of the basin (Fig. 8). Local morphology determines second-order variations on top of this general trend, with fining trends away from the channels (De Glopper, Reference De Glopper1967). Studies of Flemming and co-workers in the East Frisian Wadden Sea showed that a distinct zoning in the average grain sizes on the tidal flats can be determined (Flemming & Ziegler, Reference Flemming and Ziegler1995; Nyandwi, Reference Nyandwi, Alexander, Davis and Henry1998; Bartholomä & Flemming, Reference Bartholomä and Flemming2007; see Fig. 8). Besides that, accumulation of mud particles as pellets by filtering organisms such as mussels results in mud deposits that are not related to the energy level of the environment.
Spatial pattern of the mean sediment grain size in the back-barrier area of Spiekeroog Island (Germany). Note the landward-fining trend. Sediment grain sizes are indicated in phi classes. The phi unit (ø) is a logarithmic transformation of millimetres into dimensionless numbers, according to the formula: ø=−2logd, where d = grain diameter in millimetres. The grain size decreases with increasing phi number. (Adapted from Flemming & Ziegler, Reference Flemming and Ziegler1995.)

Sand is supplied to the tidal flats by the tidal channels. The relevant grain sizes that are deposited on the tidal flats are transported in suspension (e.g. Evans & Collins, Reference Evans, Collins, Hails and Carr1975; Collins et al., Reference Collins, Amos, Evans, Nio, Schüttenhelm and Van Weering1981; Eisma & Ridderinkhof, Reference Eisma, Ridderinkhof and Eisma1998, p. 373). Bed-load transport from the channel floor to the flats is almost absent (Kohsiek et al., Reference Kohsiek, Buist, Bloks, Misdorp, Van den Berg, Visser, De Boer, Van Gelder and Nio1988). Measurements (Postma, Reference Postma1961, Reference Postma and Lauff1967) show an inward increase in fine-grained sand and silt concentrations in the channels. The suspended fine-grained sand is transported onto the tidal flats by flood tidal currents, especially during spring tides. The increased flood current velocities during spring tide cause a net sediment transport from channel to shoal that is four to five times higher than during neap tide (Kohsiek et al., Reference Kohsiek, Mulder, Louters and Berben1987). Moreover, calm weather with limited wave action results in accretion of the shoal, in which the edge of the shoal shows, in general, greater sedimentation and erosion rates than the central part (Kohsiek et al., Reference Kohsiek, Buist, Bloks, Misdorp, Van den Berg, Visser, De Boer, Van Gelder and Nio1988).
When the sediment-laden water moves onto the flat, the current velocity is reduced by friction and the sand starts to settle, the coarsest grains first. Hence, tidal levees are formed along the edge of the shoal. The finer fractions will remain suspended and are transported away from the shoal edge. Small waves over the shoal will keep the finer sand fractions suspended. Depending on the intensity of the wave activity, the finer sand fractions will finally settle on the shoal or remain in suspension and be carried over the shoal and end up in a tidal channel (with the ebbing tide) where they will become part of the suspended load in the channels again. In the vicinity of the inlets, this general shoal-feeding mechanism can be modulated by North Sea waves that penetrate through the inlet into the tidal basins, where they will break on the shoal edge and increase the shoal-ward sand transport and cause up-building of beach-like features. In case of sufficient fetch, waves generated within the tidal basin can grow to such dimensions that they can cause migration of the intertidal flats. Large-scale bed forms on intertidal shoals are usually found only in parts of the basin where large water volumes flow over the shoals during flood tide. Besides, the range of grain sizes on the flats limits the bed-form dimensions.
With increasing wind speeds, the locally generated waves in the tidal basin will increase in height and/or period, which results in wave breaking on the shoal edge that will cause erosion and flattening of the levees that were formed during quiet weather (Postma, Reference Postma1961, p. 188). Moreover, the increased turbulence over the shoal during high water will prevent settling of the suspended sand or even cause erosion. The (re)suspended sediment will be carried away by wave- and wind-driven currents and the ebbing tide, and the level of the shoal is lowered or at best unchanged. Kohsiek et al. (Reference Kohsiek, Buist, Bloks, Misdorp, Van den Berg, Visser, De Boer, Van Gelder and Nio1988) determined that on the Galgeplaat shoal in the Eastern Scheldt, the total sand transport in a flood–ebb cycle during storms increases by three to eight times and that net sediment transport is mainly directed off the shoal. The most intense storm erosion occurs during neap tides, since during spring tides the water depths on the tidal flats are larger, which reduces the wave attack on the shoal edge, and part of the erosion will be compensated by the larger sediment supply (Kohsiek et al., Reference Kohsiek, Mulder, Louters and Berben1987).
Hence, the height of the intertidal flats is the outcome of the supply of suspended sand by the flood tide, predominantly during spring tides, and deposition on the flats. Deposition on the flat during high water depends on the intensity of the turbulence in the water column: during quiet weather, sand will settle, whereas under more turbulent conditions sand will remain in suspension or even be eroded from the shoal. In general, the supply of suspended sand will be less variable than the rate of sedimentation or erosion, which means that the net effect of the balance between supply and deposition or erosion will predominantly be determined by the latter. The water depth over the flat during high water will influence the sedimentation and erosion as well. Greater inundation depths during high water will de facto result in the supply of a larger sand volume (under a constant sand concentration), which will result in higher sedimentation rates under quiet conditions. On the other hand, greater water depths over shoals will allow for larger waves and more turbulent conditions. Christiansen et al. (Reference Christiansen, Vølund, Lund-Hansen and Bartholdi2006) give a detailed account of the high-frequency bed-level changes of a tidal flat in reaction to tides, waves and winds.
Mud and organisms
The overall development of intertidal shoals is influenced by the settling of mud over the shoal's surface and the activity of benthic organisms. Under very quiet conditions, predominantly during summer, mud is deposited on the shoals that after some consolidation will protect the shoal surface against erosion. However, under energetic conditions these mud layers will break up again and be removed. The formation of algal/diatom mats on the shoal surface during summer conditions will armour the sediment surface and restrict or preclude sediment erosion. Burrowing benthic animals can have both positive and negative impacts on sediment stability. Complete bioturbation of heterolithic sediment sequences results in (almost) homogeneous sand–mud mixtures that show cohesive behaviour and are difficult to erode. On the other hand, intensive burrowing can destroy the layer structure of the top of the shoal, which diminishes the sediment strength against erosion. Moreover, burrowing often results in deposition of excreted sand in little mounds at the surface that will increase the bed roughness and, hence, the turbulence of the flow over the flats.
Conceptual model
The above-described processes can be summarised in a conceptual model for sandy tidal-flat development over longer timescales. In this conceptual model the effects of mud deposition and biota will be ignored. Fine-grained sand is constantly supplied by the flood tide and transported in suspension from the channels onto the flats. The larger part of this sediment supply is deposited on the shoal edge and forms tidal levees. The deposition of the suspended sand on the more central part of the flat depends on the energy level of the water over the flat: an increasing energy level results in a decreasing percentage of the total sand supply that will settle. Hence, there is a constant flux of sand over the flats, and the meteorological conditions determine the rate of deposition. This sand flux can be compared with a ‘conveyor belt’ that more or less constantly carries sand over the flat. The net accretion of the flat over longer intervals will be determined by the alternation of intervals with deposition and intervals of non-deposition or even erosion, wherein the average wave conditions over the flat determine whether sand is deposited or not. This is in principle a stochastic process that will result in fluctuating flat levels. However, over longer intervals the flat level will have a more or less constant value that depends on the average local wave conditions. This level can be considered an equilibrium level. A rise in local mean high water level, e.g. as a consequence of relative SLR or the impact of an intervention in the tidal basin, will create new accommodation space. This space is determined by the offset between the actual sediment level and the (new) equilibrium level that is determined by the average wave conditions. The more or less constant supply of suspended sand by the channel will deliver the sand to raise the flat level and to fill the accommodation space. After the accommodation space has been filled, again sand will at best be stored only temporarily on the shoal and is likely to be eroded and removed under more energetic conditions.
This conceptual model can be expanded to the entire tidal basin. When we consider the tidal channels as an active distribution system of sand, all the intertidal flats will receive sand. The sand concentration in the channels is determined by resuspension of sand from the tidal flats. In addition to this, the tidal basins of the Wadden Sea receive sand from the North Sea coast (Elias et al., Reference Elias, Van der Spek, Wang and De Ronde2012), so the sand concentrations in the channels are increased by the sand carried by the flood water into the basin. Under the present-day conditions very large volumes of sand are transported through the tidal channels, both in basin and inlet. Only a very small portion of these large gross sediment transports remains in the basin and results in net accretion. However, the surplus of sand that moves through the system in the form of the gross transports can be considered to be a ‘strategic reserve’ that can buffer an increase in sediment demand in the system caused by the creation of new accommodation space. Only in case of an extreme increase in sediment demand, e.g. caused by a significant acceleration of SLR, might the gross sediment flux of sand into the basin in the long run be shown to be insufficient to satisfy the increased demand and fill in the newly created accommodation space. This makes both the sand budget of the North Sea coast and the transport capacity into the basin crucial factors in the sustainability of the intertidal flats of the Wadden Sea.
The impact of gas extraction in the Dutch North Sea coastal zone and Wadden Sea illustrates the above explained conceptual model. Gas extraction north of the eastern tip of Ameland since 1986 has resulted in subsidence of both the seabed of North Sea and Wadden Sea and of the island of Ameland. Monitoring of the subsidence (Piening et al., Reference Piening, Van der Veen and Van Eijs2017) shows that the centre of the extraction area has subsided about 0.4m. However, current morphodynamic processes have largely compensated the subsidence, both along the North Sea coast of the island and in the Wadden Sea. On the island, the subsidence can be observed in areas that are excluded from direct sand supply such as vegetated dune valleys (Kuiters et al., Reference Kuiters, De Vries, Brus, Heidema, Huiskes, Slim, Van Dobben and Krol2017). In the Wadden Sea, the tidal-flat level shows no signs of subsidence of the subsurface. Monitoring of the sediment accretion in the affected areas by bimonthly measurement of the thickness of the sediment layer above a fixed reference level (Krol, Reference Krol2017) shows that the accommodation space created by subsidence is filled with sediment almost instantly. This can be explained by deposition of sand from the gross sand fluxes. Large-scale sand nourishment on the shoreface of Ameland (20 million m3 since 1980; data Rijkswaterstaat) maintained the island's coastline position and probably also fed the net sand import into the tidal basin.
The above-stated conceptual model for sandy tidal-flat development does not explain completely how subtidal flats grow from subtidal to intertidal level. At locations sheltered from wave activity, the sand supplied by the channels is likely to stay in place since resuspension by waves will be limited. However, the accretion of flats in locations exposed to wave action and strong tidal currents is not understood.
Present state of the Wadden Sea sediment-sharing system
We can summarise the sediment budget of the Dutch Wadden Sea as follows. The sediment budget of tidal basins is determined by the balance between the accommodation space in the basin, the ‘demand’ for sediment, and the supply of sediment from the North Sea coastal zone (barrier islands, ebb-tidal deltas and adjacent mainland coast). The supply depends on both the available sediment volume in the source area and the total transport capacity of the flood tide that carries the sand into the basin (see Lodder, Reference Lodder2015). In theory, there are three potential limitations that can restrict the sediment import into the tidal basins. In case of ample sediment supply, the accommodation space in the basin, the ‘sediment demand’, will determine the amount of net accretion; the system is accommodation-limited. In case the sediment volume available for transport at the North Sea coast is not sufficient to satisfy the sediment demand in the basin, the net import will not be adequate to maintain the basin morphology; the system is supply-limited. A third option is a condition under which the sediment volume available for transport is in theory adequate to satisfy the sediment demand, but the sediment transport capacity is too small to realise this; the system is transport-limited. This will lead to an increasing sediment deficit in the basin with time and eventually disappearance of the intertidal morphology.
When considering the current accretionary status of the Dutch Wadden Sea, we can distinguish the western Wadden Sea that consists of the basins of Texel, Eierlandse Gat and Vlie Inlets, from the eastern Wadden Sea (Ameland and Frisian Inlets and the Groninger Wad). The accommodation space in the tidal basins of the western Wadden Sea is large, despite the import of over 450 million m3 of sediment since 1935. Since there is still an ample volume of sand available in the ebb-tidal deltas and island coasts of these basins (see Fig. 2, situation 2011/2016), the transport capacity must be a limiting factor. The almost linear annual increase in sediment volume in these combined basins of 6.5 million m3 (Fig. 4) possibly indicates the maximum transport capacity for these inlets under the current hydrodynamic conditions. Hence, we hypothesise that the sediment import in the western Wadden Sea is limited by the sediment transport capacity (Fig. 6). Both the large present accommodation space in the basins and the limited sediment transport capacity in the inlet render these basins vulnerable to acceleration in the rate of SLR.
Over 70% of the surface area of the eastern part of the Dutch Wadden Sea consists of intertidal flats. This implies that there is little accommodation space for sediment and that this area must be close to morphological equilibrium. Any increase in accommodation space, for instance caused by subsidence of the seabed due to gas extraction, is almost instantly filled with sediment. This indicates that the sediment budget of this part of the Wadden Sea is accommodation-limited: the net sediment import follows the fluctuations in the accommodation space (Fig. 6).
Morphodynamic modelling
Morphodynamic modelling approaches
Modelling is essential for the projection of future scenarios of morphological development. It is also helpful for improving our system understanding and is thus an important research tool.
Models for simulating the morphological development of tidal inlet systems such as those in the Wadden Sea can be divided into the following types (e.g. Wang et al., Reference Wang, Hoekstra, Burchard, Ridderinkhof, De Swart and Stive2012):
Process-based models
Process-based models aim at the best possible description of the relevant physical processes. An example is the Delft3D system (Lesser et al., Reference Lesser, Roelvink, Van Kester and Stelling2004), in which the mathematical equations representing the physical processes of water movement and sediment transport are solved numerically to determine the morphological changes based on a mass balance for sediment. Such models, also indicated as ‘complex’ and ‘quasi–realistic’ in the literature, can be used for detailed simulation of morphological changes. More importantly, they can be used to determine the underlying physical processes and mechanisms for, e.g., the observed morphological developments. It is important to realise that even process-based models are not reality, but aim to represent reality as closely as possible. This representation of reality is as good as the underlying equations and model deployment. Some of these equations are well-studied and well-known (e.g. hydrodynamics), some contain a considerable margin of error and unknowns (e.g. sediment transport).
Aggregated models
Aggregated models, or (semi-)empirical models, are also known as behaviour-oriented models. These models make explicit use of empirical relationships to define a morphological equilibrium. An important assumption is that the morphological system after a disturbance (through natural evolution or human interference) always tends to develop to a state satisfying the empirical equilibrium relationships. The ASMITA (Aggregated Scale Morphological Interaction between Tidal inlets and the Adjacent coast) model (Stive et al., Reference Stive, Wang, Ruol and Buijsman1998; Stive & Wang, Reference Stive, Wang and Lakhan2003; Townend et al., Reference Townend, Wang, Stive and Zhou2016a,b), which is used as an important tool for determining the effects of interventions in the Wadden Sea, is an example of this type of model. The model uses a schematisation in which a tidal-inlet system is divided into the main morphological elements ebb-tidal delta, channels in the basin and intertidal shoals and flats. These elements exchange sediment with each other and with the adjacent coast, to develop a morphological equilibrium as defined by the empirical relationships. The model is easy to handle and simulates long-term developments. This makes it suitable to study the effects of SLR (Van Goor et al., Reference Van Goor, Zitman, Wang and Stive2003) and large-scale human interventions (Kragtwijk et al., Reference Kragtwijk, Zitman, Stive and Wang2004) on the morphology of the Wadden Sea. Since these models depend on the basic assumption concerning morphological equilibrium, sufficient historical data for the calibration and validation is essential.
Idealised models
An idealised model is in fact a process-based model that makes use of simplified physical and mathematical descriptions to analyse the behaviour of a morphodynamic system. The difference with the ‘complex’ models is that they do not pursue full description of all physical processes, but try to reduce these to essential principles. An example of this type of model is the conceptual model of Postma (Reference Postma1961) on landward sediment transport in the Wadden Sea. The various models developed at the Institute for Marine and Atmospheric Research Utrecht for the different morphological elements within the Wadden Sea system (see the review in De Swart & Zimmerman, Reference De Swart and Zimmerman2009) belong to this type. Another example is the schematised 1D model of Van Prooijen & Wang (Reference Van Prooijen and Wang2013).
Recently, Townend et al. (Reference Townend, Wang, Stive and Zhou2016a,b) demonstrated that the difference between ASMITA and a process-based model such as Delft3D is in the level of (spatial and temporal) aggregation rather than in the extent of empiricism. The ASMITA model is based on the same principles as a process-based model in the case that the suspended sediment transport is dominant. Both models try to represent the same physical processes, but at different levels of aggregation. The difference between the two models is in the formulations for the exchange between the bottom sediment and the water column. In Delft3D this is arranged via the bottom boundary condition in 3D mode or a formulation derived from an asymptotic solution of the (3D) advection–diffusion equation (Galappatti & Vreugdenhil, Reference Galappatti and Vreugdenhil1985; Wang, Reference Wang1992) in 2DH mode. In both cases, the local equilibrium concentration for sediment needs to be calculated. This requires a sediment transport formula that relates the transport capacity to the strength of the flow and the properties of sediment. A sediment transport formula is often derived by considering the relevant physical processes, but it always contains parameter(s) to be calibrated with observations from the field and/or laboratory. In that sense, a sediment transport formula is thus empirical. One must also take into account the uncertainties associated with the application of such a formula. This is shown by the fact that there are not one but many sediment transport formulas available. An indication of the uncertainty is given by Van Rijn (Reference Van Rijn1984a,b) who suggested that sediment transport estimates and measurements can differ easily by a factor of 2. In ASMITA, a single formulation is used for the exchange between the bottom and the water column for each large morphological element, e.g. the whole ebb-tidal delta. This is based on morphological equilibrium relationships of the elements and aggregated hydrodynamic parameters, reflecting the aggregation in time and space. These relationships are, like the sediment transport formula, based on physical considerations (to determine relevant hydrodynamic parameters and morphological relationships) and observations from the field (to calibrate the parameters in the relationship). The local equilibrium concentration is related to the ratio between the equilibrium volume and the actual volume. The empirical relationships for the morphological equilibrium also contain uncertainties, just like the empirical aspects of a sediment transport formula in Delft3D.
The Delft3D models have reached a stage where they can be used to investigate hydro- and morphodynamics and greatly improve our fundamental understanding of the processes driving sediment transport (see Elias, Reference Elias2006; Lesser, Reference Lesser2009; Van der Wegen, Reference Van der Wegen2009; Elias & Hansen, Reference Elias and Hansen2012). Van der Wegen (Reference Van der Wegen2009) illustrated that long-term (centuries) morphodynamic simulations are capable of reproducing concepts and equilibrium relationships based on measurements and laboratory experiments (similar findings were presented in the studies of Hibma et al., Reference Hibma, De Vriend and Stive2003a,b, Reference Hibma, Schuttelaars and De Vriend2004; Marciano et al., Reference Marciano, Wang, Hibma and De Vriend2005; Dastgheib et al., Reference Dastgheib, Roelvink and Wang2008; Dissanayake et al., Reference Dissanayake, Roelvink and Van der Wegen2009a,b). Lesser (Reference Lesser2009) demonstrated, through agreement between modelled and measured morphodynamic behaviour of Willapa Bay (WA, USA), that a process-based numerical model could reproduce the most important physical processes in the coastal zone over medium-term (5-year) timescales. Also, recent modelling of morphological changes of the Zandmotor mega-nourishment along the Holland coast illustrates that the Delft3D model can capture morphodynamic developments on a decadal scale (Luijendijk et al., Reference Luijendijk, Ranasinghe, De Schipper, Huisman, Swinkels, Walstra and Stive2017; Huisman et al., Reference Huisman, Ruessink, De Schipper, Luijendijk and Stive2018). Studies that aimed to predict the morphodynamics of the Wadden Sea inlets (e.g. Ameland Inlet) were less successful (De Fockert, Reference De Fockert2008; Teske, Reference Teske2013; Elias et al., Reference Elias, Teske, Van der Spek, Lazar, Wang, Rosati and Cheng2015; Wang et al., Reference Wang, Yu, Jiao, Tonnon, Wang and Gao2016). One of the important lessons learned from the above models is that these are very well able to predict the morphodynamic evolution after large-scale distortion of the system (e.g. construction of the Zandmotor) but cannot easily predict the smaller-scale (natural) evolution of inlets, unless abundant field data (and model development) are available (Lesser, Reference Lesser2009). Applications of process-based models for simulating impact of SLR to the Wadden Sea (Dissanayake et al., Reference Dissanayake, Ranasinghe and Roelvink2012; Becherer et al., Reference Becherer, Hofstede, Gräwe, Purkiani, Schulz and Burchard2018; Hofstede et al., Reference Hofstede, Becherer and Burchard2018) have had only limited success.
Morphological equilibrium
General: philosophy and theoretical background
Morphodynamic equilibrium is a widely adopted concept in the field of geomorphology of coasts, rivers and estuaries (Zhou et al., Reference Zhou, Coco, Townend, Olabarrieta, Van der Wegen, Gong, D'Alpaos, Gao, Jaffe, Gelfenbaum, He, Wang, Lanzoni, Wang, Winterwerp and Zhang2017). Yet it is also an elusive concept and there are still discussions going on about the sense or nonsense of it. Zhou et al. (Reference Zhou, Coco, Townend, Olabarrieta, Van der Wegen, Gong, D'Alpaos, Gao, Jaffe, Gelfenbaum, He, Wang, Lanzoni, Wang, Winterwerp and Zhang2017) made a distinction between morphodynamic equilibrium in the ‘real world’ (nature) and the ‘virtual world’ (model). The concept of morphodynamic equilibrium should be mathematically unequivocal in the virtual world and interpreted over the appropriate spatial and temporal scale in the real world. The choice of a temporal scale is thus imperative when the concept of morphodynamic equilibrium is used.
O'Brien (Reference O'Brien1931) was first to introduce an empirical relationship for morphological equilibrium in tidal regions, viz. a relationship between estuary tidal prism P and entrance cross-sectional area A. A theoretical substantiation for this relation is first provided by the stability analysis of Escoffier (Reference Escoffier1940). This so called PA relationship has been argued to be applicable along the length of the tidal channel as well (Friedrichs, Reference Friedrichs1995; D'Alpaos et al., Reference D'Alpaos, Lanzoni, Marani and Rinaldo2010; Van der Wegen et al., Reference Van der Wegen, Dastgheib and Roelvink2010; Guo et al., Reference Guo, Van der Wegen, Roelvink and He2014, Reference Guo, Van der Wegen, Roelvink, Wang and He2015). It is also the basis for the relationship between the tidal prism and the total volume of the channels within a back-barrier basin in the Wadden Sea (Eysink, Reference Eysink1990). It is argued from a geometric consideration that the total length of the channels should be proportional to the square root of the basin area. For the short (relative to tidal wave length) basins the tidal prism is proportional to basin area. Therefore, the channel volume should be proportional to the tidal prism P to a power close to 1.5, as according to the PA relationships the cross-sectional area is proportional to Pn with n close to 1. Including certain rules for the shape of channel cross-sections such as a relation for the aspect ratio B/h (B = width and h = depth of a channel), it can be argued that there must be a relationship for the proportion of channels in the basin area. This provides a theoretical background for the relationship for the horizontal area of the (inter)tidal flat in a back-barrier basin (Renger & Partenscky, Reference Renger and Partenscky1974; Eysink & Biegel, Reference Eysink and Biegel1992). Similar to the analysis of Escoffier (Reference Escoffier1940), Fagherazzi et al. (Reference Fagherazzi, Palermo, Rulli, Carniello and Defina2007) provide a theoretical substantiation for the equilibrium height of tidal flats.
The volume of an ebb-tidal delta is proportional to the tidal prism of the related tidal inlet. Larger tidal prisms can induce large flows and velocities that scour deeper channels and thus erode larger sediment volumes, which are stored in larger ebb-tidal deltas. Walton & Adams (Reference Walton and Adams1976) quantified this relationship. However, other external controls exist that can modify or change the volumes. Hayes (Reference Hayes and Cronin1975, Reference Hayes and Leatherman1979) published a classification of barrier islands and their related inlet systems on the basis of the ratio of wave height versus tidal range: wave-dominated ebb-tidal deltas are pushed close to the inlet throat, whereas tide-dominated ebb-tidal deltas extend offshore. Later on, Davis & Hayes (Reference Davis and Hayes1984, their fig. 7) showed that tidal prism is more important than tidal range and that large tidal prisms can explain large, well-developed ebb-tidal deltas. Moreover, there is no direct relationship between tidal range and tidal prism (see also Davis, Reference Davis, Van der Linden, Cloetingh, Kaasschieter, Van de Graaff, Vandenberghe and Van der Gun1989, Reference Davis, Kana, Michel and Voulgaris2013).
FitzGerald (Reference FitzGerald1996) and Davis & Hayes (Reference Davis and Hayes1984) state the importance of sediment supply, basin geometry, back-barrier sedimentation history, regional stratigraphy and occurrence of bedrock, river discharge, and sea-level changes as causes for a wide diversity in inlet morphologies. Elias & Van der Spek (Reference Elias and Van der Spek2006, Reference Elias and Van der Spek2017) and Elias et al. (Reference Elias, Van der Spek, Wang and De Ronde2012) describe the consequences of large-scale engineering works for the ebb-tidal deltas of the Dutch Wadden Sea and illustrate how changing inlet dynamics can cause an evolution that deviates from generally accepted equilibrium relationships and conceptual inlet models.
Sediment demand and accommodation space
In addition to analysing the physical processes and mechanisms, another way to understand the residual sediment transport through the inlets is by considering the ‘sediment demand’, which is defined as the sediment volume needed for a certain morphological element to restore morphological equilibrium. For the tidal basins it is in fact equivalent to the aforementioned accommodation space. The aggregated morphodynamic models are based on the principle that residual sediment transport is driven by gradients in sediment demand.
The empirical relationships for the volume of the tidal flats and for the volume of the channels in a tidal basin can be applied to determine the sediment demand in the basin (Van Goor et al., Reference Van Goor, Zitman, Wang and Stive2003; Wang et al., Reference Wang, Vroom, Van Prooijen, Labeur and Stive2013). According to these relationships the equilibrium state of a short (relative to tidal wave length) basin is determined by two basic parameters: the total basin area A b and the tidal range H. Thus, the water volume below the high-water level in a basin at equilibrium is a function of these two parameters (see Wang et al., Reference Wang, Vroom, Van Prooijen, Labeur and Stive2013):
 $$\begin{equation}
{V_{\rm{e}}} = F\left( {{A_{\rm{b}}},\;H} \right)
\end{equation}$$
$$\begin{equation}
{V_{\rm{e}}} = F\left( {{A_{\rm{b}}},\;H} \right)
\end{equation}$$
The difference between the basin volume at a certain stage and this equilibrium basin volume is the sediment demand.
The tidal divides, which form the inner boundaries between the tidal basins and thus determine the basin areas, are not fixed. The movement of the tidal divide between two basins, e.g. Texel and Vlie Inlets, can be very important for the total sediment demand of the two-basin system (Wang et al., Reference Wang, Vroom, Van Prooijen, Labeur and Stive2013).
Modelling response to relative sea-level rise
Only a few proven predictive methods are available to assess the impact of accelerated SLR on inlet systems. Predictions of shoreline change as proposed by Bruun (Reference Bruun1962) and Stive & Wang (Reference Stive, Wang and Lakhan2003) might work along uninterrupted beach/dune coasts, although the assumptions underlying the concept are not supported by oceanographic and geologic evidence (Pilkey et al., Reference Pilkey, Young, Riggs, Smith, Wu and Pilkey1993). However, these types of prediction are generally too simplistic to account for complex inlet processes, where ebb-tidal delta, inlet channel and back-barrier basin tend to remain in dynamic equilibrium with the large-scale hydraulic forcing, individually as well as collectively (Dean, Reference Dean, Aubrey and Weishar1988; Oost & De Boer, Reference Oost and De Boer1994; Stive et al., Reference Stive, Wang, Ruol and Buijsman1998; Stive & Wang, Reference Stive, Wang and Lakhan2003). Van Goor et al. (Reference Van Goor, Zitman, Wang and Stive2003) explicitly assumed such dynamic equilibrium in order to predict critical rates of SLR for various tidal inlet/basin systems in the Dutch Wadden Sea. Their model needs parameters which ideally should be derived from process-based modelling or measurements (Wang et al., Reference Wang, De Vriend, Stive, Townend, Dohmen-Jansen and Hulscher2008). Coastal process-based models that contain the necessary physics to account for these complex interactions, like Delft3D (Lesser et al., Reference Lesser, Roelvink, Van Kester and Stelling2004) and ROMS (Shchepetkin & McWilliams, Reference Shchepetkin and McWilliams2005), are only just starting to address morphodynamic changes on relevant long timescales (see examples in Hibma et al., Reference Hibma, De Vriend and Stive2003a, b; Marciano et al., Reference Marciano, Wang, Hibma and De Vriend2005; Dastgheib et al., Reference Dastgheib, Roelvink and Wang2008; Van der Wegen & Roelvink, Reference Van der Wegen and Roelvink2008; Van der Wegen et al., Reference Van der Wegen, Wang, Savenije and Roelvink2008).
Up to now, the assessment of the impact of SLR relies mainly on aggregated morphological models (ASMITA; Van Goor et al., Reference Van Goor, Zitman, Wang and Stive2003). In the environmental impact assessment studies for gas and salt mining in the Dutch Wadden Sea, the quantitative assessment of the impact of land subsidence is also based on the ASMITA model (Wang & Eysink, Reference Wang and Eysink2005; Cleveringa & Grasmeijer, Reference Cleveringa and Grasmeijer2010; Wang et al., Reference Wang, Cleveringa and Oost2017).
The application of ASMITA for modelling the effect of SLR can readily be demonstrated by using the single element model, in which a back-barrier basin is considered as one single element with the water volume under high water as system variable (see Stive & Wang, Reference Stive, Wang and Lakhan2003). In case of a constant rate of SLR, a ‘new’ dynamic equilibrium volume (further indicated as dynamic equilibrium), which is larger than the original equilibrium volume, can be achieved as long as the SLR rate is below a critical value. There is a permanent difference between the (dynamic) equilibrium volume with SLR and the (original) equilibrium volume without SLR (see Fig. 9). This difference is necessary to maintain the sediment demand that drives sediment imports into the system to an extent that the system does not drown. When the SLR rate is equal to the critical value the dynamic equilibrium volume becomes infinitely large (Fig. 9). This means that the system will drown if SLR becomes faster than the critical rate.
Relation between the dynamic equilibrium volume V (normalised by the original equilibrium volume Ve) and the sea-level rise rate R (normalised by the critical rate Rc).

Wang et al. (Reference Wang, Cleveringa and Oost2017) demonstrated that the nonlinearity of the ASMITA model is essential to be able to predict a critical rate of SLR. According to a linear model, such as the classic empirical model assuming exponential decay of disturbances to morphological equilibrium, a dynamic equilibrium volume can always be found and no critical SLR rate exists. Physically, the nonlinearity represents the limitation of sediment transport capacity. The limited transport capacity is not correctly represented in the classic empirical model in which a disturbance to morphological equilibrium, e.g. sediment demand, decays exponentially as the rate of decay increases linearly with the magnitude of the disturbance. In a process-based model as well as in a semi-empirical (or aggregated) model, the limited transport capacity can be well represented. This is the reason why the classic empirical model does not predict any critical rate for SLR for the Wadden Sea to keep pace with, whereas the ASMITA model does (Van Goor et al., Reference Van Goor, Zitman, Wang and Stive2003).
It is noted that the dynamic equilibrium state as shown in Figure 9 is only achieved if the SLR rate remains constant for a long (relative to the morphological timescale) time. For considering the effect of accelerated SLR, the transient morphological development thus needs to be considered. When, e.g., the SLR suddenly accelerates to a rate above the critical value, it will still take a long time before all the tidal flats are permanently inundated (drowning).
The only application of process-based models to the Dutch Wadden Sea thus far for simulating impact of SLR (Delft3D; Dissanayake et al., Reference Dissanayake, Ranasinghe and Roelvink2012) predicted an unrealistically low critical rate of SLR because only a single sand fraction is included (Wang & Van der Spek, Reference Wang, Van der Spek, Wang, Rosati and Cheng2015). The aggregated models also only include one sediment fraction but they produce more realistic results because their parameter setting is such that the sand–mud mixture is better represented (Wang & Van der Spek, Reference Wang, Van der Spek, Wang, Rosati and Cheng2015). However, the parameter setting is then empirically determined and does not follow the theoretical rules (Wang et al., Reference Wang, De Vriend, Stive, Townend, Dohmen-Jansen and Hulscher2008), making the model results uncertain. Both type of models thus need to be improved in dealing with the sand–mud mixture, in agreement with the findings in modelling river deltas (Edmonds & Slingerland, Reference Edmonds and Slingerland2010; Geleynse et al., Reference Geleynse, Storms, Walstra, Jagers, Wang and Stive2011) and other tidal systems (Van der Wegen et al., Reference Van der Wegen, Jaffe, Foxgrover and Roelvink2017). Hofstede et al. (Reference Hofstede, Becherer and Burchard2018) showed that process-based modelling of the impact of SLR on the Wadden Sea can indeed be more successful if sand as well as mud is considered in the model (see also Becherer et al., Reference Becherer, Hofstede, Gräwe, Purkiani, Schulz and Burchard2018).
Critical rate of sea-level rise for drowning
Van Goor et al. (Reference Van Goor, Zitman, Wang and Stive2003) studied the effect of SLR on Eierlandse Gat Inlet and Ameland Inlet using an ASMITA model in which the inlet system was schematised into three morphological elements: tidal flats in the basin, channels in the basin and the ebb-tidal delta. The same schematisation was used for setting up ASMITA models for the other inlet systems in the Dutch Wadden Sea (Bijsterbosch, Reference Bijsterbosch2003; Kragtwijk et al., Reference Kragtwijk, Zitman, Stive and Wang2004; Hinkel et al., Reference Hinkel, Nicholls, Tol, Wang, Hamilton, Boot, Vafeidis, McFadden, Ganopolski and Klein2013). According to this three-element model the critical rate of SLR can be calculated as follows (Bijsterbosch, Reference Bijsterbosch2003; Hinkel et al., Reference Hinkel, Nicholls, Tol, Wang, Hamilton, Boot, Vafeidis, McFadden, Ganopolski and Klein2013):
 $$\begin{equation}
{R_{\rm{c}}} = \frac{{{C_{\rm{E}}}}}{{\frac{1}{{{w_{{\rm{sf}}}}}} + \frac{{{A_{\rm{f}}} + {A_{\rm{c}}} + {A_{\rm{d}}}}}{{{\delta _{{\rm{od}}}}}} + \frac{{{A_{\rm{f}}} + {A_{\rm{c}}}}}{{{\delta _{{\rm{dc}}}}}} + \frac{{{A_{\rm{f}}}}}{{{\delta _{{\rm{cf}}}}}}}}
\end{equation}$$
$$\begin{equation}
{R_{\rm{c}}} = \frac{{{C_{\rm{E}}}}}{{\frac{1}{{{w_{{\rm{sf}}}}}} + \frac{{{A_{\rm{f}}} + {A_{\rm{c}}} + {A_{\rm{d}}}}}{{{\delta _{{\rm{od}}}}}} + \frac{{{A_{\rm{f}}} + {A_{\rm{c}}}}}{{{\delta _{{\rm{dc}}}}}} + \frac{{{A_{\rm{f}}}}}{{{\delta _{{\rm{cf}}}}}}}}
\end{equation}$$
Herein

For each of the tidal inlets in the Dutch Wadden Sea an ASMITA model has been set up. Based on the most up-to-date parameter settings, the critical rates of SLR for these tidal-inlet systems are calculated. The results of the calculation are given in Table 1, together with the used parameter settings. The calculated rates range from 6.3 and 7.0mma−1 for Texel and Vlie basin in the Western Wadden Sea to nearly 33mma−1 for the Pinkegat, part of Frisian Inlet.
Parameter settings for the ASMITA model and critical sea-level rise rates for the tidal basins in the Dutch Wadden Sea.

Van Goor et al. (Reference Van Goor, Zitman, Wang and Stive2003) presented their results as probability of drowning as function of the SLR rate, which has been obtained by considering all the relevant model parameters as stochastic variables. The probability distribution they presented for Ameland Inlet and Eierlandse Gat Inlet can also be derived for all the other inlets. On the basis of this probability distribution an uncertainty range for the critical rate of SLR can be given (see Table 2). In this table, the values correspond to the mean value plus or minus the standard deviation, so the low limit of the range corresponds to a probability of 15.865% for drowning. However, the values for Texel and Vlie Inlets appear to be unrealistic, as the lower limits are lower than the observed sedimentation rates in the past (Fig. 4). The observed sedimentation rates as given in Figure 4 in these two inlets correspond to about 30% probability for drowning. Therefore the range based on the 30% probability is also given in Table 2.
Uncertainty ranges of the calculated critical sea-level rise rates in mma−1.

Future development of the Dutch Wadden Sea
Introduction
The evolution of the Wadden Sea is determined by its sediment budget. The future development of the Dutch part of the Wadden Sea will still be influenced by the consequences of human interventions in the past (Elias et al., Reference Elias, Van der Spek, Wang and De Ronde2012). Moreover, its development will also depend on the future rise in sea level and future human interventions, including gas and salt production. For the future SLR, various scenarios have been presented (Vermeersen et al., Reference Vermeersen, Slangen, Gerkema, Baart, Cohen, Dangendorf, Duran-Matute, Frederikse, Grinsted, Hijma, Jevrejeva, Kiden, Kleinherenbrink, Meijles, Palmer, Rietbroek, Riva, Schulz, Slobbe, Simpson, Sterlini, Stocchi, Van de Wal and Van der Wegen2018), indicating that it is still difficult to predict the future SLR accurately. Moreover, the extraction of gas and salt from the subsurface of the Wadden Sea will continue in the coming decades. This locally causes additional subsidence of the seabed in some of the tidal basins (Fokker et al., Reference Fokker, Van Leijen, Orlic, Van der Marel and Hanssen2018) and adds to the relative SLR and thus the increase in accommodation space. Finally, future human interventions will have an impact on the sediment budget, although they will take the SLR development and the morphological response of the system into consideration. An essential future human activity is coastal nourishment.
The uncertainties in the sea-level development and the unpredictability of human interventions, the latter being partly dependent on the actually occurring SLR, make it difficult, if not impossible, to predict the future morphological development of the Wadden Sea system in detail. Hence, we will restrict ourselves to projections of the future morphological development for the SLR scenarios (Fig. 10; Table 3) presented by Vermeersen et al. (Reference Vermeersen, Slangen, Gerkema, Baart, Cohen, Dangendorf, Duran-Matute, Frederikse, Grinsted, Hijma, Jevrejeva, Kiden, Kleinherenbrink, Meijles, Palmer, Rietbroek, Riva, Schulz, Slobbe, Simpson, Sterlini, Stocchi, Van de Wal and Van der Wegen2018) and accounting for the subsidence (Table 4) predicted by Fokker et al. (Reference Fokker, Van Leijen, Orlic, Van der Marel and Hanssen2018), based on existing knowledge and insight rather than a new modelling study.
Sea-level change projections for the Dutch Wadden Sea (mean of stations Den Helder and Delfzijl) for three different emission scenarios. The uncertainty bands indicate the 5th to 95th percentile values. Based on data from Vermeersen et al. (Reference Vermeersen, Slangen, Gerkema, Baart, Cohen, Dangendorf, Duran-Matute, Frederikse, Grinsted, Hijma, Jevrejeva, Kiden, Kleinherenbrink, Meijles, Palmer, Rietbroek, Riva, Schulz, Slobbe, Simpson, Sterlini, Stocchi, Van de Wal and Van der Wegen2018). (Figure courtesy of Aimée Slangen.)

Future median rates of sea-level rise in mma−1 corresponding to three projections based on different emission scenarios and averaged for the locations Den Helder and Delfzijl. Based on data from Vermeersen et al. (Reference Vermeersen, Slangen, Gerkema, Baart, Cohen, Dangendorf, Duran-Matute, Frederikse, Grinsted, Hijma, Jevrejeva, Kiden, Kleinherenbrink, Meijles, Palmer, Rietbroek, Riva, Schulz, Slobbe, Simpson, Sterlini, Stocchi, Van de Wal and Van der Wegen2018).

Subsidence rates for the tidal basins of the Dutch Wadden Sea in mma−1, based on predictions by Fokker et al. (Reference Fokker, Van Leijen, Orlic, Van der Marel and Hanssen2018).

Changing tidal basin sediment budgets
An important conclusion from the study of Elias et al. (Reference Elias, Van der Spek, Wang and De Ronde2012) is that a large amount of sediment is still needed to regain morphological equilibrium in most tidal basins, and this amount will increase with an accelerating SLR. Due to an upper limit in sediment transport capacity, it is very unlikely that a morphological equilibrium in the western part of the Dutch Wadden Sea will be restored, apart from the fact that it is unknown how the Texel Inlet basin will evolve. Texel Inlet basin, with its large tidal channels and relatively small percentage of intertidal areas arranged along these channels, resembles elongated tidal basins such as the Eastern and Western Scheldt. In case this basin tended to evolve into a morphological status similar to those of the basins in the eastern Wadden Sea, a much larger sediment volume would be needed to reach morphological equilibrium.
The western Wadden Sea already has a large sediment deficit and is strictly speaking a ‘drowned’ basin. The large accommodation space in the combined basins of Texel and Vlie Inlets does not enhance the net annual sediment import; the system is transport-limited. The maximum value of the net annual import is not sufficient to decrease the sediment demand significantly. Acceleration in the rate of SLR will aggravate this situation.
The eastern part of the Dutch Wadden Sea, that is east of the tidal divide south of Terschelling (see Fig. 2), is currently accommodation-limited. An increase in sediment demand can be compensated by the amount of sediment stored in the island coasts and ebb-tidal deltas. Moreover, this amount can be enlarged by nourishing the island coastline with sand (see below). The lack of surface expression of the subsidence caused by gas extraction in the Frisian Inlet basin (see Krol, Reference Krol2017) shows that this increase in accommodation space is almost instantly filled in with sediment, which demonstrates this principle: an increase in demand triggers extra sedimentation. A significant increase in accommodation space / sediment demand will finally render this system transport-limited, since the sediment source is substantial in size and can and will be replenished with nourishments in case of unacceptable erosion.
The moment of change from accommodation limitation to transport limitation is crucial in the assessment of the future development of these Wadden Sea tidal basins. This is the moment when the SLR rate exceeds the critical value for drowning. Supply limitation is not likely to occur in the Dutch Wadden Sea area because of the coastal maintenance policy. The volume of the sediment source can be enlarged artificially with sand nourishments.
Sediment availability and coastal nourishment
The Wadden Sea is considered to be one of the last large tidal regions where natural forces have free rein without a dominating influence from human activities. However, for sustainable management of the Wadden Sea system in the future, it is important to recognise that natural processes can now only operate within fixed boundaries. Multiple large- and small-scale interventions have basically fixed the basin and barrier dimensions. On the gross scale, the Wadden Sea has proven resilient to the combined effect of these interventions and relative SLR over the last century, as little has changed in main inlet- and basin characteristics between the 1925 and the present bathymetry (Fig. 2). The large continuous sedimentation in the tidal basins over this period (over 600 million m3) and similar inlet and channel-shoal characteristics seem to indicate that the Wadden Sea can import sediment exceeding the present rates of relative SLR, given sufficient sediment supply. A major constraint, however, is future sediment availability. Recently, much of the basin infilling has been supplied by the ebb-tidal deltas (Texel Inlet in particular) that are limited in size and rapidly reducing in volume. Increased coastal and barrier-island erosion is to be expected. Repeated beach and shoreface nourishment and optional ebb-tidal delta nourishment to mitigate erosion, adding to the sediment budget of both islands and basins, might be used to sustain sufficient sediment availability, and allow the natural system to respond to future SLR. Without future human intervention it is unlikely that the adjacent barriers and coasts can supply sufficient sediment to regain and keep the Wadden Sea in dynamic equilibrium with relative SLR, unless barrier roll-over in the landward direction is accepted. With accelerating SLR, coastal nourishment will thus become an increasingly important human intervention in the Wadden Sea area.
Up until now, nourishments are intended for maintaining the coastline position and the sediment volume of the coastal foundation (Van der Spek et al., Reference Van der Spek, Elias, Lodder and Hoogland2015), and they are placed on the beach and at the shoreface of the barrier islands and mainland coast. However, the nourishment strategy may be adjusted in the future if, e.g., extra sand is needed to transport to the Wadden Sea in a supply-limited situation because of accelerated SLR. Currently, the possibility of nourishing the ebb-tidal deltas of the inlets is investigated in the Coastal Genesis 2.0 (Kustgenese 2.0) and SEAWAD projects.
‘Drowning’ of the intertidal flats
If the rate of relative SLR exceeds the critical rate for a basin (see Table 1), the maximum sediment import rate can no longer compensate the increase in accommodation space in a tidal basin and the intertidal flats will start to diminish in surface area and/or height (‘drowning’). When we increase the presented SLR scenarios with the subsidence estimates, together the relative SLR, and compare these rates to the critical rates calculated for the individual tidal basins, we can determine the moment the rate of relative SLR exceeds the critical rate.
According to scenario RCP2.6, the sea level will increase linearly by 5mma−1 until 2100 (Table 3). The additional subsidence will cause minor increases for some basins (Table 4). All rates of relative SLR are below the critical rate for drowning of the inlet systems in the Dutch Wadden Sea (see Table 5). Note that an annual increase of 5mm is 2.5 times the current observed average rate of 2mma−1! According to scenario RCP4.5, the critical SLR rate will be exceeded in 2030 for Vlie Inlet (Table 5). For the other basins the critical rate will not be exceeded until 2100 or later. According to scenario RCP8.5, the critical SLR rate will be exceeded for Texel Inlet (from 2050), Vlie Inlet (from 2030) and Ameland Inlet (in 2100) (see Table 5). For the other small tidal basins the critical rate will not be exceeded until after 2100.
Rates of total relative sea-level rise (mma−1) for the tidal basins of the Dutch Wadden Sea for the years 2030, 2050 and 2100, according to three different emission scenarios. Numbers in red fields indicate rates that exceed the critical rate as given in Table 1.
It should be emphasised that exceeding the critical rate of SLR in a basin does not mean that the total intertidal flat area in a tidal basin is then permanently inundated immediately. For example, according to scenario RCP4.5 (Table 3), the annual rate of SLR around 2050 will be 6.8mm, which is just above the critical rate of 6.3mma−1 in Vlie Inlet. The observed long-term sedimentation rate in the basin of Vlie Inlet is about 4.7mma−1 (see Fig. 4). If this long-term sedimentation rate remains the same (despite the changing hydraulic conditions), the SLR rate will exceed the sedimentation rate by less than 2mma−1 until 2100. As the tidal range in the basin is almost 2m, complete drowning will be achieved in about 1000 years. Similarly, according to the RCP8.5 scenario the SLR will exceed the sedimentation rate of 4.7mma−1 by about 3mma−1 in 2030, almost 5mma−1 in 2050 and 7.2mma−1 in 2100. The complete drowning will then be about three centuries from now. We can thus conclude that none of the tidal basins in the Dutch Wadden Sea is likely to be drowned by 2100, even if the most severe scenario of SLR comes true.
On the other hand, even without exceeding the critical rate for drowning, accelerated SLR will affect the development of the Wadden Sea. If the rate of SLR increases, an over-depth will develop in the basin that will drive an extra sediment import. In order to get an indication of the effects of the three sea-level scenarios on the intertidal morphology, we evaluated the extra over-depth due to relative SLR. We assumed a sedimentation rate of 4.5mma−1, which is more or less the long-term averaged rate of observed sedimentation in the western part as well as in the eastern part of the Dutch Wadden Sea. By definition, the surface area of the intertidal flats is the difference between the area at High Water and that at Low Water according to the hypsometric curve in Figure 3. A projection for the loss of the area of intertidal flat due to SLR can be estimated by heightening the Low Water by the estimated over-depth (see Fig. 11). According to the relation shown in Figure 11, the Dutch Wadden Sea would be practically drowned at an extra over-depth of more than 1m. Table 6 gives the percentage loss of intertidal flat area in the Dutch Wadden Sea corresponding to the estimated extra over-depth for the three scenarios.
Relation between loss of intertidal flat area in the Dutch Wadden Sea and rise of the Low Water level, derived on the basis of the most recent hypsometric curve (2012) assuming the present Low Water level at −1m NAP.
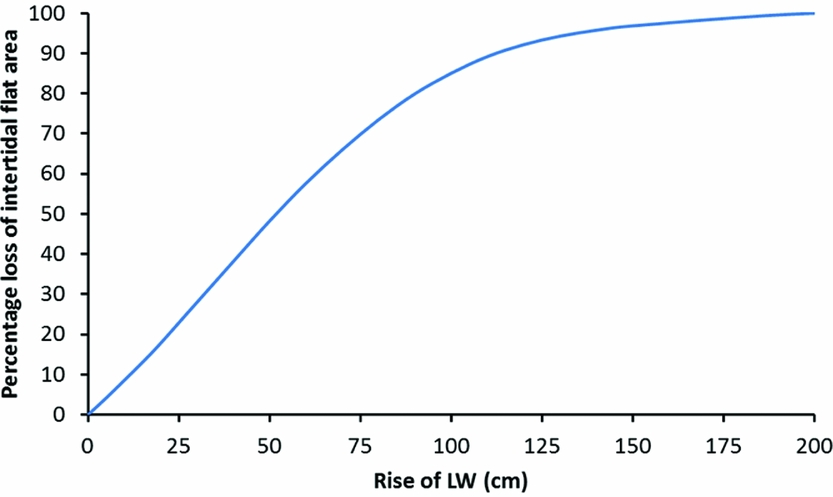
Development of extra over-depth and the corresponding percentage loss of intertidal flat area due to sea-level rise according to the three scenarios.

It should be noted that it is not likely that a basin will drown by an even spreading of the sediment deficit over the intertidal area. Sand is imported via the tidal inlet, so the part of the basin close to the inlet will be receiving and passing on the full flux of sand. Hence, this area will be the least vulnerable for sediment deficit. Concentrations of suspended sediment are high along the boundaries of a tidal basin, and under quiet conditions sedimentation can be substantial. This renders the middle part of the basin the most drowning-prone part. However, internal redistribution of especially sand can lead to disappearance of tidal flats in one place and sedimentation and expansion in other parts of the basin.
Lessons from the past
A first impression of the future state of the tidal flats in case of a sediment deficit can be distilled from field evidence. Van der Spek & Beets (Reference Van der Spek and Beets1992) published a conceptual model for tidal basins with a small sediment supply, small in comparison with the growth of accommodation space in the basin. They based this model on the Holocene evolution of former tidal basins in the western part of the Netherlands. Under high rates of SLR (≥0.75m/century), prior to 7000 BP (BP: years before present), sediment supply was by no means able to fill the growth of accommodation space. Sandy intertidal flats occurred in flood-tidal deltas that were restricted to the vicinity of tidal inlets and the larger tidal channels. Channels showed only a limited lateral migration. Sand was deposited in the tidal flats along the channels, separating the channels from subtidal inter-channel areas in which mud deposition prevailed.
With the decline in the rate of SLR after 7000 BP, sediment supply started to gain on the increase in accommodation space, leading to expansion of the flood-tidal deltas at the expense of the inter-channel areas. When the rate of SLR had slowed down to c.0.15m/century after 5500 BP, the sediment supply finally was sufficient to fill up the entire basin. The tidal flats expanded further and the inter-channel areas were filled up with sand and mud.
Although the above-sketched evolution of an infilling tidal basin cannot be applied straight away to the Wadden Sea in case of a deficient sediment supply (see the discussion in Van der Spek & Beets, Reference Van der Spek and Beets1992), it illustrates the differences in the geomorphology of a tidal basin under those conditions: tidal flats restricted to the vicinity of tidal inlet and channels, the supply routes of the sand, and a lagoonal inter-channel area where fine-grained suspended sediments accumulate. Moreover, vertical accretion rates of the tidal basin deposits can be calculated using radiocarbon-dated levels in the basin fill, to get estimates of maximum values. The average accretion rate for sandy tidal flats is 0.5m/century, the maximum value is 0.6m/century. Sediment accumulation in the inter-channel lagoon was 0.9m/century on average, with a maximum rate of 1.6m/century (A. Van der Spek, pers. comm., Reference Van der Wegen2009).
What will the future Wadden Sea look like?
For the near future, up to 2030, the effect of accelerated SLR will be limited and hardly noticeable. Over the long term, up to 2100, the effect appears to depend on the scenarios (Table 4). According to scenario RCP2.6, there will be hardly any effect due to SLR until 2100, whereas according to scenario RCP8.5 the effect will be noticeable already in 2050. Vermeersen et al. (Reference Vermeersen, Slangen, Gerkema, Baart, Cohen, Dangendorf, Duran-Matute, Frederikse, Grinsted, Hijma, Jevrejeva, Kiden, Kleinherenbrink, Meijles, Palmer, Rietbroek, Riva, Schulz, Slobbe, Simpson, Sterlini, Stocchi, Van de Wal and Van der Wegen2018) also present other, more extreme scenarios, e.g. the scenario according to De Conto & Pollard (Reference De Conto and Pollard2016) predicting a SLR of about 1.7m in 2100. If such an extreme scenario comes true, the Wadden Sea will be practically drowned before 2100.
Using the aforementioned conceptual model for channel–shoal interaction, we can try to deduce what the consequences of inadequate sediment supply for the intertidal morphology can be. The shoal edge is the most dynamic part where breaking waves erode and tidal flow supplies sand. A structurally decreased sediment supply will result in net erosion of these edges since the wave activity in the basin will not be directly influenced by the changes. Also, the higher parts of the shoal will experience net erosion since only part of the sand removed by waves will be replaced. The eroded sand will end up in the tidal channels and is in principle available for resedimentation on the shoals. Where the sand will end up depends on the local energy conditions that are not clear beforehand. However, it is likely that tidal flats close to the tidal inlet will be influenced the least, since the net supply from outside the basin will pass through there and the balance between supply and erosion is not likely to change. This is in accordance with the model for Holocene tidal basins under the influence of high rates of SLR that was discussed above: sandy intertidal flats near the inlet and along the main channels, resembling a flood-tidal delta, and a subtidal lagoon further landwards where predominantly mud accumulates. Whether the latter situation will develop in the future Wadden Sea is not clear. There is no reason to assume that future concentrations of suspended matter will decrease, but the accumulation of fine-grained material depends on the energy level. The present-day Wadden Sea comprises comparatively few sheltered areas where mud can settle, since these areas have been reclaimed in the past. This results in a larger impact of the predominantly westerly winds on the hydraulic conditions in the basins. An increase in average depth in the basins and the expansion of open water will render them more susceptible for local wave-growth and wind-driven currents.
Discussion
Uncertainties in the projections
The future state of the Wadden Sea depends on two factors, the relative SLR and the sedimentation in the tidal basins. Both factors are uncertain in the future and therefore the presented projections contain uncertainties. The uncertainties will grow with time. For 2030 we can conclude, with negligible uncertainty, that the state of the Wadden Sea will be largely similar to the current state. The projected change in, e.g., intertidal flat area will not be measurable. For 2050, the projected changes will still be very small, but in the worst-case scenario the changes will be noticeable. For 2100 the uncertainties in the projections are such that it is hard to draw any sensible conclusions about the state of the Wadden Sea then.
The very uncertain development of the SLR will constitute the largest contribution to the uncertainty about the future state of the Wadden Sea. Depending on the scenarios of the sea-level development the projected intertidal flat area in 2100 will vary from practically unchanged (for the RCP2.6 scenario) to completely lost (for the De Conto & Pollard (Reference De Conto and Pollard2016) scenario). The uncertainties of future SLR are discussed by Vermeersen et al. (Reference Vermeersen, Slangen, Gerkema, Baart, Cohen, Dangendorf, Duran-Matute, Frederikse, Grinsted, Hijma, Jevrejeva, Kiden, Kleinherenbrink, Meijles, Palmer, Rietbroek, Riva, Schulz, Slobbe, Simpson, Sterlini, Stocchi, Van de Wal and Van der Wegen2018). We focus here further on the uncertainties in the projected sedimentation.
An important indicator for the state of a tidal basin in the Wadden Sea is whether or not the critical rate of SLR for drowning is exceeded. An extended discussion on the uncertainties in the calculation of this critical SLR rate is given by Van Goor et al. (Reference Van Goor, Zitman, Wang and Stive2003), who tackled the problem by using stochastic modelling. In addition, there is uncertainty concerning the assumption that every tidal inlet system is an isolated system. In reality, water and sediment exchange occurs across the internal boundary between the back-barrier basins of two neighbouring inlets, i.e. the tidal divide or tidal watershed. Nevertheless, the neglect of these exchanges is an acceptable assumption for most tidal basins as the present tidal divides are relatively high with respect to mean sea level (Van de Kreeke et al., Reference Van de Kreeke, Brouwer, Zitman and Schuttelaars2008). However, a rise in sea level can change this situation, especially if the critical rate of one of the basins is exceeded. It is highly uncertain if the accretion of the tidal divides can follow the rise in mean water level, and what the consequences are if the height of a tidal divide falls behind. Note that at present there is no distinct watershed between the basins of Texel and Vlie Inlets, which allows for larger water and sediment exchanges between these basins and increases the uncertainty in the long-term accretion rates for these basins.
The sedimentation rate in the Wadden Sea used in the projections is extrapolated on the basis of observations since 1926. As the observed sedimentation is mainly caused by the closure of the Zuiderzee and the Lauwerszee (Elias et al., Reference Elias, Van der Spek, Wang and De Ronde2012), the extrapolation may cause an overestimation of the future sedimentation rate, because the effects of such human interventions are strongest directly after their completion. However, the disturbance of the morphological equilibrium caused by the closure of the Zuiderzee is still far from damped out, which explains the more or less constant rate of sedimentation according to the observations. Furthermore, the accelerated SLR will likely cause higher sedimentation rates in the Wadden Sea. This effect is not taken into account in the projections.
Sedimentation rates differ between the various tidal basins and vary strongly within a tidal basin (see e.g. Fig. 2). Including the effects of spatial variation in morphological changes requires an extended modelling study which is beyond the scope of this paper. The different developments of the tidal inlets responding to various sea-level scenarios and the anticipating local human activities can be evaluated using ASMITA models. Predicting future spatially varying sedimentation–erosion patterns within tidal basins requires process-based morphodynamic modelling, which is hardly feasible at present, especially for the long-term (2050 and 2100) predictions. It may be argued that projecting the averaged sedimentation rate also on the intertidal flat can be too optimistic, as an important part of sedimentation in the past occurred in the channels impacted by the closures. However, the observations also show that the long-term development of the intertidal flats follows the SLR, even in the Eierlandse Gat basin which as a whole has been eroding. How the intertidal flats in the Wadden Sea will respond to accelerated SLR still requires more fundamental research.
Uncertainty in the evaluation of ‘drowning’ of intertidal flats is also introduced by the assumption that the Low Water level will rise at the same rate as MSL. In reality, extra over-depth caused by accelerated SLR will also influence the tidal propagation in the Wadden Sea. A larger over-depth in the future will cause an increase in tidal range that may result in a smaller rise of the LW than the HW and MSL. This assumption thus causes a pessimistic projection. This effect can be evaluated by hydrodynamic modelling.
Implications for managing gas and salt extraction
An important management issue in the Dutch Wadden Sea is gas and salt extraction. These extractions cause subsidence of both land and seabed which are a contribution to relative SLR. Extraction permits require that no significant environmental impact, mainly measured by the loss of intertidal area, occurs. It is therefore required that the total relative SLR, i.e. subsidence plus SLR, does not exceed the critical, predefined limit. (This externally controlled production principle is in the Netherlands known as the ‘Hand on the Tap’ control; De Waal et al., Reference De Waal, Roest, Fokker, Kroon, Muntendam-Bos, Oost and Van Wirdum2012.) Ever since the introduction of this control principle, the acceptable or critical limit has been the subject of discussion (see e.g. Hulscher et al., Reference Hulscher, Meire, Rienstra and Urai2016). It is evident that this limit should not be the same as the critical SLR rate for drowning as discussed in the previous section, as at that limit significant environmental damage would occur in the long term.
In Figure 12 the results of a single-element ASMITA model are shown. If the SLR rate is below approximately 40% of the critical rate, the difference between the linear and nonlinear model is negligible (see Fig. 9). Based on this observation, Wang et al. (Reference Wang, Cleveringa and Oost2017) suggested that 40% of the critical SLR rate can be used as the limitation for relative SLR in managing gas extraction in Frisian Inlet (Pinkegat and Zoutkamperlaag). The underlying reason is that according to the linear model the cumulative effect of subsidence, represented by the time integral of the deviation from equilibrium volume, depends on only the total subsidence and not on the distribution of the subsidence in time: subsidence with twice the rate during half of the time results in the same cumulative effect (Fig. 12, left panel). If the relative SLR is larger than the 40% limit, the nonlinear model applies. The latter shows that both the maximum instantaneous effect and the cumulative effect will become larger if the total subsidence is concentrated in a shorter period (Fig. 12, right panel).
Volume effect of temporal relative sea-level rise as function of time at low rate (left; linearised model) and high rate (right; nonlinear model) according to the single-element ASMITA model. T is the morphological timescale.

The suggested 40% limit is only applicable for basins not too far deviated from morphological equilibrium, e.g. the Pinkegat. In basins which are already far from morphological equilibrium, the consideration about the applicability of linear models does not make sense. For example, Texel and Vlie Inlets already have very large sediment deficits due to the damming of the Zuiderzee. As a consequence, the average sedimentation rate in these basins is close to the critical rate for drowning. An increase of sediment demand due to relative SLR in these basins is negligible compared to the existing sediment demand, and therefore will have a negligible influence on the sedimentation rates.
Recommendations for future research
Sediment volumes and nourishment strategy
The future development of the Wadden Sea system will have implications for various management issues. For coastal maintenance, an increase in required nourishment volumes is expected. Although the nourishment volume is easy to adapt to uncertain developments, changes in the nourishment strategy anticipating the increasing nourishment volume and to possibly changing purposes need to be prepared. For the conservation of the nature values of the Wadden Sea, the uncertainty in the future development is a bigger problem. Continuity in sufficient sediment availability at the ebb-tidal deltas and along the coasts of the barrier islands should be considered as a prerequisite. Anticipating accelerated SLR, the development of nourishment strategies that will increase sediment import to the Wadden Sea is recommended.
Monitoring
For sustainable management of the Wadden Sea system, monitoring of the morphological and sedimentological development is essential. Effective monitoring to detect the relevant changes is challenging because SLR as well as the morphological development concern slow, long-term processes.
Morphodynamic analysis
The essential differences between the western and eastern Wadden Sea are described as, respectively, transport capacity-limited and accommodation-limited systems. An analysis and quantification of the relevant processes and mechanisms in both systems will improve the understanding and, subsequently, modelling and prediction of the sediment fluxes in these systems.
Next steps to improve predictions
More accurate predictions for the future development of the Wadden Sea system are required for all management issues. The following investigations are recommended to improve the predictions:
Integrated modelling of long-term morphodynamics
Carry out an integrated modelling study by combining both aggregated and process-based morphodynamic models. (a) The consequences of the various SLR scenarios for the large-scale and long-term development of each of the tidal inlet systems can be simulated with an aggregated model (such as ASMITA). However, these models were set up at the end of the last century. Improvements of the models have been suggested recently (Townend et al., Reference Townend, Wang, Stive and Zhou2016a,b). Therefore it is recommended that these suggestions be considered and the relevant ones implemented. The models should then be recalibrated using up-to-date field data, before simulating the future scenarios. (b) Short-term, detailed developments and residual sediment transports, including transport-limiting factors, can be investigated with process-based models such as Delft3D. For a selected tidal inlet system the process-based model can also be used for long-term simulations. Compared to the present projections, such an integrated modelling study will provide more accurate and more detailed information on the development of the channels and tidal flats in the various basins and on the sediment supply from the North Sea coast to the Wadden Sea.
Channel–shoal interaction
Carry out research on channel–shoal interaction using schematised process-based (idealised) modelling. Channel–shoal interaction is still a weak point in process-based morphodynamic modelling. The processes and mechanisms underlying the aforementioned conceptual model need to be elaborated, e.g. by including the formation and vertical accretion to intertidal levels of shoals, and to be translated into (idealised) model formulations. After verification against real-world data, these models can be used to investigate how the development of intertidal shoals will be influenced by accelerated SLR. The results of such an investigation will be essential for predicting the future development of the Wadden Sea, amongst others the changes in tidal-flat area in different parts of the basin, and for improving morphodynamic models for research to understand the evolution of tidal basins in general.
Development of low-water levels
Carry out a study on the development of the LW levels in the Wadden Sea. Up to now, SLR studies have focused predominantly on the development of MSL and HW. However, the development of LW will be much more relevant for the change of the intertidal flat area. First, the historical water-level data should be analysed with special attention to the development of low-water levels. Then hydrodynamic simulations for the historic situations can be carried out to understand the effects of SLR and morphological changes on the tidal propagation and the implications for flooding of the intertidal flats. Subsequently, the various future scenarios can be investigated by modelling.
Tidal divides
Carry out research on the changes in transports and morphodynamics of the tidal divides. The development of the tidal divides will have substantial influence on the response of the individual tidal basins and the Wadden Sea as a whole to accelerated SLR. Therefore, research elaborating on the work of Vroom (Reference Vroom2011, see also Wang et al., Reference Wang, Vroom, Van Prooijen, Labeur and Stive2013) is needed to understand the development of these divides in the past, to predict the development for the future scenarios and to assess possible changes in the interaction between neighbouring tidal basins.
Acknowledgements
The compilation of this position paper would have been difficult if not impossible without the following ongoing research programmes at Deltares in cooperation with Rijkswaterstaat: KPP Knowledge Development Morphology Wadden Sea, Coastal Genesis 2.0 (Kustgenese 2.0) and KPP Coastal Management and Maintenance (B&O Kust). Contributions from colleagues at Deltares and Rijkswaterstaat via discussions at formal and informal meetings are sincerely acknowledged. The authors thank three anonymous reviewers for their suggestions and Aimée Slangen for providing Figure 10. This paper is mainly based on an extensive review of the literature on tidal inlet systems in general and the Wadden Sea in particular by E.P.L.E., A.J.F.S. and Z.B.W. The hypotheses on the present state of the Wadden Sea sediment-sharing system are part of (unpublished) PhD research by Q.J.L. Z.B.W. run the ASMITA models to calculate critical sedimentation rates. All authors participated in the manuscript preparation.


 Open access