

Depression has a community prevalence of 10% (Reference Singleton, Bumpstead and O'BrienSingleton et al, 2001), and is associated with physical morbidity and social impairment (Reference Spitzer, Kroenke and LinzerSpitzer et al, 1995; Reference Cassano and FavaCassano & Fava, 2002). By 2020, depression is expected to become the second highest cause of disease burden worldwide (Reference Murray and LopezMurray & Lopez, 1997). The annual cost of depression in England alone was estimated at £9 billion in 2000, of which 90% was attributable to an estimated 110 million lost working days (Reference Thomas and MorrisThomas & Morris, 2003). Unmet need for treatment (Reference Bebbington, Brugha and MeitzerBebbington et al, 2000; Reference Singleton, Bumpstead and O'BrienSingleton et al, 2001) is even more apparent when considering only cases of severe disorder (Reference Demyttenaere, Bruffaerts and Posada-VillaDemyttenaere et al, 2004; Reference Wang, Lane and OlfsonWang et al, 2005). There is a socioeconomic gradient in the prevalence of depression (Reference Lorant, Deliège and EatonLorant et al, 2003), and those with the lowest socio-economic status might also be the least likely to receive and/or adhere to effective treatment (Reference AchesonAcheson, 1998). The aim of this study was to quantify socio-economic inequalities in the delivery of and adherence to treatments of proven clinical effectiveness. We hypothesised that there would be an ‘inverse care law’ – a statistically significant association between low socio-economic status and (under-) treatment of depression after adjusting for the severity of depressive episode.
METHOD
Study design and setting
The study was a nested case–control study which received ethical approval from the London Multi-Centre Research Ethics Committee. General practices in England and Wales belonging to the Medical Research Council's General Practice Research Framework were approached on the basis of location (London and the South East; Trent, Eastern and West Midlands; South West; North, Yorkshire and North West; and Wales), socio-economic deprivation (using Jarman score for practice, banded as high, medium or low), and practice size (single-handed, 2–3 permanent general practitioner principals and ≥4 principals).
Participants
Consecutive attendees aged 18–75 years at participating general practices with an appointment to see a doctor, nurse or other professional about themselves were approached in the waiting room. Exclusion criteria included intellectual disability, cognitive impairment that would prevent completion of the study assessments and inability to communicate in English.
Measures
Ascertainment of ICD–10 depressive episodes in preceding 12 months
Individuals who had experienced an ICD–10 depressive episode in the 12 months before interview were identified using a two-stage procedure. Attendees completed a 10-item screening questionnaire (see data supplement to online version of this paper) containing items from the depression section of the 12-month Composite International Diagnostic Interview (CIDI; World Health Organization, 1997). Two stem questions asked whether in the past 12 months the respondent recalled 2 weeks or longer ‘when nearly every day you have felt sad, empty, or depressed for most of the day?’ and ‘when you lost interest in most things like work, hobbies and other things you usually enjoyed?’ Those who answered ‘yes’ to either question were asked to complete a further eight items concerning ‘the time (or times) in the past 12 months when you felt sad, empty, or depressed or when you lost interest in most things nearly every day for 2 weeks or longer’. These items (with yes/no answers) used CIDI items covering fatigue, appetite, weight loss, insomnia, concentration, and feelings of worthlessness, inferiority and guilt. The screening score (range 0–10) was obtained by counting the number of ‘yes’ responses.
A small pilot study compared questionnaire responses (in a general practice waiting room) with the 12-month CIDI depression section administered by telephone approximately 1 week later. Results suggested that an optimum balance between sensitivity and specificity was likely to be achieved using a cut-off of >4 (out of 10), including at least one positive response to the first two (stem) questions. The cut-point was chosen to maximise the positive predictive value and hence minimise false-positive second-stage interviews. Those scoring above this level were invited to participate in an interview with a research nurse. At interview, the nurse established the occurrence of one or more episodes of depression using the depression section from the 12-month CIDI. Severity was rated for the time that most symptoms were present concurrently, using the research version of ICD–10 (World Health Organization, 1993).
Treatments for depression interview
Sources and types of help, general practitioner (GP) consultations, and receipt of and adherence to treatments were assessed using a structured interview designed for this study. This was administered after the depression section of the 12-month CIDI. Since many people do not endorse the term ‘depression’, the latter begins by eliciting core symptoms (low mood, loss of interest and/or fatigue) and then referring to these as ‘problems’. The period about which treatment questions were asked was anchored by identifying the month in the preceding year when the respondent had the ‘largest number of problems [symptoms] at the same time’. Using CIDI terminology, participants identified the months and years for the onset and offset of the depressive episode.
Participants were reminded about the ‘problems’ they had described in the preceding year and the month when these were at their worst. They were first asked ‘whom did you turn to for help?’, and up to three responses were recorded. Participants were then asked if they had spoken with their GP about these problems, about the timing of the first consultation in respect of this episode and for an estimate of the number of such consultations prior to interview.
Treatments were enumerated, starting with medication. Using a show card with names of all antidepressants listed in the British National Formulary (http://www.bnf.org), participants were asked to identify up to three drugs that they had been prescribed. For each drug mentioned, participants were asked about dose, duration of adherence and how often they remembered to take this. Participants were asked about psychological and other treatments. They were reminded of the month when the index episode had begun, and were asked if they had been referred (by someone else or themselves) to a counsellor (within or outside the practice), psychiatrist, psychologist, psychotherapist or psychoanalyst, or other mental health professional. Taking each in turn, participants were asked how many sessions they had attended, whether they were still attending and reasons for termination.
Criteria for evidence-based treatments
Pharmacological treatment met evidence-based standards where a participant reported having taken a therapeutic dose of an antidepressant for at least 4 weeks at an average frequency of ≥4 days per week. Therapeutic doses were based on guidance from the British National Formulary: ≥75 mg/day of dothiepin or amitriptyline, ≥20 mg/day of fluoxetine or paroxetine, ≥75 mg/day of venlafaxine and ≥50 mg/day of sertraline. There is little evidence about how many sessions of psychological treatment are minimally sufficient. We therefore ruled that this treatment met evidence-based standards where a participant reported referral to a counsellor, psychologist or psychotherapist, and that either: (a) they had attended ≥3 sessions; (b) the treatment had been completed (according the reason give for termination); or (c) they were still attending.
Assessment of socio-economic status
Socio-economic status was assessed using questions about employment status, housing tenure, car access, education and financial strain. The latter was assessed by means of a widely used survey question, the response to which is highly predictive of both current and future psychiatric morbidity (Reference Weich and LewisWeich & Lewis, 1998).
Analysis
Analyses were undertaken using survey commands within Stata which adjust standard errors and χ2 statistics for clustering (auto-correlation) within practices. For individuals with a confirmed episode of ICD–10 depression in the 12 months before interview, we use logistic regression to calculate unadjusted odds ratios (with 95% confidence intervals) for the associations between socio-economic variables (employment status, housing tenure, car access, education and financial strain) and receipt of and adherence to evidence-based treatments. These associations were subsequently adjusted for confounding by age, gender, depression severity and other socio-economic variables.
RESULTS
Thirty-six general practices took part; 13 were located in the Trent, Eastern and West Midlands regions, 9 in the North, Yorkshire and the North West, 7 in the South West, 6 in London and the South East, and 1 practice was in Wales. Excluding the ineligible, 7718 individuals were asked to take part in screening and 7271 (94.2%) completed the waiting room questionnaire; 2211 (30.4%) scored above the inclusion threshold for interview and 975 individuals (44.1% of those with positive screen results) were interviewed. No statistically significant difference was found in screening score between those who took part in the interview and those who declined or were not available (mean difference –0.04, 95% CI –0.18 to 0.11, P = 0.61).
We identified 866 individuals (88.8% of those interviewed) who had experienced an ICD–10 depressive episode in the preceding 12 months, of whom 812 (93.8%) endorsed all three ICD–10 ‘core’ depressive symptoms (low mood, anhedonia and fatigue). Twelve individuals (1.4%) had experienced a mild depressive episode, 175 (20.2%) a moderate episode and 679 (78.4%) a severe depressive episode. Results are presented for these individuals, with mild and moderate episodes combined owing to small numbers among the former.
Among those with a confirmed episode of ICD–10 depression in the 12 months before interview, 72.9% were women. The mean age of the sample was 46.0 years (s.e. = 0.71), with men (mean age 49.3 years) being slightly older than women (44.8 years, P = 0.001). The characteristics of the study sample are shown in Table 1.
Characteristics of the study participants with mild/moderate and severe ICD—10 depressive episode in 12 months prior to interview (n=866)1
| Mild/ moderate (n=187)1 | Severe (n=679)1 | P | |
|---|---|---|---|
| Female gender, n (%) | 121 (65.8) | 498 (74.8) | 0.04 |
| Age, years: mean (s.d.) | 50.7 (13.9) | 44.0 (13.6) | <0.0001 |
| Screen score: mean (s.d.) | 6.2 (1.3) | 7.5 (1.8) | <0.0001 |
| Marital status, n (%) | |||
| Single | 17 (9.2) | 108 (16.2) | 0.002 |
| Married | 134 (72.4) | 388 (58.4) | |
| Separated/divorced/widowed | 34 (18.4) | 169 (25.4) | |
| Employment status, n (%) | |||
| Employed | 98 (53.0) | 333 (50.2) | 0.06 |
| Unemployed | 4 (2.2) | 35 (5.3) | |
| Not seeking work | 60 (32.4) | 177 (26.7) | |
| Inactive owing to health | 23 (12.4) | 119 (17.9) | |
| Rented accommodation, n (%) | 49 (26.5) | 218 (32.9) | 0.10 |
| No car access, n (%) | 25 (13.4) | 122 (18.0) | 0.16 |
| Education, n (%) | |||
| A level plus | 50 (27.6) | 187 (28.4) | 0.33 |
| GCSE or equivalent | 75 (41.4) | 305 (46.3) | |
| No qualifications | 56 (30.9) | 167 (25.3) | |
| Financial strain, n (%) | |||
| Comfortable/alright | 133 (72.7) | 423 (63.9) | 0.04 |
| Difficult or very difficult | 50 (27.3) | 239 (36.1) |
Treatments for depression
There were 391 participants (45.2%) who mentioned consulting a ‘doctor’ or ‘GP’ (excluding psychiatrist or other specialist). About three-quarters (n=294, 75.2%) of those who spontaneously reported consulting their GP concerning the index episode of depression also reported receiving a prescription for antidepressant medication, whereas 108 (27.6%) were offered psychological treatment. Data about medication dose and adherence were available for 272 (92.5%) of the former, of whom 199 (68.4%) received and adhered to pharmacological treatment in keeping with evidence-based criteria. Of the 108 people who consulted their GP and were offered psychological treatment, 68 (63%) met evidence-based criteria for adherence.
There were 447 of 866 individuals (51.6%) with a confirmed ICD–10 depressive episode in the 12 months before interview who reported receiving at least one prescription for an antidepressant drug. Dose and adherence data were available for 405 of these (90.6%), of whom 294 (72.6%) received and adhered to this treatment in keeping with evidence-based criteria. The dose of medication was judged to be sub-therapeutic for 37 (9.1%) individuals and adherence was unsatisfactory among a further 74 (18.3%). Among all of those with complete data (n=824), the rate of receipt of and adherence to evidence-based pharmacotherapy was 35.7% (294 of 824). A more conservative estimate based on the total sample of confirmed depressive episodes was 33.9% (294/866).
Of the sample of 866 individuals with an ICD–10 depressive episode, 160 (18.5%) reported receipt of psychological therapies for the index depressive episode, of whom 100 (62.5% of those in receipt of psychological treatment, and 11.5% of the sample) met minimum criteria for evidence-based psychological treatment. In total, 332 individuals with ICD–10 depressive episodes (38.3% of the sample) reported receipt of and adherence to evidence-based treatment (either pharmacological or psychological). This figure rose to 41.5% (n=282) among those with a severe depressive episode.
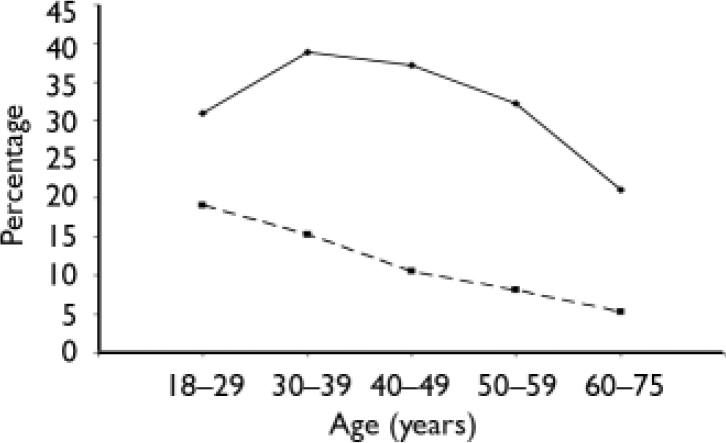
Women, the never married and those with more education were significantly more likely to receive evidence-based treatment (Table 2). Gradients were greatest for psychological treatment. The association between age and evidence-based treatment varied with modality (Fig. 1). Those aged over 60 years were least likely to receive either type of treatment. There were no statistically significant associations between unemployment, car access, or housing tenure and the likelihood of reporting receipt of evidence-based treatment. There was a statistically significant association between greater financial strain and receipt of evidence-based psychological treatment. Those not working because of ill health had high rates of evidence-based treatment.
Proportion of individuals with ICD–10 depressive episode in past 12 months in receipt of evidence-based treatments; ![]() , antidepressant; ––––, psychological treatment.
, antidepressant; ––––, psychological treatment.
Associations between receipt of treatments meeting minimum evidence-based criteria and depression severity and characteristics of study participants
| Antidepressant | P | Psychological treatment | P | Either treatment | P | |
|---|---|---|---|---|---|---|
| OR 95% CI | OR 95% CI | OR 95% CI | ||||
| Female (v. male) | 1.66 (1.14-2.41) | 0.01 | 2.19 (1.19-4.04) | 0.01 | 1.81 (1.30-2.51) | 0.001 |
| Age 60-75 years1 | 0.68 (0.40-1.14) | 0.14 | 0.25 (0.10-0.61) | 0.003 | 0.55 (0.35-0.85) | 0.009 |
| Severe depressive episode2 | 2.18 (1.60-2.96) | <0.001 | 1.63 (0.98-2.72) | 0.06 | 1.93 (1.35-2.77) | 0.001 |
| Marital status (v. married) | ||||||
| Single | 1.41 (0.93-2.14) | 0.10 | 1.62 (0.98-2.69) | 0.06 | 1.51 (1.01-2.24) | 0.04 |
| Separated, divorced or widowed | 1.28 (0.92-1.79) | 0.14 | 1.03 (0.57-1.89) | 0.91 | 1.22 (0.87-1.70) | 0.24 |
| Employment (v. employed) | ||||||
| Unemployed | 0.86 (0.43-1.72) | 0.66 | 1.20 (0.43-3.35) | 0.72 | 1.00 (0.47-2.13) | 0.99 |
| Not seeking work | 1.05 (0.73-1.52) | 0.80 | 0.71 (0.32-1.57) | 0.39 | 1.00 (0.69-1.48) | 0.97 |
| Inactive owing to health | 1.75 (1.09-2.81) | 0.02 | 1.83 (0.93-3.60) | 0.08 | 1.68 (1.07-2.64) | 0.03 |
| Rented accommodation3 | 1.00 (0.77-1.30) | 0.99 | 0.97 (0.71-1.33) | 0.83 | 1.02 (0.79-1.34) | 0.85 |
| No car access | 0.89 (0.62-1.29) | 0.54 | 0.79 (0.46-1.38) | 0.41 | 1.01 (0.70-1.46) | 0.95 |
| Financial strain4 | 1.30 (1.01-1.68) | 0.04 | 1.66 (0.97-2.85) | 0.06 | 1.38 (1.07-1.78) | 0.01 |
| Education (v. A level plus) | ||||||
| GCSE or equivalent | 0.90 (0.67-1.22) | 0.50 | 0.94 (0.54-1.64) | 0.82 | 0.85 (0.61-1.18) | 0.32 |
| No qualifications | 0.81 (0.54-1.23) | 0.32 | 0.55 (0.34-0.89) | 0.02 | 0.69 (0.47-1.02) | 0.07 |
After adjusting for depression severity, age and gender, no association between socio-economic status and evidence-based treatment reached statistical significance (Table 3). Female gender, severe depressive episode and not working because of ill health were independently associated with receipt of either antidepressant and/or psychological treatment meeting minimum evidence-based criteria, to a statistically significant degree. Educational gradients in treatment receipt were largely unaffected, but did not reach statistical significance.
Associations between receipt of treatments meeting minimum evidence-based criteria and depression severity and characteristics of study participants, adjusted for the other variables
| Antidepressant | P | Psychological treatment | P | Either treatment | P | |
|---|---|---|---|---|---|---|
| OR 95% CI | OR 95% CI | OR 95% CI | ||||
| Female (v. male) | 1.71 (1.12-2.60) | 0.01 | 2.31 (1.18-4.49) | 0.02 | 1.87 (1.27-2.75) | 0.002 |
| Age 60-75 years1 | 0.91 (0.49-1.69) | 0.76 | 0.47 (0.17-1.27) | 0.13 | 0.78 (0.45-1.35) | 0.36 |
| Severe depressive episode2 | 1.91 (1.35-2.70) | 0.001 | 1.20 (0.69-2.11) | 0.51 | 1.61 (1.11-2.32) | 0.01 |
| Employment (v. employed) | ||||||
| Unemployed | 0.80 (0.37-1.72) | 0.55 | 1.06 (0.42-2.63) | 0.91 | 0.93 (0.43-2.03) | 0.86 |
| Not seeking work | 1.31 (0.87-1.99) | 0.19 | 0.77 (0.38-1.55) | 0.45 | 1.28 (0.83-1.97) | 0.26 |
| Inactive owing to health | 1.98 (1.29-3.04) | 0.003 | 2.28 (1.26-4.13) | 0.008 | 1.99 (1.32-3.00) | 0.002 |
| Financial strain3 | 1.21 (0.95-1.53) | 0.12 | 1.50 (0.91-2.48) | 0.11 | 1.29 (0.97-1.70) | 0.08 |
| Education (v. A level plus) | ||||||
| GCSE or equivalent | 0.84 (0.62-1.14) | 0.25 | 0.83 (0.49-1.40) | 0.48 | 0.78 (0.56-1.09) | 0.14 |
| No qualifications | 0.81 (0.50-1.32) | 0.39 | 0.61 (0.34-1.11) | 0.10 | 0.71 (0.44-1.11) | 0.13 |
There was a strong association between frequency of consultation and treatment. The unadjusted odds ratio for receiving and adhering to any evidence-based treatment among those reporting five or more consultations (23.6% of the sample) v. those reporting 0 or 1 consultations (40.2%) was 22.5 (95% CI 13.7–36.9, P < 0.001). Many consultations in this group were likely to have been for treatment review. Although there was a trend for socio-economic status to be associated with frequency of consultation for depression, this did not reach statistical significance. For example, 20.9% of those with no educational qualification were in the highest attendance group, compared with 27.9% of those with A levels or higher qualifications. We found no evidence of any statistically significant interactions between frequency of attendance and socio-economic status in the association with treatment receipt and adherence (e.g. for education, likelihood ratio χ2 = 5.12, d.f. = 4, P = 0.08).
DISCUSSION
Main findings
We estimate conservatively that 33.9% of the sample received and adhered to treatments for depression meeting minimum evidence-based criteria. Around one-half of those with a depressive episode in the year before interview consulted their GP about this. Three-quarters of these were prescribed an antidepressant, and in over two-thirds of individuals this met evidence-based criteria. Around 12% of the sample received and adhered to evidence-based psychological treatment. The lowest treatment rates were found in older age groups. We found little evidence of socio-economic differences in rates of treatment for depression, and none that reached statistical significance after adjusting for depression severity, age and gender.
Comparison with other studies
Rates of treatment for depression in primary care
It is difficult to make comparisons with community-based surveys, and we cannot comment on people with depression who do not attend general practice. Previous studies report that 30–40% of those in the community who are depressed receive medical treatment (medication or psychological treatments; Reference Lin and ParikhLin & Parikh, 1999; Reference Singleton, Bumpstead and O'BrienSingleton et al, 2001), falling to 25% or less when only treatments of ‘minimal’ adequacy or better are included (Reference Young, Klap and SherbourneYoung et al, 2001).
Rates of ‘minimally adequate’ guideline-based treatment for depression may be higher in primary care settings in the UK than in the USA. In the National Comorbidity Study Replication (NCS–R; Reference Wang, Lane and OlfsonWang et al, 2005), data from general medical settings (including primary care) indicated that 15% of those with major depressive disorder in the past year received treatment meeting these criteria, compared with 42% with a severe depressive episode in our study. Of those who reported consulting their GP for the index episode, 67% received and adhered to minimally adequate treatment, compared with 38% in the NCS–R sample.
Evidence for ‘inverse care’?
Apart from a qualitative study highlighting the challenges facing GPs working in socio-economically deprived areas (Reference Chew-Graham, Mullin and MayChew-Graham et al, 2002), there is little evidence of ‘inverse care’ in the treatment of depression. There was little evidence in our study that socio-economic status was associated with receipt of and adherence to evidence-based treatments. Those not working because of ill health were more likely to report receiving evidence-based treatment, perhaps because depression was the certified cause of absence. Greater financial strain (a robust socio-economic indicator) was associated with more evidence-based treatment. Moreover, whereas those with the lowest educational attainment were less likely to report evidence-based psychological treatment, this association was confounded by age, gender and depression severity.
Lower socio-economic status is associated with higher primary care consultation rates in the UK (Reference Carr-Hill, Rice and RolandCarr-Hill et al, 1996). Although most existing studies report little evidence that demographic factors affect help-seeking when depressed, few measured individual socio-economic status precisely or attempted to adjust rates of help-seeking for the presence and severity of psychiatric disorder (Reference Lin and ParikhLin & Parikh, 1999). Although an early US study reported lower needs-adjusted rates of medical consultation among those with the lowest socio-economic status (Reference Gallo, Marino, Ford and AnthonyGallo et al, 1995), this association was not replicated in the NCS–R (Reference Wang, Lane and OlfsonWang et al, 2005).
Strengths and limitations of the study
This is the largest UK study to test the hypothesis of an ‘inverse care law’ in the treatment of depression. Participants were recruited from among consecutive primary care attendees, and depressive episodes were confirmed using a validated, standardised clinical interview. Participating practices were recruited from across England and Wales. By recruiting individuals with a depressive episode at any time in the preceding 12 months, our sample was better suited to assessing treatment receipt and adherence than samples of current depression (Reference Singleton, Bumpstead and O'BrienSingleton et al, 2001).
We are not aware of validated screening questionnaires for identifying individuals with a recent history of depressive episodes from among primary care attendees. We based the screening questionnaire on the ‘gold standard’ of the 12-month CIDI depression interview. A primary care study in New Zealand examined GPs’ verbal use of the first two (stem) items of our waiting room questionnaire (i.e. low mood and anhedonia) as a screen for depression in the past month (Reference Arroll, Khin and KerseArroll et al, 2003). Among 421 attendees not taking psychotropic medication, sensitivity and specificity of this two-item screen were 97 and 67% respectively, and the positive predictive value was 18%. A high positive predictive value was needed to minimise false-positive second-stage interviews. This weighted the sample towards individuals with more severe depressive episodes.
One weakness was the high attrition rate between screening and interview. Although fewer than half of those eligible for the second stage were interviewed, screening questionnaire scores did not differ significantly between those who were and were not interviewed. Nevertheless, we cannot exclude the possibility that those who were interviewed differed in other ways, including their willingness to receive and adhere to treatment. Estimates of treatment rates should be interpreted carefully (Reference Ayuso-Mateos, Vázquez-Barquero and DowrickAyuso-Mateos et al, 2001), but it is unlikely that this would have resulted in biased estimates of association between socio-economic status and treatment receipt. The size of this association (point estimate) would remain the same unless there was an association between participation in the study, socio-economic status and treatment. In other words, our findings would only have been biased away from an association between low socio-economic status and undertreatment if individuals of low socio-economic status who did not take part were less likely to have received evidence-based treatment than the individuals of low socio-economic status who did participate. Although this was possible, it would appear unlikely, particularly since treatment rates were already very low in the latter group. We note also that our sample was relatively deprived compared with the population of England and Wales as a whole (2001 UK Census; http://www.statsistics.gov.uk) on indices that included employment (study sample 51% in paid work v. 61% nationally), no educational qualification (27 v. 28% nationally) and financial strain (34 v. 14% nationally; Reference Weich and LewisWeich & Lewis, 1998).
A further limitation was the location of this study in primary care rather than the community. It is possible that individuals of low might not seek medical care for depression. This would appear to be borne out by the finding that 38% of those with a current depressive episode in a UK community sample had no educational qualifications, compared with 27% of our sample (Reference Singleton, Bumpstead and O'BrienSingleton et al, 2001). Although our data revealed a non-significant trend towards less frequent consultation for the index episode of depression among those without educational qualifications, there was no evidence that frequency of consultation modified the association between socioeconomic status and treatment receipt and adherence. A strength of the study was that recruitment was undertaken solely on the basis of waiting to see a health professional, and not on any particular reason for consultation. Although people living on low incomes may decline or disengage from care, most continue to have contact with the healthcare system (Reference Edlund, Wang and BerglundEdlund et al, 2002; Reference Anderson, Robins and GreenoAnderson et al, 2006). We are confident that such individuals would have been invited to participate in this study, but it is not possible to generalise directly from the present findings to all those with depressive episodes in the community.
Quantifying treatment adherence is challenging and there is no agreed gold standard (Reference Garber, Nau and EricksonGarber et al, 2004; Reference DiMatteo and HaskardDiMatteo & Haskard, 2006). We relied on self-report within a comprehensive, structured, face-to-face interview. We began by eliciting evidence of a depressive episode and then used this to anchor the remainder of the interview. Although not formally validated, our approach was thorough and systematic. It is unlikely that prescribing rates were overreported. The high rate (almost 85%) of reported adherence (taking prescribed antidepressant medication ‘every day’ or ‘nearly every day’ for more than 4 weeks) may reflect overreporting. Although participants in this study may have been more likely to have adhered to treatment than those who declined to take part, a US study found that over 40% of individuals adhered to antidepressants for 6 months.
Under- or overestimates of treatment receipt and adherence are only important here if biased by socio-economic status. For this to have concealed inverse care in the treatment of depression, delivery and uptake of treatment would have to have been either systematically overreported by those with the lowest socio-economic status and/or underreported by those with higher socio-economic status. Neither was likely.
Implications for services
Depression is closely associated with socioeconomic deprivation across the life span. Rates of depression are highest in areas and practices with the fewest resources. It is reassuring that those with the lowest socio-economic status in England and Wales are as likely as the more affluent to receive and adhere to evidence-based treatments, after accounting for clinical need. Nevertheless, treatment rates remain modest and the reasons for this are unclear. Older age may be a greater source of inequality in the treatment of depression than socio-economic deprivation.
Acknowledgements
We thank our colleagues at the General Practice Research Framework, particularly Louise Letley, and the many research nurses who collected the data. The study was funded by the Medical Research Council, under the Health of the Public Initiative (ref.G9900548).


eLetters
No eLetters have been published for this article.