


I. INTRODUCTION
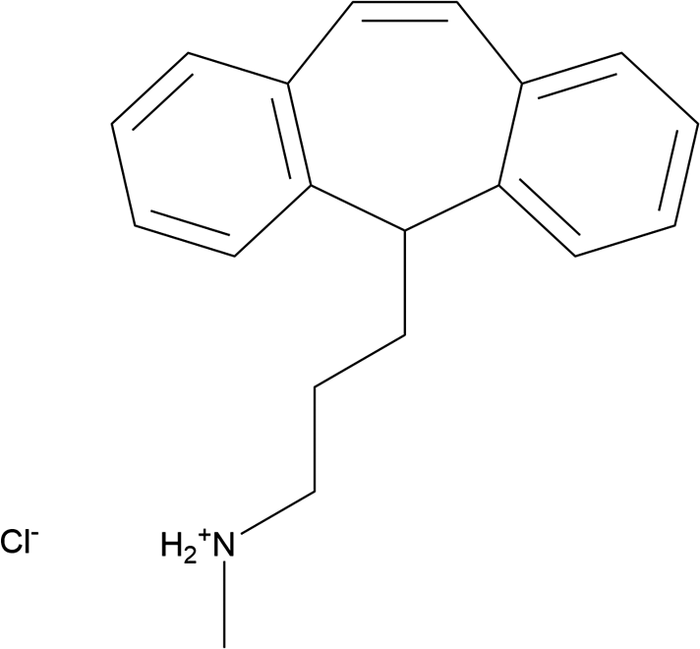
Protriptyline hydrochloride (sold under the brand names Concordin and Maximen, among others) is used to treat depression and attention-deficit hyperactivity disorder. It is a tricyclic secondary amine hydrochloride salt of Protriptyline (Vivactil) and results in energizing rather than sedating a user. The systematic name (CAS Registry No. 1225-55-4) is N-methyl-3-(2-tricyclo[9.4.0.03,8]pentadeca-1(15),3,5,7,9,11,13-heptaenyl)propan-1-ammonium chloride. A two-dimensional molecular diagram of protriptyline hydrochloride is shown in Figure 1.
The two-dimensional structure of protriptyline hydrochloride.

Crystalline Forms A and B of protriptyline hydrochloride are claimed in U.S. Patent Application 2007/0112073 A1 (Ventimiglia et al., Reference Ventimiglia, Magrone, Allegrini and Razzetti2007; Diparma S.p.A.), and powder diffraction data are provided.
This work was carried out as part of a project (Kaduk et al., Reference Kaduk, Crowder, Zhong, Fawcett and Suchomel2014) to determine the crystal structures of large-volume commercial pharmaceuticals and include high-quality powder diffraction data for them in the Powder Diffraction File (Kabekkodu et al., Reference Kabekkodu, Dosen and Blanton2024).
II. EXPERIMENTAL
The commercial reagent protriptyline hydrochloride from TargetMol (Batch #146002, 99.98% purity) was used as received. The white powder was packed into a 0.5-mm-diameter Kapton capillary and rotated during the measurement at ~2 Hz. The powder pattern was measured at 298(1) K at the Wiggler Low Energy Beamline (Leontowich et al., Reference Leontowich, Gomez, Diaz Moreno, Muir, Spasyuk, King, Reid, Kim and Kycia2021) of the Brockhouse X-ray Diffraction and Scattering Sector of the Canadian Light Source using a wavelength of 0.819826(2) Å (15.1 keV) from 1.6 to 75.0° 2θ with a step size of 0.0025° and a collection time of 3 minutes. The high-resolution powder diffraction data were collected using eight Dectris Mythen2 X series 1K linear strip detectors. NIST SRM 660b LaB6 was used to calibrate the instrument and refine the monochromatic wavelength used in the experiment.
Initial attempts to index the pattern using multiple programs yielded a primitive monoclinic unit cell with a = 10.43, b = 32.05, c = 20.19 Å, β = 92.87°, and V = 6,744.17 Å3, but no chemically reasonable crystal structures. Indexing with DICVOL06 (Louër and Boultif, Reference Louër and Boultif2007) as incorporated into FOX (Favre-Nicolin and Černý, Reference Favre-Nicolin and Černý2002) yielded a primitive monoclinic cell with a = 10.112, b = 32.099, c = 10.459 Å, β = 92.85°, V = 3,309.4 Å3, and Z = 8. The suggested space group was P21/n, which was confirmed by the successful solution and refinement of the crystal structure. A reduced cell search in the Cambridge Structural Database (Groom et al., Reference Groom, Bruno, Lightfoot and Ward2016) yielded 12 hits, but no structures of protriptyline or its derivatives. This cell does not index all peaks observed in this study’s synchrotron diffraction pattern (including peaks at 2.31, 5.16, and 8.24° 2θ), suggesting the presence of at least one unidentified crystalline impurity.
A protriptyline molecule was downloaded from PubChem (Kim et al., Reference Kim, Chen, Cheng, Gindulyte, He, He and Li2023) as Conformer3D_COMPOUND_CID_4976.sdf. It was converted to a *.mol2 file using Mercury (Macrae et al., Reference Macrae, Sovago, Cottrell, Galek, McCabe, Pidcock and Platings2020) and then converted to a cation using Materials Studio (Dassault Systèmes, 2023). The structure was solved by Monte Carlo-simulated annealing techniques as implemented in EXPO2014 (Altomare et al., Reference Altomare, Cuocci, Giacovazzo, Moliterni, Rizzi, Corriero and Falcicchio2013), using two cations and two Cl atoms as fragments, incorporating a bump penalty for the non-H atoms and [010] preferred orientation (suggested by the anisotropy of the lattice parameters). Two of the 10 solutions had figures of merit significantly better than the others.
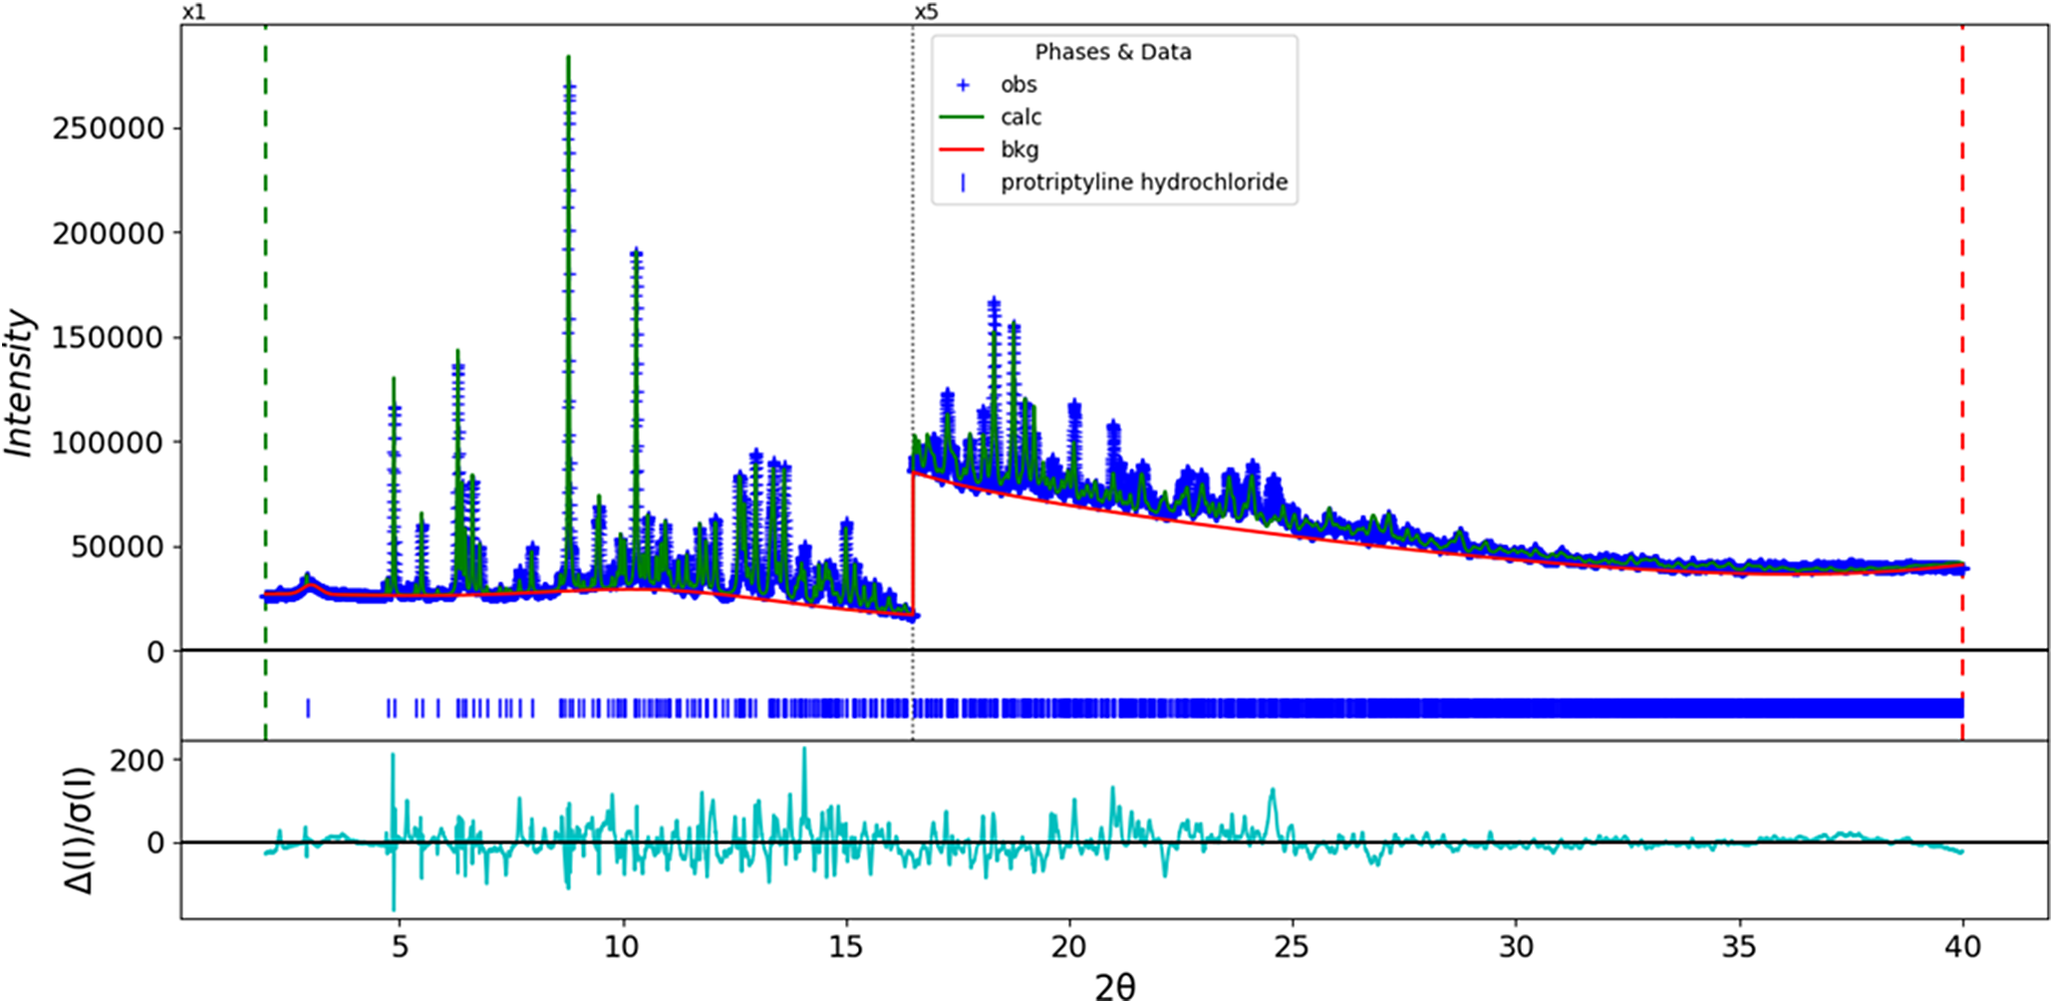
Rietveld refinement was carried out using GSAS-II (Toby and Von Dreele, Reference Toby and Von Dreele2013). Only the 2.0–40.0° portion of the pattern was included in the refinements (d min = 1.198 Å). All non-H-bond distances and angles were subjected to restraints, based on a Mercury/Mogul Geometry Check (Bruno et al., Reference Bruno, Cole, Kessler, Luo, Motherwell, Purkis and Smith2004; Sykes et al., Reference Sykes, McCabe, Allen, Battle, Bruno and Wood2011). The Mogul average and standard deviation for each quantity were used as the restraint parameters. The benzene rings were restrained to be planar. The restraints contributed 12.5% to the overall χ 2. Using lower restraint weights resulted in some unreasonably long C–C bond distances in the side chains. The hydrogen atoms were included in calculated positions, which were recalculated during the refinement using Materials Studio (Dassault Systèmes, 2023). Separate U iso were refined for the ring and side chain atoms in the independent molecules. The displacement coefficient of the side chain atoms in molecule 1 was refined to a slightly negative value, so it was fixed at a reasonable value of 0.05 Å2. The U iso for the H atoms were fixed at 1.3× the U iso of the heavy atoms to which they are attached. The peak profiles were described using the generalized (Stephens, Reference Stephens1999) microstrain model. The background was modeled using a six-term shifted Chebyshev polynomial, with peaks at 3.02 and 10.89° to model the narrow and broad scattering from the Kapton capillary and any amorphous component.
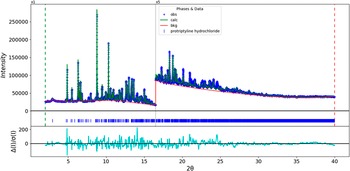
The final refinement (begun from the density functional theory (DFT-optimized structure)) of 166 variables using 15,201 observations and 106 restraints yielded the residual R wp = 0.05252. The largest peak (1.68 Å from C19) and hole (1.38 Å from H24) in the difference Fourier map were 0.43(10) and −0.46(10) eÅ−3, respectively. The final Rietveld plot is shown in Figure 2. The largest features in the normalized error plot are in the shapes of some of the strong low-angle peaks and at the peaks of the impurity phase(s).
The Rietveld plot for protriptyline hydrochloride. The blue crosses represent the observed data points, and the green line represents the calculated pattern. The cyan curve is the normalized error plot, and the red line is the background curve. The blue tick marks indicate the protriptyline hydrochloride peak positions. The vertical scale has been multiplied by a factor of 5× for 2θ > 16.5̊.
The crystal structure of protriptyline hydrochloride was optimized (fixed experimental unit cell) with density functional techniques using VASP (Kresse and Furthmüller, Reference Kresse and Furthmüller1996) through the MedeA graphical interface (MDI, 2024). The calculation was carried out on 32 cores of a 144-core (768 GB memory) HPE Superdome Flex 280 Linux server at North Central College. The calculation used the GGA-PBE functional, a plane wave cutoff energy of 400.0 eV, and a k-point spacing of 0.5 Å−1, leading to a 2 × 1 × 2 mesh, and took ~129.7 hours. Single-point density functional theory calculations (fixed experimental cell) and population analysis were carried out using CRYSTAL23 (Erba et al., Reference Erba, Desmarais, Casassa, Civalleri, Donà, Bush and Searle2023). The basis sets for the H, C, and O atoms in the calculation were those of Gatti et al. (Reference Gatti, Saunders and Roetti1994), and that for Cl was that of Peintinger et al. (Reference Peintinger, Vilela Oliveira and Bredow2013). The calculations were run on a 3.5 GHz PC using eight k-points and the B3LYP functional, and took ∼6.3 hours.
III. RESULTS AND DISCUSSION
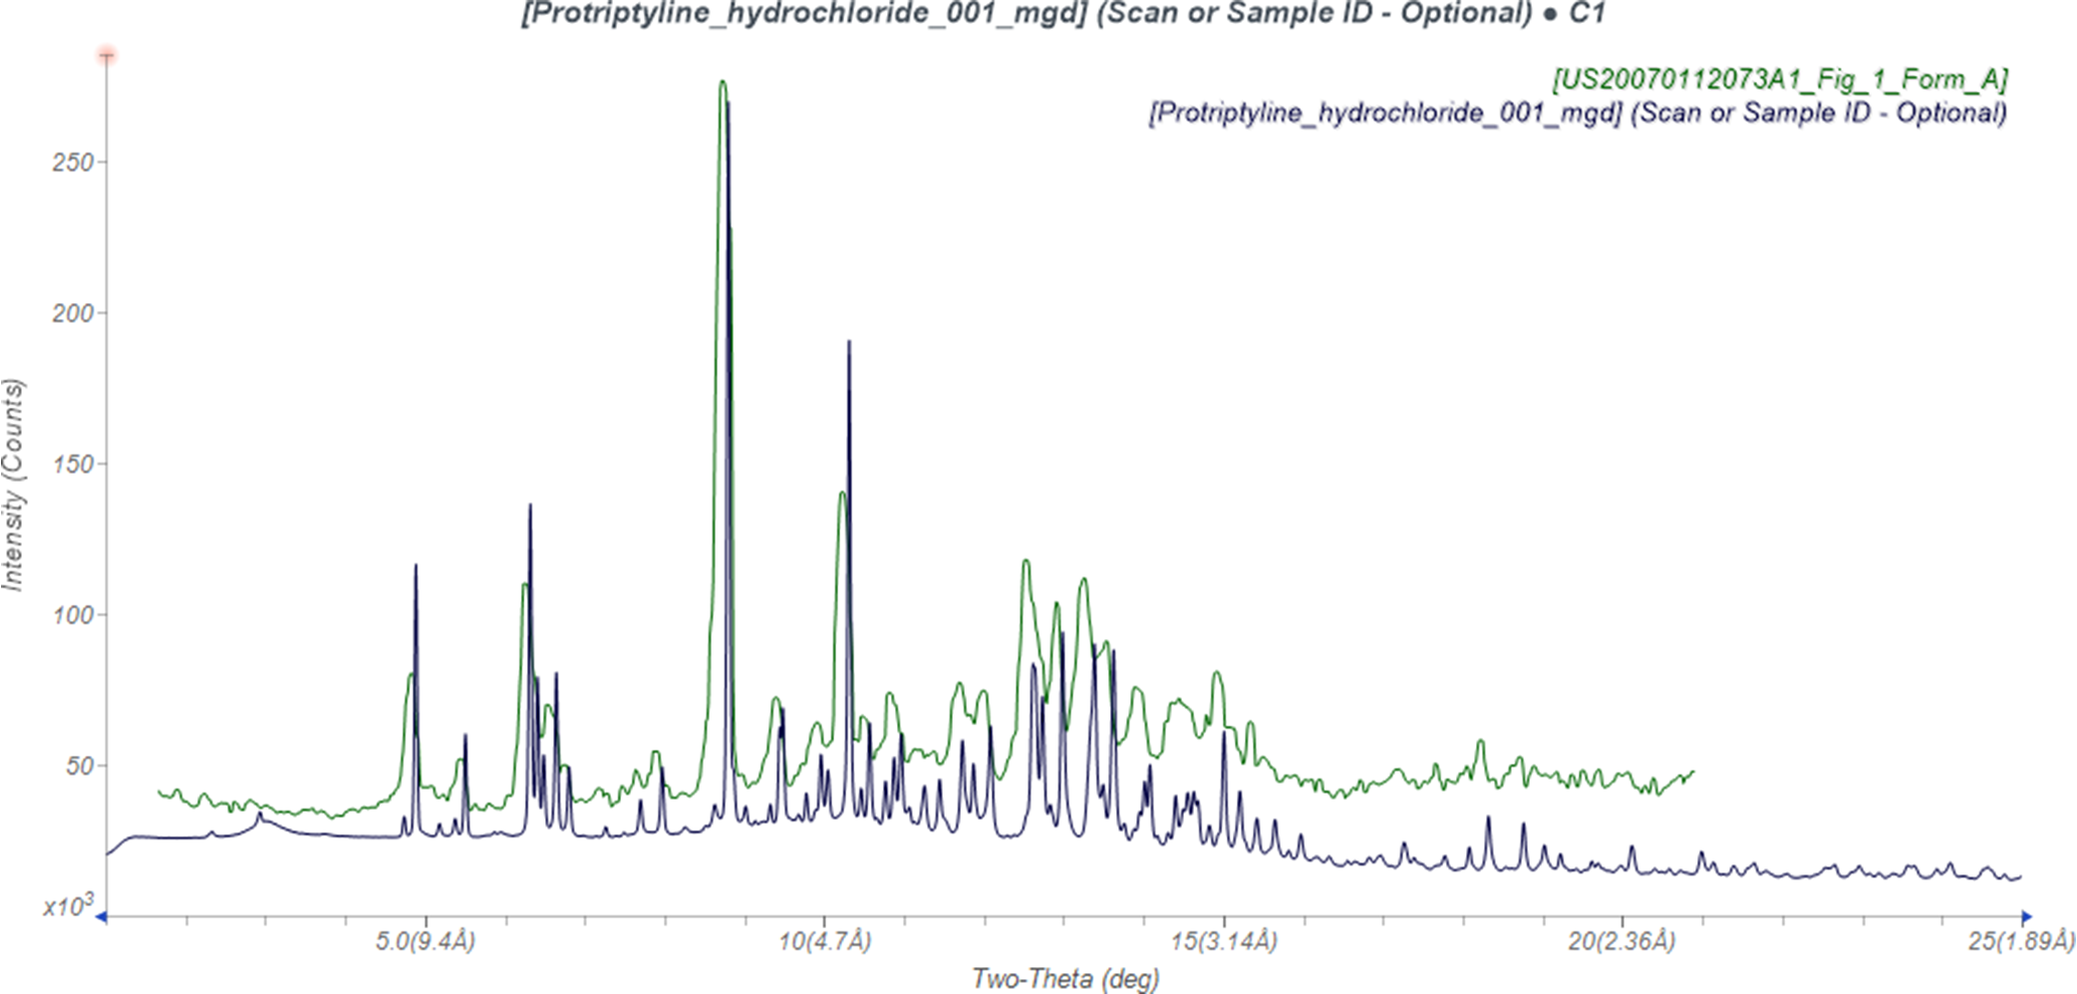
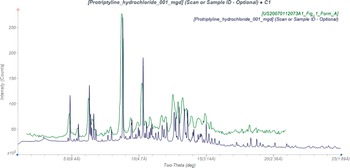
This synchrotron powder pattern of protriptyline hydrochloride matches the one reported by Ventimiglia et al. (Reference Ventimiglia, Magrone, Allegrini and Razzetti2007) (Figure 3) well enough to conclude that they represent the same material, and that the protriptyline hydrochloride characterized here is Form A. The unidentified crystalline impurity does not correspond to Form B.
Comparison of the synchrotron pattern of protriptyline hydrochloride (black) to that of Form A reported by Ventimiglia et al. (Reference Ventimiglia, Magrone, Allegrini and Razzetti2007) (green). The literature pattern (measured using Cu Kα radiation) was digitized using UN-SCAN-IT (Silk Scientific, 2013) and converted to the synchrotron wavelength of 0.819826(2) Å using JADE Pro (MDI, 2024). Image generated using JADE Pro (MDI, 2024).
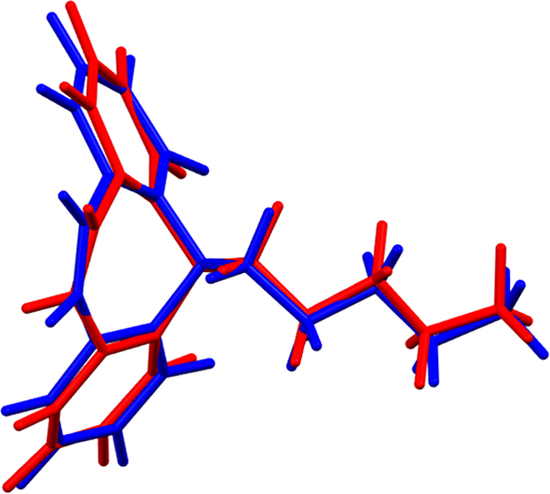
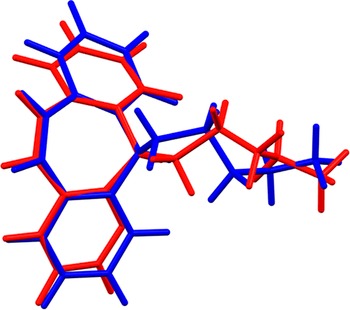
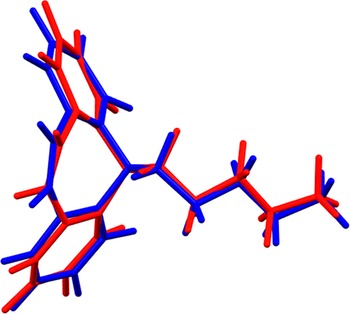
The root-mean-square difference of the non-H atoms in the Rietveld-refined and VASP-optimized structures, calculated using the Mercury CSD-Materials/Search/Crystal Packing Similarity tool, is 0.405 Å (Figure 4). The root-mean-square Cartesian displacements of the non-H atoms in the Rietveld-refined and VASP-optimized structures of the cations, calculated using the Mercury Calculate/Molecule Overlay tool, are 0.467 and 0.279 Å (Figures 5 and 6). The largest differences are in the conformation of the side chain in cation 1. The agreements are at or outside the normal range for correct structures (van de Streek and Neumann, Reference van de Streek and Neumann2014). The asymmetric unit is illustrated in Figure 7. The U iso values for most of the atoms are relatively high, and those for one part of one cation are refined to a very low value, suggesting that this structure might be approximate. Hence, the structure is described as “proposed.”. The remaining discussion will emphasize the VASP-optimized structure.
Comparison of the Rietveld-refined (colored by atom type) and VASP-optimized (green) structures of protriptyline hydrochloride using the Mercury CSD-Materials/Search/Crystal Packing Similarity tool. The root-mean-square Cartesian displacement is 0.405 Å. Image generated using Mercury (Macrae et al., Reference Macrae, Sovago, Cottrell, Galek, McCabe, Pidcock and Platings2020).
Comparison of the Rietveld-refined (red) and VASP-optimized (blue) structures of cation 1 in protriptyline hydrochloride. The root-mean-square Cartesian displacement is 0.467 Å. Image generated using Mercury (Macrae et al., Reference Macrae, Sovago, Cottrell, Galek, McCabe, Pidcock and Platings2020).

Comparison of the Rietveld-refined (red) and VASP-optimized (blue) structures of cation 2 in protriptyline hydrochloride. The root-mean-square Cartesian displacement is 0.279 Å. Image generated using Mercury (Macrae et al., Reference Macrae, Sovago, Cottrell, Galek, McCabe, Pidcock and Platings2020).
The asymmetric unit of protriptyline hydrochloride, with the atom numbering. The atoms are represented by 50% probability spheroids. Image generated using Mercury (Macrae et al., Reference Macrae, Sovago, Cottrell, Galek, McCabe, Pidcock and Platings2020).

Almost all the bond distances, bond angles, and torsion angles fall within the normal ranges indicated by a Mercury Mogul Geometry check (Macrae et al., Reference Macrae, Sovago, Cottrell, Galek, McCabe, Pidcock and Platings2020). The C4–C3–C5 angle of 111.6° (average = 115.0(10)°, Z-score = 3.5) is flagged as unusual. The standard uncertainty of the average is smaller than usual (inflating the Z-score). The C7–C10–N2–C4 torsion angle lies on the tail of a minor gauche population in a mainly trans distribution of similar torsion angles. The C4–C7–C10–N2 torsion angle lies on the tail of a mainly trans distribution. Torsion angles involving rotation about the C3–C4 bond are truly unusual; these represent the orientation of the side chain with respect to the ring system. The conformation of molecule 1 in the refined structure is actually slightly less unusual than in the DFT-optimized structure. Molecule 1 has an unusual conformation, whereas molecule 2 is normal.
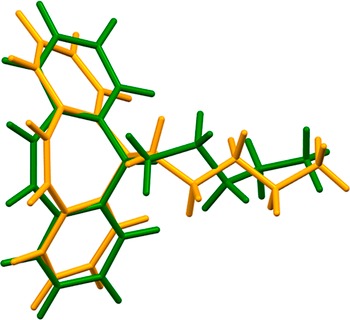
The difference in the two conformations is illustrated in Figure 8. Quantum chemical geometry optimization of the isolated protriptyline cations (DFT/B3LYP/6-31G*/water) using Spartan ‘24 (Wavefunction, 2023) indicated that cation 2 is 1.0 kcal/mol lower in energy than cation 1. In the global minimum-energy conformation, the side chain is folded to lie parallel to the ring system, showing that intermolecular interactions are important in determining the solid-state conformations.
Comparison of cation 1 (green) and cation 2 (orange) in protriptyline hydrochloride. The root-mean-square Cartesian displacement is 0.591 Å. Cation 2 is 1.0 kcal/mol lower in energy than cation 1. Image generated using Mercury (Macrae et al., Reference Macrae, Sovago, Cottrell, Galek, McCabe, Pidcock and Platings2020).

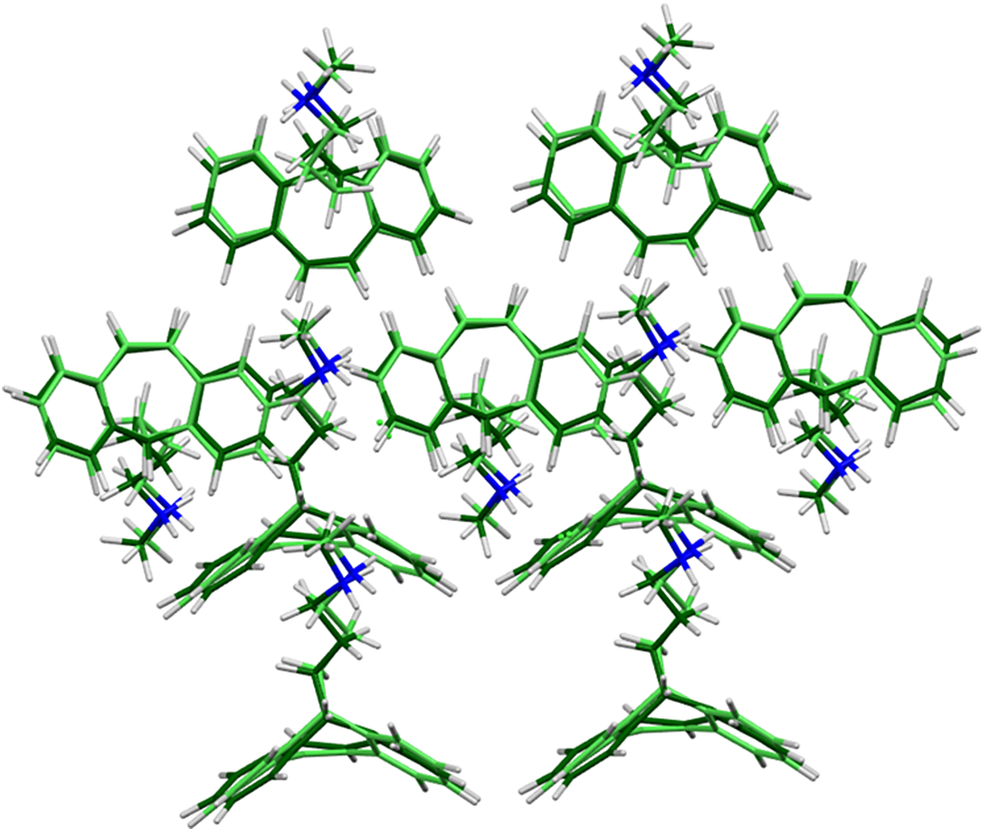
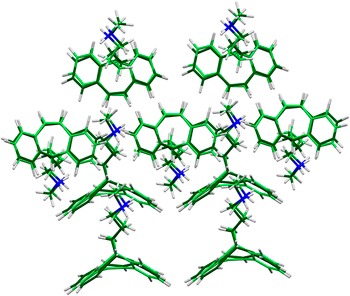
The crystal structure (Figure 9) contains the expected N–H···Cl hydrogen bonds, which link the cations and the anions into chains along the c-axis. The cations and the anions form layers parallel to the ac-plane, with van der Waals interactions between the layers. The mean planes of the ring systems of cation 1 and cation 2 are approximately (−2, −1, 0) and (−1, 3, 0). The Mercury Aromatics Analyser indicates one moderate interaction between the phenyl rings of cations 1 and 2, with a distance of 5.01 Å, as well as several weak interactions with distances >7.0 Å.
The crystal structure of protriptyline hydrochloride, viewed down the c-axis. Image generated using Diamond (Crystal Impact, 2023).

Analysis of the contributions to the total crystal energy of the structure using the Forcite module of Materials Studio (Dassault Systèmes, 2023) indicates that bond, angle, and torsion distortion terms contribute about equally to the intramolecular energy. The intermolecular energy is dominated by van der Waals attractions and electrostatic repulsions, which in this force field-based analysis also include hydrogen bonds. The hydrogen bonds are better discussed using the results of the DFT calculation.
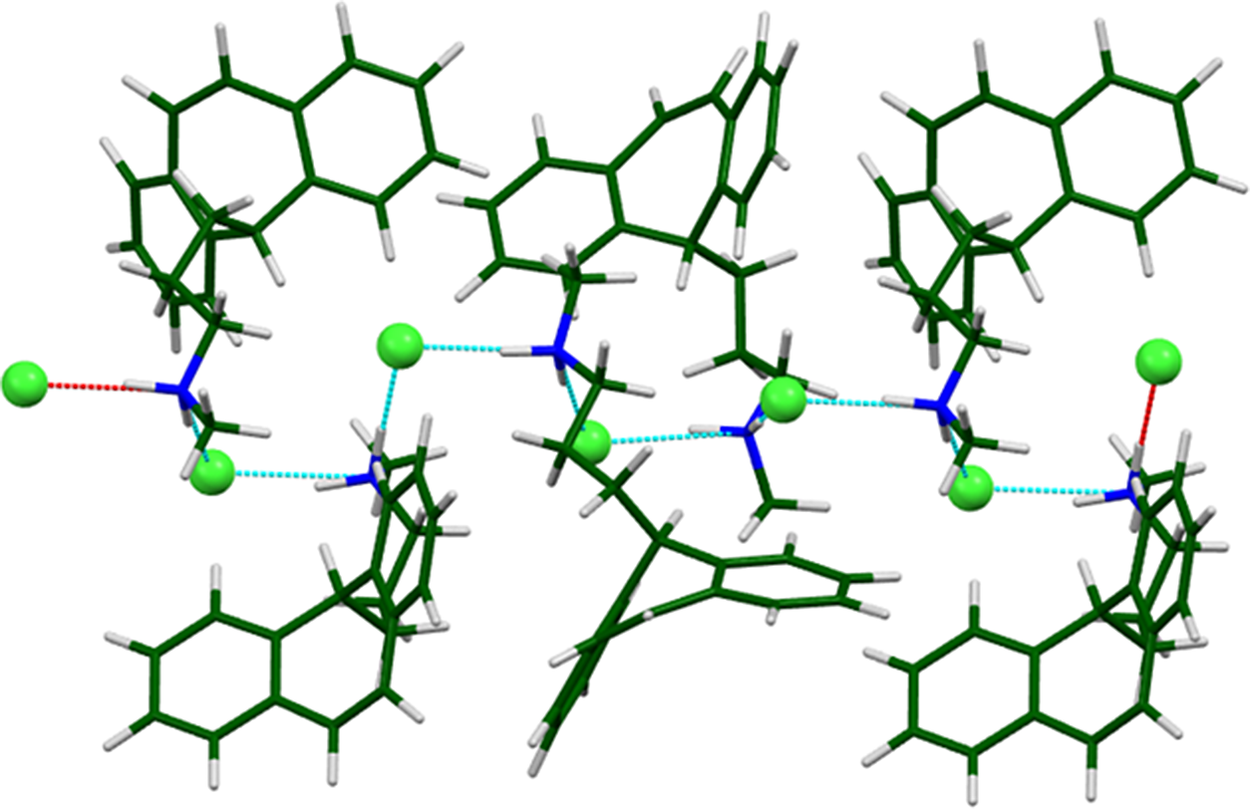
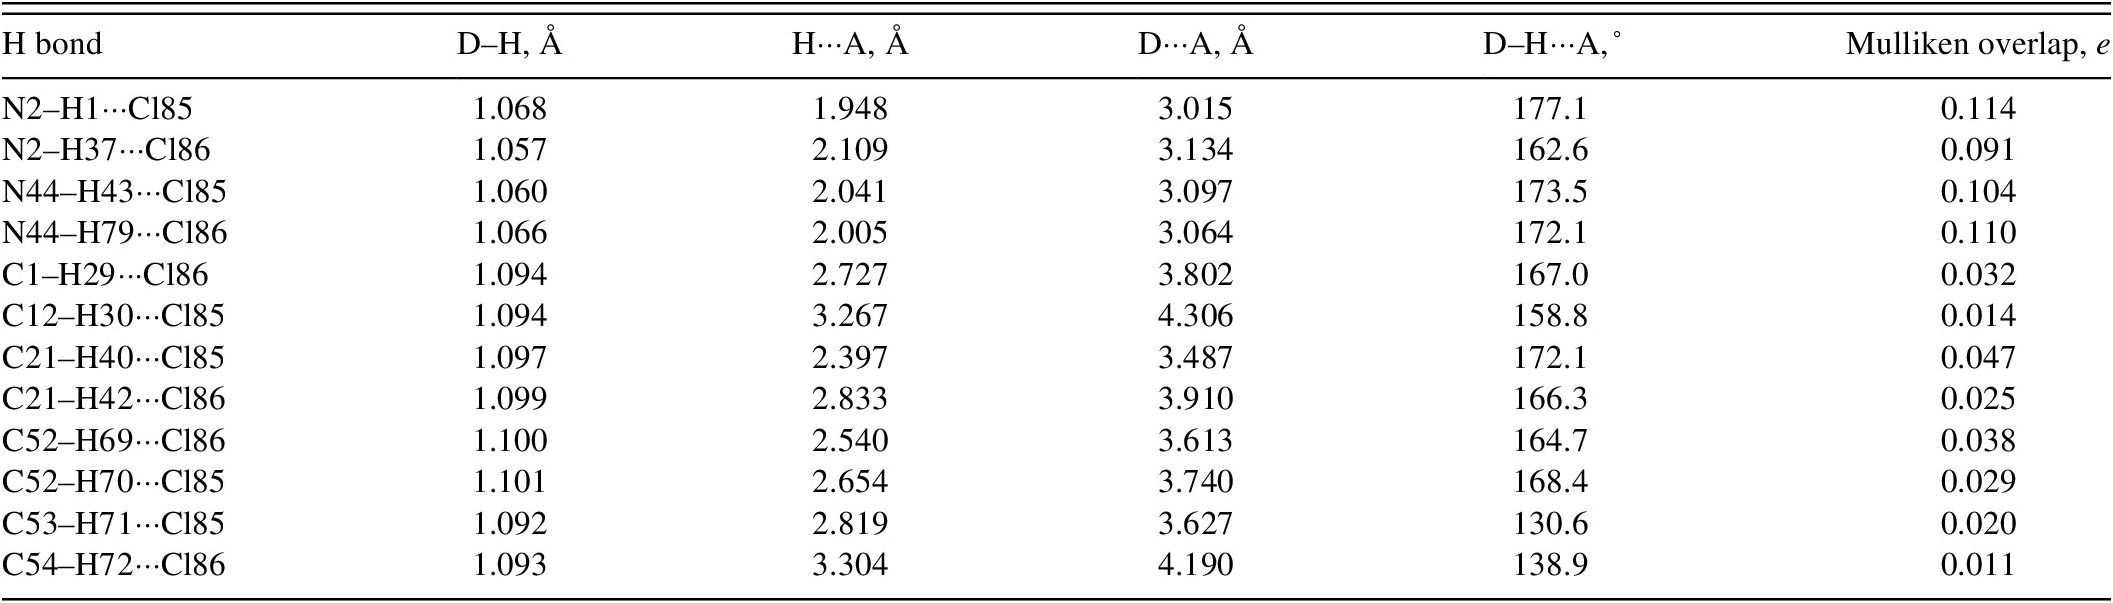
As expected, there are four strong N–H···Cl hydrogen bonds between the cations and anions (Table I). The N–H···Cl hydrogen bonds link the cations and the anions into crankshaft-shaped chains (Figure 10) along the c-axis. The chains have the graph set D2,2(5) (Etter, Reference Etter1990; Bernstein et al., Reference Bernstein, Davis, Shimoni and Chang1995; Motherwell et al., Reference Motherwell, Shields and Allen2000. Several C–H···Cl hydrogen bonds also contribute to the lattice energy.
Hydrogen bonds (CRYSTAL23) in protriptyline hydrochloride.

The crankshaft-shaped hydrogen bond chains in the structure of protriptyline hydrochloride. The Cl anions are represented by green spheres. The cyan and red dashed lines indicate the hydrogen bonds. Image generated using Mercury (Macrae et al., Reference Macrae, Sovago, Cottrell, Galek, McCabe, Pidcock and Platings2020).
The volume enclosed by the Hirshfeld surface of protriptyline hydrochloride (Figure 11; Hirshfeld, Reference Hirshfeld1977; Spackman et al., Reference Spackman, Turner, McKinnon, Wolff, Grimwood, Jayatilaka and Spackman2021) is 836.88 Å3, 98.88% of one-fourth of the unit cell volume. The packing density is thus typical. The only significant close contacts (red in Figure 11) involve the hydrogen bonds. The volume/non-hydrogen atom is larger than usual, at 20.1 Å3, reflecting the presence of the chloride anions.
The Hirshfeld surface of protriptyline hydrochloride. Intermolecular contacts longer than the sum of the van der Waals radii are colored blue, while contacts shorter than the sum of the radii are colored red. Contacts equal to the sum of radii are white. Image generated using CrystalExplorer (Spackman et al., Reference Spackman, Turner, McKinnon, Wolff, Grimwood, Jayatilaka and Spackman2021).

The Bravais–Friedel–Donnay–Harker (Bravais, Reference Bravais1866; Friedel, Reference Friedel1907; Donnay and Harker, Reference Donnay and Harker1937) algorithm suggests that we might expect platy morphology for protriptyline hydrochloride, with {010} as the major faces, as expected from both the anisotropy of the lattice parameters and the layered structure. A fourth-order spherical harmonic texture model was included in the refinement. The texture index was 1.020(1), indicating that preferred orientation was (perhaps surprisingly) slight in this rotated capillary specimen.
DEPOSITED DATA
The powder pattern of protriptyline hydrochloride from this synchrotron dataset has been submitted to the ICDD for inclusion in the Powder Diffraction File. The Crystallographic Information Framework (CIF) files containing the results of the Rietveld refinement (including the raw data) and the DFT geometry optimization were deposited with the ICDD. The data can be requested at pdj@icdd.com.
ACKNOWLEDGEMENTS
We thank Adam Leontowich for his assistance in the data collection. We also thank the ICDD team – Megan Rost, Steve Trimble, and Dave Bohnenberger – for their contribution to research, sample preparation, and in-house XRD data collection and verification.
FUNDING STATEMENT
Part of the research described in this paper was performed at the Canadian Light Source, a national research facility of the University of Saskatchewan, which is supported by the Canada Foundation for Innovation (CFI), the Natural Sciences and Engineering Research Council (NSERC), the Canadian Institute of Health Research (CIHR), the Government of Saskatchewan, and the University of Saskatchewan. This work was partially supported by the International Centre for Diffraction Data.
COMPETING INTEREST
The authors have no competing interests to declare.


 Open access