


Introduction
Single-particle electron cryo-microscopy (cryoEM) has developed into a technique for determining the structure of protein complexes at high resolution, at a rate that was difficult to imagine at the outset of the resolution revolution only a few years ago (Kühlbrandt, Reference Kühlbrandt2014). The quality of cryoEM structures rivals (Ben-Shem et al., Reference Ben-Shem, De Loubresse, Melnikov, Jenner, Yusupova and Yusupov2011), or even surpasses (Safarian et al., Reference Safarian, Hahn, Mills, Radloff, Eisinger, Nikolaev, Meier-Credo, Melin, Miyoshi, Gennis, Sakamoto, Langer, Hellwig, Kühlbrandt and Michel2019) those obtained by X-ray crystallography. For a detailed description of the cryoEM method, we refer to recent reviews (Cheng et al., Reference Cheng, Grigorieff, Penczek and Walz2015; Vinothkumar and Henderson, Reference Vinothkumar and Henderson2016; Mills, Reference Mills2021). Apart from radiation damage, which is the primary and fundamental limitation in cryoEM of radiation-sensitive biological samples, two factors have limited the rate of progress towards even better structures and even wider application of single-particle cryoEM: (i) beam-induced specimen movement and (ii) protein adsorption to the air-water interface. This review examines current strategies to overcome these effects.
Beam-induced movement
Specimens for cryoEM are prepared by plunge-freezing (Dubochet et al., Reference Dubochet, Lepault, Freeman, Berriman and Homo1982, Reference Dubochet, Adrian, Chang, Homo, Lepault, Mcdowall and Schultz1988), whereby a few microliters of sample solution in aqueous buffer are spread on a 3 mm EM support grid usually coated with holey carbon filmFootnote 1. Excess solution is blotted off with filter paper to leave a thin layer of liquid that stretches across the holes in the carbon film. The total volume of the aqueous layer is typically much less than 0.01% of the volume applied. Upon plunging into liquid ethane, the aqueous layer cools from room temperature to ~90 K in less than 0.1 ms (Dubochet et al., Reference Dubochet, Adrian, Chang, Homo, Lepault, Mcdowall and Schultz1988). At this high cooling rate, the water molecules do not have time to form ice crystals, and the liquid layer freezes into a glass-like amorphous solid. Under normal laboratory conditions, the maximum thickness of aqueous layers that can be vitrified is ~1 μm (Studer et al., Reference Studer, Humbel and Chiquet2008). The mean free path of 300 kV electrons in carbon or water is ~300 nm (Glaeser et al., Reference Glaeser, Han, Csencsits, Killilea, Pulk and Cate2016), and this places an upper thickness limit on biological samples for transmission electron microscopy. Thinner vitrified layers (~30 nm or 300 Å) are preferable, because they give higher image contrast and better resolution.
Beam-induced specimen movement during image acquisition (Fig. 1) is an insidious problem that has long prevented routine determination of macromolecular structures at atomic or near-atomic resolution by cryoEM (Henderson and Glaeser, Reference Henderson and Glaeser1985; Glaeser et al., Reference Glaeser, Mcmullan, Faruqi and Henderson2011; Henderson et al., Reference Henderson, Chen, Chen, Grigorieff, Passmore, Ciccarelli, Rubinstein, Crowther, Stewart and Rosenthal2011; Brilot et al., Reference Brilot, Chen, Cheng, Pan, Harrison, Potter, Carragher, Henderson and Grigorieff2012; Campbell et al., Reference Campbell, Cheng, Brilot, Moeller, Lyumkis, Veesler, Pan, Harrison, Potter, Carragher and Grigorieff2012). It is most likely caused by the release of mechanical strain frozen into the glass-like, unsupported layer of vitrified water upon exposure to the electron beam (Glaeser et al., Reference Glaeser, Han, Csencsits, Killilea, Pulk and Cate2016; Vinothkumar and Henderson, Reference Vinothkumar and Henderson2016). Electrostatic charge building up on the non-conductive cryo-specimen during electron irradiation, which has been suggested as an alternative or contributing cause (Downing et al., Reference Downing, Mccartney and Glaeser2004), is insignificant by comparison (Russo and Henderson, Reference Russo and Henderson2018a, Reference Russo and Henderson2018b).
Beam-induced movement of rotavirus particles. (a) Average of 60 movie frames indicates image blurring caused by beam-induced motion. High-resolution information is lost due to the ~60 Å displacement of particles during image acquisition. (b) Average of the same 60 frames after translational alignment. The contrast is substantially improved, with details at a higher resolution that are not visible in A (Brilot et al., Reference Brilot, Chen, Cheng, Pan, Harrison, Potter, Carragher, Henderson and Grigorieff2012).

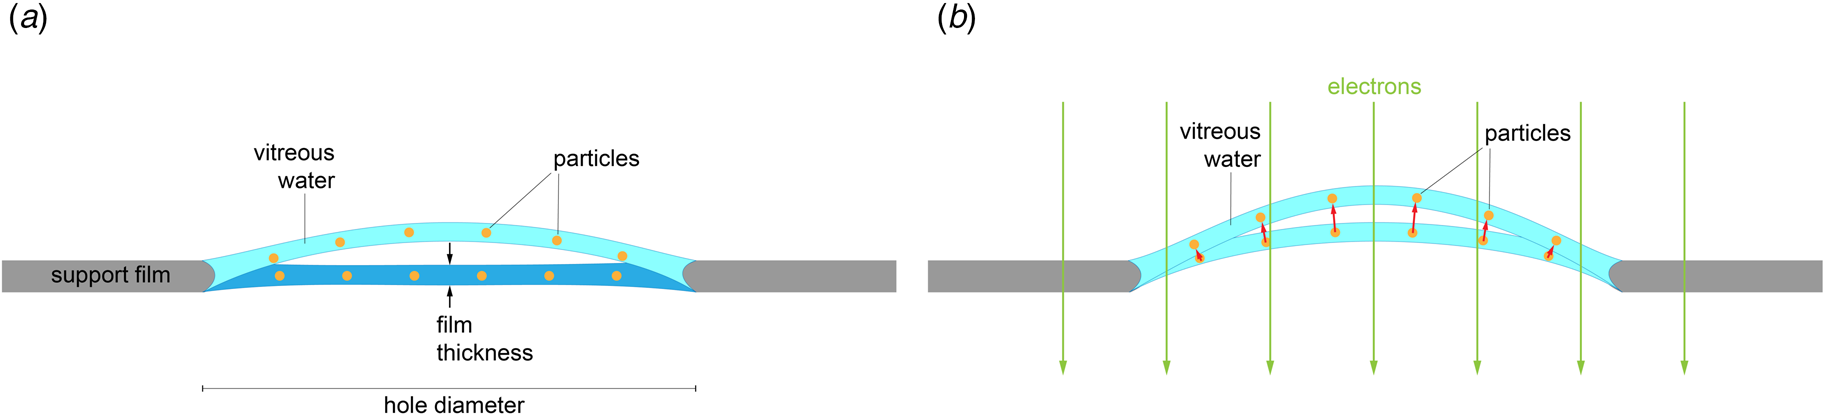
Rapid freezing traps mechanical stress in the layer of vitrified buffer (Fig. 2). When plunged into liquid ethane, the sample solution in the holes of the support film freezes and expands to lower-density vitreous water, while the support film itself contracts (Glaeser et al., Reference Glaeser, Han, Csencsits, Killilea, Pulk and Cate2016). As a result, the water layer in the hole buckles and forms a shallow dome, depending on the dimensions and geometry of the hole (Fig. 2a) (Naydenova et al., Reference Naydenova, Jia and Russo2020). The direction in which the layer domes or buckles appears to be random. When the vitrified layer is irradiated with electrons for cryoEM data collection (typically at ~84 K if the microscope is cooled with liquid nitrogen), the glass-like solid turns into viscous liquid (McMullan et al., Reference Mcmullan, Vinothkumar and Henderson2015). Mechanical stress is released, and the vitrified layer in the hole performs a drumhead motion. The direction of movement is the same as during freezing, resulting in a slightly more pronounced dome (Fig. 2b). This is evident from the direction of movement during electron exposure because, in projection, the particles on average appear to move away from the centre of the imaged area (Fig. 3a). During a 30 e A−2 exposure, virus particles in a thin layer of vitrified solution move by up to 60 Å and rotate by up to 5° (Brilot et al., Reference Brilot, Chen, Cheng, Pan, Harrison, Potter, Carragher, Henderson and Grigorieff2012) (Fig. 1). The linear movement is seen most easily when the specimen is tilted (Fig. 3b).
Doming of a solid water layer on a cryoEM specimen support. (a) Thin layers of solid water used in cryoEM buckle during vitrification. Dark blue, liquid layer before vitrification; light blue, domed vitrified layer. (b) Electron irradiation causes the vitreous layer to move in the direction in which it buckled upon freezing, as evident from the correlated particle movement at the beginning of irradiation (see Fig. 3). Adapted from Naydenova et al., (Reference Naydenova, Jia and Russo2020).
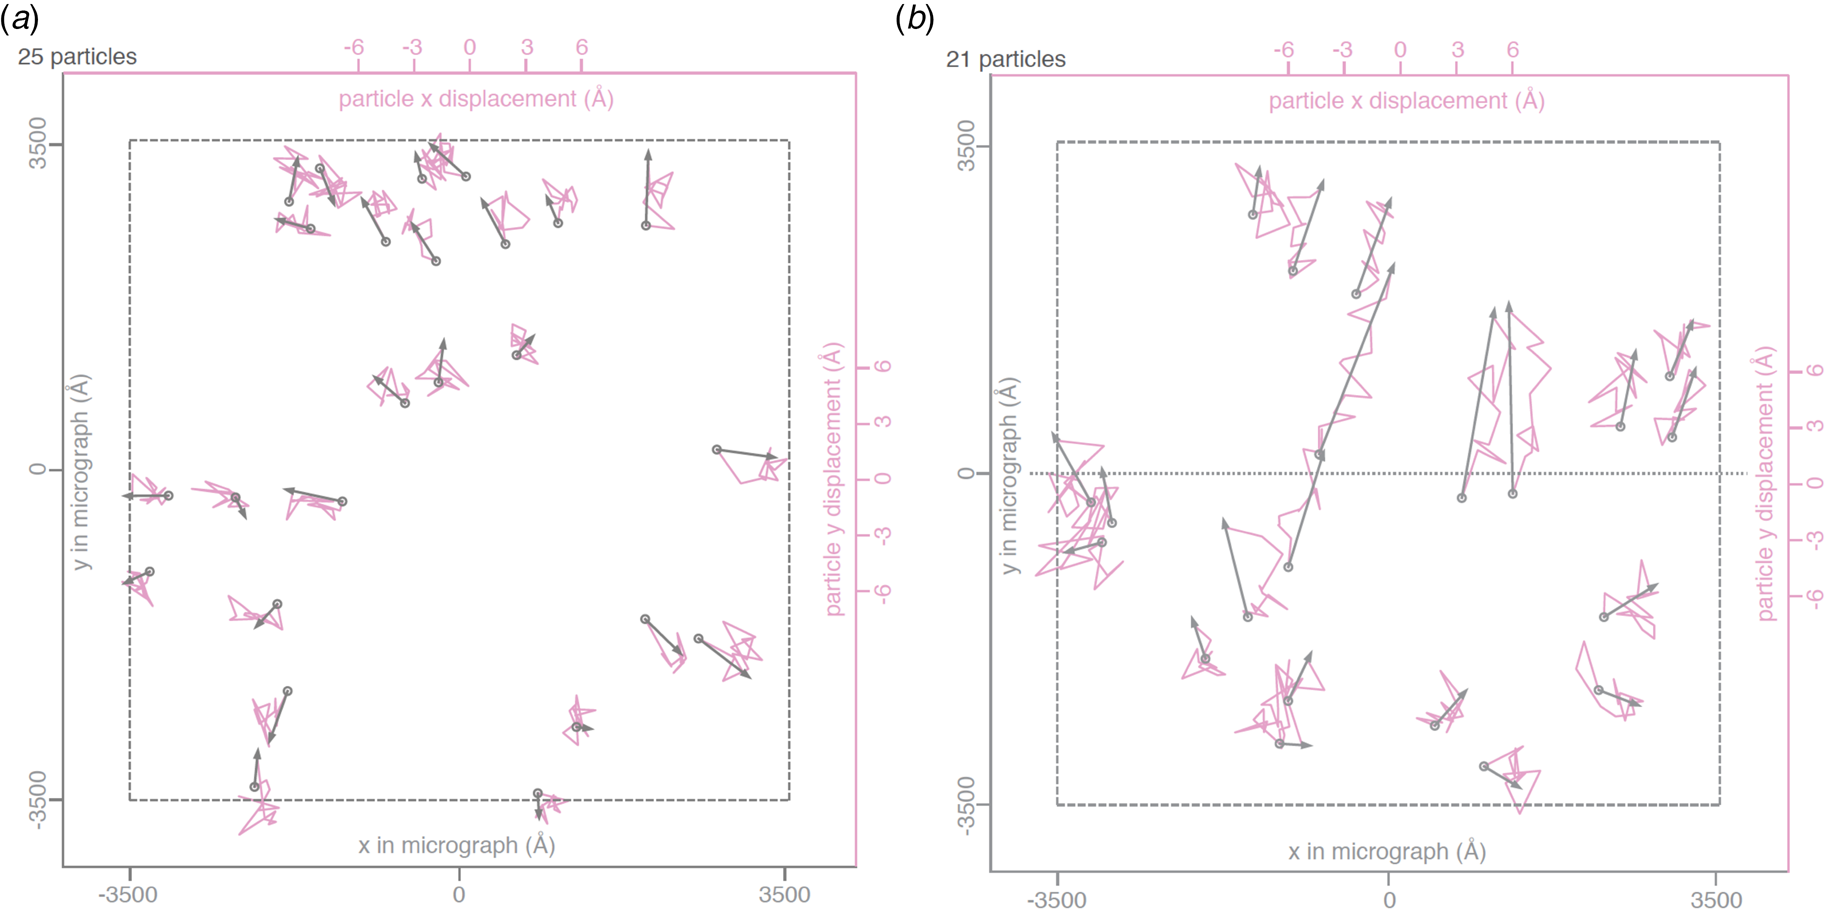
Beam-induced movement of gold particles. Gold particle trajectories in a layer of vitrified water in 840 nm holes of an all-gold specimen support at 0° (a) and 30° tilt (b). Grey arrows indicate total displacement within the first 20 e− A−2 of irradiation. The trajectories are expanded 200x. Dashed line – imaged area; dotted line – direction of tilt axis (Naydenova et al., Reference Naydenova, Jia and Russo2020).
Beam-induced movement of cryoEM specimens occurs in two phases (Fig. 4) (Russo and Passmore, Reference Russo and Passmore2014b; Pfeil-Gardiner et al., Reference Pfeil-Gardiner, Mills, Vonck and Kuehlbrandt2019). The initial phase is characterized by a burst-like motion, as the first electrons hit the specimen, releasing the stress trapped in the vitreous layer, and the doming becomes more pronounced. Movements in this early phase are up to five times higher than in the second phase, where moderate, continuous beam-induced motion probably results from the accumulation of new stress in the specimen, due to the breakage of covalent bonds and mass loss caused by radiation damage (Glaeser et al., Reference Glaeser, Mcmullan, Faruqi and Henderson2011; Glaeser, Reference Glaeser2016; Naydenova et al., Reference Naydenova, Jia and Russo2020). Surprisingly, the movement in both phases is worse by a factor of two or more for samples cooled with liquid helium to around 4–17 K, rather than with liquid nitrogen to 84 K (Fig. 4a) (Pfeil-Gardiner et al., Reference Pfeil-Gardiner, Mills, Vonck and Kuehlbrandt2019). For 2D crystals, cooling with liquid helium is known to reduce radiation damage by roughly a factor of two (Kühlbrandt et al., Reference Kühlbrandt, Wang and Fujiyoshi1994; Stark et al., Reference Stark, Zemlin and Boettcher1996). It would be excellent if we could take advantage of this extra cryoprotection factor for single particles as well, but at present, the massive beam-induced movement observed with non-crystalline, unsupported particles (Pfeil-Gardiner et al., Reference Pfeil-Gardiner, Mills, Vonck and Kuehlbrandt2019) counteracts and obliterates the potential beneficial effect of helium cooling. Once this puzzling problem is resolved, liquid helium cooling should improve the signal-to-noise ratio of low-dose single-particle images just as much as for 2D crystals.
Beam-induced movement of protein complexes. (a) Histogram of averaged per-frame particle movements in apoferritin specimens cooled with liquid nitrogen to 85 K (red) or liquid helium to 17 K (Pfeil-Gardiner et al., Reference Pfeil-Gardiner, Mills, Vonck and Kuehlbrandt2019). (b) Averaged beam-induced per-frame particle movements of alcohol oxidase particles in vitrified (blue) and devitrified (orange) layers of solid water. Adapted from Wieferig et al. (Reference Wieferig, Mills and Kühlbrandt2021).

Measurements of radiation damage with 300 kV electrons at liquid nitrogen temperature indicate a damage rate (expressed as a B factor) of ~5 Å2 for every e Å−2, both for single particles (Grant and Grigorieff, Reference Grant and Grigorieff2015) and 2D crystals (Peet et al., Reference Peet, Henderson and Russo2019b). There is no reason why at liquid helium temperature, single particles and 2D crystals should behave differently. Earlier measurements with 2D bacteriorhodopsin crystals (purple membrane) at liquid nitrogen temperature (Stark et al., Reference Stark, Zemlin and Boettcher1996) had suggested a damage rate that was several times higher, which however appears to be an outlier (Naydenova et al., Reference Naydenova, Jia and Russo2020).
When cryoEM images are recorded as movie stacks with a direct electron detector, beam-induced movement can in principle be corrected by aligning successive movie frames (Brilot et al., Reference Brilot, Chen, Cheng, Pan, Harrison, Potter, Carragher, Henderson and Grigorieff2012; Campbell et al., Reference Campbell, Cheng, Brilot, Moeller, Lyumkis, Veesler, Pan, Harrison, Potter, Carragher and Grigorieff2012; Ripstein and Rubinstein, Reference Ripstein and Rubinstein2016). The first few frames, at a cumulative dose of ~3–4 e Å−2, are the least affected by radiation damage and therefore contain the most valuable high-resolution information. Due to the low electron exposure, the signal-to-noise ratio in all frames is poor, and therefore beam-induced particle movements are difficult to trace. These movements are particularly large in the first few frames. In early studies, the initial frames were simply discarded (Liao et al., Reference Liao, Cao, Julius and Cheng2013; Allegretti et al., Reference Allegretti, Mills, Mcmullan, Kühlbrandt and Vonck2014; Vinothkumar et al., Reference Vinothkumar, Mcmullan and Henderson2014). A better option is to down-weight the first few frames by an appropriate B factor, which is what all current image processing packages do (Grigorieff et al., Reference Grigorieff, Grant and Rohou2017; Punjani et al., Reference Punjani, Rubinstein, Fleet and Brubaker2017; Zheng et al., Reference Zheng, Palovcak, Armache, Verba, Cheng and Agard2017; Zivanov et al., Reference Zivanov, Nakane, Forsberg, Kimanius, Hagen, Lindahl and Scheres2018). Beam-induced movement – unlike macroscopic mechanical movement, caused e.g. by stage drift – happens on a time scale of pico- or nanoseconds (Guo et al., Reference Guo, Franken, Deng, Benlekbir, Singla Lezcano, Janssen, Yu, Ripstein, Tan and Rubinstein2020). Therefore, even the fastest and most sensitive detectors (Sun et al., Reference Sun, Azumaya, Tse, Frost, Southworth, Verba, Cheng and Agard2020), including any that may be developed in future, are unlikely to keep track of such very rapid movements with images that would necessarily be recorded at an extremely low dose and correspondingly low signal-to-noise ratio.
In principle, the mechanical stress trapped in the vitreous layer should be released upon devitrification. Devitrification converts solid vitreous water into thermodynamically metastable, but mechanically stable microcrystalline cubic ice. It is achieved by carefully warming the sample above the devitrification point at 143 K. Devitrification has been shown to preserve high-resolution detail in biological specimens (Cyrklaff and Kühlbrandt, Reference Cyrklaff and Kühlbrandt1994). Indeed, movies of protein particles in devitrified cryo-specimens indicate that beam-induced motion is reduced by a factor of ~4 in the first phase of rapid movement, and by a factor of 2 in the subsequent slower phase (Fig. 4b) (Wieferig et al., Reference Wieferig, Mills and Kühlbrandt2021). A theoretical analysis of beam-induced movement based on heat transfer rates during cooling (Thorne, Reference Thorne2020) makes a number of suggestions of how the movement can be reduced, e.g. by appropriate choice of materials for the grid and support film. Unfortunately, controlled devitrification is not feasible in the column of high-end electron cryo-microscopes that are currently available, and devitrification outside the column vacuum entails a high risk of ice contamination.
All-gold support foils with sub-μm holes
Recently introduced all-gold cryoEM grid supports with very small holes appear to all but eliminate the long-standing problem of beam-induced specimen movement. Stable all-gold grids with standard-sized, 1.2–2 μm holes are known to reduce the movement induced by the electron beam by 40–80% (Russo and Passmore, Reference Russo and Passmore2014b). Progressively smaller holes were found to result in correspondingly smaller movements. At a hole diameter of around 250 nm, beam-induced movement all but disappeared. On this basis, new all-gold grids, referred to as ‘HexAuFoil’ (Fig. 5), have been developed (Naydenova et al., Reference Naydenova, Jia and Russo2020). HexAuFoils are arrays of 180–300 nm holes on a hexagonal lattice to maximize the transparent area. The new grids reduce beam-induced particle movement to less than 1 Å – about the diameter of a hydrogen atom – in a 30 e A−2 movie (Fig. 6). The movement depends on the extent to which the vitreous water layer buckles or domes, which in turn depends on its thickness and the hole diameter. Theoretical considerations indicated that doming should become insignificant at an aspect ratio of 11:1 (hole diameter to ice layer thickness) or less, and Russo and colleagues have demonstrated experimentally that this is in fact the case. With a vitreous water layer thickness of 300 Å that is e.g. desirable for 200 Å particles, the maximum hole diameter for motion-free imaging is thus ~3300 Å, or 330 nm. The thickness of the gold foil should be similar to the desired vitreous water thickness, e.g. around 300 Å. The new supports should make it possible to take advantage of the added cryoprotection offered by liquid helium for high-resolution single-particle cryoEM.
All-gold specimen supports with sub-μm holes. (a) HexAuFoil grid support designed for movement-free cryoEM imaging. A 3 mm grid contains ~800 hexagons, each of which includes more than 5000 holes on a hexagonal lattice. The green line encircles ~800 holes. (b) Transmission electron micrograph of the holey gold foil, with arrows delineating the hexagonal lattice. (c) Micrograph of a single empty 200 nm hole. (d) Low-dose transmission electron micrograph of the 223 kDa DPS protein vitrified in the 260 nm holes of a HexAuFoil grid (Naydenova et al., Reference Naydenova, Jia and Russo2020).

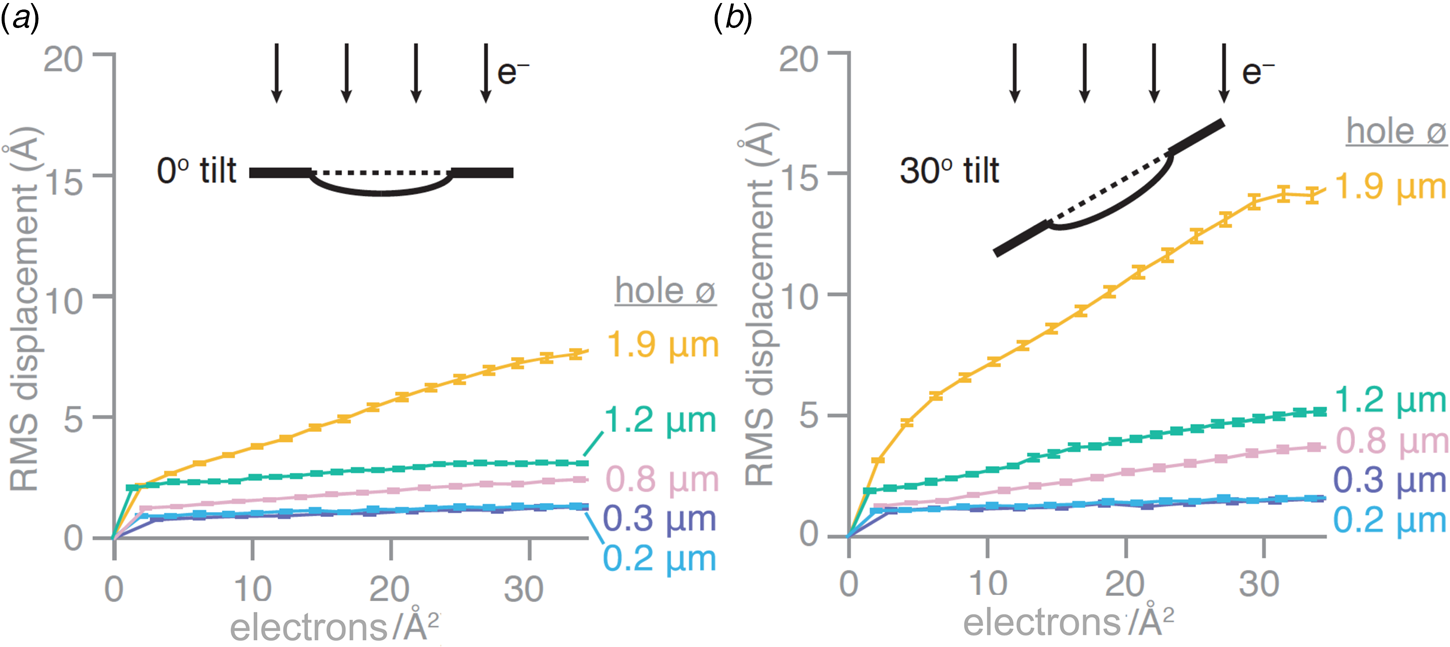
Beam-induced movement depends on hole diameter. Root mean squared (RMS) displacements of gold particles in vitrified water from movies of all-gold grid holes of different diameters. Displacements are plotted as a function of cumulative electron dose for untilted specimens (a) and specimens tilted in the electron microscope by 30° (b) (Naydenova et al., Reference Naydenova, Jia and Russo2020).
The structure of DPS (DNA protection during starvation), a soluble, 223 kDa protein prepared on all-gold grids with 260 nm holes, was determined at 2 Å resolution. Amplitudes and phases of structure factors that change monotonously with increasing irradiation were extrapolated to zero dose, yielding a high-resolution map and the first cryoEM structure of a pristine, undamaged protein. The absence of radiation damage was most apparent in amino acid sidechains that are known to be particularly sensitive to electron irradiation, such as aspartates and glutamates, which lose their carboxyl groups at a dose of 1–10 e Å−2, and in the observation of nearby ordered water molecules (Fig. 7a). The relative per-frame B-factor, which should approach zero if there is no radiation damage, extrapolated to 0 Å2 at a dose of zero electrons (Fig. 7b).
Protein structure at zero electron dose. (a) Plot of the mean squared displacement during irradiation (red) for DPS protein particles, and relative per-frame B-factor with respect to the first frame (black), with linear fits to both. The particle displacement corresponds to diffusion with a constant of 0.02 A2 (e− A−2)−1 (red line). (b) Selected side chains and a water molecule from zero-dose extrapolated and per-frame reconstructions of DPS protein indicate progressive radiation damage. The dose is given in (e− A−2) and MGy. Residues in the refined atomic model are coloured by atom (C – grey, N – blue, O – red), and the contoured density map is shown as a mesh (Naydenova et al., Reference Naydenova, Jia and Russo2020).
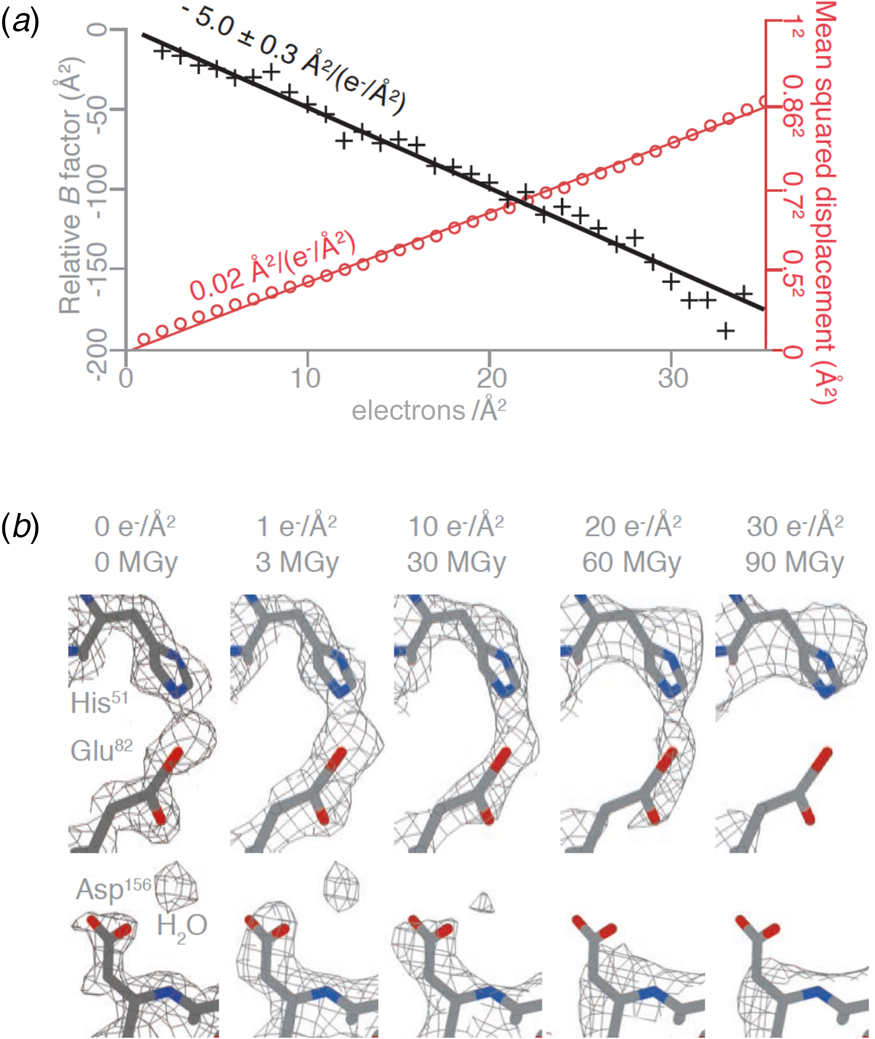
At a dose of 1 e Å−2, or 3 MGy, radiation-sensitive sidechains appear to be still intact and water molecules in place. However, such a low dose does not produce sufficient contrast for high-resolution electron image processing, and therefore cryoEM data have to be collected at a higher total electron dose, usually around 30–40 e Å−2. Note that a typical data set in X-ray protein crystallography is collected at a total dose of 1.5 MGy, equivalent to 0.5 e Å−2. Even though X-rays are about 1000 times more damaging than electrons per elastic scattering event (Henderson, Reference Henderson1995), the damage in protein crystallography is spread out over billions of identical molecules on the crystal lattice, and therefore the molecules appear on average undamaged.
As a cautionary note, the resolution achieved with a ring-shaped heptameric bacterial light-harvesting complex on HexAuFoils (Gardiner et al., Reference Gardiner, Naydenova, Castro-Hartmann, Nguyen-Phan, Russo, Sader, Hunter, Cogdell and Qian2021) was only slightly better than with conventional Quantifoil supports, most likely due to inherent flexibility of the particles. Particle flexibility and dynamics thus remain limiting, even when other limiting factors including beam-induced movement, radiation damage, particle number or particle size can be ruled out.
Protein adsorption to the air-water interface
Once the thorny problem of beam-induced movement is resolved, the main obstacle on the way towards routine structure determination of single particles by high-resolution cryoEM is the interaction of biological macromolecules with the air-water interface.
When preparing a specimen for single-particle cryoEM, the aqueous sample solution is usually spread into a thin layer. This inevitably results in a high surface-to-volume ratio and maximizes the exposure of the particles to air. Because air is hydrophobic and proteins are amphipathic polymers, they tend to interact more or less strongly with the air-water interface. For high-resolution cryoEM, protein adsorption to the air-water interface has two drawbacks: (i) it often results in preferential particle orientation, a frequent cause of anisotropic resolution, and (ii) surface forces can disrupt the adsorbed particles partly or completely.
Protein denaturation at the air-water-interface has been studied since the 1930s (Neurath and Bull, Reference Neurath and Bull1938; Trurnit, Reference Trurnit1960; Ramsden, Reference Ramsden1994; Taylor and Glaeser, Reference Taylor and Glaeser2008; Glaeser, Reference Glaeser2018). The process is diffusion-limited and scales roughly with protein concentration (Israelachvili, Reference Israelachvili2011). Protein complexes in the 50 kDa to 5 MDa size range (which includes most samples for single-particle cryoEM) collide with the air-water interface thousands of times every second during specimen preparation (Naydenova and Russo, Reference Naydenova and Russo2017). Every encounter carries the risk of partial or complete denaturation. In most of the recent high-resolution cryoEM structures, only a minor fraction of a large single-particle data set contributes to the final high-resolution map. Percentages of particles used for reconstruction were 19% for the human synaptic GABAA receptor at 3.8 Å resolution (Zhu et al., Reference Zhu, Noviello, Teng, Walsh, Kim and Hibbs2018); 15% for human P-glycoprotein at 3.4 Å (Kim and Chen, Reference Kim and Chen2018); 12% for the nucleosome at 4 Å (Takizawa et al., Reference Takizawa, Tanaka, Machida, Koyama, Maehara, Ohkawa, Wade, Wolf and Kurumizaka2018); 8.9% for the 3.4 Å structure of human γ-secretase (Bai et al., Reference Bai, Yan, Yang, Lu, Ma, Sun, Zhou, Scheres and Shi2015); and only 5.7% for the 4 Å structure of a sodium channel complex from electric eel (Yan et al., Reference Yan, Zhou, Wang, Wu, Zhao, Huang, Peng, Shen, Lei and Yan2017). The remaining, up to 94% of particles were excluded from the final data set. With small proteins (less than ~150 kDa), misalignment may partly account for this high proportion of unused particles. With large complexes, damage during isolation or cryoEM grid preparation is a more likely reason. Most of this damage is probably caused by surface forces, although shear forces during blotting can also play a role (Armstrong et al., Reference Armstrong, Han, Gomez, Turner, Fletcher and Glaeser2019).
Improving sample quality
The surface activity of proteins, and hence their propensity to adhere to the air-water interface, correlates with their stability in solution (Razumovsky and Damodaran, Reference Razumovsky and Damodaran1999). Protein stability can be improved by adjusting buffer conditions, in particular pH and ionic strength. A data-mining study of high-resolution X-ray and cryoEM structures has found that most protein complexes are more stable at slightly acidic or basic rather than neutral pH (Chari et al., Reference Chari, Haselbach, Kirves, Ohmer, Paknia, Fischer, Ganichkin, Möller, Frye, Petzold, Jarvis, Tietzel, Grimm, Peters, Schulman, Tittmann, Markl, Fischer and Stark2015), and it is worth bearing this in mind when optimizing buffer conditions for cryoEM samples. At the same time, salt concentrations above 100 mM reduce image contrast, because the ions in the buffer scatter electrons more strongly than water. This is also true for commonly used stabilizing organic co-solutes, such as glycerol or trehalose. G-protein coupled receptors and other sensitive proteins have been stabilized by systematic mutagenesis to generate thermostable variants for crystallization and X-ray crystallography (Magnani et al., Reference Magnani, Serrano-Vega, Shibata, Abdul-Hussein, Lebon, Miller-Gallacher, Singhal, Strege, Thomas and Tate2016). Thermostable variants work equally well for cryoEM (Lee et al., Reference Lee, Warne, Nehme, Pandey, Dwivedi-Agnihotri, Chaturvedi, Edwards, Garcia-Nafria, Leslie, Shukla and Tate2020). The same is likely to be true for other approaches that have been used to improve protein quality and stability for crystallization, e.g. removal of affinity tags, covalent modification including phosphorylation or methylation, addition of cofactors or other small molecules, addition of stabilizing antibodies or antibody fragments. The success of any such approach will depend on a massive increase in the capacity for screening cryoEM specimens, which is currently a bottleneck.
Membrane proteins are usually kept in solution by detergents, but are often more stable when reconstituted into amphipols (Tribet et al., Reference Tribet, Audebert and Popot1996; Popot, Reference Popot2010; Althoff et al., Reference Althoff, Mills, Popot and Kühlbrandt2011; Liao et al., Reference Liao, Cao, Julius and Cheng2013; Wilkes et al., Reference Wilkes, Madej, Kreuter, Rhinow, Heinz, De Sanctis, Ruppel, Richter, Joos, Grieben, Pike, Huiskonen, Carpenter, Kühlbrandt, Witzgall and Ziegler2017) or lipid nanodiscs (Matthies et al., Reference Matthies, Dalmas, Borgnia, Dominik, Merk, Rao, Reddy, Islam, Bartesaghi, Perozo and Subramaniam2016; Hardy et al., Reference Hardy, Desuzinges Mandon, Rothnie and Jawhari2018; Alvadia et al., Reference Alvadia, Lim, Mosina, Oostergetel, Dutzler and Paulino2019; Saotome et al., Reference Saotome, Teng, Tsui, Lee, Tu, Kaplan, Sansom, Liman and Ward2019). For soluble complexes, the detergent CHAPSO in combination with potassium chloride has helped to avoid the adsorption of soluble complexes such as bacterial RNA polymerase to the air-water interface (Chen et al., Reference Chen, Noble, Kang and Darst2019). For some membrane protein complexes, the same effect has been achieved with fluorinated detergents (Efremov et al., Reference Efremov, Leitner, Aebersold and Raunser2015; Blees et al., Reference Blees, Januliene, Hofmann, Koller, Schmidt, Trowitzsch, Moeller and Tampé2017; Liu et al., Reference Liu, Zhang, Csanády, Gadsby and Chen2017), which may compensate the protein surface charge, or form a surface monolayer that is less hydrophobic than the air-water interface itself.
Some sensitive proteins are damaged by interaction with solid surfaces long before they encounter a cryoEM grid (Rabe et al., Reference Rabe, Verdes and Seeger2011; Zhou et al., Reference Zhou, Zhang, Zhang, Pillai, Liu, Li, Dai, Li and Zhang2013; Lee et al., Reference Lee, Elam and Darling2016), and this can be a serious drawback when these proteins are purified by column chromatography or concentrated by centrifugation through a semi-permeable membrane (Joppe et al., Reference Joppe, D'imprima, Salustros, Paithankar, Vonck, Grininger and Kuhlbrandt2020). Purification or concentration steps that do not involve column chromatography or dialysis membranes, such as density gradient centrifugation or even ammonium sulphate precipitation (Hahn et al., Reference Hahn, Vonck, Mills, Meier and Kühlbrandt2018), can be preferable for producing undamaged protein samples for single-particle cryoEM.
An insidious problem that is not related to sample quality or indeed specimen preparation is the inherent flexibility of a protein or its domains. Image processing cannot sort continuously flexible particles into distinct classes, and therefore the affected regions are typically of low resolution. A recent example is the cryoEM structure of the sodium/proton exchanger NHX, a eukaryotic membrane protein with a well-resolved membrane part at 3.2 Å, and a continually flexible regulatory cytoplasmic domain, for which the map resolution was only ~15 Å (Wöhlert et al., Reference Wöhlert, Yildiz and Kühlbrandt2021). Possible solutions include attachment of specific antibodies against cytoplasmic epitopes, or of natural binding partners that might fix the domain in one or a few distinct conformations. Another option would be 3D crystallization and X-ray crystallography, hoping that crystal contacts might help to overcome domain flexibility.
Continuous support films
On the holey carbon films that are most commonly used for cryoEM specimen preparation, the sample is exposed to air on both surfaces of a hole. An obvious way around this potential problem is to prepare the sample on a continuous support film without holes that scatters electrons weakly, such as a thin film of amorphous carbon, graphene oxide or graphene. Many proteins tend to adhere to the support film, as do protein fragments, dissociated subunits or contaminants. If a protein is damaged by surface forces at the air-water interface, it may be possible to remove some or most of the denatured particles by blotting. Note that strong interaction with the support film can denature a protein, while weaker interactions result in preferential orientation, as on the air-water interface. However, the orientation distribution is likely to be different, and this can be turned into an advantage for high-resolution structure determination.
(a) Amorphous carbon films have been the standard support for biological electron microscopy at room temperature since the early 1950s (Bradley, Reference Bradley1954), but they have also been used for high-resolution cryoEM of soluble (Bai et al., Reference Bai, Fernandez, Mcmullan and Scheres2013; Nguyen et al., Reference Nguyen, Galej, Bai, Savva, Newman, Scheres and Nagai2015; Haselbach et al., Reference Haselbach, Komarov, Agafonov, Hartmuth, Graf, Dybkov, Urlaub, Kastner, Lührmann and Stark2018; Jahagirdar et al., Reference Jahagirdar, Jha, Basu, Gomez-Blanco, Vargas and Ortega2020) and membrane protein complexes (Schraidt and Marlovits, Reference Schraidt and Marlovits2011; D'Imprima et al., Reference D'imprima, Salzer, Bhaskara, Sanchez, Rose, Kirchner, Hummer, Kühlbrandt, Vonck and Averhoff2017; van Pee et al., Reference Van Pee, Neuhaus, D'imprima, Mills, Kühlbrandt and Yildiz2017; Menny et al., Reference Menny, Serna, Boyd, Gardner, Joseph, Morgan, Topf, Brooks and Bubeck2018; Singh et al., Reference Singh, Graf, Linden, Sautner, Urlaub, Tittmann, Stark and Chari2020). Amorphous carbon films are inexpensive and easily prepared in the EM laboratory (Booth et al., Reference Booth, Avila-Sakar and Cheng2011). They are usually 30–50 Å thick. Proteins tend to adsorb to the carbon film, and this effect can reduce the protein concentration needed for data collection.
Depending on thickness, amorphous carbon films reduce contrast and contribute to background noise (Pantelic et al., Reference Pantelic, Meyer, Kaiser and Stahlberg2012), which can be problematic especially for small particles in the 50–200 kDa range. Mechanical stability (Russo and Passmore, Reference Russo and Passmore2016a, Reference Russo and Passmore2016b) and surface chemistry of amorphous carbon films, in particular hydrophobicity and surface charge (Larson et al., Reference Larson, Downing and Glaeser2011), are critical for cryoEM specimen preparation, yet notoriously difficult to control. Graphene and graphene oxide have better-defined surface properties and contribute only minimally to background noise. Both are therefore excellent, although more demanding alternatives to amorphous carbon support films.
(b) Graphene oxide is an oxygenated, hydrophilic form of graphene, in which pristine areas are interspersed with oxidized carbon (Mkhoyan et al., Reference Mkhoyan, Contryman, Silcox, Stewart, Eda, Mattevi, Miller and Chhowalla2009). Oxidized graphene can be chemically modified to generate functionalized surfaces for specific protein attachment (Wang et al., Reference Wang, Liu, Yu, Li, Feng, Cheng and Agard2020a, Reference Wang, Yu, Betegon, Campbell, Aksel, Zhao, Li, Douglas, Cheng and Agard2020b). Graphene oxide is typically sold as a colloidal suspension of – usually multi-layered – flakes (Bokori-Brown et al., Reference Bokori-Brown, Martin, Naylor, Basak, Titball and Savva2016; Boland et al., Reference Boland, Martin, Zhang, Yang, Bai, Chang, Scheres and Barford2017; Coscia et al., Reference Coscia, Taler-Verčič, Chang, Sinn, O'reilly, Izoré, Renko, Berger, Rappsilber, Turk and Löwe2020). The average thickness of each layer is ~10 Å (Mkhoyan et al., Reference Mkhoyan, Contryman, Silcox, Stewart, Eda, Mattevi, Miller and Chhowalla2009). The flakes are easily deposited on support grids either by direct application of graphene oxide suspension (Boland et al., Reference Boland, Martin, Zhang, Yang, Bai, Chang, Scheres and Barford2017), or by floating them onto EM grids as a continuous film of graphene oxide spread on a water-methanol bath (Palovcak et al., Reference Palovcak, Wang, Zheng, Yu, Li, Betegon, Bulkley, Agard and Cheng2018). However, it is not certain that either method produces large single layers of graphene oxide reproducibly, and it is advisable to check each grid individually in the electron microscope before applying the sample. Graphene oxide introduces less background noise than amorphous carbon, as judged from the intensity of Thon rings (Pantelic et al., Reference Pantelic, Meyer, Kaiser, Baumeister and Plitzko2010). When using graphene oxide supports, it is common to dilute the sample to nanomolar concentration, which is below the K d of many protein complexes, which would then tend to dissociate.
(c) Graphene is a crystalline monolayer of carbon atoms. It is an excellent conductor (Geim and Novoselov, Reference Geim and Novoselov2007) and has the highest in-plane strength of any known material (Young's modulus 1 TPa) (Lee et al., Reference Lee, Wei, Kysar and Hone2008). Graphene is stable under a 300 kV electron beam (Sader et al., Reference Sader, Stopps, Calder and Rosenthal2013) and almost completely transparent to electrons in the range of interest for biological cryoEM, since the spacing of the first Bragg peak is at 2.13 Å resolution. Because graphene is a perfect single crystal, its minimal contribution to background noise can be removed by Fourier filtering if necessary. In principle, these desirable properties make graphene the ideal support film for cryoEM (Han et al., Reference Han, Fan, Wang, Zhao, Tully, Kong, Yao and Yan2020). The reasons why it has not been used more widely are twofold: (i) it is highly susceptible to surface contamination during production, handling and storage; and (ii) it is extremely hydrophobic.
Graphene is commercially available as a single-atom layer on a supporting substrate called the sacrificial layer. The sacrificial layer consists of a polymer such as polydimethylsiloxane or polymethyl methacrylate (Li et al., Reference Li, Zhu, Cai, Borysiak, Han, Chen, Piner, Colomba and Ruoff2009; Chen et al., Reference Chen, Haddon, Yan and Bekyarova2017). The sacrificial layer is removed prior to specimen preparation, which almost always results in surface contamination of the graphene film. Polymer substrates tend to leave contaminants that are resistant to organic solvents (Tripathi et al., Reference Tripathi, Mittelberger, Mustonen, Mangler, Kotakoski, Meyer and Susi2017) and to heating in vacuum to ~500 °C (Lin et al., Reference Liu, Tang and Gooding2012). Even when handling pristine graphene in an inert atmosphere of N2 or Ar/H2, hydrocarbon contaminants can saturate the surface within 10 min, once the films are exposed to air (Pantelic et al., Reference Pantelic, Meyer, Kaiser and Stahlberg2012). The rate and extent of surface contamination depend on storage conditions (Naydenova et al., Reference Naydenova, Peet and Russo2019b). Some producers deposit graphene monolayers on a copper/gold substrate on silicon wafers (Lee et al., Reference Lee, Kim, Shin, Lee, Lee, Moon, Lim and Chan Jun2013). Transfer from Cu/Au substrates yields cleaner films but requires a more laborious, multi-step procedure, during which the Cu support is dissolved in dilute FeCl3 solution and gold is etched away with potassium iodide/iodine (Passmore and Russo, Reference Passmore and Russo2016).
Graphene can be made hydrophilic by exposure to a low-energy (10–15 eV) hydrogen plasma (Russo and Passmore, Reference Russo and Passmore2014a) that does not damage the sp 2 carbon bonds (bond energy 21 eV). Graphene can be covalently modified to produce support films with defined functionality (Liu et al., Reference Liu, Zhang, Chen, Liu, Zhang, Xu, Wen, Luo, Chen, Gao, Jia, Liu, Peng and Wang2019; Naydenova et al., Reference Naydenova, Peet and Russo2019b). A simpler alternative is non-covalent chemical doping (Liu et al., Reference Liu, Tang and Gooding2012), taking advantage of π-stacking interactions between the graphene surface and polycyclic aromatic compounds, such as pyrene derivatized with polar groups (Pantelic et al., Reference Pantelic, Fu, Schoenenberger and Stahlberg2014) (Fig. 8). When graphene films are washed with a solution of 1-pyrene carbonic acid (1-PCA), the surface becomes hydrophilic and water-soluble proteins adhere to it. By using other pyrene derivatives, the surface chemistry can be adapted to specific requirements (Pantelic et al., Reference Pantelic, Fu, Schoenenberger and Stahlberg2014).
Electron cryo-tomography of fatty acid synthase (FAS) on cryoEM grids. (a) Particle distribution of FAS particles (orange) in an unsupported vitrified buffer in a 2 μm grid hole. Red arrows indicate fragmented or damaged FAS particles. The inset shows orthogonal views of a single FAS particle distorted by adsorption to the air-water interface (blue line). A slab of the tomographic volume (below) indicates that most particles adhere to the lower meniscus. Both air-water interfaces are delineated by small contaminating ice crystals (light blue). (b) FAS particles on a hydrophilized graphene support. A slab of the tomographic volume indicates that all FAS particles adhere to the graphene film and are fully embedded in the ~80 nm water layer. Subsequent 3D reconstruction (not shown) yielded a 3.1 Å map of the undamaged complex (Joppe et al., Reference Joppe, D'imprima, Salustros, Paithankar, Vonck, Grininger and Kuhlbrandt2020). Adapted from D'Imprima et al. (Reference D'imprima, Floris, Joppe, Sanchez, Grininger and Kühlbrandt2019).
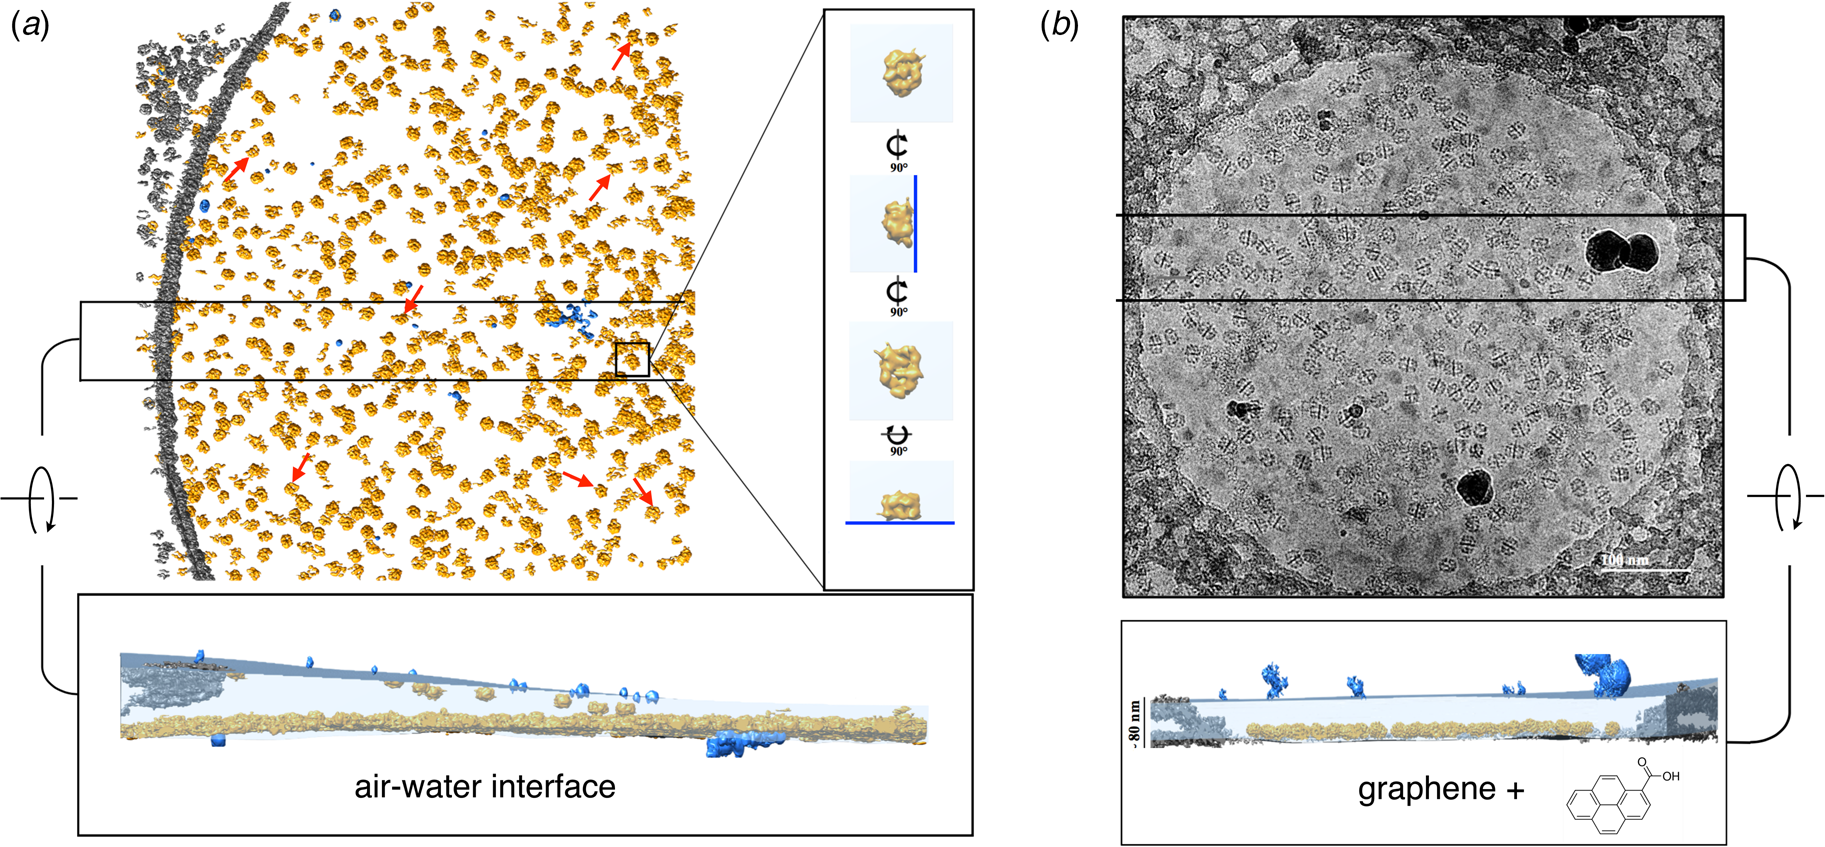
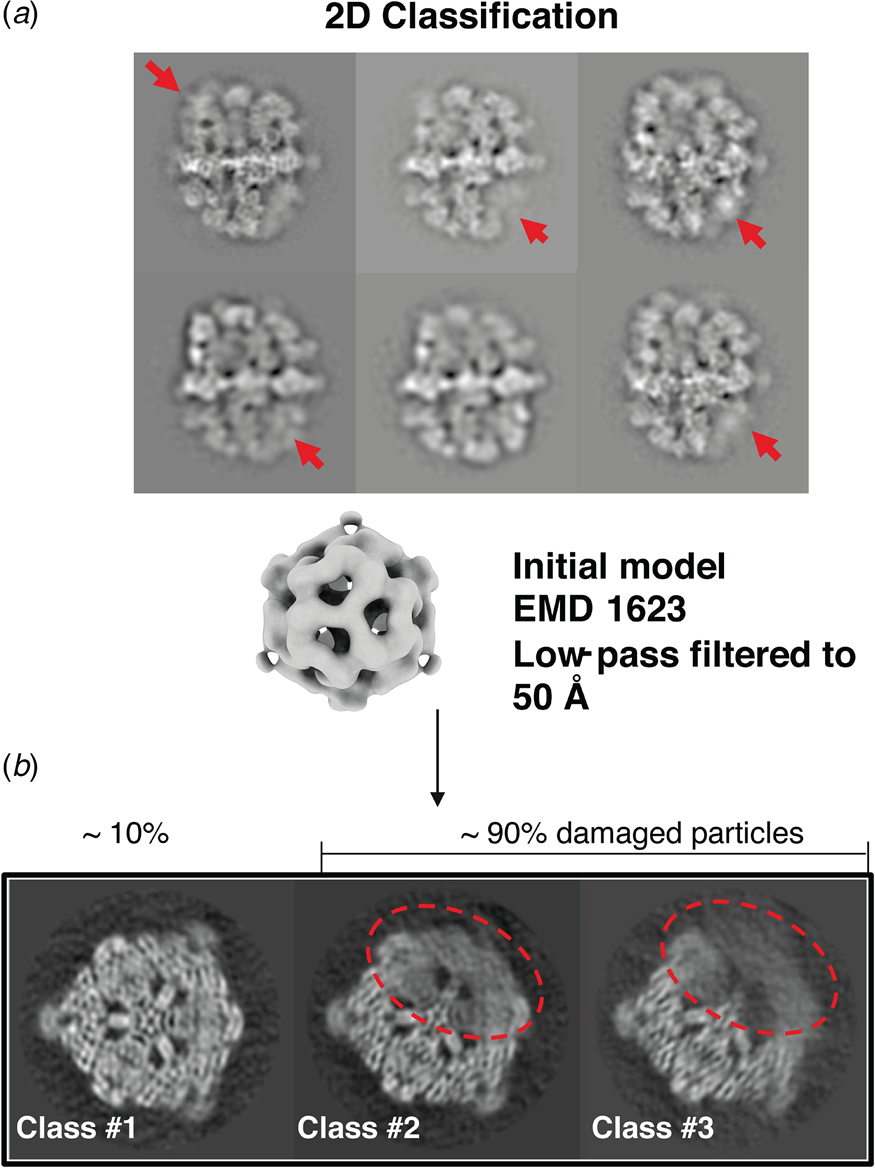
A cryoEM study of yeast fatty acid synthase (FAS), a 2.7 MDa soluble multi-enzyme complex, found that 90% of the particles in the holes of a standard holey carbon film were damaged at the air-water interface (D'Imprima et al., Reference D'imprima, Floris, Joppe, Sanchez, Grininger and Kühlbrandt2019). The side of the particles exposed to air had unfolded locally, while the domains immersed in the aqueous phase remained intact (Fig. 9). When the complex was instead prepared on graphene monolayers doped with 1-PCA, virtually none of the particles were damaged (D'Imprima et al., Reference D'imprima, Floris, Joppe, Sanchez, Grininger and Kühlbrandt2019). The phosphopantetheine transferase (PPT) domain of yeast FAS is particularly sensitive to surface denaturation, e.g. during column chromatography. When chromatography was omitted and the complex prepared for cryoEM on hydrophilized graphene supports, a 3D map at an isotropic resolution of 3.1 Å was obtained, including the fully resolved PPT domain (Joppe et al., Reference Joppe, D'imprima, Salustros, Paithankar, Vonck, Grininger and Kuhlbrandt2020).
Partial denaturation of FAS at the air-water interface. (a) Two-dimensional class averages of FAS in unsupported vitrified buffer indicate weak or distorted density in some of the six β subunits (red arrows). (b) Three-dimensional classification reveals partial denaturation (dashed red outline) in about 90% of all particles. The remaining ~10% (dashed grey outline) are undamaged. Adapted from D'Imprima et al. (Reference D'imprima, Floris, Joppe, Sanchez, Grininger and Kühlbrandt2019).
New methods of sample deposition
In addition to protein stabilization and support films, new methods for rapid deposition of the sample on cryoEM grids are being developed to speed up grid preparation and reduce the time during which the sample is exposed to air (Fig. 10). The new preparation techniques avoid blotting the grid with filter paper (Fig. 10a), which not only causes mechanical stress (Armstrong et al., Reference Armstrong, Han, Gomez, Turner, Fletcher and Glaeser2019), but – depending on chemical composition – may release small amounts of Mg2+ and Ca2+ ions that can affect the structure of biological macromolecules (Walker et al., Reference Walker, White, Belknap and Trinick1994). The use of ashless filter paper or glass fibre filters circumvents this problem.
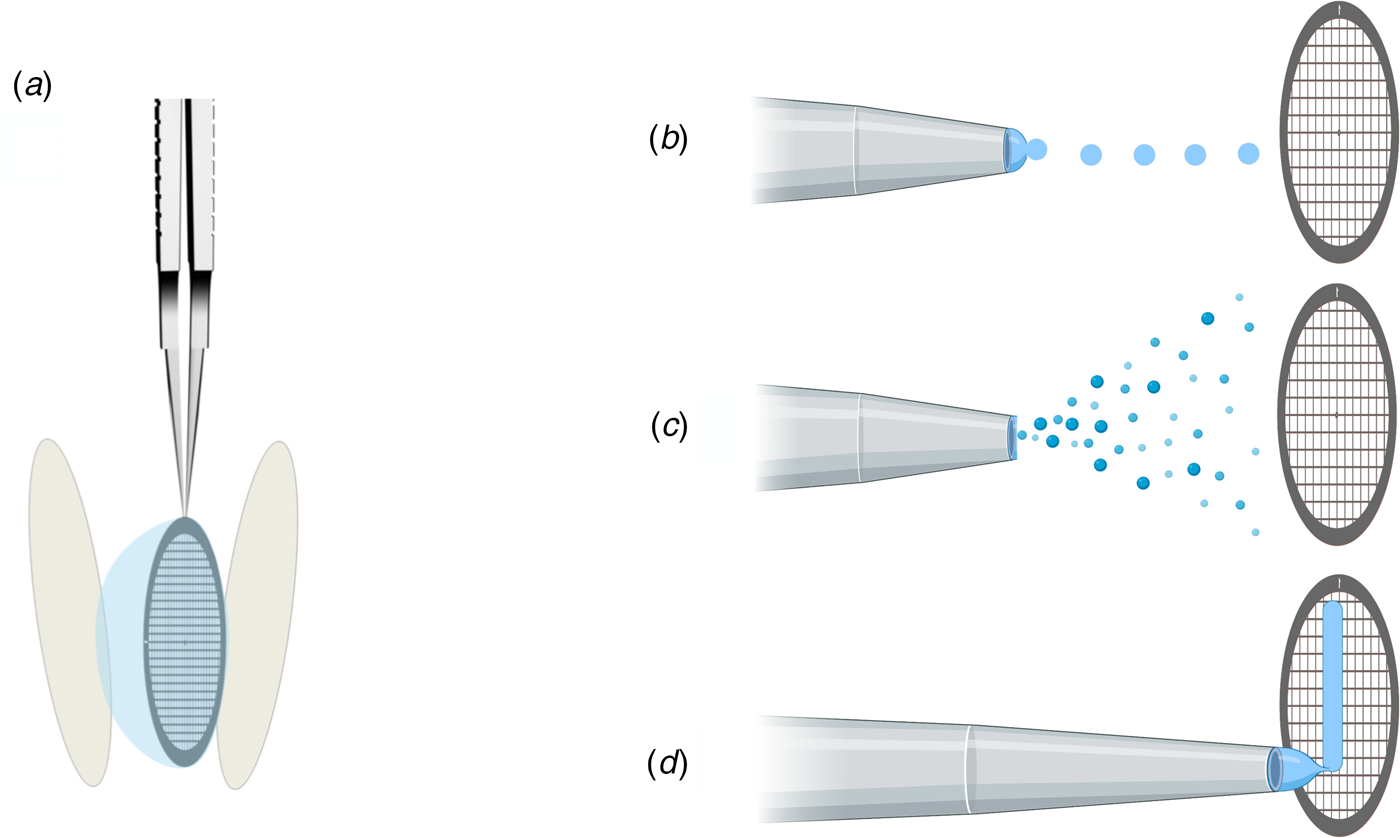
Footnote 2Methods of sample deposition. (a) Standard robotic plunge-freezing, e.g. in a Vitrobot. A small volume of sample solution (3 μl) is applied manually to a support grid coated with holey carbon film (Quantifoil). Excess solution is blotted off on both sides with filter paper, and the tweezers holding the grid are plunged into a reservoir of liquid ethane cooled with liquid nitrogen. (b) Inkjet printing, e.g. by a device known as the ‘Chameleon’. Defined picolitre to nanolitre droplets are produced by a piezo-electric inkjet dispenser (Jain et al., Reference Jain, Sheehan, Crum, Carragher and Potter2012) and projected towards the grid, ideally a hairy grid (see Fig. 11), which is then plunge-frozen. (c) An aerosol of the sample solution produced by an atomizer (Berriman and Unwin, Reference Berriman and Unwin1994; Unwin, Reference Unwin1995) or a microfluidic chip (Ashtiani et al., Reference Ashtiani, Venugopal, Belousoff, Spicer, Mak, Neild and De Marco2018; Kontziampasis et al., Reference Kontziampasis, Klebl, Iadanza, Scarff, Kopf, Sobott, Monteiro, Trebbin, Muench and White2019) is emitted from a nozzle. The aerosol droplets spread on the surface of the grid, which is plunge-frozen as in (a). (d) Drawing with a stylus using pin-printing technology, e.g. by a device known as the ‘Vitrojet’ (Ravelli et al, Reference Ravelli, Nijpels, Henderikx, Weissenberger, Thewessem, Gijsbers, Beulen, López-Iglesias and Peters2020). A small sample volume is drawn out with a microstylus into a thin film on a carbon-coated grid, which is then vitrified by spraying with a jet of liquid ethane.
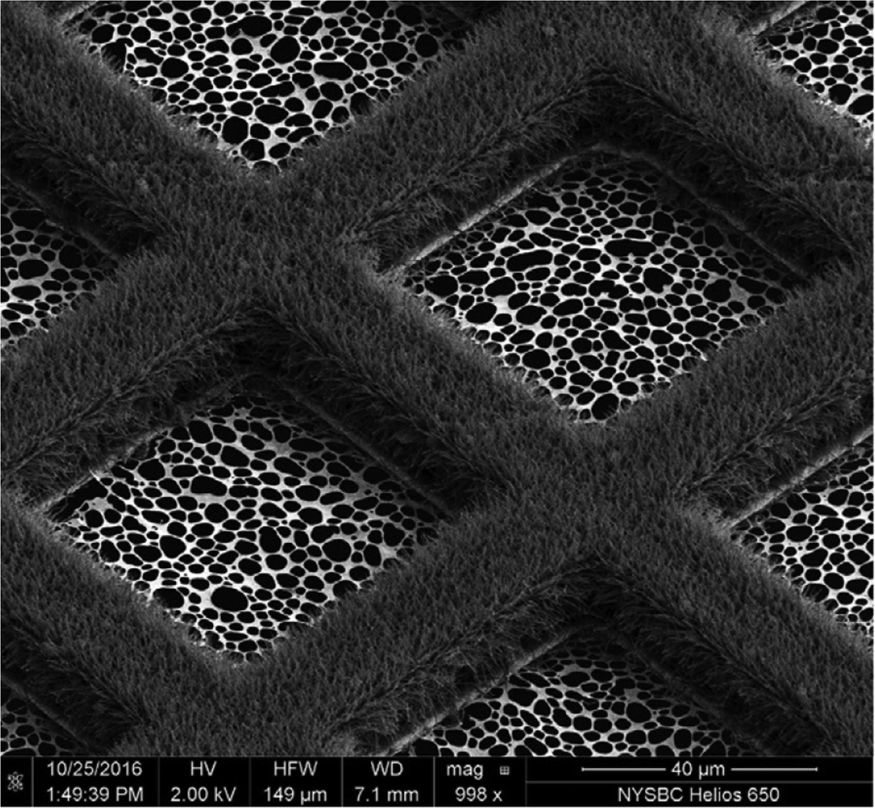
(a) Inkjet printing. A piezoelectric inkjet dispenser projects single, ~30 pl to 40 nl droplets with a dispense-to-plunge time of ~100–400 ms onto cryoEM grids coated with standard holey carbon film (Fig. 10b) (Jain et al., Reference Jain, Sheehan, Crum, Carragher and Potter2012; Dandey et al., Reference Dandey, Wei, Zhang, Tan, Acharya, Eng, Rice, Kahn, Potter and Carragher2018). The technique depends on self-wicking ‘hairy grids’ (Fig. 11) (Razinkov et al., Reference Razinkov, Dandey, Wei, Zhang, Melnekoff, Rice, Wigge, Potter and Carragher2016), where grid bars are covered with a lawn of Cu(OH)2 nanowires (Wei et al., Reference Wei, Dandey, Zhang, Raczkowski, Rice, Carragher and Potter2018). The nanowires absorb most of the protein solution by capillary action, leaving a thin layer of liquid in the holes that vitrifies upon immersion into liquid ethane, as usual. In a recent modification, an inkjet printing device was equipped with two piezoelectric dispensers in series (Dandey et al., Reference Dandey, Budell, Wei, Bobe, Maruthi, Kopylov, Eng, Kahn, Hinshaw, Kundu, Nimigean, Fan, Sukomon, Darst, Saecker, Chen, Malone, Potter and Carragher2020). In this way, two solutions can be mixed on the grid as it flies past the dispenser. Inkjet printing requires sample volumes of 3–5 μl, which can be spread over dozens of grids. The wicking rate may vary from grid to grid, depending on how quickly the lawn becomes saturated, resulting in variable vitreous water layer thicknesses. The self-wicking grids are more expensive than standard grids, but they can be made in the laboratory (Wei et al., Reference Wei, Dandey, Zhang, Raczkowski, Rice, Carragher and Potter2018). A tomographic study of 46 different cryoEM samples, 32 of them prepared by inkjet printing (Noble et al., Reference Noble, Dandey, Wei, Brasch, Chase, Acharya, Tan, Zhang, Kim, Scapin, Rapp, Eng, Rice, Cheng, Negro, Shapiro, Kwong, Jeruzalmi, Georges, Potter and Carragher2018a), indicated that approximately 90% of all particles had adsorbed to the air-water interface and nearly all assumed some degree of preferential orientation. The proportion of good and bad particles for high-resolution structure determination was not assessed, but many samples showed signs of damage. Inkjet printing at current spot-to-plunge times does not prevent particle adsorption or denaturation at the air-water interface, although it does appear to alleviate preferred orientation (Noble et al., Reference Noble, Wei, Dandey, Zhang, Tan, Potter and Carragher2018b).
Hairy grid. Scanning electron micrograph of a 300 mesh Cu/Rh grid with Cu(OH)2 nanowires. The grid is coated with lacey gold film on the rhodium side. Adapted from Wei et al. (Reference Wei, Dandey, Zhang, Raczkowski, Rice, Carragher and Potter2018).
In a variation of the inkjet printing technique, sample deposition onto conventional Quantifoil grids through gas-dynamic virtual nozzles yielded thin layers suitable for high-resolution structure determination (Klebl et al., Reference Klebl, Monteiro, Kontziampasis, Kopf, Sobott, White, Trebbin and Muench2020b). Similar results were obtained by voltage-assisted spraying (Kontziampasis et al., Reference Kontziampasis, Klebl, Iadanza, Scarff, Kopf, Sobott, Monteiro, Trebbin, Muench and White2019).
(b) Aerosol spray. An aerosol of a small sample volume is sprayed from a nozzle onto the support film, shortly before the grid is vitrified (Fig. 10c) (Unwin and Fujiyoshi, Reference Unwin and Fujiyoshi2012; Feng et al., Reference Feng, Fu, Kaledhonkar, Jia, Shah, Jin, Liu, Sun, Chen, Grassucci, Ren, Jiang, Frank and Lin2017). The technique was first applied to trap the nicotinic acetylcholine receptor channel in the open state for cryoEM (Berriman and Unwin, Reference Berriman and Unwin1994; Unwin, Reference Unwin1995). By adjusting the distance between the nozzle and the liquid ethane reservoir, the plunging time can be reduced to a few ms. More recently developed systems produce aerosols by electrostatics (Kontziampasis et al., Reference Kontziampasis, Klebl, Iadanza, Scarff, Kopf, Sobott, Monteiro, Trebbin, Muench and White2019), surface acoustic waves (Ashtiani et al., Reference Ashtiani, Venugopal, Belousoff, Spicer, Mak, Neild and De Marco2018) or a gas-assisted nozzle after microfluidic mixing (Maeots et al., Reference Maeots, Lee, Nans, Jeong, Esfahani, Ding, Smith, Lee, Lee, Peter and Enchev2020). For time-resolved studies, a modified instrument uses a piezoelectric transducer for liquid atomization, allowing sample mixing about 150–100 ms before vitrification (Rubinstein et al., Reference Rubinstein, Guo, Ripstein, Haydaroglu, Au, Yip, Di Trani, Benlekbir and Kwok2019). Self-wicking grids were required, but vitrification conditions were difficult to control. A recent modification of the device places a glass fibre filter behind a conventional holey grid, which reduces cost and improves absorption capacity and reproducibility (Tan and Rubinstein, Reference Tan and Rubinstein2020). Design and software for this device are freely available online, and it can be built and assembled from inexpensive materials by any mechanical workshop.
(c) Drawing with a stylus. A third method of automated cryoEM grid preparation by a device called the Vitrojet (Ravelli et al., Reference Ravelli, Nijpels, Henderikx, Weissenberger, Thewessem, Gijsbers, Beulen, López-Iglesias and Peters2020) uses pin-printing technology (Fig. 10d). Sub-nanolitre sample volumes are deposited on a standard, pre-mounted cryoEM grid (Ravelli et al., Reference Ravelli, Nijpels, Henderikx, Weissenberger, Thewessem, Gijsbers, Beulen, López-Iglesias and Peters2020), and drawn out with a microstylus into a thin film on a holey or continuous carbon support (Arnold et al., Reference Arnold, Albiez, Bieri, Syntychaki, Adaixo, Mcleod, Goldie, Stahlberg and Braun2017). The grid is then rapidly vitrified in a jet of liquid ethane. A modified microstylus device allows for buffer exchange and sample mixing of isolated complexes or of cell extracts before deposition (Arnold et al., Reference Arnold, Albiez, Bieri, Syntychaki, Adaixo, Mcleod, Goldie, Stahlberg and Braun2017, Reference Arnold, Albiez, Opara, Chami, Schmidli, Bieri, Padeste, Stahlberg and Braun2016). The approach has been developed further into a microfluidic method that uses magnetic beads to isolate a target protein from less than 1 μl of cell lysate and to prepare it directly for cryoEM (Schmidli et al., Reference Schmidli, Albiez, Rima, Righetto, Mohammed, Oliva, Kovacik, Stahlberg and Braun2019). Pin-printing is still at the prototype stage but can potentially be adapted to specimen preparation for electron cryo-tomography (Nievergelt et al., Reference Nievergelt, Viar and Pigino2019) and cryo-FIB milling (Pfeffer and Mahamid, Reference Pfeffer and Mahamid2018).
The three new preparation techniques spread the sample into a thin film, thus maximizing the air-water interface, although for a shorter time than standard blotting. Ideally, they reduce the amount of sample needed, and minimize the time during which it is exposed to air from minutes or seconds to a few milliseconds. The two critical time components in preparing a cryoEM specimen are (i) the time it takes to deliver the sample to the support film and (ii) the time from sample delivery to vitrification. The latter is determined by how long it takes the device to immerse the grid in liquid ethane. Currently, the shortest immersion time is 2.5 ms (Feng et al., Reference Feng, Fu, Kaledhonkar, Jia, Shah, Jin, Liu, Sun, Chen, Grassucci, Ren, Jiang, Frank and Lin2017). Delivering the sample to the grid support before vitrification usually takes several times longer. For aerosols and inkjet printing, this includes the time of flight through air. In practice, the shortest times from bulk liquid sample to vitrification reported to date are around 6–30 ms (Klebl et al., Reference Klebl, Gravett, Kontziampasis, Wright, Bon, Monteiro, Trebbin, Sobott, White, Darrow, Thompson and Muench2020a) – two orders of magnitude slower than protein diffusion. It follows that current cryoEM specimen preparation technology cannot outrun the physics of protein diffusion in aqueous solution, and thus does not eliminate the interaction of proteins with the air-water interface.
A systematic study (Klebl et al., Reference Klebl, Gravett, Kontziampasis, Wright, Bon, Monteiro, Trebbin, Sobott, White, Darrow, Thompson and Muench2020a) evaluates and compares the merits of inkjet printing and microfluidic spraying to standard blotting of three different, well-characterized samples: apoferritin, Escherichia coli ribosomes and the mitochondrial heat shock protein HSPD1. The three techniques produced grids suitable for high-resolution cryoEM data collection of all three samples, but even at the shortest preparation time of 6 ms, achieved with a microfluidics device, a significant degree of preferential orientation on the air-water interface was evident (Fig. 12). As expected, interface adsorption was most pronounced with standard blotting, which is slow. However, it turned out that this well-tried and comparatively simple technique has an unexpected advantage over the high-tech dispensers: the slow blotting process results in an up to a 30-fold increase in sample concentration near the air-water interface (Klebl et al., Reference Klebl, Gravett, Kontziampasis, Wright, Bon, Monteiro, Trebbin, Sobott, White, Darrow, Thompson and Muench2020a). For this reason, comparatively low sample concentrations are sufficient for standard blotting, whereas the faster preparation techniques require higher concentrations. The concentration effect has evidently contributed to the great success of single-particle cryoEM, in particular with samples that do not denature at the air-water interface. At present, robotic blotting produces the thinnest layers of vitrified solutions most reproducibly, which can be critical for image contrast and, hence, high resolution.
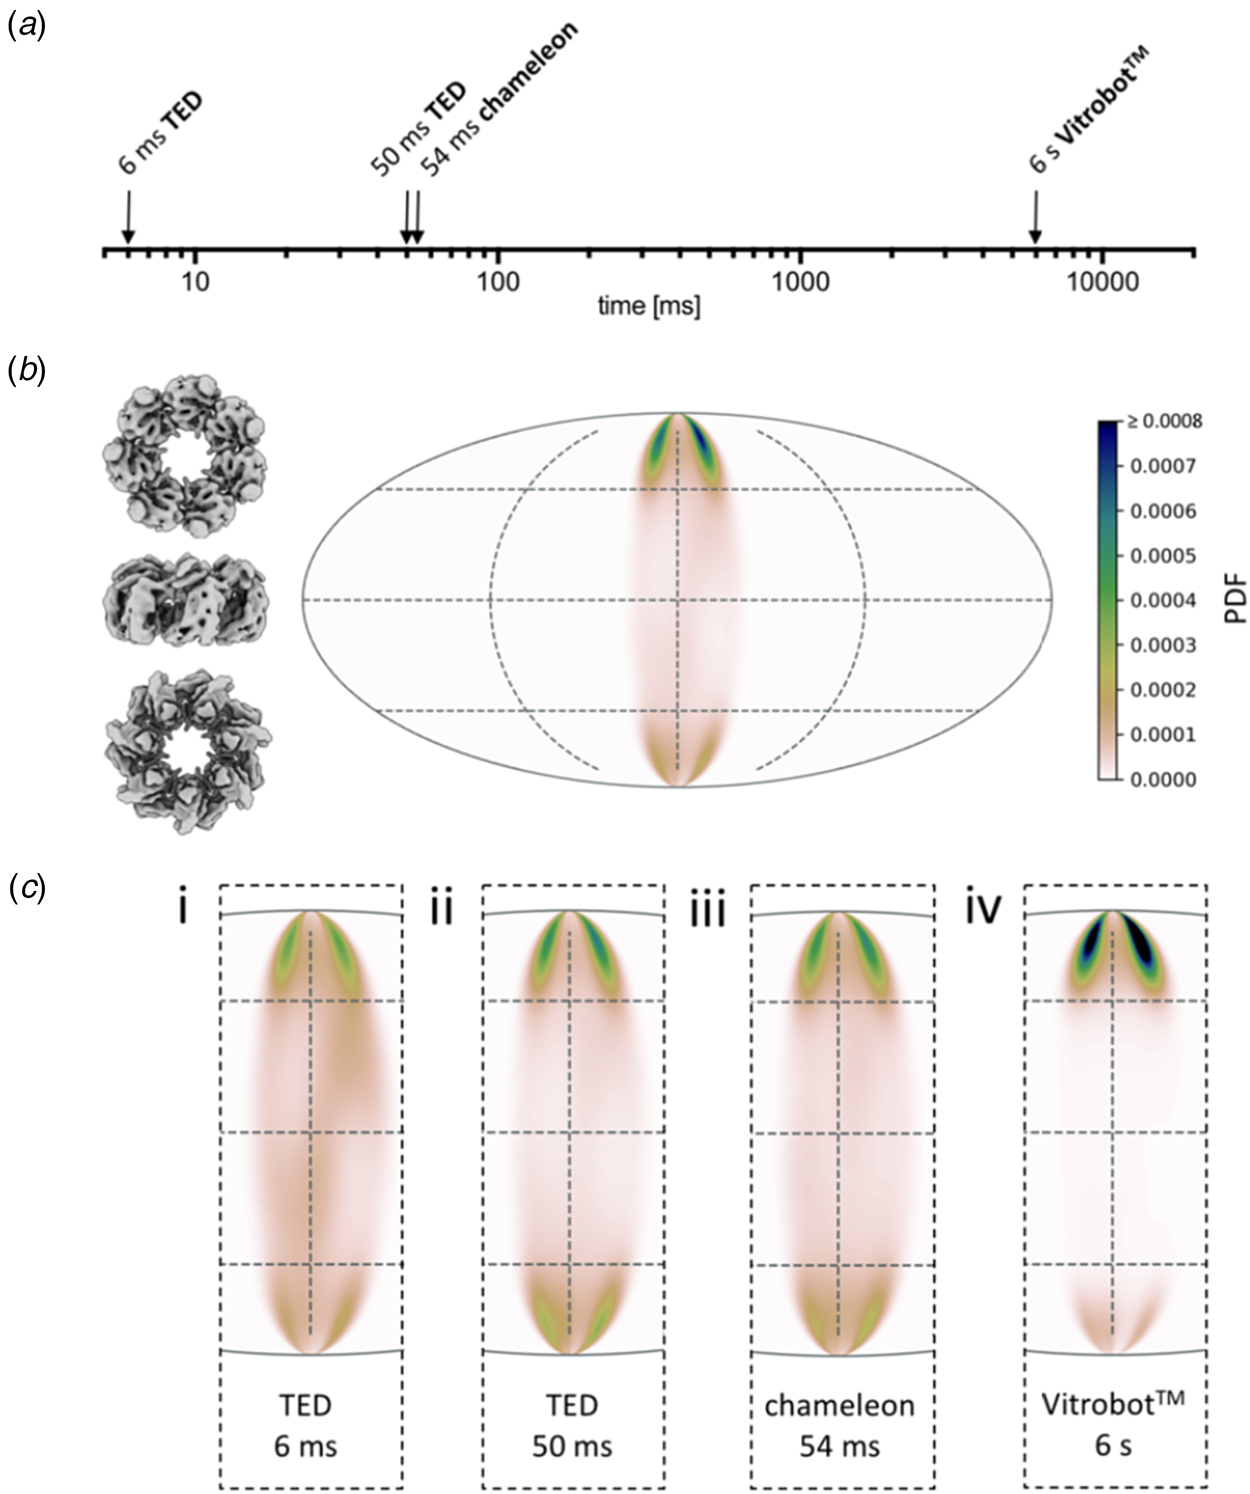
Preferential orientation. Angular orientation of HSPD1 heptamer on the air-water interface at different timepoints. (a) Timescale of grid preparation by microfluidic spraying (TED, time-resolved cryoEM device), inkjet printing (Chameleon) or robotic blotting (Vitrobot) analysed for angular distribution. (b) An angular distribution map indicates a preferred orientation dominated by top views. Due to the C7 symmetry of HSDP1, only 1/7 of the area is shown. Views of the heptameric complex on the left indicate the approximate corresponding orientation. PDF, normalized probability density function indicating the probability of finding a particle in a given orientation. (c) Orientation distribution maps for HSPD1 prepared by microfluidic spraying within 6 ms (i) or 50 ms (ii), inkjet printing within 54 ms (iii), and robotic blotting within 6 s (iv). Adapted from Klebl et al. (Reference Klebl, Gravett, Kontziampasis, Wright, Bon, Monteiro, Trebbin, Sobott, White, Darrow, Thompson and Muench2020a).
Another interesting outcome of the comparative study (Klebl et al., Reference Klebl, Gravett, Kontziampasis, Wright, Bon, Monteiro, Trebbin, Sobott, White, Darrow, Thompson and Muench2020a) was that apoferritin, E. coli ribosomes and the mitochondrial chaperone HSPD1 all behaved very differently with respect to interface adsorption and preferential orientation. While rapid specimen preparation can reduce the proportion of particles adsorbed to the air-water interface, the overall effect is not linear, unpredictable and very much specimen-dependent. CryoEM preparation thus needs to be optimized carefully for each sample, and at present, there is no standard procedure that would work for all.
Orientation effects were most obvious for HSPD1, which is known to interact strongly with the air-water interface (Klebl et al., Reference Klebl, Gravett, Kontziampasis, Wright, Bon, Monteiro, Trebbin, Sobott, White, Darrow, Thompson and Muench2020a), but they were also clear for ribosomes, which adhered to and oriented on the air-water interface within 13 ms. Apoferritin tended to form small clusters or rafts on the interface, but due to its high cubic symmetry, preferential orientation is less of a concern. Interaction of the protein sample with the air-water interface happened in two phases. Initial adsorption was rapid, followed by a slower phase, during which the particles orient. The interaction of HSDP1 with the interface became stronger with time, whereas it appeared to become weaker in the case of ribosomes. Overall, preferential orientation was less pronounced but still evident even with the fast dispensers, compared to blotting.
The particle distribution on the two opposite air-water interfaces of a support film hole was strikingly asymmetric. Often one surface was completely covered, while the opposite surface was almost empty (Fig. 13) (Klebl et al., Reference Klebl, Gravett, Kontziampasis, Wright, Bon, Monteiro, Trebbin, Sobott, White, Darrow, Thompson and Muench2020a). This was true of all three samples to a varying extent and appeared to be independent of the preparation technique. The highly asymmetric particle distribution concurs with similar findings reported previously both for blotting (D'Imprima et al., Reference D'imprima, Floris, Joppe, Sanchez, Grininger and Kühlbrandt2019) and inkjet printing (Noble et al., Reference Noble, Dandey, Wei, Brasch, Chase, Acharya, Tan, Zhang, Kim, Scapin, Rapp, Eng, Rice, Cheng, Negro, Shapiro, Kwong, Jeruzalmi, Georges, Potter and Carragher2018a). The effect is unexplained and appears to be stochastic. It may be related to local conditions on the grid that are unexplored and difficult to control, such as surface charging.
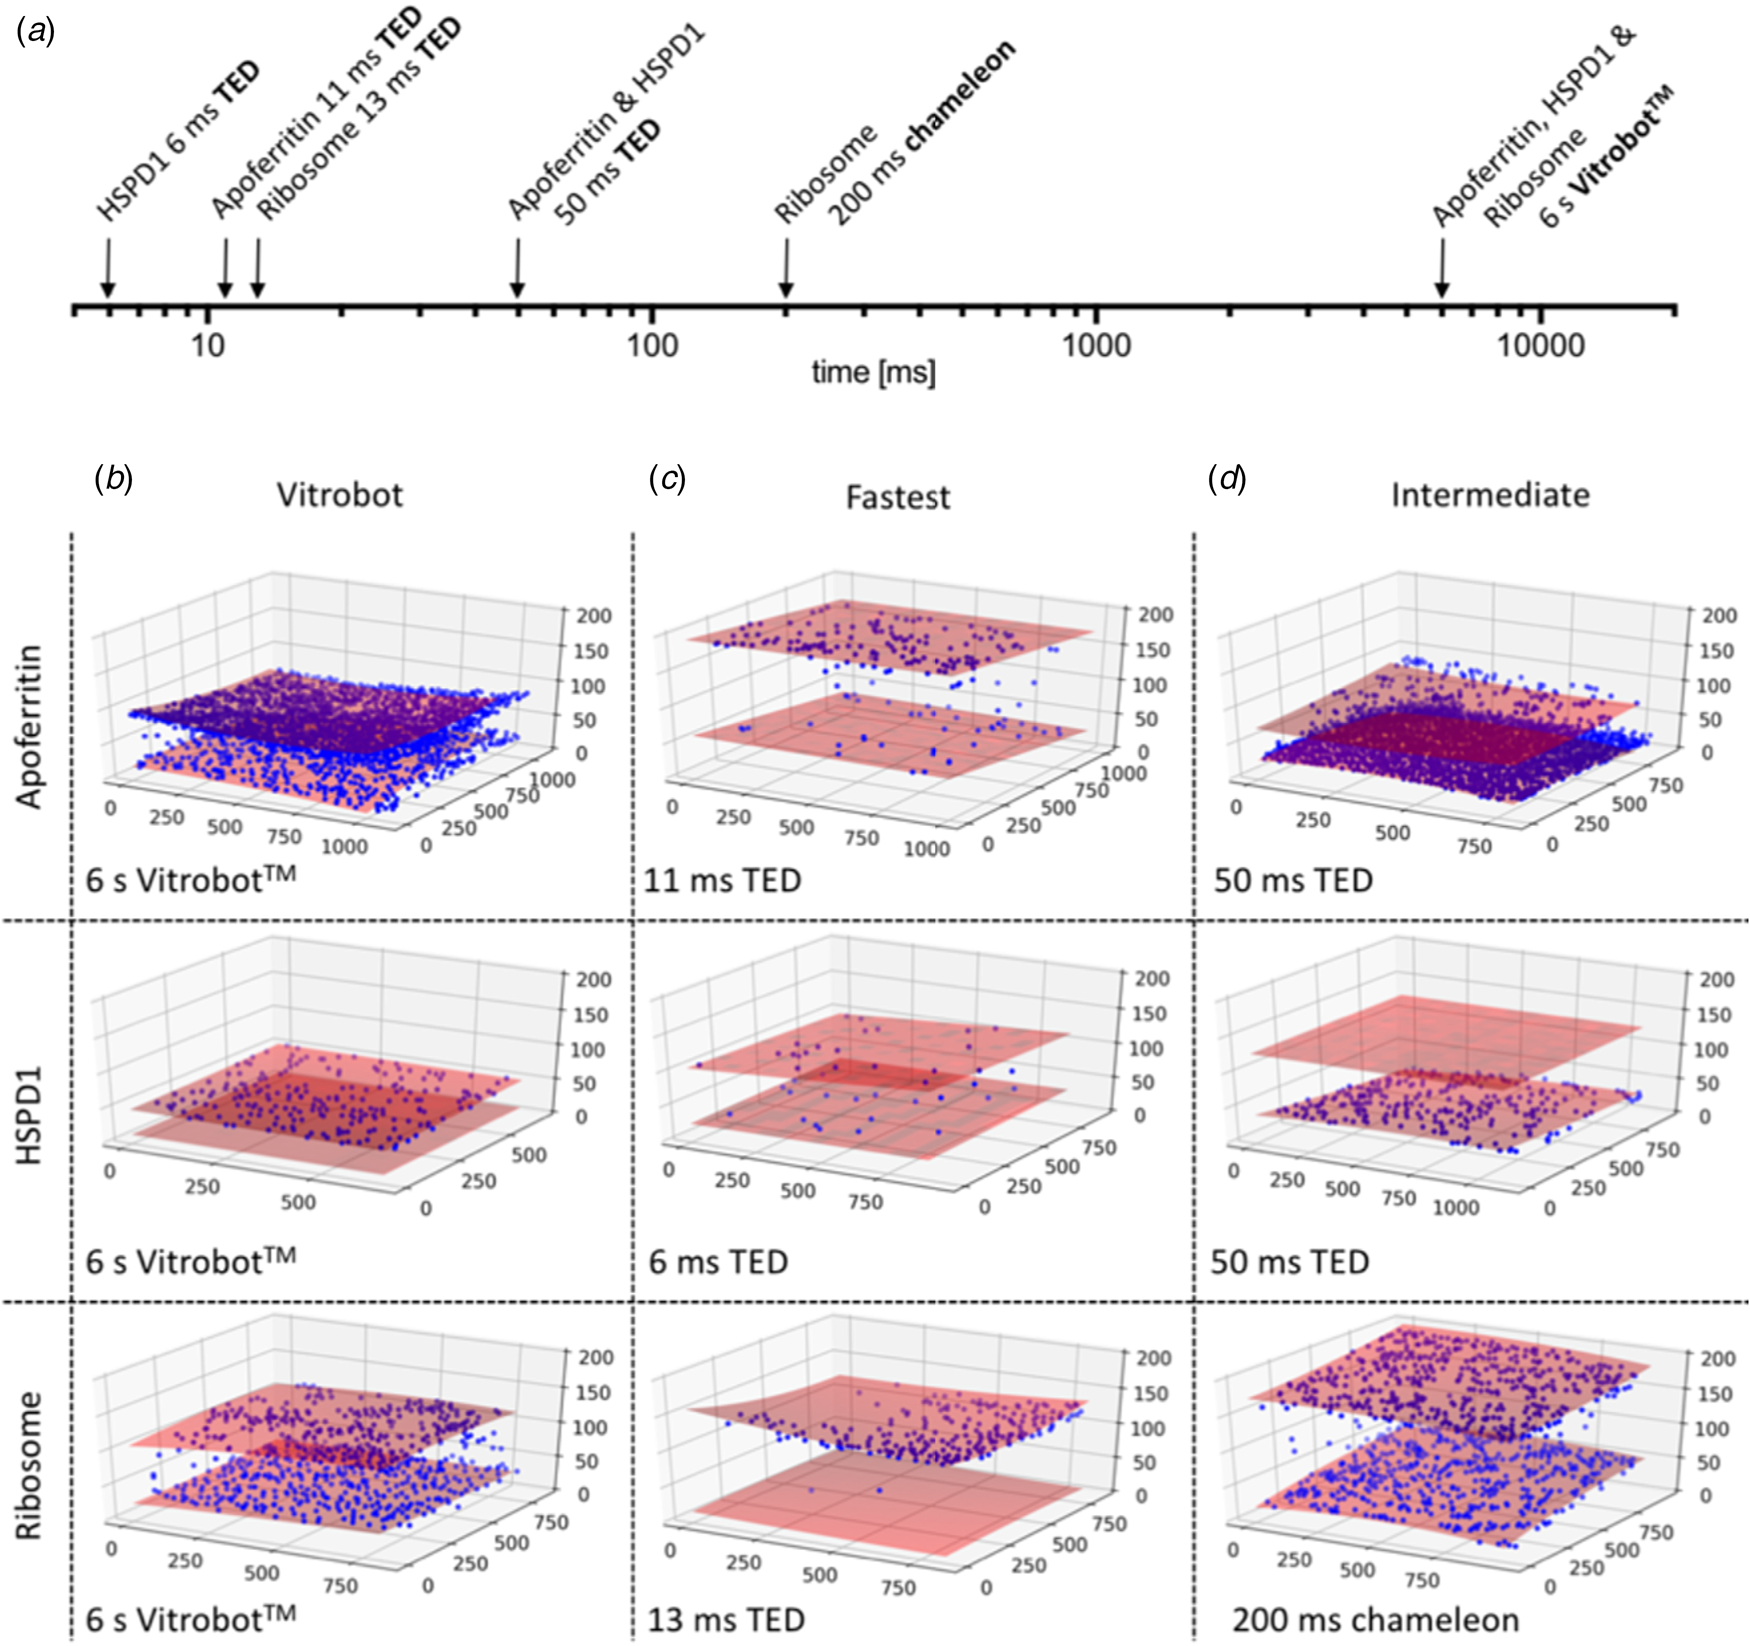
CryoET of particles at the air-water interface. (a) Timescale of grid preparation by microfluidic spraying (TED, time-resolved cryoEM device), inkjet printing (Chameleon) or robotic blotting (Vitrobot). Representative tomograms of apoferritin, HSPD1 and ribosome grids prepared by robotic blotting with a blot time of 6 s (b), fast deposition within 6–13 ms by microfluidic spraying (TED; c) or intermediate 50–200 ms time points by microfluidic spraying (TED) or inkjet printing (Chameleon). (d) Red shaded areas indicate the air-water interface, and blue spheres particle location. The x, y and z axes indicate particle coordinates in the ice layer in nm. Adapted from Klebl et al. (Reference Klebl, Gravett, Kontziampasis, Wright, Bon, Monteiro, Trebbin, Sobott, White, Darrow, Thompson and Muench2020a).
Conclusion and outlook
CryoEM has undergone a breathtaking development that few would have thought possible less than a decade ago. From an exquisitely demanding technique practised by a few experts who occasionally, and with a great deal of effort, produced high-resolution structures, it has now become a mainstay of molecular cell biology in countless laboratories around the world. CryoEM spans the wide range from single-particle protein structures at truly atomic resolution (Nakane et al., Reference Nakane, Kotecha, Sente, Mcmullan, Masiulis, Brown, Grigoras, Malinauskaite, Malinauskas, Miehling, Uchanski, Yu, Karia, Pechnikova, De Jong, Keizer, Bischoff, Mccormack, Tiemeijer, Hardwick, Chirgadze, Murshudov, Aricescu and Scheres2020; Yip et al., Reference Yip, Fischer, Paknia, Chari and Stark2020) to large assemblies in cells and tissues investigated by electron cryo-tomography (Nievergelt et al., Reference Nievergelt, Viar and Pigino2019), sub-tomogram averaging (Pfeffer and Mahamid, Reference Pfeffer and Mahamid2018) and correlative light and electron microscopy (Ganeva and Kukulski, Reference Ganeva and Kukulski2020; Walter et al., Reference Walter, Paul-Gilloteaux, Plochberger, Sefc, Verkade, Mannheim, Slezak, Unterhuber, Marchetti-Deschmann, Ogris, Buhler, Fixler, Geyer, Weninger, Glosmann, Handschu and Wanek2020). For these reasons, cryoEM is particularly promising as a technique for the future of structural biology. Protein crystallography remains extremely powerful and is unsurpassed in terms of speed and throughput, provided that suitable crystals are available. However, protein crystallization is unpredictable and labour-intensive, and not all proteins, let alone large complexes, will crystallize. X-ray tomography is unlikely to reach a near-atomic resolution, because of radiation damage and a lack of suitable focusing optics. In cryoEM, faster cameras will speed up the process of high-resolution structure determination in the near future. More sensitive electron detectors will produce higher contrast and better resolution, and shift the boundaries towards smaller asymmetrical particles in the 30–50 kDa range, which are currently out of reach. In addition, ever more sophisticated image processing programmes that can assess and overcome particle movements and preferential orientation, or even partial denaturation are likely to be developed.
As cryoEM approaches the physical limits imposed by radiation damage and electron optics (Russo and Passmore, Reference Russo and Passmore2016a; Naydenova et al., Reference Naydenova, Mcmullan, Peet, Lee, Edwards, Chen, Leahy, Scotcher, Henderson and Russo2019a; Peet et al., Reference Peet, Henderson and Russo2019a), it is now a priority to surmount the outstanding obstacles that have prevented routine high-resolution structure determination of biological macromolecules. New specimen supports or controlled devitrification have the potential of resolving the long-standing problem of beam-induced movement. Protein denaturation at the air-water interface and inherent protein flexibility then persist as the most enduring sample-related challenges. With ingenuity and additional experimentation, the promising approaches described in this review may develop into a method that works well for most biological samples. Once such methods are at hand, it will finally be possible to realize the full potential of cryoEM for routine high-resolution structure determination of biological macromolecules.
Acknowledgements
We thank Chris Russo (MRC-LMB Cambridge, UK) for communicating a manuscript prior to publication. Janet Vonck, Chris Russo, Bridget Carragher (NYSBC, New York, USA), Alex Noble (NYSBC) and Rebecca Thompson (University of Leeds, UK) contributed valuable comments. Davide Floris helped to draw Fig. 10a.
Financial support
Work towards this review was funded by the Max Planck Society.
Conflict of interest
None.


 Open access