


Introduction
Trace-element studies of oxides, including gahnite (O'Brien et al. Reference O'Brien, Spry, Nettleton, Ruo, Teale, Jackson and Rogers2015a, Reference O'Brien, Spry, Teale, Jackson and Koenig2015b, Reference O'Brien, Spry, Teale, Jackson and Rogers2015c), hematite and maghemite (e.g. Schmidt Mumm et al., Reference Schmidt Mumm, Dart and Say2012), chromite (e.g. Pagé and Barnes, Reference Pagé and Barnes2009), ilmenite (e.g. Dare et al., Reference Dare, Barnes and Beaudoin2012), rutile (e.g. Clark and Williams-Jones, Reference Clark and Williams-Jones2004) and magnetite (e.g. Dupuis and Beaudoin, Reference Dupuis and Beaudoin2011; Nadoll et al., Reference Nadoll, Mauk, Hayes, Koenig and Box2012a, Reference Nadoll, Angerer, Mauk, French and Walshe2014) have been used to determine the provenance of their host rocks and to explore for various types of ore deposits. Of these resistant oxides, magnetite is the most common and has been the subject of the largest number of trace-element studies as it occurs in a wide variety of geological settings including skarn, hydrothermal and magmatic ore deposits, glacial till and iron formations. The composition of magnetite is particularly useful for evaluating ore-forming processes, as it is controlled by numerous factors, including: temperature; source rock/fluid composition; oxygen and sulfur fugacity; silicate and sulfide activity; host rock buffering; re-equilibration processes; and intrinsic crystallographic controls (i.e. ionic radius and charge balance; Nadoll et al., Reference Nadoll, Angerer, Mauk, French and Walshe2014). Magnetite-bearing ore deposits include Ni–Cu–PGE, banded iron formation (BIF), iron oxide–Cu–Au (IOCG), skarn, porphyry Cu, Fe–REE–Nb, Cu–Au–Fe, iron oxide–apatite, and volcanogenic massive sulfide (VMS) deposits (e.g. Pagé and Barnes, Reference Pagé and Barnes2009; Dupuis and Beaudoin, Reference Dupuis and Beaudoin2011; Nadoll et al., Reference Nadoll, Mauk, Hayes, Koenig and Box2012a; Dare et al., Reference Dare, Barnes and Beaudoin2012; Makvandi et al., Reference Makvandi, Beaudoin, Ghasemazadeh-Barvarz and McClenaghan2013; Acosta-Góngora et al., Reference Acosta-Góngora, Gleeson, Samson, Ootes and Corriveau2014; Huang et al., Reference Huang, Zhou, Qi, Gao and Wan2013, Reference Huang, Zhou, Qiu and Qi2015; Chen et al., Reference Chen, Zhou, Li, Gao and Hou2015; Chung et al., Reference Chung, Zhou, Gao and Chen2015; Pisiak et al., Reference Pisiak, Canil, Grondahl, Plouffe, Ferbey and Anderson2015; Xu et al., Reference Xu, Bi, Hu, Tang, Wang and Xu2015; Zhao et al., Reference Zhao and Zhou2015; Qi et al., Reference Qi, Hu, Gao, Gao and Gong2021; Bédard et al., Reference Bédard, De Bronac de Vazelhes and Beaudoin2022).
The objective of this study is to expand upon earlier trace-element studies of magnetite associated with metamorphosed massive sulfide and skarn deposits by evaluating the trace-element composition of magnetite in metamorphosed carbonate-associated massive sulfide deposits (Gränsgruvan, Tvistbo, Norrgruvan, Cedercreutz, Baklängan and Dammberget) in the Paleoproterozoic Stollberg Zn–Pb–Ag plus magnetite ore field, Bergslagen district, Sweden. We document the variability in the trace-element composition of magnetite in massive sulfides, different types of metamorphosed altered rocks (mainly altered rhyolitic ash–siltstone and limestone), mafic intrusions and massive magnetite bodies. The sulfide occurrences at Stollberg were considered by Jansson et al. (Reference Jansson, Erismann, Lundstam and Allen2013) and Frank et al. (Reference Frank, Spry, Raat, Allen, Jansson and Ripa2019) to be metamorphosed, replacement deposits overprinting limestone. The resulting deposits have geological features that resemble both skarn and metamorphosed VMS deposits. This study of magnetite in the Stollberg ore field, which is the first of its type in the Bergslagen district, specifically assesses: (1) the trace-element composition of magnetite in different rock types associated with metamorphosed sulfide occurrences; (2) whether or not the composition of magnetite can be used as a pathfinder to ore; and (3) the application of discrimination diagrams as aids in understanding the provenance of magnetite and ore deposit type.
Magnetite in metamorphosed massive sulfide deposits
Previous studies have been shown that the composition of magnetite can be used to fingerprint ore deposit types and provide insight into processes associated with the formation of VMS deposits (Singoyi et al., Reference Singoyi, Danyushevsky, Davidson, Large and Zaw2006; Kamvong et al., Reference Kamvong, Zaw and Siegele2007; Dupuis and Beaudoin, Reference Dupuis and Beaudoin2011; Makvandi et al., Reference Makvandi, Beaudoin, Ghasemazadeh-Barvarz and McClenaghan2013; Reference Makvandi, Ghasemzadeh-Barvarz, Beaudoin, Grunsky, McClenaghan and Duchesne2016a, Reference Makvandi, Ghasemzadeh-Barvarz, Beaudoin, Grunsky, McClenaghan and Duchesne2016b; Bédard et al., Reference Bédard, De Bronac de Vazelhes and Beaudoin2022). Using the composition of magnetite obtained from various VMS, skarn, iron oxide–Cu–Au, and Broken Hill-type Pb–Zn deposits, Singoyi et al. (Reference Singoyi, Danyushevsky, Davidson, Large and Zaw2006) and Kamvong et al. (Reference Kamvong, Zaw and Siegele2007) suggested that these deposits can be distinguished on the basis of a plot of Sn/Ga vs. Al/Co. Dupuis and Beaudoin (Reference Dupuis and Beaudoin2011) proposed that the average composition of magnetite from 17 VMS deposits and the Faro sedimentary exhalative deposit can be distinguished in Al/(Zn+Ca)–Cu/(Si+Ca) space from the average composition of magnetite from Fe–Ti, Cr, Cu vein, IOCG, Kiruna-type, banded iron formations, porphyry Cu, skarn, and magmatic Ni–Cu deposits. Included in the group of massive sulfide deposits that Dupuis and Beaudoin (Reference Dupuis and Beaudoin2011) studied were Ducktown (Tennessee, USA) and Garpenberg (Sweden), which were metamorphosed to the amphibolite facies. In their study, Dupuis and Beaudoin (Reference Dupuis and Beaudoin2011) only used samples from sulfide-bearing rocks that contained magnetite. Makvandi et al. (Reference Makvandi, Ghasemzadeh-Barvarz, Beaudoin, Grunsky, McClenaghan and Duchesne2016b) focused on both ore-bearing and unmineralised rocks from the Izok Lake Zn–Pb–Cu–Ag (Nunavut, Canada) and Halfmile Lake Zn–Pb–Cu (New Brunswick, Canada) VMS deposits, which were metamorphosed to the amphibolite and greenschist facies, respectively. They proposed that variability in trace-element composition of magnetite in samples of massive sulfides, altered rocks, less altered host rocks, and till from both locations was due to differences in geological setting and grades of metamorphism.
In addition to using scatter plots, multivariate statistical methods, including principal component analysis (PCA) and Random Forests, show promise in discriminating the trace-element signatures in different lithologies and ore deposit types (Bédard et al., Reference Bédard, De Bronac de Vazelhes and Beaudoin2022). Makvandi et al. (Reference Makvandi, Ghasemzadeh-Barvarz, Beaudoin, Grunsky, McClenaghan and Duchesne2016b) showed, for example, that the trace-element composition of magnetite in massive sulfides, altered gahnite-rich dacite, gabbro and iron formation in the Izok Lake area could be distinguished using PCA. A further study by Makvandi et al. (Reference Makvandi, Ghasemzadeh-Barvarz, Beaudoin, Grunsky, McClenaghan and Duchesne2016a) applied PCA and partial least-squares discriminant analysis (PLS-DA) to magnetite from 18 VMS deposits in various types of rocks, including iron formations. Of these deposits, magnetite was analysed from some VMS deposits metamorphosed to the greenschist (e.g. Brunswick #6 and #12, Austin Brook) and amphibolite facies (e.g. Izok Lake, Ducktown). The statistical approach of Makvandi et al. (Reference Makvandi, Ghasemzadeh-Barvarz, Beaudoin, Grunsky, McClenaghan and Duchesne2016a) allowed them to distinguish populations within large sets of trace-element compositions that would otherwise overlap in scatter plots, with PLS-DA being used by them to identify and classify different types of VMS deposits and BIF, as well as being able to discriminate magnetite in surficial sediments from those derived from other types of magmatic or hydrothermal ore deposits (e.g. iron oxide–Cu–Au, magmatic Ni–Cu and porphyry Cu).
Regional geology
The Paleoproterozoic Bergslagen mining district occurs in a supracrustal metavolcanic (predominantly calc-alkaline rhyolite)–metasedimentary province (1.91–1.75 Ga) belonging to the Fennoscandian Shield in south-central Sweden, together with pre- to post-tectonic intrusive rocks (1.90–1.87 Ga) (Allen et al. Reference Allen, Lundström, Ripa, Simeonov and Christofferson1996; Stephens et al. Reference Stephens, Ripa, Lundström, Persson, Bergman, Ahl, Wahlgren, Persson and Wickström2009; Stephens and Jansson, Reference Stephens, Jansson, Stephens, Bergman and Weihed2020). It hosts a variety of ore deposit types including polymetallic Zn–Pb–Ag–(Cu)–(Au) sulfide and iron oxide deposits, BIF, skarn, and Mn oxide (Allen et al., Reference Allen, Ripa and Jansson2008; Stephens et al., Reference Stephens, Ripa, Lundström, Persson, Bergman, Ahl, Wahlgren, Persson and Wickström2009). They are hosted typically by hydrothermally altered metavolcanic rocks and associated metacarbonates. Allen et al. (Reference Allen, Lundström, Ripa, Simeonov and Christofferson1996) described two types of polymetallic deposits in the Bergslagen district. They are bedded, stratiform Zn–Pb–Ag–(Cu)–(Ag)-rich mineralisation hosted in rhyolitic ash–siltstone (SAS-type) and stratabound volcanic-associated, limestone–skarn (SVALS-type).The district underwent amphibolite-grade metamorphism (with local areas of granulite and greenschist facies) during the Svecokarelian orogeny (1.89–1.75 Ga), in association with four main phases of deformation that included rifting, isoclinal folding, shear-zone formation and widespread tight to isoclinal folding (Stephens et al., Reference Stephens, Ripa, Lundström, Persson, Bergman, Ahl, Wahlgren, Persson and Wickström2009; Beunk and Kuipers, Reference Beunk and Kuipers2012). Extensive regional Na or K alteration is commonly early in the geological history and was associated with a diagenetic or hydrothermal event (Frietsch, Reference Frietsch1982; Lagerblad and Gorbatschev, Reference Lagerblad and Gorbatschev1985). According to Allen et al. (Reference Allen, Lundström, Ripa, Simeonov and Christofferson1996), the Bergslagen district represents an extensional, continental margin, back-arc region developed on continental crust. Felsic pyroclastic and volcaniclastic material was deposited in a shallow marine basin by numerous caldera volcanoes, and stromatolite and microbial reef growth developed carbonate horizons during periods of relative volcanic inactivity (Allen et al., Reference Allen, Bull, Ripa and Jonsson2003).
Base and precious metal deposits in the Bergslagen district, including the SVALS/SAS-type Falun (Sundblad, Reference Sundblad1994; Kampmann et al. Reference Kampmann, Jansson, Stephens, Majka and Lasskogen2017), Garpenberg (Jansson and Allen, Reference Jansson and Allen2011, Reference Jansson and Allen2015), Sala (Jansson et al. Reference Jansson, Allen, Skogsmo and Turner2021), Zinkgruvan (Hedström et al. Reference Hedström, Simeonov and Malström1989; Jansson et al. Reference Jansson, Zetterqvist, Malmström and Allen2017) and Lovisa (Jansson et al. Reference Jansson, Sädbom, Allen, Billström and Spry2018) have been mined, however historically iron ore has been economically the most important. The iron deposits in the Bergslagen district have been classified traditionally on the basis of their phosphorous (or apatite) content and style of mineralisation (Geijer and Magnusson, Reference Geijer and Magnusson1944). Deposits with <0.2 wt.% P include hematite–magnetite BIF and skarn–limestone magnetite ores, and those with >0.2 wt.% P are classified as massive apatite-rich magnetite ores and disseminated apatite-bearing magnetite ores. Banded iron formation is subdivided typically into Mn-rich (>1 wt.%) and Mn-poor (<1 wt.%) types. Allen et al. (Reference Allen, Ripa and Jansson2008) divided the Fe oxide deposits hosted by skarn or carbonate rock into two types, the first of which is hosted by Mn-poor skarn or marble, and is up to 50 m wide. These occur mostly in the supracrustal rocks in the central-western parts of the Bergslagen district and are the most common type of Fe oxide occurrence. The second type occurs in Mn-rich skarns, or, and in general, marble that is typically higher in the stratigraphic sequence in the Bergslagen district than the first type.
Local geology
A regional N–S trending, steeply dipping, F2 syncline (herein referred to as the Stollberg syncline) is located ~4 km NE of the village of Ludvika, and is associated spatially with more than a dozen base-metal and magnetite deposits in the Stollberg ore field (Fig. 1). Sulfides are associated spatially with marble and skarn within bimodal felsic and mafic rocks and underwent amphibolite-grade metamorphism (560–600°C and 2–3.5 kbar; Beetsma, Reference Beetsma1992; Björklund, Reference Björklund2011; Jansson et al., Reference Jansson, Erismann, Lundstam and Allen2013). Details of the local geology are described in detail by Ripa (Reference Ripa1988, Reference Ripa1994, Reference Ripa2012), Jansson et al. (Reference Jansson, Erismann, Lundstam and Allen2013) and Frank et al. (Reference Frank, Spry, Raat, Allen, Jansson and Ripa2019) and are only summarised here.
(a) Geological map of the Stollberg area, showing the location of mines, mineral occurrences, and drill cores. 1 = Gränsgruvan, 2 = Norrgruvan, 3 = Tvistbo, 4 = Lustigkullagruvan, 5 = Cedercreutz, 6 = Baklängan, 7 = Dammberget, 8 = Stollmalmen, 9 = Brusgruvan and 10 = Grönkullan. Drill cores from which samples were taken are shown. Grid is Swedish National Grid RT90, and inset map shows the location of Stollberg in Sweden. (b) Key. Modified after Raat et al. (Reference Raat, Jansson and Lundstam2013).

Jansson et al. (Reference Jansson, Erismann, Lundstam and Allen2013) defined two stratigraphic successions (Stollberg and Staren) on the eastern side of the syncline. The lower part of the Staren succession consists of >200 m of massive metamorphosed quartz–feldspar rhyolitic sandstone that is overlain by the Staren limestone, which consists of coarse-grained locally pure marble that was, in places, altered to epidote- actinolite- and hedenbergite-bearing skarn. Interbeds of metamorphosed rhyolitic siltstone are also present. A mixture of rhyolitic and calcareous sandstones, breccias and conglomerates overlie the Staren limestone.
The Staren and Stollberg successions are separated by a rhyolitic intrusion that was affected by Na alteration. The base of the Stollberg succession consists of ~500 m of feldspar–phyric rhyolitic pumice breccia–sandstone that was altered hydrothermally and metamorphosed subsequently. This rock grades into the Stollberg limestone, which hosts most of the base-metal sulfide deposits (Table 1). A thin magnetite-bearing banded iron formation occurs a few tens of metres east of, and stratigraphically below, the Stollberg limestone. Near sulfides the limestone is altered to skarn, although where least altered, it consists of dolomitic and Mn-bearing marble. Over 700 m of metamorphosed planar-bedded rhyolitic ash silt–sandstone overlie the Stollberg limestone. The succession was altered hydrothermally to various intensities and metamorphosed subsequently to produce an array of metamorphosed altered rocks (e.g. Ripa, Reference Ripa1988, Reference Ripa1994, Reference Ripa2012; Jansson et al., Reference Jansson, Erismann, Lundstam and Allen2013). Amphibolite sills with a basaltic composition occur within the Stollberg succession (Björklund, Reference Björklund2011). Both the Stollberg and Staren successions were subsequently crosscut by diabase sills and dykes.
General geological characteristics of ore deposits in the Stollberg ore field.

Abbreviations: Au – native gold; Ab – albite; Act – actinolite; Alm – almandine; Amp – amphibole; Apy – arsenopyrite; Ath – anthophyllite; Bt – biotite; Cal – calcite; Cam – clinoamphibole; Chl – chlorite; Ccp – chalcopyrite; Crd – cordierite; Cpx – clinopyroxene; Czo – clinozoisite; Dsp – diaspore; Ep – epidote; Flr – fluorite; Gn – galena; Ged – gedrite; Ghn – gahnite; Grs – grossular; Grt – garnet; Gru – grunerite; Hbl – hornblende; Hd – hedenbergite; Hu-group – humite group; Kfs – K-feldspar; Kne – knebelite; Lö – löllingite; Mag – magnetite; Mcc – microcline; Mn-Ilm – Mn ilmenite; Mn-Gru – Mn – grunerite; Ms – muscovite; Phl – phlogopite; Pl – plagioclase; Pyh – pyrrhotite; Py – pyrite; Pxn – pyroxenoid; Qz – quartz; Ser – sericite; Sil – Sillimanite; Sp – sphalerite; Sps – spessartine; St – staurolite; Tlc – talc; Tr – tremolite. Most abbreviations from Warr (Reference Warr2021).
Mineral deposits in the Stollberg orefield consist of both Fe- and Mn-rich oxide deposits and stratabound carbonate replacement Zn–Pb–Ag–(Cu–Au) sulfide deposits (Jansson et al., Reference Jansson, Erismann, Lundstam and Allen2013) similar to deposits found elsewhere in the Bergslagen region (e.g. Geijer, Reference Geijer1917; Allen et al., Reference Allen, Lundström, Ripa, Simeonov and Christofferson1996; Stephens and Jansson, Reference Stephens, Jansson, Stephens, Bergman and Weihed2020). Metamorphosed altered rocks are associated spatially with base-metal sulfide deposits and include quartz–garnet–pyroxene rock, skarn, garnet–biotite, gedrite–albite, cordierite–biotite, siliceous, sericitic and quartz–fluorite rocks (Table 1). The term skarn here refers to stratabound or stratiform calc-silicate rocks dominated by clinopyroxene, garnet, and/or clinoamphibole without any necessary spatial or genetic link to igneous intrusion, as described by Jansson et al. (Reference Jansson, Erismann, Lundstam and Allen2013). Detailed descriptions of the metamorphosed altered rock types from the eastern limb of the Stollberg syncline are given in Ripa (Reference Ripa1988, Reference Ripa1994, Reference Ripa2012) and Jansson et al. (Reference Jansson, Erismann, Lundstam and Allen2013), whereas those associated spatially with the Gränsgruvan deposit, on the western side of the syncline, are summarised in Björklund (Reference Björklund2011), Raat et al. (Reference Raat, Jansson and Lundstam2013) and Frank et al. (Reference Frank, Spry, Raat, Allen, Jansson and Ripa2019).
Sampling and analytical methods
Magnetite-bearing samples were collected from drill core from the Gränsgruvan, Tvistbo, Norrgruvan, Cedercreutz, Baklängan and Dammberget deposits, and the Staren limestone, as well as from surface outcrops in BIF associated with the Grönkullan Fe deposit (Fig. 1). Polished thin sections were examined with an Olympus BX-60 dual reflected–transmitted light microscope. Electron microprobe analysis (EMPA) of magnetite was carried out at the University of Minnesota using a JEOL 8900 electron probe microanalyser at an accelerating voltage of 15 kV and a beam current of 20 nA. Trace-element concentrations of magnetite in 37 samples were measured at the U.S. Geological Survey in Denver, Colorado using laser ablation-inductively coupled plasma-mass spectrometry (LA-ICP-MS) with a New Wave Research UP-193 FX LA system (193 nm excimer) coupled to a PerkinElmer DRC-e ICP-MS. Magnetite was ablated at a beam diameter of 30, 65, or 135 μm depending on grain size and the presence or absence of mineral inclusions. Analyses were calibrated using synthetic glass reference standards GSD-1G and NKT-1G from the U.S. Geological Survey. Concentrations were determined using off-line calculations following the protocol of using GeoPro (CETAC Technologies) software (Longerich et al. (Reference Longerich, Jackson and Gunther1996). Iron (57Fe) was used as the internal standard for concentration calculations. Values of FeO from EMPA were used for internal standardisation. Fifty-one elements were analysed. Al27, Co59, Cr52, Ga71, Mg24, Mn55, Sn118, Ti47, V51 and Zn66 were generally above detection limits, whereas Ag107, As75, Ba137, Bi209, Ca42, Cd111, Cu63, Ge74, K39, Li7, Mo98, Na23, Ni60, P31, Pb208, Rb85, Sb121, Sc45, Si28, Sr88, Th232, U238, W184, Y89, Zr90, and the rare earth elements (REEs) were generally near or below detection limits. Note that polyatomic interferences of Zr are not generally expected for magnetite (see Dare, Reference Dare, Barnes and Beaudoin2012; Reference Dare, Barnes, Beaudoin, Méric, Boutroy and Potvin-Doucet2014). This list includes Si, Ca and the REEs, which are useful for data screening and the identification of analyses that are affected by inclusions, some of which may be submicroscopic in size (e.g. Dare et al., Reference Dare, Barnes, Beaudoin, Méric, Boutroy and Potvin-Doucet2014; Nadoll et al., Reference Nadoll, Angerer, Mauk, French and Walshe2014; Pisiak et al., Reference Pisiak, Canil, Grondahl, Plouffe, Ferbey and Anderson2015). The detection limits are given in Supplementary table S1. GSD-1G was analysed three times during a 10 hour period to correct for instrument sensitivity drift.
Mineralogy of magnetite-bearing rocks in Stollberg ore field
Magnetite is present as layers or as disseminations in sulfides in the Staren limestone, skarn, banded iron formation, magnetite-rich conglomerate, and quartz–garnet–pyroxene, garnet–biotite, sericite–garnet–magnetite and gedrite–albite altered rocks. Magnetite-bearing assemblages identified here are given in Table 2.
Magnetite-bearing assemblages in the Stollberg ore field.

Notes: Minerals are listed in approximate order of abundance; * indicates <1% present; Most mineral abbreviations from Warr (Reference Warr2021); BIF = banded iron formation.
Magnetite in sulfide-bearing rocks
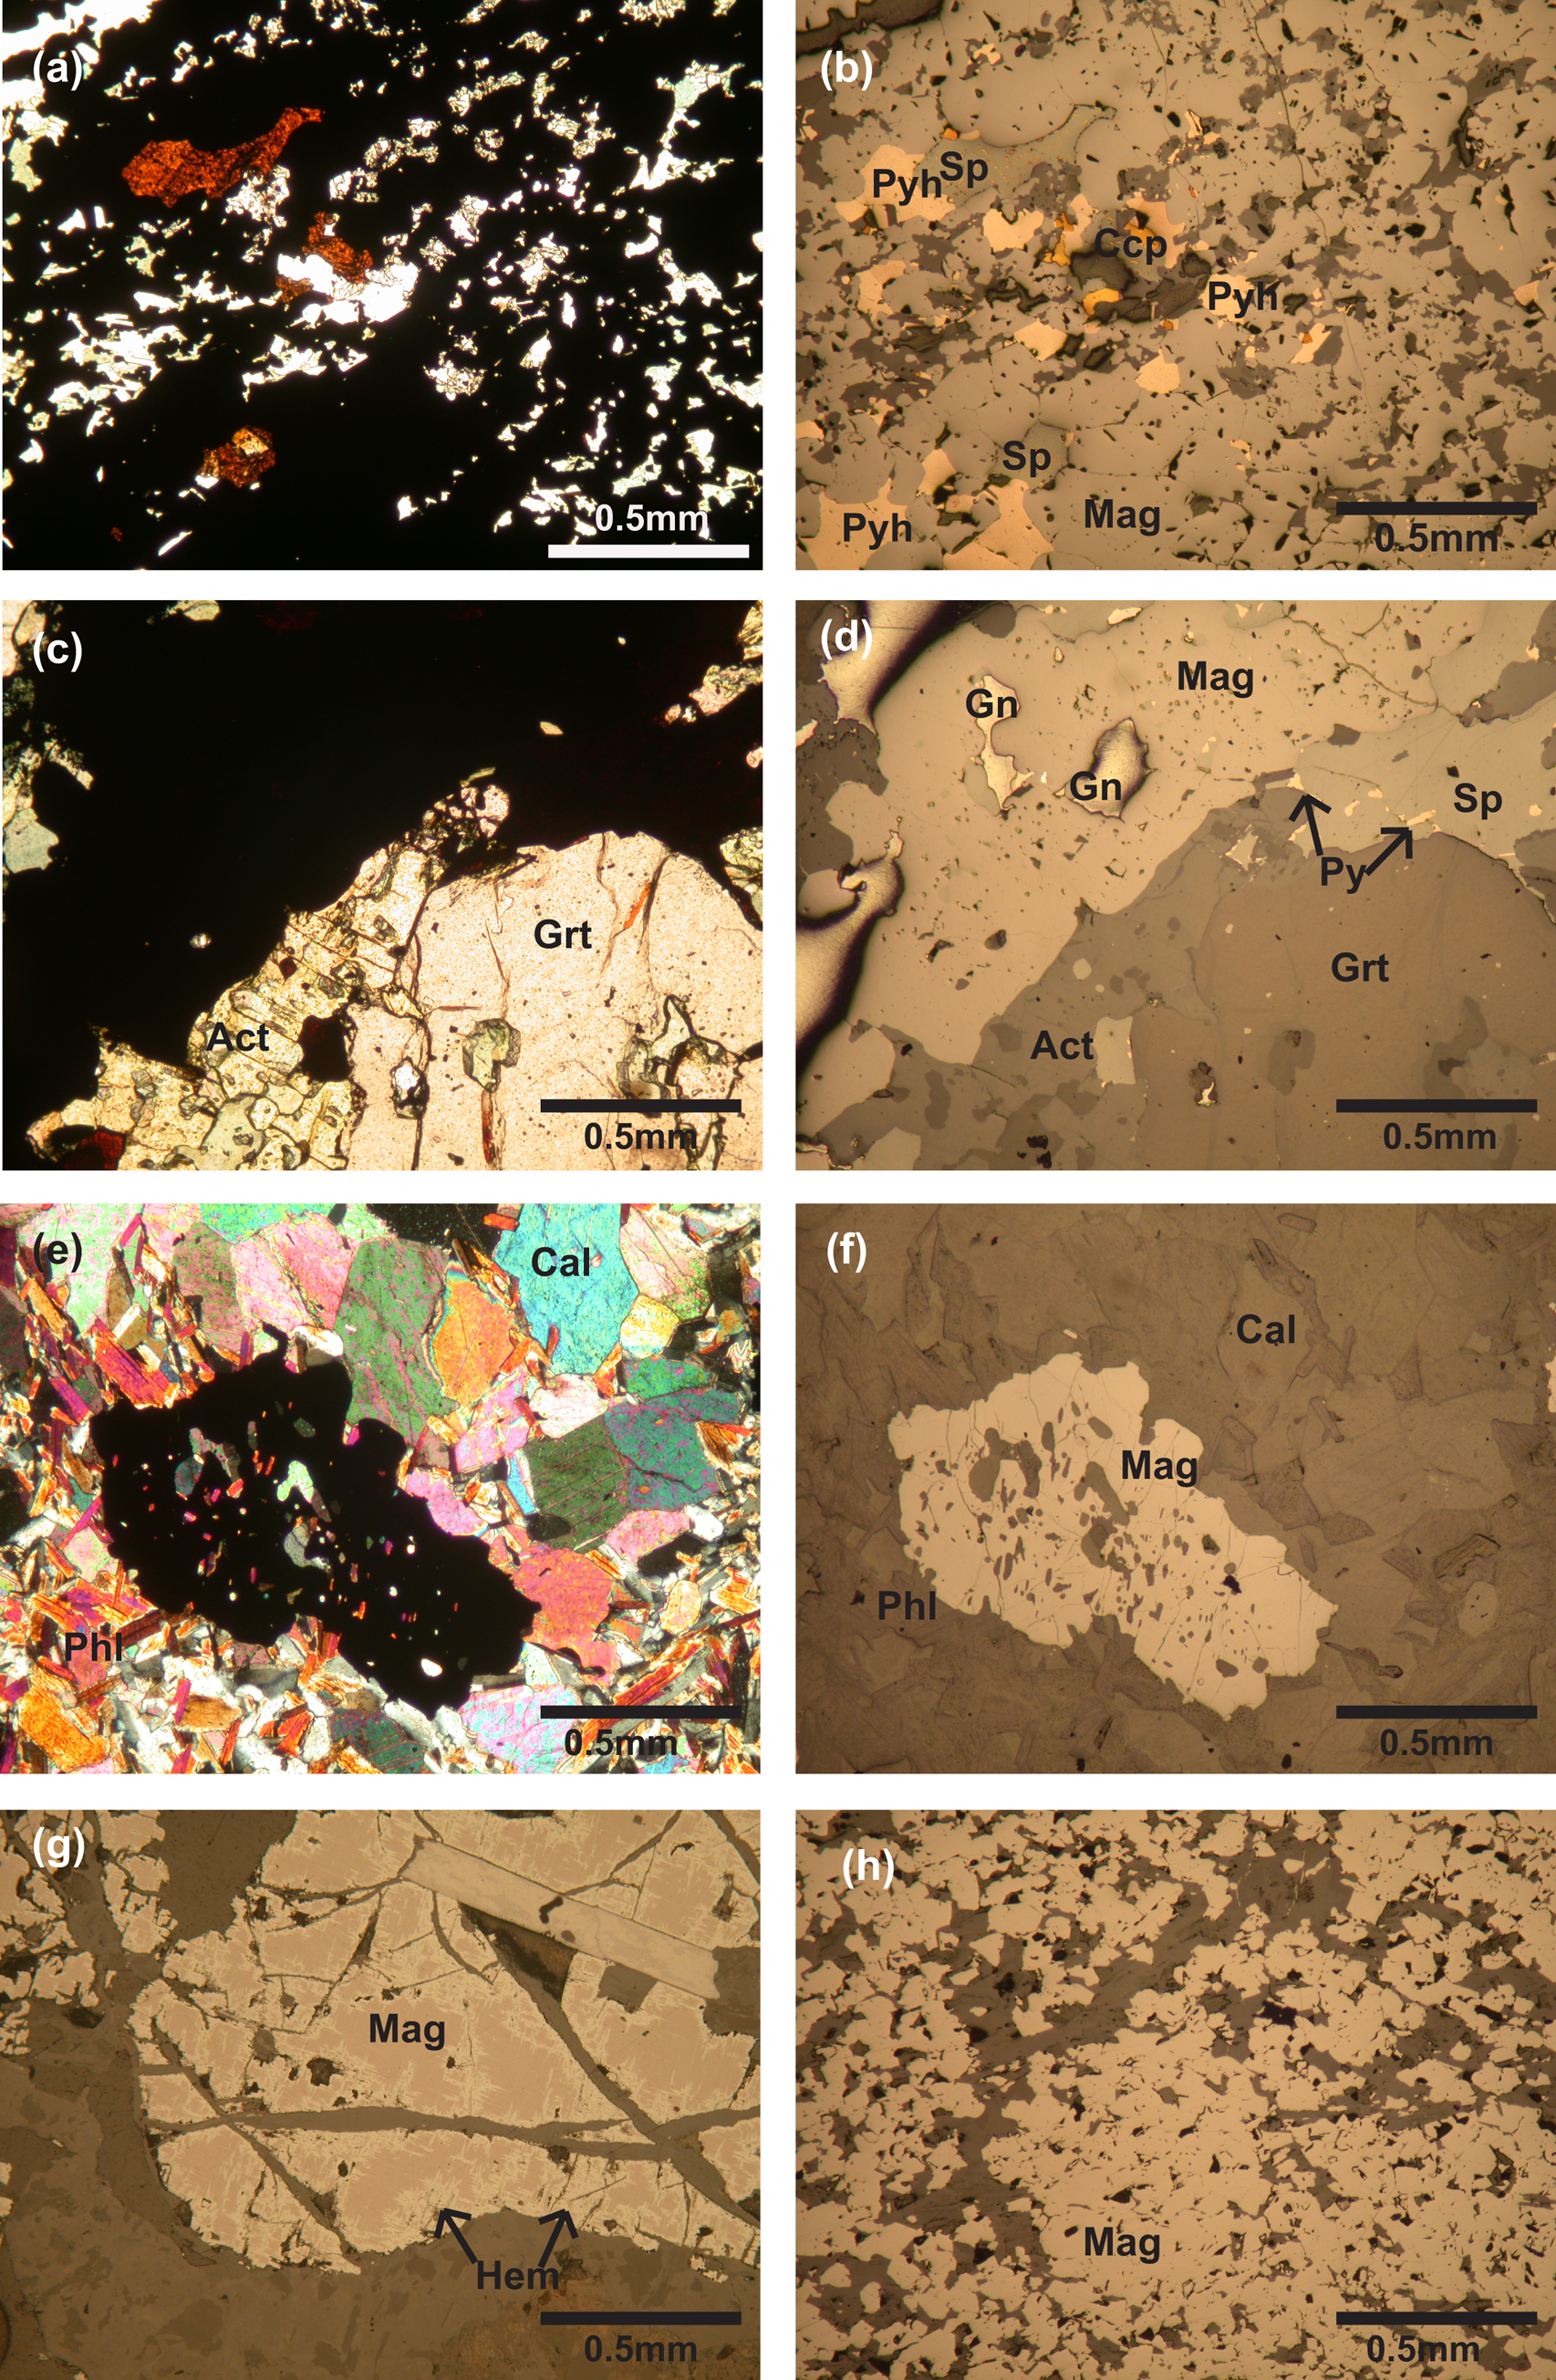
Magnetite is intergrown with sulfides in all base-metal occurrences except for Brusgruvan (Fig. 2a–d). Jansson et al. (Reference Jansson, Erismann, Lundstam and Allen2013) reported massive magnetite bodies grading into marble at Stollmalmen, as well as veined magnetite in the marble. At Cedercreutz, massive magnetite contains porphyroblasts of knebelite (manganese variety of fayalite–tephroite series), whereas in the Marnäs deposit semi-massive magnetite is hosted by Al-rich skarn (Jansson et al., Reference Jansson, Erismann, Lundstam and Allen2013). Magnetite at Dammberget occurs primarily as disseminations in sulfide zones containing pyrrhotite and minor chalcopyrite (Fig. 2a, b). Just to the east of this deposit, the banded iron formation consists of layers of magnetite, quartz, garnet, biotite and cummingtonite–grunerite, with lesser amounts of pyrite and chalcopyrite, and secondary chlorite and sericite in metamorphosed weakly altered rhyolitic ash–siltstone.
Photomicrographs of magnetite in thin section from altered rocks in the Stollberg syncline. (a) Magnetite (Mag) with inclusions of pyrrhotite (Pyh), sphalerite (Sp) and chalcopyrite (Ccp) in massive sulfide mineralisation (Dammberget, sample SSF26 832.5), in transmitted light and (b) reflected light. Quartz is the colourless mineral in (a). (c) Magnetite with inclusions of galena (Gn) and sphalerite in massive sulfide mineralisation, with garnet (Grt) and actinolite (Act) (Grönkullan, sample 14b), in transmitted light and (d), reflected light. (e) Isolated grains of magnetite with inclusions of calcite (Cal) and phlogopite (Phl) in weakly altered skarn (Cedercreutz, sample SSF22 844.8), in transmitted light, and (f) reflected light. (g) Magnetite (Mag) in sericite–garnet–magnetite rock exhibiting alteration to hematite (Hem) along mineral grain margins and fractures (Norrgruvan, sample DBH 82004 147.6 in reflected light. (h) Massive magnetite in garnet–biotite rock (Dammberget, sample SSF 30 561.1), reflected light.
At Gränsgruvan, the main zone of sphalerite–galena–pyrite mineralisation lies stratigraphically between quartz–garnet–pyroxene and sericite altered rocks. Below these rocks, within sericite and silica altered rocks, is a pyrite–pyrrhotite zone that contains minor amounts of chalcopyrite and magnetite. Although quartz–garnet–pyroxene rocks at Gränsgruvan consist primarily of quartz, garnet and diopside/hedenbergite with lesser amounts of biotite, microcline, clinoamphibole and calcite, rare magnetite occurs with garnet and tremolite. Both magnetite and garnet are crosscut by tremolite.
Magnetite in sulfide mineralisation at Grönkullan, 2 km northwest of the Gränsgruvan deposit, is intergrown with galena, sphalerite, and minor pyrite and pyrrhotite. Sulfides are hosted by actinolite, garnet and clinopyroxene. Similar to other deposits, magnetite contains inclusions of sulfides. However, it should be noted here that samples from Grönkullan are skarn-like and from oxide-facies dominant banded iron formation that occurs stratigraphically below the Stollberg ore field.
Magnetite-bearing skarn
Skarn in the Stollberg ore field is a calc-silicate rock composed typically of clinopyroxene, calcite, garnet and clinoamphibole, with lesser amounts of biotite, muscovite and microcline, and rare gahnite and fluorite. On the eastern side of the Stollberg syncline, skarn primarily hosts sulfide mineralisation, with altered magnetite-bearing marble present in the hanging wall and footwall of the sulfide zone. At Dammberget, skarn contains disseminated, anhedral magnetite with calcite, diopside/hedenbergite and muscovite, whereas finer grained skarn at Cedercreutz contains calcite, phlogopite and chlorite with disseminated grains of magnetite that contain inclusions of these three minerals (Fig. 2e, f). Magnetite-bearing skarn from Baklängan contains disseminated sulfides, primarily sphalerite, pyrrhotite and chalcopyrite, together with calcite, diopside/hedenbergite, magnetite, actinolite, hornblende, chlorite and garnet.
At Gränsgruvan, the skarn analysed occurs in the hanging wall and footwall of the ore zone but is devoid of sulfides. Instead, it contains magnetite as isolated grains in calcite, garnet, diopside/hedenbergite and actinolite. North of Gränsgruvan, a skarn-like rock at Norrgruvan is composed of calcite, quartz, microcline and anthophyllite, with locally abundant sericite, diopside/hedenbergite, garnet, hornblende and disseminated magnetite. Although rare at Stollberg, magnetite at the Norrgruvan prospect is altered locally to hematite (Fig. 2g). The Tvistbo prospect contains sphalerite, galena and magnetite with minor quantities of pyrrhotite, chalcopyrite and pyrite, hosted by skarn consisting of calcite, biotite, garnet, actinolite, diopside/hedenbergite and quartz. Magnetite contains inclusions of calcite.
On the eastern limb of the Stollberg syncline, in the Staren limestone, euhedral magnetite occurs in skarn-altered marble, which consists primarily of calcite, epidote, actinolite, Mg-hedenbergite, chlorite and sericite. In addition, Jansson et al. (Reference Jansson, Erismann, Lundstam and Allen2013) reported the presence of beds of magnetite-rich mafic conglomerate in the Staren limestone, which also contain actinolite-, epidote- and magnetite-bearing skarn, with clasts of bimodal mafic and felsic volcanic material. A sample collected here from the Staren limestone (SSF15 354.0) contains fine-grained magnetite, microcline and biotite with minor epidote. Skarn in banded iron formation at Grönkullan contains calcite and clusters of tremolite with minor pyrrhotite, magnetite, diopside/hedenbergite and chalcopyrite.
Other magnetite-bearing rocks
Garnet-biotite rocks are almost as widespread as skarn, and are also associated typically with magnetite-bearing sulfides. At Dammberget, these rocks contains garnet, biotite, quartz, fibrolite and muscovite, with lesser amounts of fluorite, grunerite, gahnite, pyrrhotite, chalcopyrite and subhedral to anhedral magnetite. Magnetite-rich lenses composed of magnetite, quartz, and garnet also occur on the eastern limb of the Stollberg syncline (Fig. 2h).
Gedrite–albite rocks occur on the eastern limb of the Stollberg syncline in a zone that stretches from just north of the Cedercreutz deposit to more than 1 km south of the Brusgruvan deposit. They occur stratigraphically beneath these deposits and are composed of fine-grained quartz, acicular to radiating ferro-gedrite, and plagioclase, with rare cordierite, epidote and fine-grained euhedral to subhedral magnetite.
Magnetite is also present in mafic sills either as small masses or as disseminations. A mafic sill at Dammberget consists primarily of ferro-actinolite, with disseminated magnetite, pyrrhotite and chalcopyrite, and minor plagioclase.
Magnetite compositions
Trace-elements
Magnetite compositions (n = 442) were obtained from 37 samples of various types of metamorphosed altered rock. More compositional data were collected from magnetite in skarn (274 analyses from 15 samples) than from any other rock type due to the common association between magnetite, sulfides and skarn. Samples from altered Staren limestone were collected from two drill holes (SSF16 and SSF7), ~2 km apart, which are not associated spatially with sulfide mineralisation. The median concentrations of the ten most abundant trace elements (Al, Co, Cr, Ga, Mg, Mn, Sn, Ti, V and Zn) are shown for each sample in Table 3 and are discussed here. All data are given in Supplementary table S2. Element–element bivariate plots are shown for Mg vs. Al, V vs. Mn, Al vs. Ti, and Zn vs. Ga for magnetite in skarn (Fig. 3a-d) and for Al vs. Ti, V vs. Mn, and Zn vs. Ga for magnetite in sulfide mineralisation and garnet–biotite rocks (Fig. 4a–f). These elements were chosen because most data were above the limits of detection.
Element–element plots of magnetite composition (ppm) in skarn from the Stollberg ore district. (a) Mg vs. Al; (b) V vs. Mn; (c) Al vs. Ti; and (d) Zn vs. Ga. The arrow in Fig. 3a shows the increase in Al and Mg content going from Norrgruvan through to Tvistbo, Cederkreutz and Dammberget.

Element–element plots of magnetite composition (ppm) in sulfide mineralization from the Stollberg ore district. (a) Al vs. Ti; (b) Zn vs. Ga; and (c) V vs. Mn; and in garnet–biotite rocks (d) Al vs. Ti; (e) Zn vs. Ga; and (f) V vs. Mn.

Median trace compositions of selected elements in magnetite from the Stollberg district (ppm).

Notes: N = number of analyses, Co contents <1 are rounded to 2 decimal places
*Key to deposit and rock type: 1 sulfide mineralization; 2 amphibolite; 3 skarn; 4 garnet-biotite altered rock; 5 magnetite-bearing quartz vein; 6 gedrite albite rock; 7 quartz-magnetite rock
Skarn is host to ore along the eastern side of the syncline and at Tvistbo, where magnetite is a common accessory mineral. When compared to the trace-element compositions of magnetite from other metamorphosed altered rock types in the Stollberg ore field, magnetite in skarn generally has among the highest Mg (up to 1867 ppm; Gränsgruvan), Mn (up to 19,423 ppm; Gränsgruvan), Ni (up to 142 ppm, Norrgruvan) and Cd (up to 792 ppm, Norrgruvan) contents (See Supplementary table S2). Clockwise around the Stollberg syncline, starting from Norrgruvan in the north to deposits on the eastern limb of the Stollberg syncline (i.e. Norrgruvan, Tvistbo, Cedercruetz and then Dammberget), magnetite in skarn generally shows a steady increase in the median content of Mg (Fig. 3a). For the same sequence of deposits (excluding Dammberget), the concentration of Al also increases for magnetite in skarn, with the highest values occurring in the Baklängan deposit, which then decreases at Dammberget (Fig. 3a, c). Elevated concentrations of Sn in magnetite occur in sulfide-bearing skarn from Tvistbo (up to 68 ppm), Cedercreutz (up to 83 ppm), Baklängan up to 52 ppm) and Dammberget (up to 101 ppm). Magnetite contains elevated values of Ga in skarn from the Gränsgruvan (up to 178 ppm), Tvistbo (93 ppm) and Baklängan (98 ppm) deposits, with one anomalous value from Dammberget of 225 ppm Ga (Fig. 3d), whereas Zn is enriched in magnetite from the Gränsgruvan (up to 3963 ppm) and Dammberget (up to 4049 ppm) (Fig. 3d). The composition of magnetite in skarn at Gränsgruvan, which is not associated spatially with sulfides, has the highest concentrations of Mg (1868 ppm) and Ga (178 ppm), as well as elevated levels of Al (up to 6274 ppm) (Fig. 3a, c, d). On average, magnetite in marble/skarn from the Staren limestone contains the highest concentration of Co (up to 22 ppm) and among the lowest concentrations of Mn compared to magnetite from other marbles/skarns (Fig. 3b).
Magnetite in sulfide mineralisation from the Dammberget, Gränsgruvan, Tvistbo and Grönkullan deposits is generally enriched in Mn (particularly at Tvistbo, ~9000 ppm), Sb (up to 9.79 ppm, 13.5 ppm and 7.54 ppm at Tvistbo, Dammberget and Grönkullan, respectively), and Mo (up to 9.63 ppm, Tvistbo), relative to magnetite in all other rock types, except for skarn which can also contain elevated concentrations of Mo (up to 8.97 ppm). Where elevated in Mo, samples of magnetite are also generally enriched in Zn (up to 6236 ppm, Dammberget). Relative to magnetite compositions in sulfide mineralisation from other deposits in the Stollberg district, those from Gränsgruvan are depleted in Ti (Fig. 4a) and Zn (Fig. (Fig. 4b). Similarly to those from Tvistbo, magnetite compositions are depleted in V compared to those from Grönkullan and Dammberget (Fig. 4c). Those from the last deposit are generally more enriched in Ga and depleted in Mn (Fig. 4b, c).
Magnetite in garnet–biotite rock from Gränsgruvan and Dammberget is generally depleted in trace elements relative to other metamorphosed altered rocks, particularly in sample GGR142 408.4 from the Gränsgruvan deposit. Magnetite in samples from the Dammberget deposit is relatively depleted in Ti, V, Mn, Co, Zn, Ni, Cu, Mo, Cd and Pb, except for magnetite in sample SSF26 841.0, which occurs in close proximity to sulfide mineralisation and is enriched in Al, Ti, Zn, Ga and Sn. Compared to magnetite in garnet–biotite rocks from Gränsgruvan those from Dammberget are enriched in Al, Ti, Zn, Ga and V, though more depleted in Mn (Fig. 4d–f).
Quartz–garnet–pyroxene rock (GGR136 180.3) from the Gränsgruvan deposit contains magnetite with elevated concentrations of Ti, Mn, Zn, Co and W, and low amounts of Cr, Na, Cu, Sb and Ba. Magnetite in a sample of matrix-supported mafic polymict conglomerate (SSF15 354.6) associated spatially with the Staren limestone contains the highest V (1550 ppm), Co (28.4 ppm) and Cr (65.9 ppm), and the lowest Zn (38.1 ppm) of any rock analysed here. This magnetite is also among the poorest in terms of Mg (29.7 ppm), Al (129.7 ppm), Ga (5.80 ppm) and Sn (1.98 ppm).
Magnetite in a sericitically altered garnet–magnetite rock from Norrgruvan (DBH 82004 147.6) contains the lowest Mg content (13.6 ppm) and among the highest concentrations of V (241.6 ppm), Ga (175.4 ppm) and Co (6.58 ppm). Magnetite in amphibolite (SSF26 861.0) near the ore zone at Dammberget contains low amounts of trace elements but the highest concentration of Ge (27.2 ppm) and is enriched in Ga and Cr, though depleted in Mg, Al, Co, Li, Na, Ca, Ni, Cu, Zr, Cd and Pb.
Magnetite in a gedrite–biotite–albite rock (sample SSF28 356.1) in the footwall of the Dammberget deposit contains among the highest median values of Al (4263 ppm), Co (11.5 ppm) and Ga (372.5 ppm) and lowest Mg (29.5 ppm) and Mn (104.5 ppm), whereas sample SSF30 553.8 contains similar median concentrations of Al (3860 ppm) and Mn (173.9 ppm), but lower Ga (50.6 ppm) and Co (1.35 ppm) contents.
Principal component analysis
Although the element–element variation diagrams shown in Figs 3 and 4 have been used to demonstrate which two elements are elevated or depleted in a given rock type within and between the various ore deposits, they do not show trends for multiple elements. Multivariate statistical methods, including, for example, principal component analysis (PCA) and Random Forests, can be used instead to identify underlying patterns in datasets with many variables (e.g. Joliffe and Cadima, Reference Jolliffe and Cadima2016). A PCA allows for the reduction of multivariate data sets into a two-dimensional representation of variance, which enables factors that contribute the greatest variability within the data set to be identified. Here we apply a PCA to various magnetite-bearing rocks in the Stollberg ore field.
Makvandi et al. (Reference Makvandi, Ghasemzadeh-Barvarz, Beaudoin, Grunsky, McClenaghan and Duchesne2016b) suggested that the most important discriminator elements in magnetite from VMS deposits are Al, Ca, Co, Cr, Ga, Mn, Mg, Ni, Si, Ti, Zn and Zr. We have focused principally on these elements here. Data gathered in the present study via LA-ICP-MS were pre-treated to avoid problems associated with the constant-sum constraint and to correct for heteroscedasticity using a centred log-ratio transformation in CoDaPack version 2.01.8 (Comas-Cufí and Thió-Henestrosa, Reference Comas-Cufí, Thió Henestrosa, Egozcue, Tolosana-Delgado and Ortego2011). Pre-treated data were then subjected to PCA in JMP Pro version 11.0.
Magnetite analysed here typically contain concentrations of Al, Co, Cr, Ga, Mg, Mn, Sn, Ti, V and Zn above detection limits, with Ca, Si and Zr generally below detection limits. For the present study, we included censored geochemical data, which contains values below detection limits for some elements. The censored data were substituted with values equal to the detection limit/√2 for a given element, which according to Croghan and Egeghy (Reference Croghan and Egeghy2003) and Verbovsek (Reference Verbovsek2011) produces a mean value of the population that is close to the statistical mean of the censored data. On the basis of the statistical studies of Hron et al. (Reference Hron, Templ and Filzmoser2010), populations with up to 40% censored data can be evaluated. We conducted a PCA on the ten most abundant elements listed above for 435 of 442 LA-ICP-MS analyses obtained here (Fig. 5a). The seven compositions that were excluded from the PCA were of mineral inclusions in magnetite.
Principal component analysis for 10 elements (Al, Co, Cr, Ga, Mg, Mn, Sn, Ti, V and Zn) in magnetite (n = 435) for all rocks studied here from the Stollberg syncline. (a) Score plot of the first two principal components, with the percentage of variance for each component noted in parentheses. (b) Loading plot showing the geometric representation of how data were projected onto the score plot with respect to each element. (c) Percentages of the first nine principal components. (d) Score contribution plot for principal component 1. (e) Score contribution plot for principal component 2.

Principal component 1 accounts for 33.7% of variance with V, Cr and Co, correlating negatively with Al, Ti, Zn, Ga and Sn (Fig. 5b). Principal component 2 represents 25.3% of variance and shows that Mn and Mg correlate negatively with Al, Co, Ga, Ti and V. Principal components 3 to 9 range from 10.6% to 1.6% (Fig. 5c). Component 1 and 2 scores for each element are shown in Figs 5c and d, respectively. Magnetite from Tvistbo and Gränsgruvan have similar scores, regardless of rock type, whereas magnetite scores from the Dammberget and Norrgruvan deposits are more scattered. The composition of magnetite in garnet–biotite and gedrite–albite rocks from Dammberget, which have high component 2 scores, is dictated by the elevated concentrations of Ga and Al. Magnetite in magnetite-rich conglomerate from Staren has component 1 scores <0 and component 2 scores near 0 that can be distinguished from magnetite from other locations.
Because of the high number of magnetite compositions obtained here, scores from various rock types in Fig. 5a overlap, so the data have been separated to distinguish the data more clearly in Figs 6a–c. Figure 6 shows PCAs for magnetite compositions in garnet–biotite rocks from Dammberget and Gränsgruvan (Fig. 6a, N = 107), sulfide mineralisation from Gränsgruvan, Tvistbo, Dammberget and Grönkullan (Fig. 6b, N = 95), and skarn from the Staren limestone and the Gränsgruvan, Norrgruvan, Tvistbo, Baklängan, Cedercreutz and Dammberget deposits (Fig. 6c, N = 274). Magnetite in garnet–biotite rocks from Dammberget cluster near zero for components 1 and 2 with some data showing positive values. Although some data from Dammberget overlap with those from Gränsgruvan, magnetite in garnet–biotite rocks in the latter have component 2 scores between –1 and 0 (Fig. 6a). It should be pointed out that magnetite in these rocks from Dammberget contains higher amounts of Al, Ti, Ga and V as shown in Fig. 4d–f, relative to those in garnet–biotite rocks from Gränsgruvan. This is reflected in the PCA (Fig. 6a) where Ga, Al and Ti show positive values of components 1 and 2.
Principal component analysis of magnetite in: (a) garnet–biotite rock from Dammberget and Gränsgruvan (N = 107); (b) sulfide mineralisation from Dammberget, Gränsgruvan, Tvistbo, and Grönkullan (N = 95); and (c) skarn from the Staren limestone, and the Gränsgruvan, Norrgruvan, Tvistbo, Baklängan, Cedercreutz and Dammberget deposits (N = 274). Data are derived and also shown in Fig. 3.

Principal component analysis scores for magnetite in sulfide mineralisation from Tvistbo, Dammberget, Gränsgruvan and Grönkullan are somewhat clustered with magnetite from Gränsgruvan being characterised by component 1 and 2 showing scores <0, whereas component 1 and 2 scores for magnetite from Dammberget are primarily >0 and controlled principally by the presence of Al, Ga, Sn and Ti. Principal component analysis scores for magnetite in sulfides from Tvistbo, Grönkullan, and some data from Dammberget exhibit component 1 scores >1 and component 2 scores mostly between –1 and 0 (Fig. 6b). Deposits in the eastern side of the Stollberg syncline are associated spatially with a prominent gedrite–albite alteration, which is not observed at Gränsgruvan on the western side of the syncline. The differences in the physicochemical conditions of the ore-forming fluid undoubtedly accounts for the differences in PCA scores in Fig. 6b and the element–element plots in Figs 4a–c.
Magnetite in skarn from the Staren limestone and Norrgruvan, which shows no spatial association to sulfides, exhibit component 1 scores that overlap and are <0, whereas magnetite in skarn from Baklängan, Dammberget, Tvistbo and Cedercreutz, that are associated with sulfides, as well as Gränsgruvan, which is also not associated with sulfides, plot near the centre of the score plot and generally have component 1 scores between 0 and 2 (Fig. 6c). Although there is an overlap in the component 1 and 2 scores of magnetite among the various deposits, most deposits are clustered and show little compositional variation, a feature that is also shown in the element–element plots in Fig. 3a–d.
Discussion
Origin of magnetite
Ripa (Reference Ripa2012) and Jansson et al. (Reference Jansson, Erismann, Lundstam and Allen2013) proposed that sulfides in the Stollberg ore field formed as a result of sub-seafloor replacement of limestone to form stratabound replacement mineralisation. On the basis of the sulfide assemblage and positive Eu anomalies (Eu/Eu* up to 2.35) in the magnetite-bearing Stollberg limestone and skarn at the transition with proximal footwall altered rocks, together with the sulfide mineralisation (Jansson et al., Reference Jansson, Erismann, Lundstam and Allen2013), vent temperatures of >250°C were likely, with most of the ore-forming components being derived from felsic volcaniclastic rocks prior to metamorphism. The spatial association between magnetite and sulfides in massive sulfides and in metamorphosed altered rocks (e.g. garnet–biotite and gedrite–albite rocks) suggests that at least one generation of magnetite formed at the same time as the sulfides, and was subsequently recrystallised and metamorphosed (Fig. 2a–d). Further support for the pre-metamorphic origin of magnetite is provided by carbon and oxygen isotope studies of calcite in limestone at Stollberg (Billström et al., Reference Billström, Åberg and Nord1985) and petrography of limestones and dolomites in the Bergslagen district, which suggested to Allen et al. (Reference Allen, Bull, Ripa and Jonsson2003) and Jansson et al. (Reference Jansson, Erismann, Lundstam and Allen2013) that many of the carbonate horizons are marine stromatolitic limestone altered locally by hydrothermal fluids. Part of the pre-metamorphic alteration process added magnetite to both the Staren and Stollberg limestones and developed skarn-hosted sulfide mineralisation in the latter. Although, magnetite in skarn rocks is generally devoid of inclusions of sulfides (Fig. 2e, f). A second generation of magnetite was recognised by Ferrow and Ripa (Reference Ferrow and Ripa1991) who proposed that some magnetite formed during retrograde metamorphism as gedrite was altered to chlorite and quartz. Such magnetite was not observed in the present study.
Conditions of formation of magnetite
Nadoll et al. (Reference Nadoll, Angerer, Mauk, French and Walshe2014) and Makvandi et al. (Reference Makvandi, Ghasemzadeh-Barvarz, Beaudoin, Grunsky, McClenaghan and Duchesne2016b) proposed that the most important factors controlling the trace-element compositions of magnetite derived from “low-temperature hydrothermal fluids” (i.e. < 500°C) include ${\it f}_{{\rm O}_ 2}$ , $f_{{\rm S}_ 2}$
 , temperature, pressure, cooling rate, silica activity, host rock and fluid phase compositions, and the degree of fluid–rock interaction. However, it should be noted that studies of magnetite in sulfide deposits derived from lower temperature hydrothermal fluids that were metamorphosed subsequently are few in number (e.g. Singoyi et al., Reference Singoyi, Danyushevsky, Davidson, Large and Zaw2006; Kamvong et al., Reference Kamvong, Zaw and Siegele2007; Dupuis and Beaudoin, Reference Dupuis and Beaudoin2011; Makvandi et al., Reference Makvandi, Beaudoin, Ghasemazadeh-Barvarz and McClenaghan2013; Reference Nadoll, Mauk, Leveille, Fisher and Hough2016b), and the relative importance of these factors is still poorly understood. On the basis of their studies of magnetite in the metamorphosed Izok Lake bimodal-felsic Zn–Pb–Cu–Ag and the Halfmile Lake felsic siliclastic Zn–Pb–Cu VMS deposits, Makvandi et al. (Reference Makvandi, Ghasemzadeh-Barvarz, Beaudoin, Grunsky, McClenaghan and Duchesne2016b) suggested that the composition of metamorphic magnetite was essentially dependent on the bedrock composition, the grade of metamorphism, and oxygen fugacity.
High field strength and other immobile elements (Ti, Al, Zr, Hf, Nb, Ta and Sc) are commonly depleted in hydrothermal magnetite, as they are not present in, or transported by, hydrothermal fluid (Dare et al., Reference Dare, Barnes, Beaudoin, Méric, Boutroy and Potvin-Doucet2014). At Stollberg, Al and Zr are generally depleted, although Ta and Nb were not analysed for in the present study. Silicon and Ca are also locally enriched in hydrothermal magnetite, although both elements were mostly below detection limits in samples from the Stollberg ore field. In contrast, elements such as Mg, Mn and Zn that are transported readily in hydrothermal fluids can be enriched, especially compared to igneous magnetite (e.g. Nadoll et al., Reference Nadoll, Angerer, Mauk, French and Walshe2014). Manganese and Zn are enriched in magnetite from Stollberg, whereas Mg is generally depleted.
Dare et al. (2014, fig. 1, p. 790) generated a trace-element variation diagram for magnetite that incorporates the 25 most common trace elements generally present in magnetite. They ordered these elements on the basis of their compatibility in magnetite in a silicate magma, so that the concentration of trace elements should increase from left to right. Any variation from this increase was due to other factors that control magnetite composition. The data of Dare et al. (Reference Dare, Barnes, Beaudoin, Méric, Boutroy and Potvin-Doucet2014) were normalised to bulk continental crust of Rudnick and Gao (Reference Rudnick, Gao and Rudnick2003), which was chosen for its compositional similarities to a magmatic/hydrothermal magnetite source. In evaluating the trace-element composition in different geological settings, Dare et al. (Reference Dare, Barnes, Beaudoin, Méric, Boutroy and Potvin-Doucet2014) suggested that compatible element concentrations (e.g. Ni, V, Co, Zn, Mn and Sn) in magnetite derived from high-temperature hydrothermal fluids (500–700°C) were higher than in magnetite derived from low-temperature fluids. The median composition of magnetite from high-temperature deposits (i.e. porphyry, IOCG, magnetite–apatite and Fe–Ti–V) derived from Dare et al. (Reference Dare, Barnes, Beaudoin, Méric, Boutroy and Potvin-Doucet2014) is shown in Fig. 7 together with median compositions of magnetite they analysed from low-temperature deposits (Fe skarn, Ag–Pb–Zn veins and BIF). In addition, the range of magnetite compositions analysed from sulfide mineralisation in the Dammberget, Tvistbo and Gränsgruvan deposits, and the Izok Lake Zn–Pb–Cu–Ag VMS (Makvandi et al., Reference Makvandi, Beaudoin, Ghasemazadeh-Barvarz and McClenaghan2013), Dongyuan and Tengtie Fe skarn (Zhao and Zhou, Reference Zhao and Zhou2015) and Vegas Peledas retrograde Fe-skarn deposits (Dare et al., Reference Dare, Barnes, Beaudoin, Méric, Boutroy and Potvin-Doucet2014) are shown in Fig. 8. Izok Lake occurs in an Archean-age bimodal felsic and mafic terrane metamorphosed to the amphibolite facies, with magnetite occurring in glacial till and a variety of rock types including massive sulfides, gabbro and syenite, whereas magnetite in the Vegas Peledas deposit occurs as masses in calcic Fe-skarn associated with diorite to granite intrusions.
Multi-element variation diagram of 25 elements for magnetite, comparing compositions of magnetite in the Stollberg ore field to high temperature (500–700°C) hydrothermal magnetite (Dare et al., Reference Dare, Barnes, Beaudoin, Méric, Boutroy and Potvin-Doucet2014), low temperature (<500°C) hydrothermal magnetite (Dare et al., Reference Dare, Barnes, Beaudoin, Méric, Boutroy and Potvin-Doucet2014), the Izok Lake MS (Makvandi et al., Reference Makvandi, Beaudoin, Ghasemazadeh-Barvarz and McClenaghan2013), and the Vegas Peledas Fe skarn (Dare et al., Reference Dare, Barnes, Beaudoin, Méric, Boutroy and Potvin-Doucet2014). Data normalised to bulk upper continental crust (Rudnick and Gao, Reference Rudnick, Gao and Rudnick2003); diagram modified after Dare et al. (Reference Dare, Barnes, Beaudoin, Méric, Boutroy and Potvin-Doucet2014).

Elemental concentrations of Mg, Al, Ti, V, Co, Mn, Zn and Ga, for magnetite in sulfide mineralisation from the Stollberg ore field relative to the composition of magnetite from the Dongyuan and Tengtie Fe skarns, China (Zhao and Zhou, Reference Zhao and Zhou2015), as well as the Coeur D'Alene Ag–Pb–Zn deposit, unnamed porphyry Cu–Mo, Mg-skarn, and skarn deposits from southwestern United States (Nadoll et al., Reference Nadoll, Mauk, Leveille, Fisher and Hough2012b; Makvandi et al., Reference Makvandi, Beaudoin, Ghasemazadeh-Barvarz and McClenaghan2013, and the Izok Lake Zn–Pb–Cu–Ag VMS deposit, Nunavut (Makvandi et al., Reference Makvandi, Beaudoin, Ghasemazadeh-Barvarz and McClenaghan2013, Fig. 7).

Dare et al. (Reference Dare, Barnes, Beaudoin, Méric, Boutroy and Potvin-Doucet2014) proposed that these compatible elements were depleted in magnetite derived from lower temperature fluids as compared to higher temperature fluids due to their low solubility at lower temperatures. Nevertheless, there are concerns with this suggestion because the trace-element pattern of magnetite from the Izok Lake deposit, which formed from lower temperature hydrothermal fluids (probably <400°C), have normalised concentrations that are greater for Mg, Mn, Co and Zn than magnetite derived from high-temperature fluids. The composition of magnetite from the Vegas Peledas Fe skarn overlaps that derived from low-temperature fluids, whereas magnetite in sulfides from the Stollberg district overlap both the low- and high-temperature fields for magnetite. Compared to trace-element concentrations of Mg, Al, Ti, V, Cu, Mn, Zn and Ga in magnetite from the Dongyuan and Tengtie Fe skarn deposits, China (Zhao and Zhou, 2014), as well as in magnetite reported by Nadoll et al. (Reference Nadoll, Mauk, Leveille, Fisher and Hough2012b) and Makvandi et al. (Reference Makvandi, Beaudoin, Ghasemazadeh-Barvarz and McClenaghan2013) from unnamed skarn deposits and a porphyry Cu–Mo from the southwestern United States, the Couer d'Alene Ag–Pb–Zn deposit, and the Izok Lake Zn–Pb–Cu–Ag VMS deposit, the composition of magnetite from sulfides in the Tvistbo, Dammberget, and Gränsgruvan deposits are more similar to those from the Mg skarn deposit reported by Nadoll et al. (Reference Nadoll, Mauk, Leveille, Fisher and Hough2012b) and Makvandi et al. (Reference Makvandi, Beaudoin, Ghasemazadeh-Barvarz and McClenaghan2013) and Fe skarns from China. Compared to magnetite from the Izok Lake deposit, Mg, Zn, Co and Ga in magnetite from the Stollberg ore field are more enriched whereas Al, Ti and V are more depleted (Fig. 8). Similarly, compositions of magnetite in sulfide mineralisation from the Stollberg ore field that are normalised to continental crust compositions have a pattern more similar to that of magnetite in Mg and Fe skarns. Compared to Izok Lake, samples from Stollberg are more enriched in Hf, Sc and V, and depleted in Ca, Y, P, Cu, Mg and Co (Fig. 7). Compared to samples from the Stollberg ore field, a single sample of magnetite from the Vegas Peledas skarn deposit is within the range of Stollberg magnetite compositions except that Si and Ca are more enriched and Sn is more depleted in magnetite from Vegas Peledas.
The bulk-rock compositions of marble and skarns in the Stollberg ore field are significantly different from those of the spatially associated variably altered rhyolitic ash–siltstone (Jansson et al., Reference Jansson, Erismann, Lundstam and Allen2013). As a means to test the relative importance of the influence that bulk-rock composition and fluid–rock interactions have on the trace-element composition of magnetite at Stollberg, the trace-element compositions of magnetite in skarn, sulfide mineralisation, and garnet–biotite rocks are compared. The basis for comparison are the variation diagrams that show normalised magnetite composition from different rock types in each deposit (Fig. 8a–f). Overall, the variation diagrams have the same general shape, and it could be argued that regardless of differences in host-rock composition, the trace-element patterns, though similar, are not exactly the same. If this interpretation is correct, it would support the concept that there was a high fluid to rock ratio and that the interaction of the hydrothermal fluid with the host rock was controlled principally by the composition of magnetite, assuming that subsequent metamorphism and recrystallisation were not liberating trace elements to the fluid. However, in detail, the trace-element pattern of magnetite in sulfide mineralisation from the Gränsgruvan and Dammberget deposits resembles that of magnetite in garnet–biotite and quartz–garnet pyroxene rocks in the same deposit, however it is generally different from that for magnetite in skarn (Fig. 9a, d). Moreover, the patterns for magnetite in skarn versus magnetite in sulfides can be distinguished at Tvistbo (Fig. 9b) and Grönkullan (Fig. 9f), thus suggesting that bulk-rock composition is also an important factor controlling magnetite composition.
Multi-element variation diagrams of 25 elements for magnetite compositions from (a) Gränsgruvan; (b) Tvistbo and Norrgruvan; (c) Cedercreutz and Baklängan; (d) Dammberget; (e) Staren; and (f) Grönkullan. Each line represents data from one analysis, and the grey shape represents the furthest extent of all data. The red lines are for magnetite in sulfide mineralisation, green lines for skarn, purple lines for quartz–garnet–pyroxene rocks, light blue lines for garnet–biotite rocks, black lines for magnetite-rich conglomerate, yellow lines for gedrite–albite rocks, dark blue lines for sericite–garnet–magnetite rocks, and orange lines for amphibolite. Data normalised to bulk upper continental crust (Rudnick and Gao, Reference Rudnick, Gao and Rudnick2003), diagram modified after Dare et al. (Reference Dare, Barnes, Beaudoin, Méric, Boutroy and Potvin-Doucet2014).

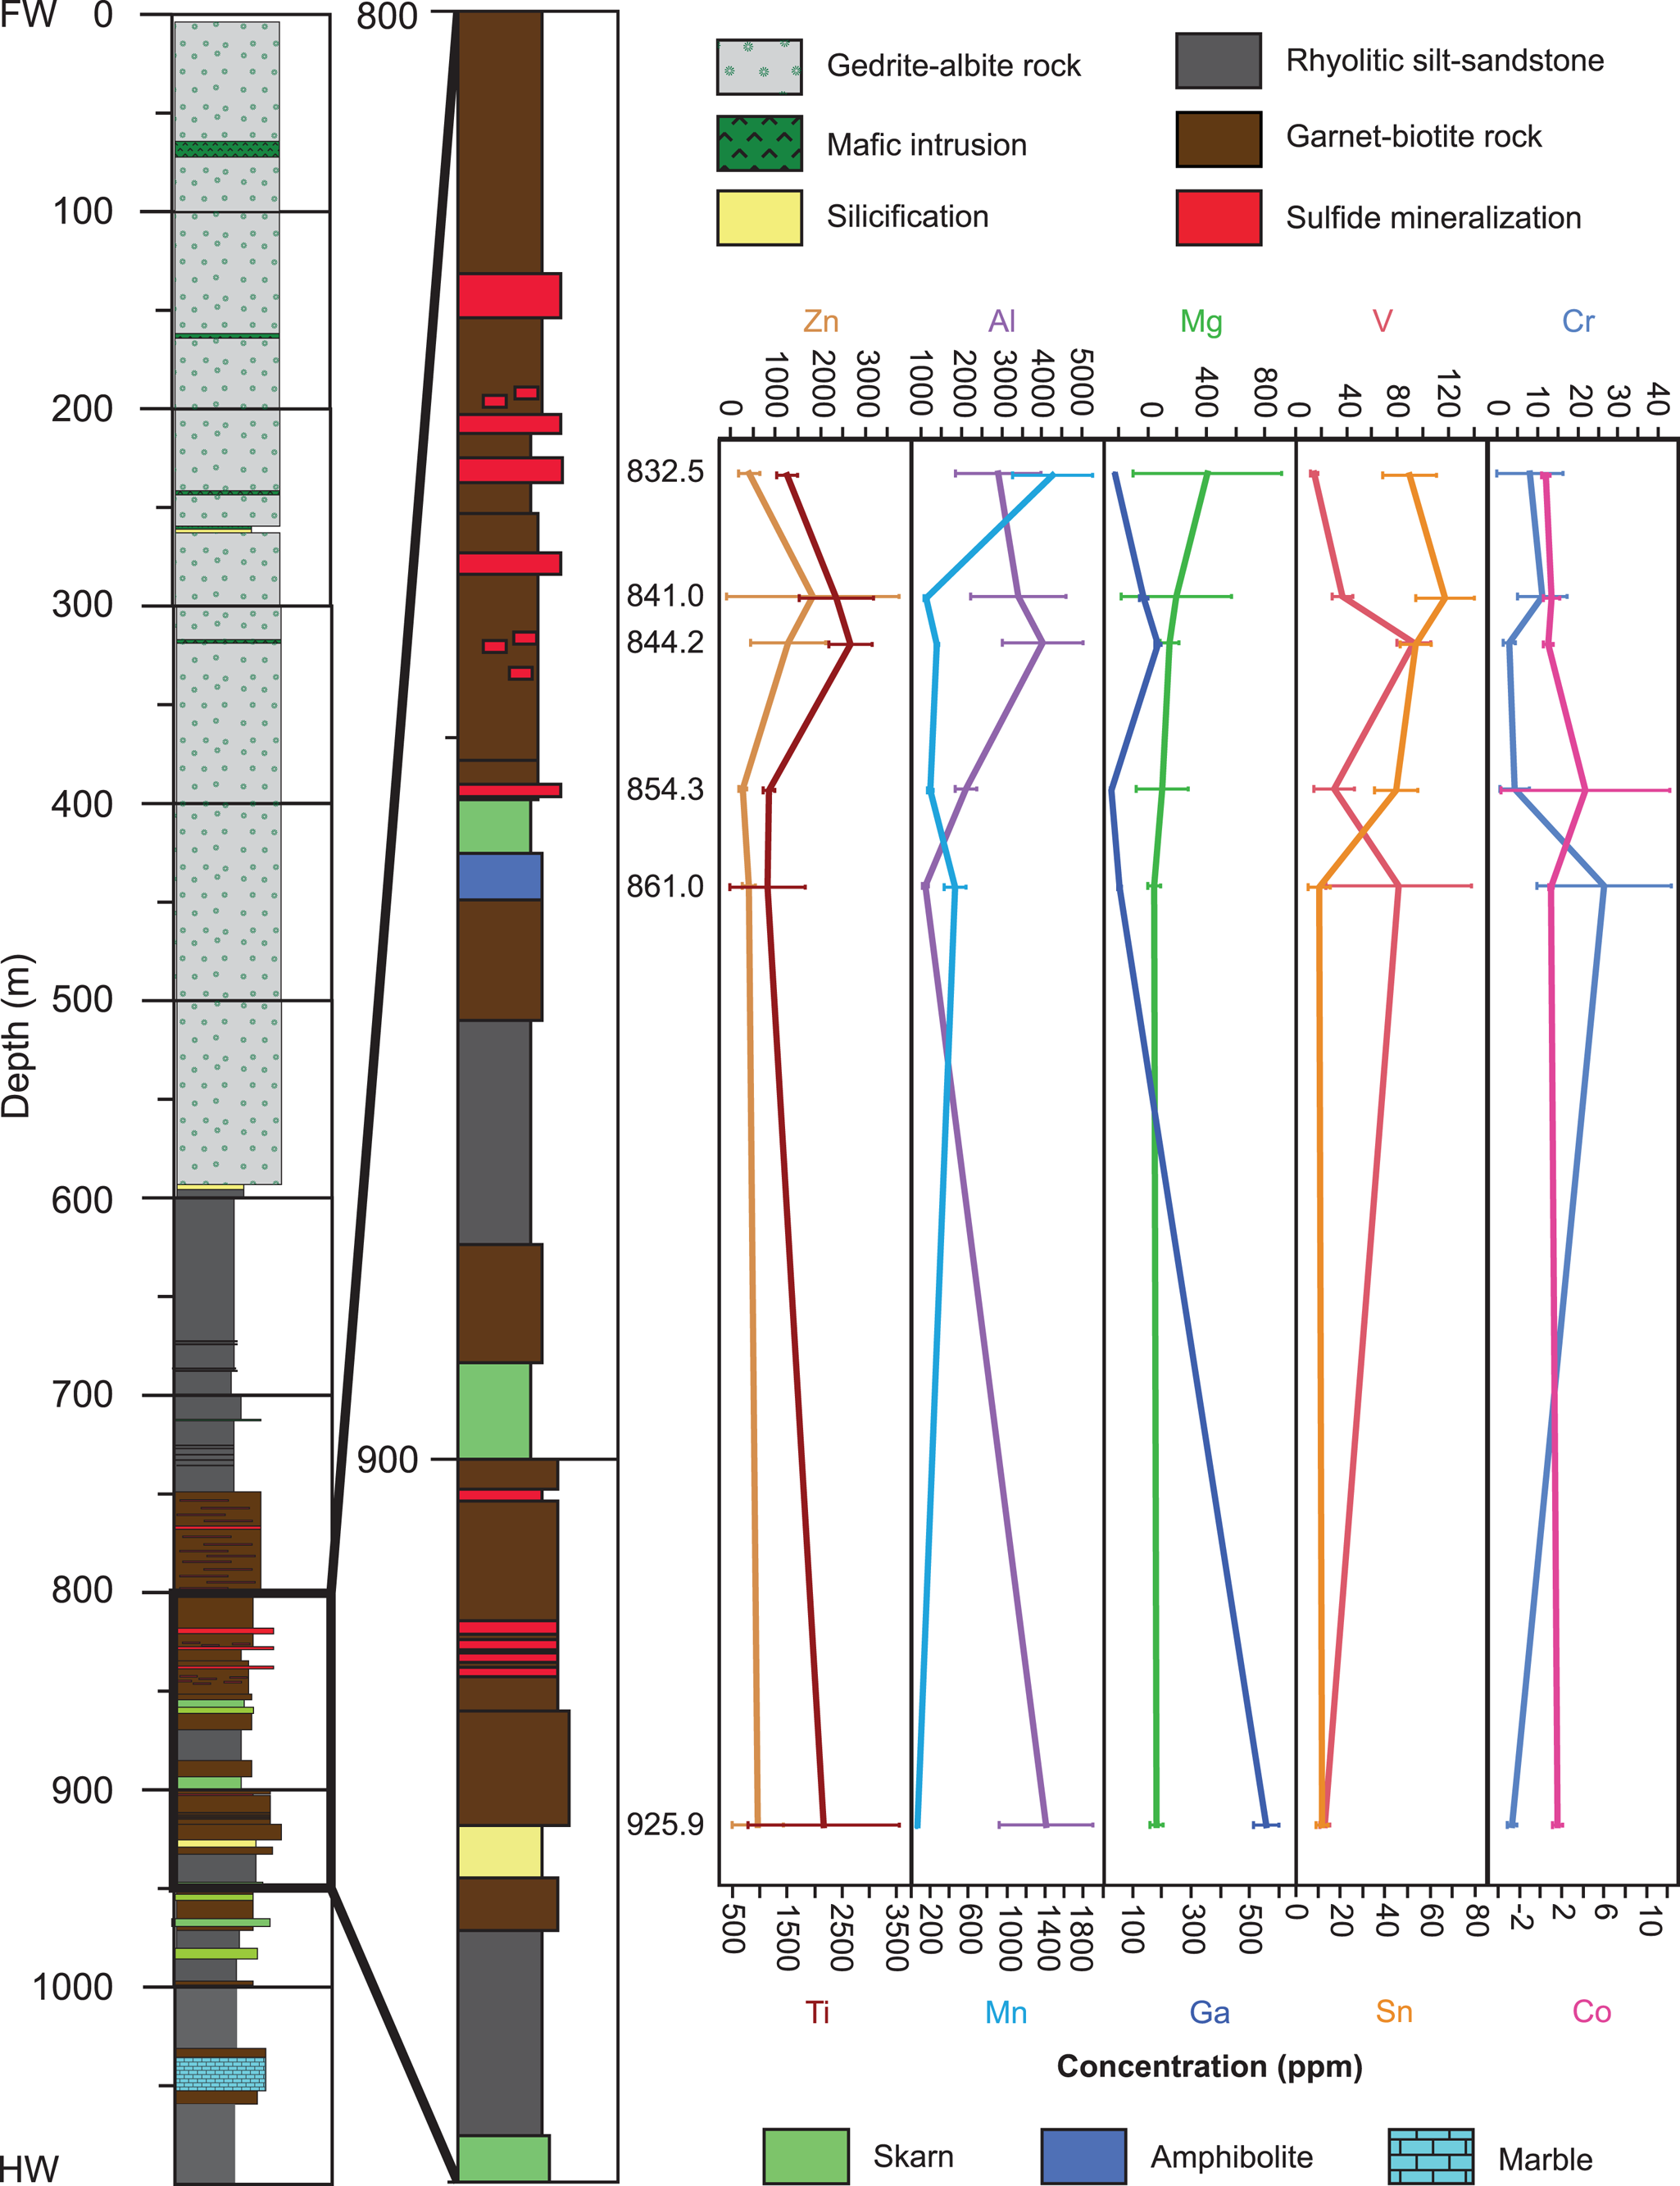
The relationship between magnetite composition and the composition of its host rock is further demonstrated in a downhole plot of ten trace elements (Mg, Ti, V, Cr, Co, Zn, Ga, Sn, Al and Mn) for magnetite in six samples (sulfide mineralisation, garnet–biotite rock and amphibolite) from 832.5 to 925.0 m in drill hole SSF26 from the Dammberget deposit (Fig. 10), element–element bivariate plots (Figs 3 and 4) and PCA (Fig. 6). Magnetite in amphibolite has low concentrations of many elements, with the exception of V and Cr, which are relatively enriched compared to the other rocks in drill hole SSF26. Box and whisker plots show that magnetite in marble at each location in the Stollberg area has different trace-element signatures (Fig. 11), notwithstanding the similar trace-element compositions of magnetite in samples of the Staren marble located up to 2 km apart from each other (see also Fig. 6c, Table 3). Magnetite in skarn at Gränsgruvan appears to be distinct from magnetite in skarn from other locations along the Stollberg ore trend in that it is more enriched in Mg, Ga, Mn and Ti. Magnetite in skarn from Gränsgruvan and Dammberget is also more enriched in Zn relative to magnetite in skarns elsewhere in the district. It should be noted here that samples of skarn collected from the Gränsgruvan deposit did not contain sulfides as the most recent drilling of this deposit did not target sulfide-bearing skarn, which is associated with other deposits in the Stollberg ore field. It is likely that skarn analysed here is probably skarn after dominantly felsic volcaniclastic rock. Whether this means that the distinct composition of magnetite from Gränsgruvan reflects differences in $f_{{\rm O}_ 2}$ and $f_{{\rm S}_ 2}$
 conditions relative to samples of skarns at other locations, which are associated spatially with sulfides, remains uncertain. The composition of magnetite in each of the altered rock types also probably reflects the composition of the unaltered precursor rock type.
Downhole variation of the mean value of Al, Co, Cr, Ga, Mg, Mn, Sn, Ti, V and Zn in magnetite from various rocks in drill core SSF26. Error bars represent 1 standard deviation from the mean.
Box and whisker plots comparing the concentrations (in ppm) of selected trace elements (a) Cr, (b) Co, (c) V, (d) Sn, (e) Mg, (f) Ga, (g) Al, (h) Mn, (i) Zn and (j) Ti in skarn-hosted magnetite from various locations in the Stollberg ore field. Northern Staren refers to drill core SSF16, and Central Staren refers to drill core SSF7. The edges of whiskers represent the 5th percentile (bottom) and 95th percentile values (top), the edges of the box represent the lower quartile and upper quartile (50th percentile), and the solid line across the box represents the median. Outliers are shown as disconnected points.

The application of discrimination diagrams to the composition of magnetite
Dupuis and Beaudoin (Reference Dupuis and Beaudoin2011) proposed a series of discrimination diagrams that can be used to distinguish the average trace-element compositions of magnetite between several deposit types (e.g. iron oxide–copper–gold (IOCG), skarn, banded iron formation, porphyry copper, magmatic nickel and magnetite apatite). They considered such diagrams as being useful as a means to identify the provenance of magnetite and to serve as a potential exploration guide to ore deposits, especially where magnetite is found in surficial sediments including glacial, soil, and alluvial sediments (e.g. Makvandi et al., Reference Makvandi, Beaudoin, Ghasemazadeh-Barvarz and McClenaghan2013, Reference Makvandi, Ghasemzadeh-Barvarz, Beaudoin, Grunsky, McClenaghan and Duchesne2016b; Pisiak et al., Reference Pisiak, Canil, Grondahl, Plouffe, Ferbey and Anderson2015). A plot of individual trace-element compositions of magnetite in sulfide mineralisation, skarn, amphibolite, magnetite-rich conglomerate, and garnet–biotite, gedrite–albite, sericite–garnet–magnetite and garnet–pyroxene rocks from the Stollberg ore field, as a function of Ca+Al+Mn vs. Ti+V, show that the composition of magnetite broadly overlaps the skarn field of Dupuis and Beaudoin (Reference Dupuis and Beaudoin2011, fig. 6, p. 328), although magnetite in some samples of sulfide mineralisation from Dammberget and BIF from Grönkullan plot in the porphyry field (Fig. 12a). When plotted in terms of Ni/(Cr+Mn) vs. Ti+V (Fig. 12b), magnetite compositions from the Stollberg ore field fall within the skarn field of Dupuis and Beaudoin (Reference Dupuis and Beaudoin2011, fig. 5, p. 327). However, the Ni/(Cr+Mn) values are less than those shown on fig. 5 of Dupuis and Beaudoin (Reference Dupuis and Beaudoin2011). Huang et al. (Reference Huang, Zhou, Qi, Gao and Wan2013) and Zhao and Zhou (Reference Zhao and Zhou2015) showed an almost identical range of magnetite compositions from the Cihai and Tengtie Fe skarns, respectively, to those reported here from Stollberg when Ni/(Cr+Mn) is plotted as a function of Ti+V. The lower Ni/(Cr+Mn) values may better represent the range for skarn deposits than proposed by Dupuis and Beaudoin (Reference Dupuis and Beaudoin2011). Note that where magnetite from these same samples is plotted as a function of Al/(Zn+Ca) vs. Cu/(Si+Ca), which Dupuis and Beaudoin (Reference Dupuis and Beaudoin2011; fig. 4, p. 327) used to discriminate magnetite in VMS deposits from other ore types, there is no overlap in the composition of magnetite from Stollberg with that from VMS deposits (Fig. 12c). This is because Cu, Si and Ca contents of magnetite from Stollberg commonly occur near or below detection limits. When Cu and Ca are above detection limits, Ca generally has a much higher concentration than Cu. The lack of overlap with VMS mineralisation is in keeping with a re-evaluation of the usefulness of this discrimination diagram by Bédard et al. (Reference Bédard, De Bronac de Vazelhes and Beaudoin2022) who showed in a study of magnetite compositions from 33 VMS deposits that 82% of the magnetite compositions fall outside of the VMS field.
Discrimination diagrams for magnetite from the Stollberg ore field in terms of (a) Ca+Al+Mn vs. Ti+V; (b) Ni/(Cr+Mn) vs. Ti+V; and (c) Al/(Zn+Ca) vs. Cu/(Si+Ca). Fields for various deposit types [skarn, porphyry, iron oxide-copper-gold (IOCG), banded iron formation (BIF), magmatic Fe–Ti oxide (Fe–Ti, V), Amargosa Fe oxide, Kiruna-type Fe, Opemiska Cu vein and volcanogenic massive sulfide (VMS)] are derived from Dupuis and Beaudoin (Reference Dupuis and Beaudoin2011). Note that the compositions of magnetite from the Stollberg ore field in (c) are distinct from those for magnetite in VMS deposits.

In a study of several porphyry Cu deposits in British Columbia, Pisiak et al. (Reference Pisiak, Canil, Grondahl, Plouffe, Ferbey and Anderson2015) showed that the composition of magnetite in igneous rocks could be distinguished from magnetite in hydrothermal deposits on the basis of Sn versus Ti. Regardless of the host rock of magnetite in the Stollberg ore field, nearly all magnetite plots within the hydrothermal field of Pisiak et al. (Reference Pisiak, Canil, Grondahl, Plouffe, Ferbey and Anderson2015), even though it is likely that the hydrothermal deposits they studied were derived from “higher temperature fluids”, using the terminology of Dare et al. (Reference Dare, Barnes, Beaudoin, Méric, Boutroy and Potvin-Doucet2014), whereas those in the Stollberg ore field were derived from lower temperature fluids (Fig. 13a). Pisiak et al. (Reference Pisiak, Canil, Grondahl, Plouffe, Ferbey and Anderson2015) questioned the use of the magmatic versus hydrothermal magnetite discrimination diagram of Dare et al. (2015) that plots the composition of magnetite as a function of Ti vs. Ni/Cr. As was shown by Pisiak et al. (Reference Pisiak, Canil, Grondahl, Plouffe, Ferbey and Anderson2015) and also shown here in Fig. 13b, the data fail to distinguish magmatic magnetite from hydrothermal magnetite, even though Dare et al. (Reference Dare, Barnes, Beaudoin, Méric, Boutroy and Potvin-Doucet2014) included the trace-element compositions of magnetite from high- and low-temperature hydrothermal deposits. Although the data set for magnetite from the Stollberg ore field includes compositions from all rock types analysed here, the discrimination diagrams clearly yield conflicting conclusions regarding the contribution of hydrothermal versus magmatic fluid. This is in a large part due to the variety of rock types that contain magnetite at Stollberg and the variable physicochemical conditions of the replacement deposits over the 5 km length of the Stollberg ore field. There is no evidence for a causative intrusion related to the formation of the magnetite-bearing rocks and it raises the question regarding the suitability of a plot involving Ti vs. Ni/Cr (Fig. 13a, b) as a discriminator between igneous and hydrothermal processes.
Igneous vs. hydrothermal magnetite discrimination diagrams based on concentrations of (a) Sn vs. Ti, modified after Pisiak et al. (Reference Pisiak, Canil, Grondahl, Plouffe, Ferbey and Anderson2015), and (b) Ti vs. Ni/Cr, modified after Dare et al. (Reference Dare, Barnes, Beaudoin, Méric, Boutroy and Potvin-Doucet2014). Whereas the composition of magnetite in the Stollberg ore field occurs predominantly in the hydrothermal field of (a) it drapes both igneous and hydrothermal fields in (b).

Implications for exploration
The presence of magnetite, distinctive PCA scores, and the elevated contents of some elements in magnetite from sulfides can be used potentially as a prospecting tool for sulfides in the Stollberg area. Previously, the trace-element geochemistry of magnetite has been used as a pathfinder to ore deposits in general by distinguishing the composition of magnetite in rocks associated with ore zones from those not associated spatially with ore (e.g. Dupuis and Beaudoin, Reference Dupuis and Beaudoin2011; Nadoll et al., Reference Nadoll, Angerer, Mauk, French and Walshe2014; Dare et al., 2015; Makvandi et al. Reference Makvandi, Ghasemzadeh-Barvarz, Beaudoin, Grunsky, McClenaghan and Duchesne2016b; Ward et al., Reference Ward, Holwell, Barry, Blanks and Graham2018). In the Stollberg ore field, magnetite occurs in either banded iron formation generally unrelated to sulfides, in altered rocks associated spatially with sulfide mineralisation, and in the Staren limestone. In these settings, the very presence of magnetite is a good indication of hydrothermal activity, as magnetite has not been reported in any igneous rocks in the Stollberg area except for rare magnetite in amphibolite. On that basis alone, regardless of its composition, magnetite should be considered a potential prospective tool for the identification of sulfide mineralisation. Of note, is that the current study focused on the carbonate-hosted replacement plus magnetite deposits associated spatially with the Stollberg marble and not the banded iron formation found stratigraphically below the Staren limestone.
Magnetite in sulfide mineralisation from Dammberget, Tvistbo and Grönkullan are characterised by PCA scores near the centre of the score plot with a slight distribution to the right (Fig. 6b), and by an overlap in the scatter plots for magnetite in sulfide and garnet–biotite rock from the Dammberget deposit. In addition, the PCA scores for magnetite in sulfides and garnet–biotite rocks from the Gränsgruvan deposit are essentially identical. Although the concentration of individual trace elements for magnetite in sulfides overlap with their concentrations in other rock types, magnetite in sulfides is characterised by being enriched in Mn, Sb and Mo relative to most other rocks. Economically important ore elements (Zn, Pb and Cu) are high in some analyses of magnetite in sulfides (the highest for Cu and Pb) in this investigation, however, in general, magnetite is no more enriched than in other rock types. The highest individual Zn concentration (up to 3270 ppm) is from magnetite in skarn from the Dammberget deposit.
To evaluate whether magnetite that occurs in alluvial sediments or soils in the Stollberg area is derived from the various types of magnetite-bearing rocks would also require a detailed study of the composition of magnetite from the banded iron formation, which was not a focus of the present study, even though magnetite in two samples of iron formation from Grönkullan were analysed. These two samples, Stol 13 and Stol 14B, are from skarn in the iron formation and from a small mass of sulfides within the iron formation, respectively. Notably, magnetite in skarn from Grönkullan contains the lowest median values of Al (66.8 ppm), and among the lowest Ti (83.3 ppm), Cr (5.47 ppm), Co (0.48 ppm) and Ga (6.15 ppm) contents of any sample in the Stollberg area. However, the sample of magnetite in sulfides has trace-element concentrations that cannot be distinguished from sulfide mineralisation associated with the Stollberg marble. Further trace-element studies of magnetite in iron formation need to be conducted.
Conclusions
Sulfide deposits in the Stollberg ore field are products of sub-seafloor replacement of carbonate and have physical characteristics that superficially resemble both skarn and metamorphosed VMS deposits. The compositions of magnetite from the ore field when plotted in terms of Ca+Al+Mn vs. Ti+V, and Ni/(Cr+Mn) vs. Ti+V more closely resemble those of magnetite associated with skarns elsewhere (particularly Fe skarns) rather than with VMS deposits. Moreover, normalised trace-element variation patterns of magnetite composition, using data from Dare et al. (Reference Dare, Barnes, Beaudoin, Méric, Boutroy and Potvin-Doucet2014), Makvandi et al. (Reference Makvandi, Beaudoin, Ghasemazadeh-Barvarz and McClenaghan2013), and Zhao and Zhou (2014), indicate that magnetite from Stollberg has patterns more similar to magnetite from a Mg skarn and the Vegas Peledas, Dongyuan and Tengtie Fe skarns than the metamorphosed Izok Lake VMS deposit.
Discrimination plots using the composition of magnetite to distinguish between a magmatic versus hydrothermal contribution to the ore fluid yield conflicting results, although a plot of Sn versus Ti is consistent with a hydrothermal ore-bearing fluid.
Data obtained here and from other skarn deposits in the literature suggest that the ‘skarn field’ in the plot of Ni/(Cr+Mn) vs. Ti+V occurs at Ni/(Cr+Mn) between 0.0001 and 0.1 and over a wide range of Ti+V concentrations (~0.01 to 5). These broad ranges of compositions reinforce the previously held view that there are a variety of physicochemical conditions that control the compositions of magnetite and that the use of such discrimination diagrams as a way to identify the type of deposit from which the magnetite occurs in must be treated with caution.
Trace-element variation diagrams show that magnetite in various rocks associated with the Stollberg ore field have similar patterns, supportive of magnetite formation from hydrothermal fluids that interacted with their host rocks under conditions of a high fluid to rock ratio. The relative importance of the effects of bulk rock versus fluid composition on the trace-element concentrations of magnetite are unknown though both parameters appear to be factors.
The composition of magnetite has been used in the past as an indicator of provenance and as an exploration guide to various types of ore deposits. The presence of magnetite in the Stollberg ore field is a good indicator of hydrothermal activity. Principal component analysis indicates that the composition of magnetite from the iron formation at Grönkullan can be distinguished from the composition of magnetite in the Stollberg ore trend on the basis of Al, Ti, Cr, Co and Ga concentrations. The identification of PCA scores similar to those identified here for magnetite in sulfide mineralisation and garnet–biotite rock, together with with elevated Mn, Sb, Mo, Cu, Pb and Zn, appear to have the greatest promise as indicators to base-metal mineralisation in the Stollberg ore field.
Acknowledgements
Boliden Mineral AB is thanked for supporting this project financially. KF received a Society of Economic Geologists Graduate Student Fellowship in support of her research. We also thank Anette von der Handt for assistance with electron microprobe analyses, and Carl Jacobson for his comments on an earlier draft of this paper. Justin Glenn assisted with drafting. Georges Beaudoin and Sheida Makvandi are kindly thanked for sharing their ideas on magnetite geochemistry. Reviews by W.D. Smith, an anonymous reviewer, and Associate Editor, David Good, greatly improved the quality of the manuscript.
Supplementary material
To view supplementary material for this article, please visit https://doi.org/10.1180/mgm.2022.39


 Open access