


Introduction
Late-life depression (LLD), depression diagnosed in older adults, affects approximately five million older adults over the age of 65 years (Zivin, Wharton, & Rostant, Reference Zivin, Wharton and Rostant2013). LLD is associated with severe health outcomes, including a high risk of mortality, cognitive deficits, and poor quality of life (Wei et al., Reference Wei, Ying, Xie, Chandrasekar, Lu, Wang and Li2019). Compared to regular major depressive disorder (MDD), cognitive deficits in LLD persist despite clinical recovery or psychopathological remission (Riddle et al., Reference Riddle, Potter, McQuoid, Steffens, Beyer and Taylor2017); moreover, there is a decrease in the threshold of dementia due to underlying neurological and biomolecular abnormalities (Kuo, Lin, & Lane, Reference Kuo, Lin and Lane2021; Ly et al., Reference Ly, Karim, Becker, Lopez, Anderson, Aizenstein and Butters2021). Therefore, the timely and accurate diagnosis of LLD is important for public health.
LLD is often underdiagnosed or misdiagnosed as mild cognitive impairment (MCI) (Devita et al., Reference Devita, De Salvo, Ravelli, De Rui, Coin, Sergi and Mapelli2022), a neurodegenerative disease characterized by memory impairment (Petersen & Negash, Reference Petersen and Negash2008) with a morbidity rate of over 15.56% in older adults (Bai et al., Reference Bai, Chen, Cai, Zhang, Su, Cheung and Xiang2022). Both conditions commonly coexist (Ismail et al., Reference Ismail, Elbayoumi, Fischer, Hogan, Millikin, Schweizer and Fiest2017), LLD and MCI also share entwined neurodegenerative symptoms in cognition, such as memory impairment and execution deficits (Mukku et al., Reference Mukku, Dahale, Muniswamy, Muliyala, Sivakumar and Varghese2021; Panza et al., Reference Panza, Solfrizzi, Sardone, Dibello, Castellana, Zupo and Lozupone2023). Population-based research has shown that both disorders are at least predisposing (Hu et al., Reference Hu, Shu, Wu, Chen, Hu, Zhang and Feng2020) and aggravating (Cooper, Sommerlad, Lyketsos, & Livingston, Reference Cooper, Sommerlad, Lyketsos and Livingston2015) factors of each other. Some scientists even assume that there might be an LLD-MCI-dementia continuum in which depressive symptoms act as an early manifestation rather than a risk factor (Invernizzi, Simoes Loureiro, Kandana Arachchige, & Lefebvre, Reference Invernizzi, Simoes Loureiro, Kandana Arachchige and Lefebvre2021). However, given the differences in prognosis and treatment (Association, 2013; Sperling et al., Reference Sperling, Aisen, Beckett, Bennett, Craft, Fagan and Phelps2011), it is crucial to avoid misdiagnoses. The application of gray matter (GM) analysis (Minkova et al., Reference Minkova, Habich, Peter, Kaller, Eickhoff and Kloppel2017) combined with co-localized phenotypic traits, transcriptomic signatures, and genetic features are valuable tools for conceptualizing and studying the etiological basis of these disorders (Bao et al., Reference Bao, Wen, Wen, Yang, Cui, Yang and Shen2023; Verheijen & Sleegers, Reference Verheijen and Sleegers2018).
Previous studies have comprehensively enhanced our understandings of LLD and MCI separately, revealing GM volume reduction in frontostriatal-limbic regions in LLD (Agudelo, Aizenstein, Karp, & Reynolds, Reference Agudelo, Aizenstein, Karp and Reynolds2015) and the wide-spread GM atrophy in MCI involving the hippocampus and parahippocampal gyrus (Chen et al., Reference Chen, Xu, Xue, Hu, Ma, Qi and Chen2020). Zackova, Jani, Brazdil, Nikolova, and Mareckova (Reference Zackova, Jani, Brazdil, Nikolova and Mareckova2021) further explored the GM correlations between MDD and MCI, entailing shared volumetric reductions in the insula and superior temporal gyrus with other disease-specific structural changes. However, comparative studies between the two prevalent senile diseases are limited, hindering the clear distinction and early intervention in older adults. Additionally, to bridge the gap between structural findings and transcriptome (Fornito, Arnatkeviciute, & Fulcher, Reference Fornito, Arnatkeviciute and Fulcher2019), which could indicate potential diagnostic and therapeutic targets, it is necessary to conduct studies on neuroimaging-associated neurotransmitters (Aquilani et al., Reference Aquilani, Cotta Ramusino, Maestri, Iadarola, Boselli, Perini and Verri2023; Jacobs, Baider, Goldzweig, Sapir, & Rottenberg, Reference Jacobs, Baider, Goldzweig, Sapir and Rottenberg2023) and gene expression (Cai et al., Reference Cai, Huang, Yang, Wang, Wu, Wang and Huang2021; Liu, Abdellaoui, Verweij, & van Wingen, Reference Liu, Abdellaoui, Verweij and van Wingen2023), especially on neuronal processes such as synaptic transmission, anabolic, and biosynthetic pathways. Therefore, based on comparative changes in GM volume between MCI and LLD, we conducted further research into neuroimaging-associated neurotransmitters and transcriptomics.
To accurately and promptly differentiate between LLD and MCI in clinical practice, we performed a meta-analysis to examine the represented profiles in structure and gene expression. First, previous VBM studies were integrated for GM atrophy patterns and spatially correlated behavioral/disease profiles. Second, we identified the common and distinct GM volumetric changing patterns. Finally, based on the anatomical results, we decoded the associated neurotransmitter systems and gene expression profiles.
Methods
Literature search and selection
Our meta-analysis was conducted following the Preferred Reporting Items for Systematic Reviews and Meta-analyses (PRISMA) guidelines (Page et al., Reference Page, McKenzie, Bossuyt, Boutron, Hoffmann, Mulrow and Moher2021). We systematically searched the PubMed and Web of Science databases from inception to 31st December 2023, to identify VBM studies on GM changes in LLD and MCI. The search strategy for LLD was (elder OR geriatric OR [late life] OR [late onset] OR older OR [old age]) AND depress* AND ([voxel-based morphometry] OR VBM). The search strategy for MCI was ([mild cognitive impairment] OR MCI) AND ([voxel-based morphometry] OR VBM).
The studies included in this meta-analysis were required for (i) original peer-reviewed studies; (ii) quantitative automated whole-brain GM assessment performed using VBM; (iii) comparison of the experimental group (i.e. MCI or LLD patients) to a matched healthy control (HC) group; (iv) provision of results as coordinates of activation foci in stereotactic space, either Montreal Neurological Institute (MNI) or Talairach reference space; and (v) selection of participants according to internationally recognized diagnostic criteria. In contrast, we excluded studies with (i) case reports; (ii) solely region-of-interest (ROI) analysis; (iii) only functional magnetic resonance imaging (fMRI), positron emission tomography (PET), electrophysiology; (iv) other psychiatric or neurological disorders, such as AD, vascular MCI (vMCI); (v) comorbidity with any other neurological or neurodegenerative diseases, such as Parkinson's disease (PD), multiple sclerosis (MS); and (vi) substantially overlapping patient populations with other studies. All the diagnoses of depression relied on DSM, and all the diagnoses of MCI also relied on DSM or reliable clinical criteria from Petersen et al. (Reference Petersen, Doody, Kurz, Mohs, Morris, Rabins and Winblad2001) or the National Institute on Aging and Alzheimer's Association (NIA-AA). Detailed diagnostic tools and criteria are shown in online Supplementary Tables S1 and S2. In LLD studies, although ‘late-life’ is generally defined as 65 years or older, various LLD/MDD cut-offs (commonly ranging from 50 to 75 years) are currently acceptable in research (Baba et al., Reference Baba, Kito, Nukariya, Takeshima, Fujise and Iga2022). In MCI studies, a cut-off age is not part of the diagnostic criteria and therefore barely used in studies, but the overall prevalence has been estimated to be in the 12 to 18% range in persons over 60 years (Petersen, Reference Petersen2016). In our study, the mean age of LLDs was 69.97 and the mean age of MCIs was 71.57, which was acceptable for old age in literature on this topic.
To measure the quality of studies we included in the meta-analysis in consideration of reliability, we assessed the quality of each using the Newcastle-Ottawa scale (NOS) (Stang, Reference Stang2010), included those with good (9–8) or moderate (7–5) quality, and excluded those with poor quality (4–0). In terms of comparability, we only included those studies with age-matched participants. The use of matched gender or education was not deemed necessary; however, we allotted one more score for matched studies. We did not consider handedness.
Initially, 775 MCI studies and 92 LLD studies were found during the systematic search. After carefully screening the studies according to their abstracts and full texts, we retained those studies that met the inclusion criteria. Among these, five MCI studies (Du et al., Reference Du, Yan, Zhao, Fang, Qiu, Wei and Li2022; Gupta, Kim, Kim, & Kwon, Reference Gupta, Kim, Kim and Kwon2020; Huang et al., Reference Huang, Zheng, Yang, Wu, Li, Qiu and Wu2023; van de Mortel, Thomas, van Wingen, & Alzheimer's Disease Neuroimaging, Reference van de Mortel, Thomas and van Wingen2021; Xiong et al., Reference Xiong, Ye, Sun, Chen, Zhong, Zhang and Huang2023) obtained data from the Alzheimer's Disease Neuroimaging Initiative (ADNI) database (http://adni.loni.usc.edu) and two LLD studies (Harada et al., Reference Harada, Matsuo, Nakashima, Hobara, Higuchi, Higuchi and Watanabe2016, Reference Harada, Ikuta, Nakashima, Watanuki, Hirotsu, Matsubara and Matsuo2018) comprised participants that overlapped according to the author. We only retained studies with the largest group size for the meta-analysis. Regarding longitudinal studies, only data collected at baseline was utilized. We included and recorded studies that reported different subtypes, such as early/late MCI and AD converter/non-converter, as different datasets. We excluded the datasets of non-amnestic mild cognitive impairment (naMCI) when it was divided from amnestic mild cognitive impairment (aMCI) in consideration of consistency and specificity. This is because aMCI was closer to the earlier concept of MCI prior to updates (Petersen et al., Reference Petersen, Caracciolo, Brayne, Gauthier, Jelic and Fratiglioni2014); moreover, it has more distinct structural and cognitive patterns compared to heterogeneous naMCI (Du, Dang, Chen, Chen, & Zhang, Reference Du, Dang, Chen, Chen and Zhang2023; Qin et al., Reference Qin, Li, Luo, Ye, Luo, Chen and Xu2022), whose higher risk of progressing to AD makes it the focus in research concerning LLD-MCI-dementia continuum (Invernizzi et al., Reference Invernizzi, Simoes Loureiro, Kandana Arachchige and Lefebvre2021).
Finally, we investigated 50 MCI studies with 55 datasets (1878 patients, 2046 HCs) and 13 LLD studies with 13 datasets (414 patients, 350 HCs). All of them were eligible for meta-analysis (NOS ⩾ 5), in which ten MCI datasets and two LLD datasets were classified as having good quality (NOS ⩾ 8) according to NOS (online Supplementary Tables S1 and S2). The detailed process of inclusion and exclusion is shown in the flow diagram in Fig. 1.
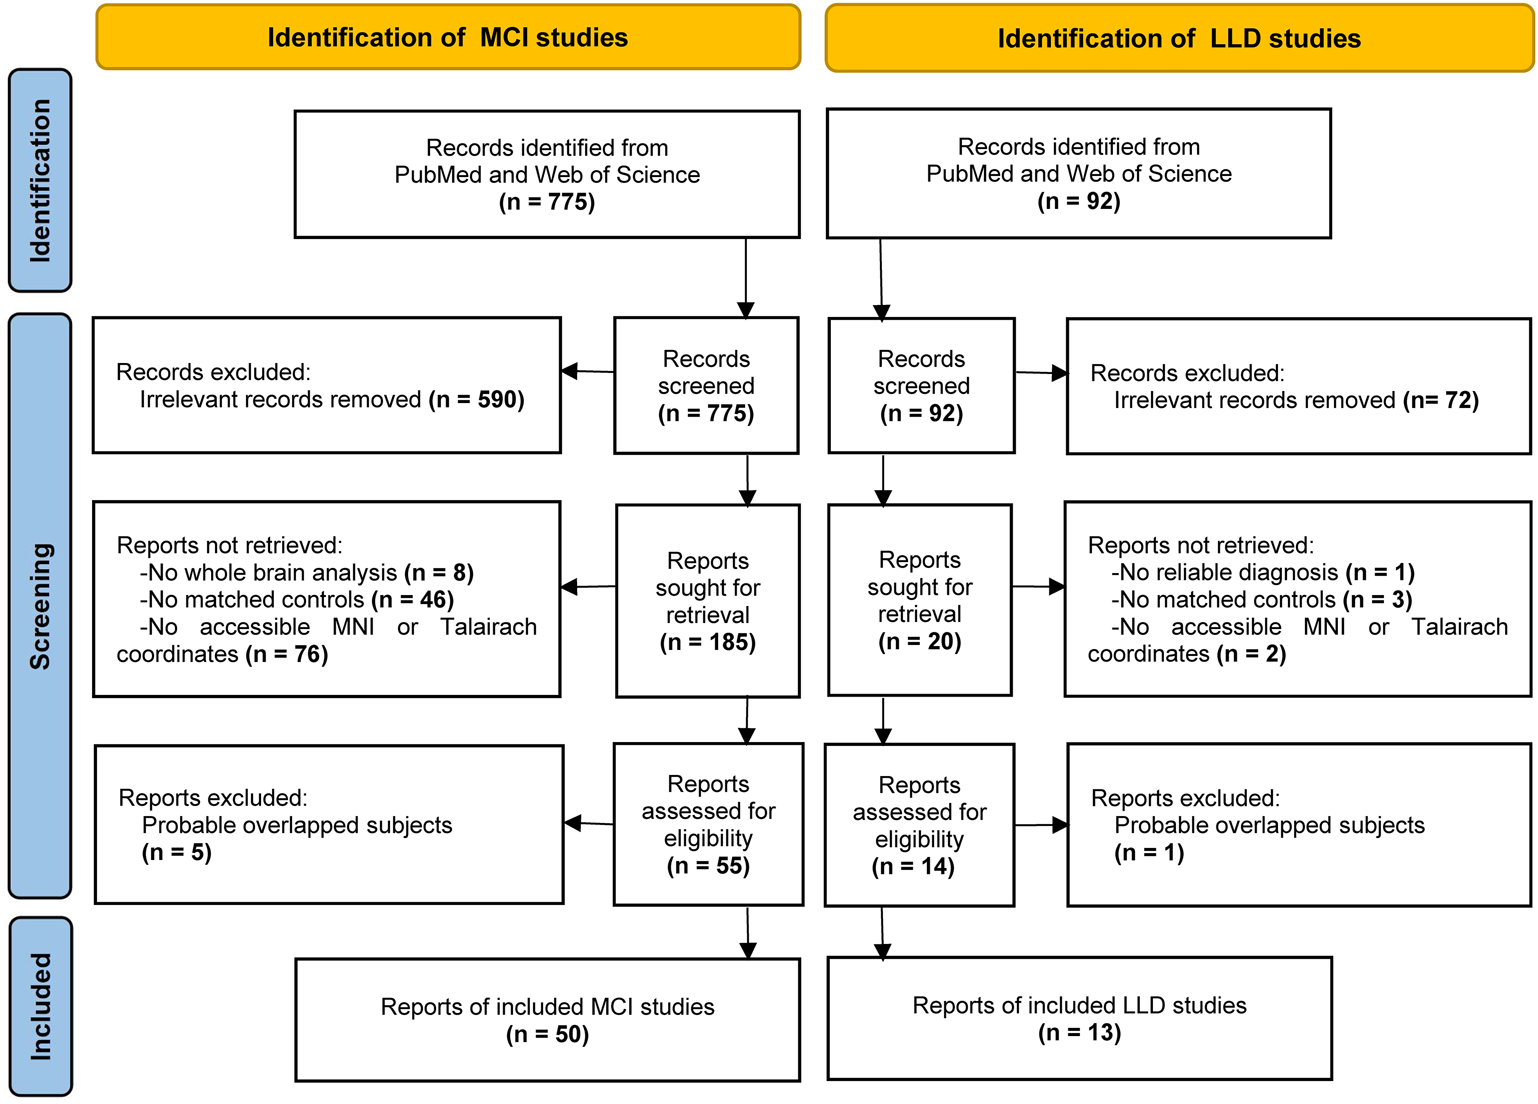
Figure 1. Flow diagram of inclusion and exclusion process of MCI (left) and LLD (right) studies.
Coordinate-based analysis
A voxel-based meta-analysis of neuroimaging studies was conducted using seed-based d Mapping (formerly Signed Differential Mapping) with Permutation of Subject Images (SDM-PSI) software for Windows 64 bits (www.sdmproject.com/). The voxel-based meta-analytic methods benefit from a more exhaustive and unbiased inclusion of studies (Muller et al., Reference Muller, Cieslik, Laird, Fox, Radua, Mataix-Cols and Eickhoff2018; Radua & Mataix-Cols, Reference Radua and Mataix-Cols2012). SDM-PSI has been proven to be a conservative method that increases the statistical power when there are multiple effects, and is distinct from other current meta-analyses methods due to the use of effect sizes, random-effects models, Freedman-Lane-based permutations, and threshold-free cluster enhancement (TFCE) statistics (Albajes-Eizagirre, Solanes, Vieta, & Radua, Reference Albajes-Eizagirre, Solanes, Vieta and Radua2019). To optimally balance sensitivity and specificity (Albajes-Eizagirre et al., Reference Albajes-Eizagirre, Solanes, Vieta and Radua2019), the parameters were set using the modality of VBM-GM (anisotropy = 1, isotropic FWHM = 20 mm, mask = gray matter, voxel = 2 mm) and the default SDM threshold (p < 0.05 with peak Z > 1 and a cluster extent >10 voxels). To validate the significant clusters, we derived heterogeneity analysis using I2 statistics and assessed publication bias by conducting Egger's test and generating funnel plots. I2 < 50% was considered low heterogeneity (Higgins, Thompson, Deeks, & Altman, Reference Higgins, Thompson, Deeks and Altman2003). Egger-p > 0.05 and visually symmetric funnel plots indicate non-significant publication bias.
We recorded each article's peak coordinates and corresponding statistics (t, z, or p values), with their software packages, stereotactic spaces, and threshold according to the SDM tutorial. First, we separately investigated the GM alteration within each group (LLD v. HC or MCI v. HC). Second, we detected regions with common GM atrophy by conducting Multimodal analysis (Radua, Romeo, Mataix-Cols, & Fusar-Poli, Reference Radua, Romeo, Mataix-Cols and Fusar-Poli2013) and compared the discrepant GM atrophy by conducting Linear model analysis (Radua, van den Heuvel, Surguladze, & Mataix-Cols, Reference Radua, van den Heuvel, Surguladze and Mataix-Cols2010). Third, the p values maps were used for further investigation.
Behavioral and disease decoding
Data taken from the BrainMap database (http://www.brainmap.org/), which documents over 20 years of published functional brain imaging studies, was used to separately decode the structural changes in behavior and disease. Behavioral profiles span action, cognition, emotion, interoception, and perception, while disease profiles were generalized from neurological disorders according to the International Classification of Diseases (ICD). Multi-image Analysis GUI (Mango) (https://mangoviewer.com) was used to compute and compare the fraction of coordinates falling within the ROI with the fraction uniformly distributed (Lancaster et al., Reference Lancaster, Cykowski, McKay, Kochunov, Fox, Rogers and Mazziotta2010, Reference Lancaster, McKay, Cykowski, Martinez, Tan, Valaparla and Fox2011). Behavioral or disease association is indicated when the difference between these fractions is significant (Z score ⩾ 3.0), viz Bonferroni corrected to an overall p value of 0.05 for all behavior sub-domains (Lancaster et al., Reference Lancaster, Laird, Eickhoff, Martinez, Fox and Fox2012).
Spatial correlation of receptor/transporter
JuSpace (https://github.com/juryxy/JuSpace) was used to quantify the co-localization between disease and altered expression of respective neurotransmitter systems based on the topographical relationship. Unthresholded meta-analysis maps testing for regions showing and those not showing convergence in the meta-analyses were used for Pearman's rank partial correlation analysis with default settings (controlling for partial volume effects and spatial autocorrelation using underlying gray matter probability) (Dukart et al., Reference Dukart, Holiga, Rullmann, Lanzenberger, Hawkins, Mehta and Eickhoff2021). We included receptor maps covering cholinergic, dopaminergic, GABAergic, glutamatergic, noradrenergic, opioidergic, and serotonergic neurotransmission. Receptor maps showing a significant association with respective brain maps of reduced GM volume entered multiple linear regression analyses to test for specificity. Statistical significance was set at p < 0.05 (FWE rate corrected) to control the rate of false positives in multiple comparisons (Glickman, Rao, & Schultz, Reference Glickman, Rao and Schultz2014).
Transcription-neuroimaging association
The microarray-based gene expression data were acquired from the Allen Human Brain Atlas (AHBA) database (Hawrylycz et al., Reference Hawrylycz, Miller, Menon, Feng, Dolbeare, Guillozet-Bongaarts and Lein2015). The gene expression data and Z-map of LLD and MCI were preprocessed through a recommended pipeline (Arnatkeviciute, Fulcher, & Fornito, Reference Arnatkeviciute, Fulcher and Fornito2019; Glasser et al., Reference Glasser, Coalson, Robinson, Hacker, Harwell, Yacoub and Van Essen2016), with further details provided in the online Supplementary Methods.
Partial least squares (PLS) regression (Abdi & Williams, Reference Abdi and Williams2013) was employed to identify the transcriptional profiles associated with abnormal GM volume in LLD and MCI. The PLS components were ranked based on the variance explained between the independent variable (gene expression matrix) and dependent variable (case–control t vector). A spatial autocorrelation (SA) corrected permutation test was adopted to examine whether the R2 of the PLS component was significantly greater than that expected by chance. For each significant component, the bootstrapping method was used to correct estimation errors and rank the contribution of the weight of each gene. We ranked these genes descending by their corrected weight in significant PLS components. GOrilla (http://cbl-gorilla.cs.technion.ac.il/) was used for gene enrichment analysis, which identified enriched GeneOntology (GO) terms (Eden, Navon, Steinfeld, Lipson, & Yakhini, Reference Eden, Navon, Steinfeld, Lipson and Yakhini2009). All ontology categories were considered, including biological process, molecular function, and cellular components. Significant enrichment was set to Benjamini-Hochberg false discovery rate (FDR)-corrected q < 0.05 (Xia et al., Reference Xia, Liu, Mechelli, Sun, Ma, Wang and He2022).
Results
Decoding GM alteration in LLD
We investigated 13 datasets on LLD (414 patients, 350 HCs). Basic information, diagnostic tools and quality assessment for each study, along with detailed demographic and clinical characteristics, are shown in online Supplementary Table S1. We gained a holistically balanced demographic profile by including only studies with participants of similar ages, alongside accounting for gender and education when evaluating study quality, which facilitates a comprehensive and credible neurobiological insight across the entire elderly population. Compared to HCs, patients with LLD showed a decrease in GM volume in the right gyrus rectus, left middle temporal gyrus, left inferior frontal gyrus (orbital part), right anterior thalamic projections, left anterior cingulate/paracingulate gyri, right insula, right median cingulate/paracingulate gyri, left insula, and left middle temporal gyrus (Fig. 2a, online Supplementary Table S3). No regions with increased GM volumes were observed. Heterogeneity analysis using I 2 statistics (1.60–35.04%) showed no significant variability between studies, and quantitative assessment of Egger's test (p = 0.339–0.928) showed no publication bias in all significant brain regions.
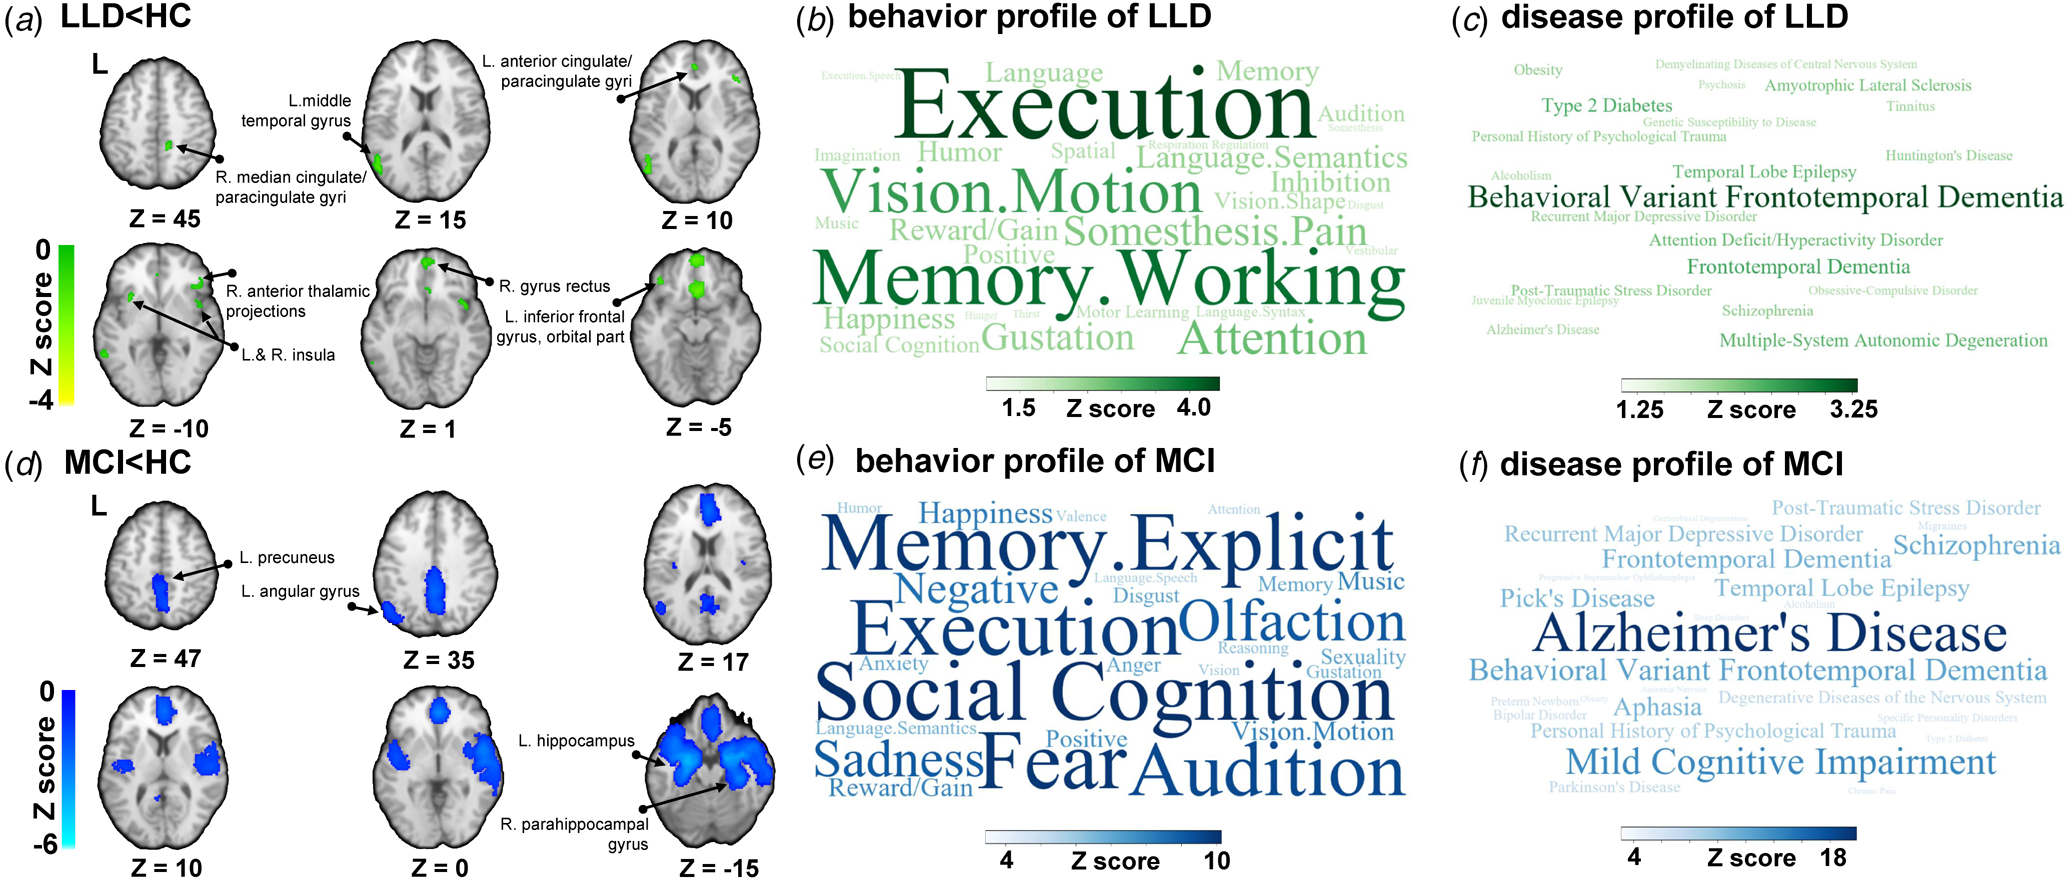
Figure 2. Regions with GM atrophy in LLD/MCI and their related behavioral/disease profiles. (a) Regions of GM volume decreases in LLDs compared to HCs; (b) Behavior profile of LLD related to GM atrophy; (c) Disease profile of LLD related to GM atrophy; (d) Regions of GM volume decreases in MCIs compared to HCs; (e) Behavior profile of MCI related to GM atrophy; (f) disease profile of MCI related to GM atrophy. (GM, gray matter; LLD, late-life depression; MCI, mild cognitive impairment; HC, healthy controls; Voxel-wise threshold p < 0.05 uncorrected; minimum cluster extent 10 voxels.).
Regarding behavioral analysis, the obtained meta-analysis map of LLD corresponds to executive function (Z = 4.44), working memory (Z = 3.80), and motion vision (visual perception that receives motor-related input) (Z = 3.03) (Fig. 2b). Regarding disease analysis, we found behavioral variant frontotemporal dementia (bvFTD) (Z = 3.30) to be the most relevant disease (Fig. 2c).
Decoding GM alteration in MCI
We investigated 55 datasets on MCI (1878 patients, 2046 HCs). Detailed information, diagnostic tools and quality assessment for each study, as well as the summarized demographic and clinical characteristics are shown in online Supplementary Table S2 in the Supplementary. The well-matched qualified literature included allowed for a more comprehensive and credible neurobiological evaluation whithin the population. We noticed that, compared to HCs, patients with MCI showed decreased GM volume in the right parahippocampal gyrus, left hippocampus, left precuneus, and left angular gyrus (Fig. 2d, online Supplementary Table S3). No region with an increased GM volume was observed. Heterogeneity analysis using I 2 statistics showed no variability in the regions of the left hippocampus (5.96%) and left precuneus (0.21%) between the studies, while there was variability in the regions of the right parahippocampal gyrus and left angular gyrus. A quantitative assessment of Egger's test (p = 0.181–0.967) showed no publication bias in all significant brain regions.
Behavioral analysis (Fig. 2e) revealed that the obtained meta-analysis map of MCI significantly correspond to functions in varied domains, including social cognition (Z = 10.14), fear (Z = 9.36), explicit memory (Z = 9.83), and executive function (Z = 9.63). Regarding disease analysis (Fig. 2f), a large number of diseases were found to be related, including AD (Z = 19.90), MCI (Z = 13.28), bvFTD (Z = 10.881), schizophrenia (Z = 10.113), and frontotemporal Dementia (Z = 9.629).
Comparison of GM atrophy and spatially correlated receptor/transporter densities
Conjunction analyses showed that the right median cingulate/paracingulate gyri and the right insula exhibited significant reduced GM volume in both LLD and MCI (Fig. 3a, online Supplementary Table S4). We separately tested the heterogeneity of the regions above in the LLD v. HCs group and the MCI v. HCs group. No significant corresponding features were found in behavioral/disease analysis (Z < 3). Regression analysis was used to compare LLDs and MCIs, where MCI showed more significant reductions in GM volume in the left hippocampus and right parahippocampal gyrus (Fig. 3b, online Supplementary Table S5). We found that atrophic regions specific to MCI corresponded to explicit memory (Z = 3.45) in behavioral analysis and were related to AD (Z = 4.30) in disease analysis.
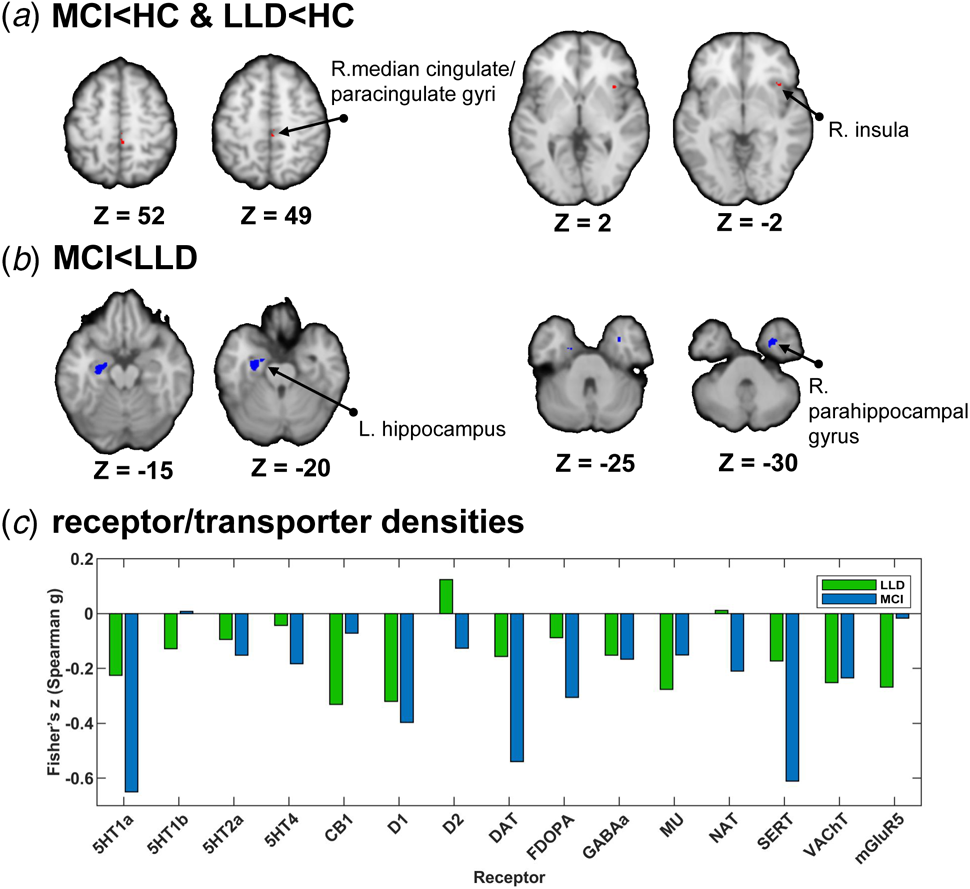
Figure 3. Comparison of GM-atrophic regions in LLD and MCI and their spatial-correlated neurotransmitter densities. (a) Shared regions with GM volume decrease in LLD and MCI; (b) Specific regions with GM atrophy in MCI in preference to LLD; (c) Receptor/transporter densities colocalized with different GM-atrophic regions in LLD and MCI. (GM, gray matter volume; LLD, late-life depression; MCI, mild cognitive impairment; HC, healthy controls; Voxel-wise threshold p < 0.05 uncorrected; minimum cluster extent 10 voxels; p < 0.0025 for conjunction meta-analysis; * p < 0.05).
JuSpace was used to link the neuroimage to neurotransmitter information, which included receptor/transporter maps covering cholinergic, dopaminergic, GABAergic, glutamatergic, noradrenergic, opioidergic, and serotonergic neurotransmission (Fig. 3c). In LLD, the neurotransmitters that were significantly correlated were CB1 (Fisher'z = −0.331, p = 0.023) at opioidergic synapses, D1 (Fisher'z = −0.320, p < 0.001) at dopaminergic synapses, VAChT (Fisher'z = −0.252, p = 0.007) at cholinergic synapses, and mGluR5 (Fisher'z = −0.268, p = 0.043) at glutamatergic synapses. In MCI, we found that GM morphological abnormalities were significantly correlated within 5-HT1A (Fisher'z = −0.650, p < 0.001), 5-HT4 (Fisher'z = −0.182, p = 0.049) and SERT (Fisher'z = −0.611, p = 0.001) at serotonergic synapses; D1 (Fisher'z = −0.397, p < 0.001), DAT (Fisher'z = −0.540, p < 0.001), and FDOPA (Fisher'z = −0.306, p = 0.001) at dopaminergic synapses; NAT (Fisher'z = −0.210, p = 0.022) at noradrenergic synapses; and VAChT (Fisher'z = −0.235, p = 0.013) at cholinergic synapses.
Gene expression profiles related to GM volume alteration in MCI
We obtained normalized gene expression data of 10 027 genes for 176 ROIs of HCP atlas from the AHBA data and set these expression data as the predictor variables in PLS. The Z-maps, depicting the differences in GM volume among individuals diagnosed with MCI/LLD and healthy controls across the 176 ROIs based on the HCP atlas, were employed as the dependent variable in the PLS. Only the first component of the PLS regression with MCI Z-map was significant and explained 36.17% of the variance in the MCI-related alteration in GM volume (p < 0.05 for component 1, permutation tests with spatial autocorrelation corrected). The first component represented a transcriptional profile characterized by high expression, mainly in the left anterior agranular insula complex in the HCP atlas (Fig. 4a), a cytoarchitecturally distinct sub-region in the insula. The Z-map of gray matter volume difference between MCI and healthy controls was significantly positive with the regional mapping of the first component (r = 0.6015, p < 0.0001, Fig. 4b). Results from the Gene Ontology enrichment analysis revealed that the genes ranked in descending order of the first component weight were enriched in biological processes including cellular potassium ion transport, molecular function related to metal ion transmembrane transporter activity (Fig. 4c, 4d, FDR-corrected q < 0.05). No significant enrichment of cellular components was observed.
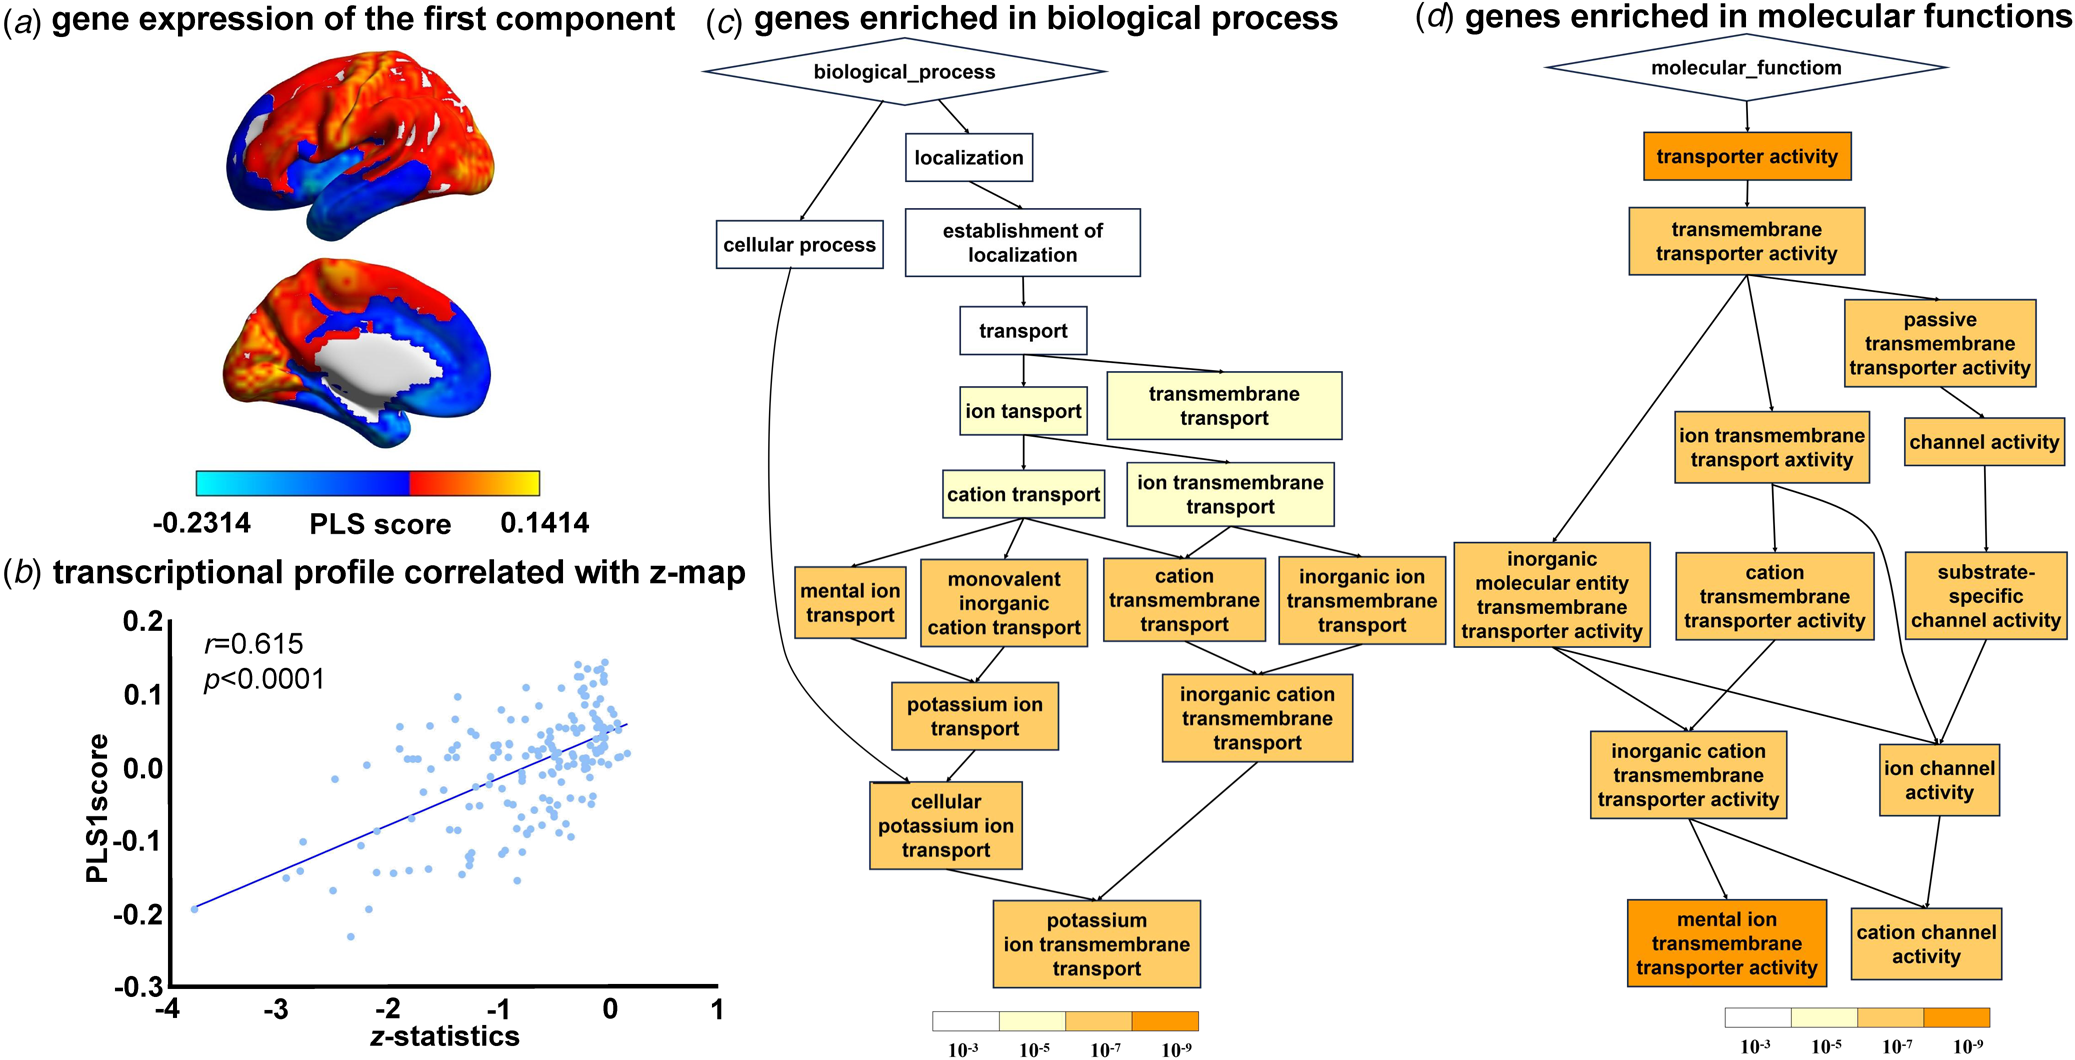
Figure 4. Association between gray matter volume alternation in MCI and gene expressions. (a) A gene expression profile identified by the first PLS component; (b) The transcriptional profiles were positively correlated with the z-map of the gray matter volume differences; (c) Genes ranked in ascending order of the PLS 1 weight were enriched in the biological process of cellular potassium ion transport (FDR-corrected q < 0.05); (d) The molecular function of metal ion transmembrane transporter activity (FDR-corrected q < 0.05).
Discussion
To facilitate timely differentiation between LLD and MCI, we conducted a meta-analysis examining associated profiles of atrophic structures alongside decoding of neuropsychological features, neurotransmission and gene expression. We observed reduced GM volumes in the right median cingulate/paracingulate gyri and the right insula in both conditions, whereas the left hippocampus and the right parahippocampal gyrus demonstrated more pronounced reductions specifically in MCI. This indicates that executive function is essential in these two diseases, while memory deficit is more relevant in aMCI. In terms of the neurotransmission system, D1 at dopaminergic synapses and VAChT at cholinergic synapses play prominent roles in LLD, while MCI is related to serotonergic synapses including 5-HT1A and SERT, dopaminergic synapses including D1, DAT, and FDOPA, together with various other neurotransmitters such as cholinergic synapses. In the assessment of gene expression, the first component was significant in MCI, which was highly expressed in the left anterior insula complex in the HCP atlas and enriched in processes including cellular potassium ion transport and metal ion transmembrane transporter activity.
GM morphological abnormalities differ between LLD and MCI
GM reduction in the left hippocampus and the right parahippocampal gyrus was more specific in MCIs than in LLDs, which correspond to explicit memory and AD. The hippocampus, whose subfields selectively correspond to different cognitive domains (Liu, Liu, Qiu, & Alzheimer's Disease Neuroimaging, Reference Liu, Liu and Qiu2021), is also vulnerable in deleterious conditions (Zhang et al., Reference Zhang, Fu, Zhao, Cong, Zheng and Zhang2022), and shows structural and biochemical changes when MCI occurs or progresses (Geerlings & Gerritsen, Reference Geerlings and Gerritsen2017; Wang et al., Reference Wang, Peng, Zhan, Yin, Huang, Huang and Liang2024). Specifically, reducing cornu ammonis 1 (CA1) in the hippocampus is a pathway that links LLD to persistent cognitive decline, such as aMCI and AD (Choi et al., Reference Choi, Jung, Um, Lee, Park and Lim2017). The hippocampus also collaborates with other cortico-subcortical structures such as the parahippocampal gyrus (PHG), integrating into the Papez circuit and participating in high-level cognitive processes such as episodic memory synchronization (Forno, Llado, & Hornberger, Reference Forno, Llado and Hornberger2021). PHG is proven to have significant volume differences when comparing MCI to HCs and ADs to MCIs (Echavarri et al., Reference Echavarri, Aalten, Uylings, Jacobs, Visser, Gronenschild and Burgmans2011), due to neuronal degeneration (Wang et al., Reference Wang, Liu, Wang, Tan, Sun and Tan2017), and abnormalities in microvasculature-associated gene expression (Katsel et al., Reference Katsel, Roussos, Beeri, Gama-Sosa, Gandy, Khan and Haroutunian2018). The observed variability in our findings in MCI could be attributable to its variability in neuropsychiatric symptoms. The structural involvement of the fronto-limbic circuit corresponds to specific neuropsychiatric symptoms (Cotta Ramusino et al., Reference Cotta Ramusino, Imbimbo, Capelli, Cabini, Bernini, Lombardo and Costa2024). For instance, researchers have related the right parahippocampal gyrus to cognitive reserve (Zhou et al., Reference Zhou, Yang, Liu, Li, Zhao, Liu and Zhang2024) and the left angular gyrus to financial capacity (Nowrangi et al., Reference Nowrangi, Outen, Naaz, Chen, Bakker, Munro and Rosenberg2022) in MCI. Potential confounding factors, such as age (Taylor et al., Reference Taylor, Deng, Boyd, Donahue, Albert, McHugo and Landman2020) or medication (Chan, Yiu, Kwok, Wong, & Tsoi, Reference Chan, Yiu, Kwok, Wong and Tsoi2019), might also explain these findings; however, subgroup analysis was not conducted due to the relatively uniform demographics and finite number of studies.
GM morphological abnormalities have common ground between LLD and MCI
The right insula and right median cingulate/paracingulate gyri are the two shared reduced regions in LLD and MCI. Both regions have direct structural connections with various systems involved in these two diseases. The insula serves a wide variety of functions in concert within and across functional networks, ranging from sensory and motor functions to high-level cognition such as primordial and social emotions (Fermin et al., Reference Fermin, Sasaoka, Maekawa, Chan, Machizawa, Okada and Yamawaki2023; Uddin, Nomi, Hebert-Seropian, Ghaziri, & Boucher, Reference Uddin, Nomi, Hebert-Seropian, Ghaziri and Boucher2017). This is consistent with the reports of previous studies, as Zackova et al. (Reference Zackova, Jani, Brazdil, Nikolova and Mareckova2021) suggested that the decreased volume of the insula may reflect communication deficits and may be regarded as a risk factor for both MDD and MCI because of the consequent infrequent participation in mental or social stimulating activities. Moreover, the median cingulate motor area is allowed to output action-outcome learning to premotor areas after the posterior cingulate cortex receives spatial and action-related information from the hippocampal system and parietal cortical areas (Rolls, Reference Rolls2019), which is part of the Papez circuit that is related to both emotions and memory (Forno et al., Reference Forno, Llado and Hornberger2021).
Discriminating patterns of spatial correlated neurotransmission and transcription
Dopamine (DA) plays significant roles in numerous cognitive functions, including memory processing and behavioral formations (Chen, Chen, Kim, & Xiong, Reference Chen, Chen, Kim and Xiong2021). The cholinergic system, including acetylcholine (ACh) and vesicular acetylcholine transporter (VAChT), acts as a modulator of cognition in terms of attention, learning, reward behavior, and memory (Hampel et al., Reference Hampel, Mesulam, Cuello, Farlow, Giacobini, Grossberg and Khachaturian2018; Han et al., Reference Han, Yang, Kim, Mo, Yang, Song and Kim2017). Moreover, cholinergic innervation interacts with DA (Skirzewski et al., Reference Skirzewski, Princz-Lebel, German-Castelan, Crooks, Kim, Tarnow and Bussey2022). The impact of serotonergics is noticeable in MCI (Smith et al., Reference Smith, Barrett, Joo, Nassery, Savonenko, Sodums and Workman2017), in accordance with novel therapeutics in AD containing psychedelics (Garcia-Romeu, Darcy, Jackson, White, & Rosenberg, Reference Garcia-Romeu, Darcy, Jackson, White and Rosenberg2022). Furthermore, the significant effects of opioidergic (Browne, Jacobson, & Lucki, Reference Browne, Jacobson and Lucki2020) and glutamatergic synapses (Lissemore et al., Reference Lissemore, Bhandari, Mulsant, Lenze, Reynolds, Karp and Blumberger2018) in LLD are consistent with those reported by research for novel targets.
Functional enrichment analysis of significant genes has revealed a functional imbalance of neurotransmitters and synapses in AD (Scaduto et al., Reference Scaduto, Lauterborn, Cox, Fracassi, Zeppillo, Gutierrez and Limon2023). The anterior agranular insula complex is an essential node in projections connected to the hippocampus (Cenquizca & Swanson, Reference Cenquizca and Swanson2007), the central medial nucleus, and the striatal and limbic forebrain circuitry (Vertes, Hoover, & Rodriguez, Reference Vertes, Hoover and Rodriguez2012). Ion channels not only maintain water/ion metabolism homeostasis but also moderate the signaling pathways of neurons and glial cells, and their dysfunction are significant pathological features and new therapeutic targets for neurodegenerative disorders (Wang et al., Reference Wang, Wang, Shang, Zhang, Yan and Zhang2022). For example, depressed Na+/K+ ATPase levels and impaired glutamate clearance in AD brain could lead to a cellular ion imbalance and electrophysiological dysfunction, probably triggered by amyloid beta peptide (Aβ) (Vitvitsky, Garg, Keep, Albin, & Banerjee, Reference Vitvitsky, Garg, Keep, Albin and Banerjee2012). Additionally, dysregulation of neuronal iron homeostasis is likely to be an alternative unifying effect of early-onset familial AD (Lumsden et al., Reference Lumsden, Rogers, Majd, Newman, Sutherland, Verdile and Lardelli2018).
Strength and limitations
This study has some limitations. First, the amount of LLD research was finite, which might influence the representativeness and repeatability of the results. Future research should aim to include more studies on LLD to validate these findings. Second, there was some variability in the clinical implementation of LLD and MCI, which was mainly caused by disparities in the chosen cut-off values (Baba et al., Reference Baba, Kito, Nukariya, Takeshima, Fujise and Iga2022) and inner heterogeneity (Cotta Ramusino et al., Reference Cotta Ramusino, Imbimbo, Capelli, Cabini, Bernini, Lombardo and Costa2024). Either LLD or MCI may be comparatively broad concepts, supplemented by conceptions including late-onset depression (LOD) (Olgiati, Fanelli, & Serretti, Reference Olgiati, Fanelli and Serretti2023), aMCI, and naMCI (Csukly et al., Reference Csukly, Siraly, Fodor, Horvath, Salacz, Hidasi and Szabo2016). However, a more in-depth study could not be conducted due to the limited amount of available data. Future research should aim to standardize the identification and inclusion of subgroups to validate these findings. Third, the influence of medications was not thoroughly addressed in the analysis, and this could be a potential confounding factor in the interpretation of the results (Chan et al., Reference Chan, Yiu, Kwok, Wong and Tsoi2019). Only 14 out of 55 datasets on MCI and 9 out of 13 datasets on LLD reported medication use, whose reported usage varied widely from 0% to 100% and differed in terms of treatment, making it impractical to separate our analysis based on medication use. Hence, the elaboration of medication use in future studies is encouraged.
Despite these limitations, we conducted a systematic literature search and included several datasets to conduct a comprehensive analysis of the commonalities and discrepancies between LLD and MCI. We chose parameters and thresholds for each research method meticulously adhering to the established manuals, which ensured and maximized the reliability of each part of the study, and balanced the sensitivity and specificity. Moreover, integrating neuroimaging findings with spatially correlated neurotransmitter data and gene expression profiles facilitated a better understanding of the structural and molecular differences between LLD and MCI. Finally, GM atrophy in the hippocampus and parahippocampal gyrus, alongside lower gene expression in ion transmembrane transport, can be used to accurately differentiate MCI from LLD. Prior studies have highlighted the potential of morphometric and molecular profiles as biomarkers due to their early manifestation prior to relatively overlapping and intricate symptomatic patterns (Cai et al., Reference Cai, Huang, Yang, Wang, Wu, Wang and Huang2021; Liu et al., Reference Liu, Abdellaoui, Verweij and van Wingen2023). These features also serve as promising targets for timely and accurate therapeutic approaches, because rebalanced or imbalanced gene expression and synaptic transmission are believed to underpin changes in brain structure and clinical manifestation (Aquilani et al., Reference Aquilani, Cotta Ramusino, Maestri, Iadarola, Boselli, Perini and Verri2023; Jacobs et al., Reference Jacobs, Baider, Goldzweig, Sapir and Rottenberg2023).
Overall, our study provides valuable insights into the structural and molecular profiles of LLD and MCI. Future research should address the abovementioned limitations and further explore the impact of clinical factors and treatment interventions on neuroimaging and molecular findings. Additionally, the clinical implications of the study's findings should be validated through prospective studies and clinical trials to confirm their utility in the differential diagnosis and management of LLD and MCI.
Conclusions
In conclusion, GM volume in the left hippocampus and right parahippocampal gyrus is more likely to be affected in MCI along with memory impairment, while GM atrophy in the right insula and right median cingulate/paracingulate gyri coexist in both LLD and MCI. MCI is related to extended downregulation in various neurotransmissions besides dopaminergic and cholinergic synapses, coupling with downregulation of genes enriched in ion transmembrane transporter activity. We infer that these imaging-transcriptomic-genetic integrative profiles can serve as potential targets for timely differential diagnosis and precise intervention between LLD and MCI.
Supplementary material
The supplementary material for this article can be found at https://doi.org/10.1017/S0033291724002563
Funding statement
This study was supported by the National Key R & D Program of China (SIT2030-Major Projects 2022ZD0214300), Nature Science Foundation of China (ref: 32271139, 31900806), Guangdong Basic and Applied Basic Research Foundation (ref: 2023A1515011331). The funding organization played no further role in study design, data collection, analysis and interpretation, and paper writing.
Competing interests
None.


 Open access