

How do economic troubles affect electoral participation? Are people under economic stress more or less likely to vote, and why? The Great Recession of 2008–9 led to soaring unemployment levels throughout the established democracies in the West, with peak official unemployment rates ranging from 10 per cent in the US to a whopping 25 per cent in Greece and Spain. Would the unemployed treat elections as an opportunity to redress their grievances, and therefore vote in greater numbers? Or perhaps their preoccupation with immediate economic problems would lead them to withdraw from politics and shy away from the polls? Or perhaps neither is true; there may be no systematic relationship between being unemployed and electoral participation.
Answers to these questions have important implications. A withdrawal effect among the unemployed might imply that the ‘government may escape retribution for economic mismanagement because the very people with the most interest in seeking such retribution may not vote’ (Radcliff Reference Radcliff1992, 444). This would be a troubling conclusion for democratic accountability, suggesting that elections do not satisfactorily serve as a sanctioning device, even for people who suffer the grave economic hardship of unemployment. What’s more, understanding the dynamics of participation of the unemployed would shed light on the decisions and psychology that lie behind electoral participation more generally.
In this article we seek to explain the dynamics of turnout among the unemployed, in particular why they vote at lower rates in low-unemployment than in high-unemployment settings. We shift the emphasis from opportunity costs, a prominent explanation, to candidate strategies in election campaigns and the social psychology of joblessness.Footnote 1 Job loss generates feelings of depression and self-blame, emotions that are not propitious for self-efficacy or participation. Thus, we generally observe a withdrawal effect among the unemployed. But when unemployment is widespread, challengers draw attention to it in their campaigns and blame incumbents. Blame induces anger, an approach emotion. The jobless who are exposed to claims that politicians are to blame for unemployment are therefore more prone to return to the polls. In contrast, when the unemployment rate is low, candidates do not say much that would mitigate the depression and self-blame that the unemployed experience.
We support our claims with both observational and experimental evidence. We analyze data from the Current Population Survey (CPS) in the US that covers elections occurring over a forty-year period, from 1974 to 2014. In a path-breaking study that also used CPS data, Rosenstone (Reference Rosenstone1982) showed that unemployed people who had been out of work for a long period at the moment of the 1974 election, the focus of his study, turned out at rates close to those of the employed. We call this a ‘bounce-back effect’. We demonstrate that the bounce-back is peculiar to elections, like the 1974 one, that coincide with recessions and high unemployment rates. Broadening the focus to all national elections between 1974 and 2014 reveals that the bounce-back dynamic is nearly always absent when the unemployment rate at the time of the election is low.
Next we test our political-psychological explanation with a survey experiment carried out among 700 unemployed Americans in the run-up to the 2016 presidential election. We randomized exposure among the unemployed to cognitive appraisals of joblessness. People who were exposed to a campaign-like statement that blamed unemployment on politicians felt more angry and evinced a greater willingness to turn out to vote. The effect is significant even though the study took place at the end of a riveting presidential campaign; the average propensity to vote in our sample was already high before treatment. Our survey-experimental results also allow us to set aside a rival explanation, according to which the mere knowledge that many others are in the same straits, in high-unemployment contexts, encourages the unemployed back to the polls.
In the concluding section we reflect on cost-benefit and political-psychological explanations of electoral participation. Even while pressing unemployment effects into the narrow mold of opportunity costs, Rosenstone strained toward a fuller account, one that acknowledged the role of emotions such as depression, withdrawal and anger in people’s willingness to go to the polls. Taking into account the ways in which emotional responses to economic hardship mediate the impact of the economy on political behavior does not mean giving up any sense of political strategy or rational action. But this action operates at the level of political elites: candidates and campaigns choose their economic messages depending on the context, and seem to understand implicitly the psychological reactions of voters, which they try to mold to their advantage. We discuss several future lines of research, such as how our approach might clarify the impact of other economic conditions on participation, and whether underemployment, a widespread problem, influences participation in the same ways that unemployment does.
Related Studies and Theory
Studies of the impact of unemployment on turnout can be divided into two broad categories: those that analyze the effect of the unemployment level on aggregate participation rates, and those that analyze the impact of an individual’s being unemployed on his or her propensity to vote. Those in the first category paint a mixed picture. Some indicate that high unemployment rates depress aggregate turnout (Basinger, Cann, and Ensley Reference Basinger, Cann and Ensley2012; Rosenstone Reference Rosenstone1982); others find no systematic effect (Arcelus and Meltzer Reference Arcelus and Meltzer1975); and others still discern a positive effect of the unemployment rate on turnout (Burden and Wichowsky Reference Burden and Wichowsky2014). At first glance, results at the individual level seem more uniform: the unemployed are generally less likely to turn out than the employed. Yet, as we explore here, the effect varies across individuals and across contexts.
Most studies of turnout among the unemployed discern a withdrawal effect. Scholarship on the US in the 1970s, a period of economic turmoil, consistently reported a negative impact of unemployment on turnout (Brody and Sniderman Reference Brody and Sniderman1977; Caldeira, Patterson, and Markko Reference Caldeira, Patterson and Markko1985; Rosenstone Reference Rosenstone1982; Southwell Reference Southwell1988; Wolfinger and Rosenstone Reference Wolfinger and Rosenstone1980). Even Burden and Wichowsky (Reference Burden and Wichowsky2014), who find an aggregate mobilizing effect of county-level unemployment from 1976 to 2008, highlight that the unemployed are still less likely to participate than the employed. Outside of the US, Gallego (2007) utilizes European Social Survey data covering twenty-four countries in 2004, and finds a negative effect of being unemployed on turning out to vote after controlling for other relevant factors.
Though we are not aware of a study showing that the unemployed are more likely to vote than the employed, Rosenstone (Reference Rosenstone1982) observed that the inhibitive effect of unemployment on turnout in the 1974 election diminished over time. People who had lost their jobs just before the election turned out at lower rates than similar people who were employed at the time of the election. But those who had been out of work for a long period turned out at rates similar to those of the employed. Rosenstone explains this pattern in terms of opportunity costs. When people first lose their jobs they face time-consuming tasks, such as applying for unemployment insurance, that ‘are likely to drive out thoughts about politics’. Yet, over time, ‘adjustment to unemployment begins and its displacement of other concerns, such as politics, declines’ (1982, 36).
But Rosenstone’s opportunity-cost explanation does not square with what is known about the impact of job loss on individuals’ time use. The newly unemployed may indeed need to take on time-consuming activities, as Rosenstone suggests. On the other hand, they also find themselves with forty hours or so a week of ‘free time’, not to mention the time saved from commuting. Time-use surveys of Americans show that the jobless spend more time, compared to those with jobs, watching television, taking care of family members and sleeping (Krueger and Mueller Reference Krueger and Mueller2012). What these time-use patterns hint at is that unemployed people are withdrawn and have if anything too much time on their hands.
Rosenstone sought to explain variation in the behavior of the unemployed within a given election – why certain kinds of unemployed people turned out more than others in the same election. Other scholars have observed that the relationship between unemployment and turnout also varies across elections. Southwell (Reference Southwell1988, Reference Southwell1996) studied the voting behavior of ‘have-nots’ in American society – African Americans, working-class people and the unemployed – in seven elections from 1974 to 1992. She noted that economic disadvantage had a large negative effect on turnout in some years, but it had a much smaller effect in others. She did not explicitly test potential explanations for this year-by-year variation, but she speculated that psychological factors may have stimulated higher turnout in certain political and economic contexts. When unemployment rates rose and Republicans were in power, ‘a clearly identifiable “target” existed for the disgruntlement of those experiencing economic adversity’ (1988, 273) and this shifting blame ‘may activate turnout’. (1988, 275).
Southwell’s focus on targets to blame for adverse conditions anticipates a study by Arceneaux (Reference Arceneaux2003). He insists that not economic conditions per se but how people attribute responsibility for them is critical to their turnout decisions. People who suffer economically and blame the government are more likely to turn out; those who suffer economically and do not blame the government are less likely to do so. Thus Arceneaux’s study establishes a key link between blame for the economy and turnout, though he does not link blame to economic context or campaign strategies. His findings are in line with social psychologists’ understanding of cognitive attribution and the emotional substrates of collective action. It has long been known, in particular, that anger is a pro-social, approach emotion, and hence one that encourages participation (Brader and Marcus Reference Brader and Marcus2013; Carver Reference Carver2004; Carver and Harmon-Jones Reference Carver and Harmon-Jones2009; Conover and Feldman Reference Conover and Feldman1986; Marcus, Neuman, and MacKuen Reference Marcus, Neuman and MacKuen2000). Experimentally induced anger (Valentino et al. Reference Valentino, Brader, Groenendyk, Gregorowicz and Hutchings2011) and anger-evoking political messages (Weber Reference Weber2013) spur political participation.
Incantalupo (Reference Incantalupo2011) is also concerned with explaining why the unemployed vote at higher rates when the unemployment rate is high. In contrast to Rosenstone’s account, Incantalupo places emphasis on the social awareness on the unemployed. He expects ‘individuals who experience job loss when and where the unemployment rate is high to perceive their hardship as part of a broader social problem and be mobilized by this to vote’ (Incantalupo Reference Incantalupo2011, 8). With state-level data he shows that involuntary job loss depresses turnout when the unemployment rate is low but less so when it is high. He demonstrates these conditional effects with comparisons across elections and across US states. Incantalupo’s research design does not allow him to study time effects of the kind that Rosenstone uncovered, nor does it allow him to adjudicate between his passive, social explanation and a more active one focused on the impact of campaign politicization on turnout.
Like Arceneaux’s linking of blame with mobilization, Incantalupo’s linking of the isolated unemployed with demobilization finds support in social psychology. The unemployed tend toward sadness, shame and guilt, withdrawal emotions that discourage people from involvement in collective action (Carver Reference Carver2004; Feather and O’Brien Reference Feather and O’Brien1986; Hamilton et al. Reference Hamilton, Hoffman, Broman and Rauma1993; Linn, Sandifer, and Stein Reference Linn, Sandifer and Stein1985; Ojeda Reference Ojeda2015; Price, Choi, and Vinokur Reference Price, Choi and Vinokur2002). What Incantalupo adds is that a person who finds herself jobless and knows or learns that many others are in the same straits may experience an easing of these withdrawal emotions.
Our explanation of the impact of unemployment on turnout is distinct from Rosenstone’s and from Incantalupo’s. It has more in common with Southwell and with Arceneaux, who emphasize blame attribution. But we use an experimental design that allows us to identify a link between blame and the context-specific campaign strategies of politicians. People who lose their jobs in a low-unemployment context are prone to blame themselves. Their response is reinforced by the relative silence of opposition candidates about unemployment when it is low. Challengers in these settings have incentives to ignore unemployment (Vavreck Reference Vavreck2009), since voters might interpret the low rate as an indication of the skill or policy success of the incumbent. And incumbents’ claims of credit for the favorable jobs situation will do little to assuage the withdrawal emotions experienced by those individuals who do find themselves out of work.
If, by contrast, the campaign unfolds in a high-unemployment context, the unemployed hear a lot about unemployment. They are exposed to challengers’ messages that point to the dire state of the economy and stress the government’s responsibility for it. These messages can turn depression and withdrawal into anger and action. In sum, in recession elections, the ingredients for the bounce-back are in place: challengers highlight the state of the economy and blame the government for joblessness, blame stokes anger among those hard hit by the economic downturn and anger encourages participation in collective action.
We also expect the bounce-back effect to be positively correlated with one’s spell of unemployment. A person who is jobless for many weeks during the campaign is more likely to receive at least one, and perhaps several, ‘doses’ of the blame-the-incumbent ‘treatment’. As exposure to politically relevant communications is positively related with individuals’ engagement with a given issue (Zaller Reference Zaller1992), people are more likely to be influenced by the blame-the-incumbent messages about unemployment when they themselves are unemployed. In her study of the economy and presidential campaigns Vavreck (Reference Vavreck2009, 155, emphasis added) shows that as candidates prime issues over the course of the campaign, ‘voters increasingly think these issues are important problems […] and these assessments affect vote choice’. For similar reasons, we expect the jobless in high-unemployment contexts to shift over time from self-blame to blaming political actors for their plight, a shift that helps them get to the polls.
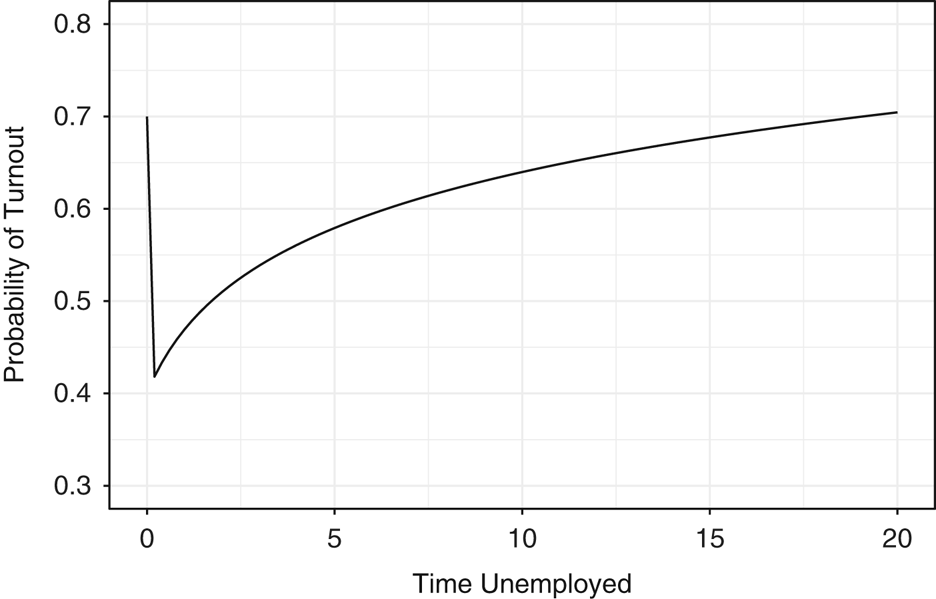
Figure 1 is a graphical illustration of turnout probabilities corresponding to distinct moments in a person’s spell of unemployment. The figure was generated from a simple formalization of our theory (see Appendix E) and it closely resembles the empirical patterns we observe in high-unemployment settings, as the next section explains.
Probability of turnout by length of unemployment in high-unemployment contexts.
Might the unemployed react directly to economic conditions, especially when they are salient and bad? Do they really need politicians to call their attention to them? Studies like Arceneaux’s, mentioned earlier, suggest that people may well know the economy is bad and their own state of employment or joblessness, but have quite distinct – and behaviorally relevant – reactions to these states, depending in part on framings of blame (of self or others). What’s more, Vavreck (Reference Vavreck2009) persuasively argues that even if the prevailing economic conditions clearly favor a particular candidate (an incumbent or challenger), that candidate must build his or her campaign around economic messages for electoral victory. Analyzing US presidential elections from 1952 to 2000, she shows that candidates who followed this prescription won the election 61 per cent of the time, compared to 25 per cent for candidates who violated it, even though the economy favored them. In turn, Stevenson and Vavreck (Reference Stevenson and Vavreck2000) analyze 113 campaigns in thirteen democracies, and find that objective economic indicators are better predictors of election outcomes in countries with longer campaign periods than in countries with short campaigns. This effect was predicted by Gelman and King (Reference Gelman and King1993), who argued that campaigns help voters to ‘learn’ about objective economic conditions, and extended campaigns simply provide more opportunities in this direction. Our study adds that not just new information, but evolving emotional responses, shape political behavior in times of economic stress.
The rhetorical strategies of campaigns sometimes have all of the ingredients that psychologists identify as triggers for anger. Brader and Marcus (Reference Brader and Marcus2013) note that anger can emerge when individuals perceive obstacles preventing them from reaching rewards. But the effect is enhanced when they perceive – or are told – that their plight is unfair and undeserved, that it is the result of intentional actions of an agent and that there are actions available to them that can they take to rectify the situation (‘coping potential’). The formula is present in challengers’ messages in tough economic times. The incumbent’s actions are to blame for their precarious, undeserved economic situation and they can do something about it by heading to the polls and voting against the incumbent. Without these interpretative messages, people suffering economic setbacks might fall into self-blame and a sense of hopelessness, moods that are not conducive for collective action.
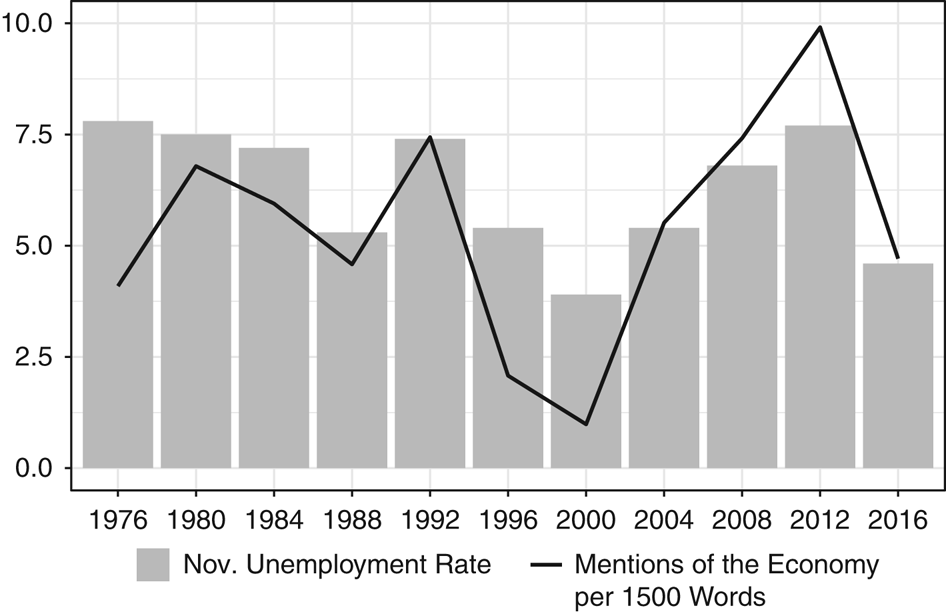
Is there evidence that challengers emphasize the economy when economic conditions are bad but draw attention to other issues when economic conditions are good? In addition to the logic and evidence presented in Vavreck (Reference Vavreck2009), recent US presidential elections featured challengers who emphasized unemployment when it was widespread, blaming the incumbents for it. But they remained comparatively silent on the issue when the rate was low. We analyzed the nomination acceptance speeches of challenger candidates in US presidential elections between 1976 and 2016. Their focus on unemployment rose and fell with the extent of joblessness (see Figure 2). As an example, in 1992, Bill Clinton was the challenger. In his nomination acceptance speech, with the unemployment rate at around 7.5 per cent, Clinton uttered the word ‘jobs’ thirteen times, and ‘unemployment’ twice. In 1996, with unemployment well under 6 per cent, Clinton’s challenger, Bob Dole, used the word ‘jobs’ just twice – and ‘unemployment’ not at all – in his nomination acceptance speech.
Unemployment rate and proportion of economy-related words in challengers’ nomination acceptance speeches Note: We define incumbency by party, so in 1988, for example, Michael Dukakis was the challenger and George H. W. Bush the incumbent.
The Dynamics of Turnout: Evidence from CPS
We begin by studying unemployment and turnout with data from the Current Population Survey (CPS), which is conducted monthly as a joint project of the US Census Bureau and the US Bureau of Labor Statistics.Footnote 2 CPS collects data on voting and voter registration in November of election years, both mid-term congressional and presidential. These samples are very large, averaging about 112,000 interviews across the twenty studies we analyzed; thus, many unemployed people are interviewed. In the lowest unemployment year in our dataset, 2000, the sample still included more than 2,300 unemployed people. The CPS achieves a high response rate (around 90 per cent), attenuating the problem of non-response bias, as explained by Heffetz and Reeves (Reference Heffetz and Reeves2016).
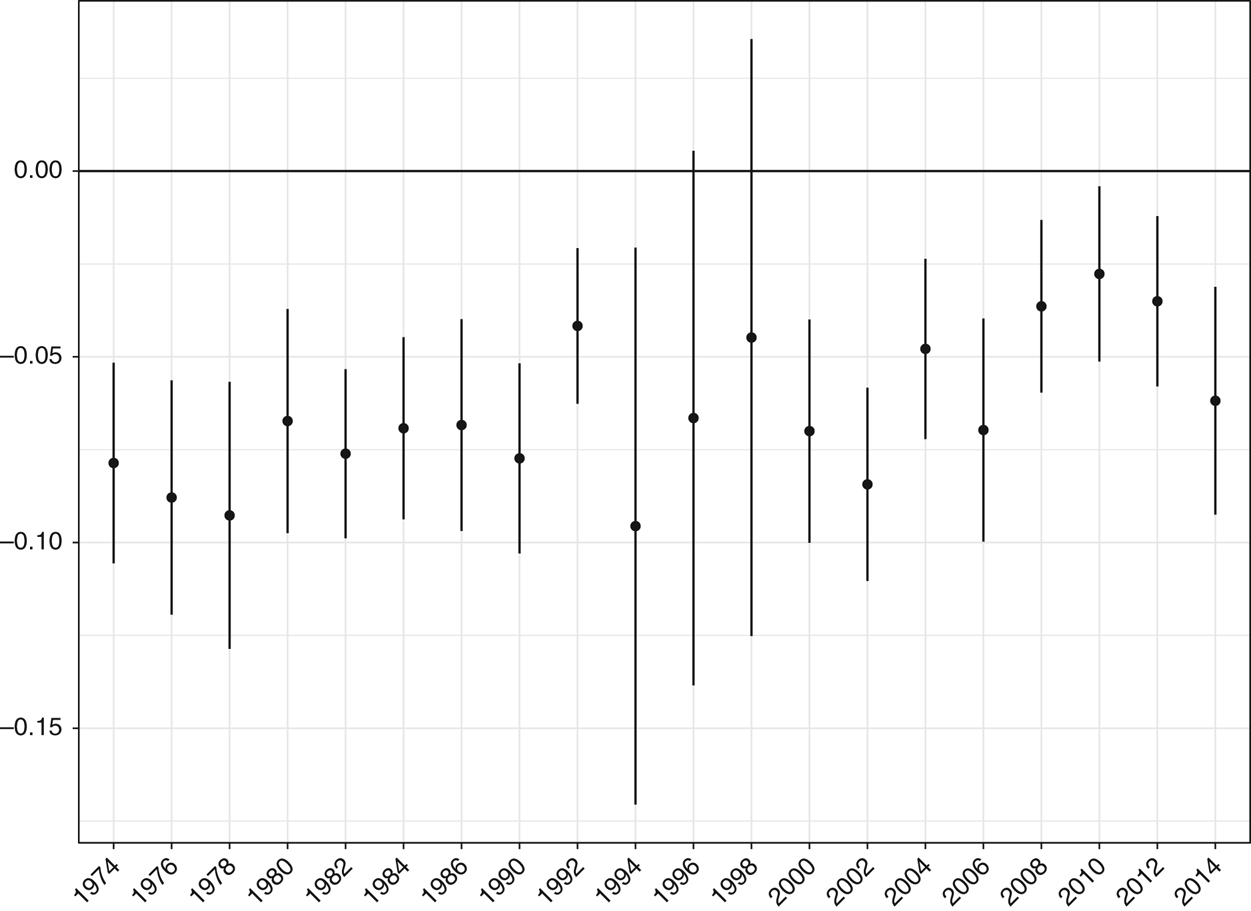
We estimated twenty probit models, each corresponding to an election year between 1974 and 2014, predicting the probability that an individual would voteFootnote 3 (the full models are presented in Appendix A). The dependent variable in each is self-reported turnout. One key explanatory variable is Unemployed, a binary variable, coded 0 if the respondent is currently employed and 1 if the respondent is currently unemployed and looking for work (thus our sample is limited to people in the labor force). The second is Weeks, which measures the duration of the person’s spell of unemployment. The specifications also include a number of demographic controls frequently used in studies of turnout. The impact of unemployment on reported turnout is displayed in Figure 3. Job loss consistently reduces turnout; in eighteen of the twenty elections, the effect is statistically significant and negative.
Estimated marginal effect of job loss on turnout by year. Note: Estimated marginal effect of the variable Unemployed with 95% confidence intervals. Marginal effects were estimated using Stata’s ‘margins’ command with probit regressions, controlling for duration of unemployment and demographics (see Table A1 in Appendix A for complete regression results). Source: Current Population Surveys, 1974–2014.
Turning to the spell of unemployment, we first replicate Rosenstone’s finding of a bounce-back effect in the 1974 elections. Unemployed people in 1974 were less likely to vote. But the duration of their spell of unemployment at the moment of the 1974 election has a positive effect on their chances of voting. In other words, if a person lost her job well before the 1974 election, her propensity to vote had rebounded significantly by Election Day.
The bounce-back effect emerges in some other elections, in addition to 1974s. In particular it appears when the unemployment rate is high. In low-unemployment elections, the duration of a person’s spell of unemployment rarely increases her propensity to vote. The distinct dynamics in low and high unemployment years can be seen in Figure 4, which plots the unemployment rates in November of each election year along with the presence or absence of a bounce-back effect among the unemployed with respect to turnout. With the exception of three outliers, the years can be partitioned into two groups, with all years above an unemployment rate of 5.7 per cent exhibiting the bounce-back effect and all years with an unemployment rate below this cutoff exhibiting no such effect. A separate regression pooling all twenty years, with year fixed effects and standard errors clustered by years, estimated a statistically significant (p < 0.001) and positive effect of the interaction variable Weeks × Unemployment Rate, highlighting that the bounce-back effect is stronger in years of higher unemployment (see Table D1 in Appendix D).
Bounce-back effect among the unemployed. Note: ‘Bounce-back effect’ indicates that Weeks Unemployed has a positive effect on the likelihood of voting at 5 per cent level or lower significance (one-tailed). Years are sorted along the x-axis by increasing rate of unemployment. Source: Current Population Surveys, 1974–2014.
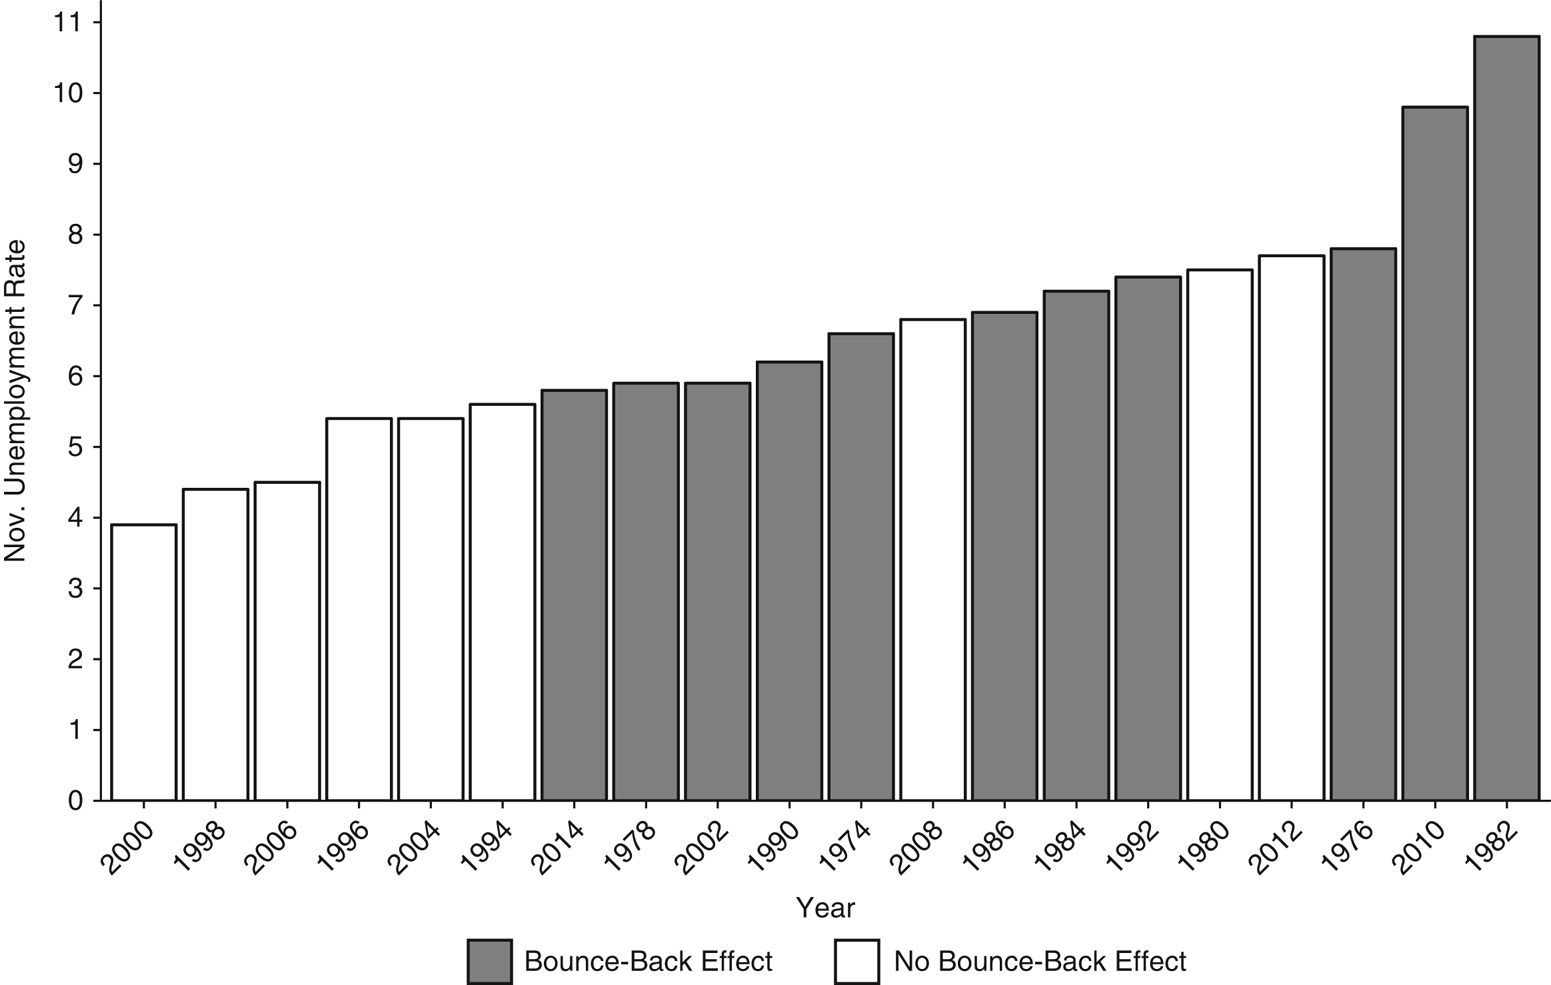
For a sense of the magnitude of effects, consider 1982 and 2000, the years with the highest and lowest unemployment rates, respectively. As illustrated in Figure 3, the estimated marginal effects of job loss on turnout were virtually identical across these two years, at −7.6 and −7.0 percentage points, respectively. But the effects of duration of unemployment varied sharply. The estimated marginal effect of moving from one to four weeks of unemployment to eleven to fourteen weeks of unemployment is an increase of 3.8 percentage points in the probability of voting in 1982, versus just 1.1 percentage points in 2000. The bounce-back effect is statistically significant in 1982 (p < 0.001) but not in 2000.
One could imagine that the difference in time dynamics lies not in the context of the election but in the composition of the unemployed. It might be that demographic characteristics of the unemployed change according to the economic context, driving differences in turnout. Yet the results reported in Figure 4 come from regressions that control for a wide range of covariates, including race, age, income, marital status, and several others. A comparison of demographic characteristics of the unemployed across high- and low-unemployment contexts does not reveal significant differences (see Appendix C). Additionally, the average length of spells of unemployment during years in which we observe a bounce-back effect is not significantly different from the average length in non-bounce-back years.Footnote 4
But what about unobserved differences between the kinds of people who are unemployed in low- and high-unemployment contexts? The two populations could be distinct in ways we don’t know about and which could confound the relationship between unemployment rate and the bounce-back effect. To address this concern, for each year in which we found a bounce-back effect (i.e. the coefficient relating Weeks to turnout was significant), we included a control for the unemployment rate at the time the individual lost his or her job. A positive and significant coefficient on this Unemployment Rate variable would mean that what shaped the person’s propensity to vote was something about the context in which they lost their jobs, rather than the high-unemployment context of the election. In no election year was the coefficient on the unemployment rate variable significant (see Appendix B). This result increases our confidence that the key factor is the duration of one’s unemployment in conjunction with the economic environment at election time, rather than characteristics of unemployed people that vary according to the economic context in which they lose their jobs.
In sum, the evidence thus far indicates that (1) unemployed people in the US are at higher risk of abstaining; and (2) when the unemployment rate is high, this effect diminishes over the spell of unemployment. It rarely diminishes – we rarely see a bounce-back – when the unemployment rate is low. Of course we cannot be certain that unobserved heterogeneity does not lie behind these apparent effects. Yet these contrasting dynamics do not seem to be driven by differences in the kinds of people who lose their jobs in the two settings, but, instead, by the settings themselves.
What, exactly, is it about high-unemployment elections that draws the unemployed back to the polls? Is it that when joblessness is widespread, those out of work understand the problem as a ‘socially centered’ one, given that many others are unemployed, independent of candidate messages (Incantalupo Reference Incantalupo2011)? Or, as we have suggested, is it that challenger candidates adopt a blame-the-incumbent discourse, a discourse that elicits the anger of the jobless, thus encouraging them to come back to the polls? Whether either one or both of these effects is at work is an empirical question. In the next section we report on a survey experiment that helps address this question.
Politicization and Anger Among the Unemployed: a Survey Experiment
To delve deeper into the mechanisms linking unemployment to turnout, on 19–22 October 2016 we conducted a survey experiment with an online sample of 750 unemployed American adults.Footnote 5 The logic of the experiment was to randomly assign unemployed people to treatments that encouraged contrasting cognitive appraisals of joblessness and observe any post-treatment impact on their emotional states related to their employment status and on their willingness to vote. We designed two vignettes: a Human Cost one, designed to test the social awareness explanation outlined earlier, and a Blame one, to test our political explanation (Table 1). Respondents were randomly assigned with equal probability to one of three groups: No Vignette, Human Cost or Human Cost + Blame.
Experimental Treatment Vignettes
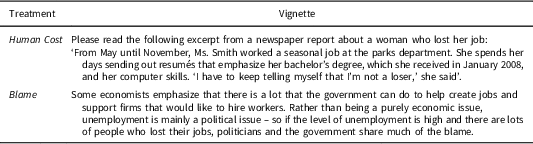
Respondents assigned to the Human Cost treatment were presented with a short news account of an unemployed woman struggling to find work. If the social awareness explanation is right, we expect this treatment to reduce any feelings of guilt or self-blame about their status that respondents might have and to increase their expressed willingness to vote. Since guilt and related feelings are withdrawal emotions, their abatement might be mobilizing.
The political-psychological explanation is explored through the Blame treatment. Among the two-thirds of respondents who were assigned to read the Human Cost vignette, half were assigned to read an additional short text, on the following page of the survey instrument, that attributed responsibility for unemployment to politicians and the government. Hence this treatment added the kind of political rhetoric that, we argue, stirs anger and mobilizes the unemployed when the joblessness is widespread. Though unemployed people may well become aware, when unemployment is high, that they are not alone in their plight, we suspect that it is exposure to politicized rhetoric about unemployment that accounts for the bounce-back effect. Thus, our prediction is that those exposed to the additional text placing blame on politicians will be angrier and more mobilized to vote than those who were only presented with the story in the Human Cost treatment.
We measured two key outcomes: respondents’ post-treatment emotional states as they relate to their employment status, and their intention to vote in the 2016 presidential election. To measure the emotional state of our respondents, we draw on a tool widely used by psychologists, the Positive and Negative Affect Schedule (PANAS) (Watson, Clark, and Tellegen Reference Watson, Clark and Tellegen1988). In research using the PANAS, respondents are asked to rate, on a five-point scale, the extent to which they experience distinct emotional states. We asked respondents to think about their current unemployed status and indicate the extent to which they felt a variety of emotions (anger and guilt being the emotions of interest for our experiment), with options ranging from ‘very slightly/not at all’ (coded 1) to ‘extremely’ (coded 5). To measure post-treatment propensities to participate, we asked respondents how likely they were to vote in the then-upcoming November 2016 presidential election. They registered their responses on a five-point scale, from ‘very unlikely’ to ‘certain’.
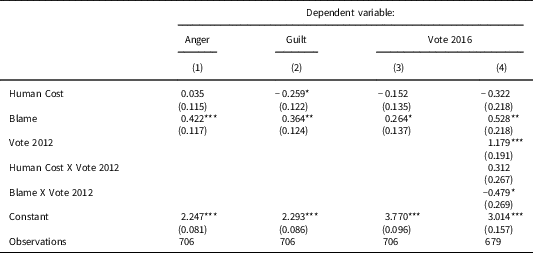
The impact of each vignette on the emotional states of respondents can be discerned by regressing self-assessed levels of anger and guilt on vignette assignment (Table 2).Footnote 6 As predicted, the Human Cost vignette had no significant effect on anger, but significantly reduced reported levels of guilt. The Blame vignette, on the other hand, did lead to a significant increase in anger.Footnote 7
Vignette Effects in the Survey Experiment
*p < 0.05, **p < 0.01, ***p < 0.001 (one-tailed). Source: Authors’ survey.
Moving to electoral participation, people assigned to the Human Cost vignette evinced no significant change in their intentions to vote, as measured by the variable Vote 2016. But those assigned to the Blame vignette expressed a greater willingness to vote: the average increase in this group was about one quarter of a point on the five-point scale. This heightened willingness to vote is especially notable in light of the timing of the experiment, just weeks before the 2016 presidential election. Respondents came into the study with strong intentions to turn out. Nearly half of respondents in the No Vignette group said they were ‘certain’ to vote in the upcoming election; two-thirds said they were either ‘certain’ or ‘very likely’ to turn out. Thus even though there was not much room for an increase in intentions to vote, the rhetoric of political blame did have a mobilizing effect.
The mobilizing impact of the Blame treatment emerges even more clearly when we focus on respondents who were relatively less likely to vote. We do so by incorporating a control variable for individuals’ voting history. Respondents were asked (pre-treatment) whether they voted in the 2012 election. We include all Treatment × Covariate interactions to capture potential variation in treatment effects among respondents with different voting histories. Among those who abstained in 2012, the Blame vignette increased reported intention to vote by about half a point on the five-point scale.Footnote 8 The magnitude of this effect is highlighted by a comparison with the coefficient on Vote 2012: past voting history, one of the best predictors of future turnout, is associated with about a one point increase on the five-point scale, only about twice the size of the Blame effect.
It is not surprising that people who voted in 2012 were not much affected by the Blame vignette. People who said they voted in 2012 expressed strong intentions to vote again in 2016, even in the absence of a mobilizing prompt. 79 per cent of people in the No Vignette group who said they voted in 2012 indicated that they were ‘certain’ or ‘very likely’ to vote in 2016 (with 59 per cent selecting ‘certain’). With a mean of 4.2 on our five-point scale, there was very little room to move these respondents and a ceiling effect is likely.
All of the respondents in our survey experiment were unemployed individuals, and a question is whether employed individuals would respond in similar ways. If people are equally sensitive to these campaign appeals regardless of employment status, then the blame rhetoric should simply increase anger and intention to turn out across the board. By contrast, we have argued that the unemployed should be particularly sensitive to these appeals, and therefore we observe the bounce-back effect in the CPS data. Some additional data we gathered provide support for this hypothesis. A few months before conducting the survey experiment, we ran a pilot on Amazon’s Mechanical Turk platform. We wanted to see whether subjects recruited from the general population (employed and unemployed) would yield sufficient numbers of unemployed respondents. The pilot thus produced responses to our survey experiment from a large sample of employed individuals (N=810). In this sample, we find no effect of the blame treatment on respondents’ anger or intention to turn out (see Appendix F).
To summarize, unemployed people’s tendency to bounce back toward higher rates of participation when joblessness is widespread might be explained by their being aware of others also facing tough times and thus being less prone to a demobilizing self-blame. Or it might be explained by their being exposed to a rhetoric of political blame aimed at incumbents. In our survey experiment, relevant prompts did elicit the kinds of emotions that are in line with either scenario – reduced guilt in the first case, increased anger in the second. But an emphasis on the struggles of other unemployed people did not make them more prone to vote. The reminder that politicians and governments can act to reduce unemployment or they can fail to do so made people more angry and – in this case alone – boosted their propensity to vote. The effect was especially pronounced among marginal participants, those who are probably habitually more likely to abstain.
These results notwithstanding, it would be unwise to dismiss out of hand the possibility that people who lose their jobs in the midst of widespread unemployment take some comfort in the awareness that they are not alone, awareness that alleviates a sense that they are responsible for their plight; or even that this awareness encourages them to get back to the polls. But we have seen stronger, less ambiguous evidence in favor of a more political explanation, whereby the discourse of blame, offered by challengers when joblessness is widespread, is a more powerful spark for participation.
Conclusions and Avenues for Future Research
When people are hit by hard economic times, some withdraw from politics. This includes Americans who lose their jobs: they are less likely to vote. The prevailing explanation has been that they are too busy with post-job-loss adjustments to make it to the polls. Many unemployed Americans’ participation rates rebound toward the level of the employed if, by the time of the election, their spell of joblessness has been long. The opportunity-cost explanation for this recuperation was that the adjustment to joblessness takes place in the initial weeks; after this adjustment, fewer activities compete for the time of the unemployed.
Though time budgets undoubtedly influence voting behavior of the unemployed, they do not account for other facts that our research has brought to the fore. In American elections held when the job market is robust, the unemployed stay away from the polls, even if they have been out of work for many weeks. Why would opportunity costs decline when the unemployment rate is high but stay steady when the unemployment rate is low? This difference holds even though the jobless are very much alike on observable characteristics, whether the unemployment rate is high or low. And there is little evidence of differences in the kinds of people who lose their jobs in these two contexts that might explain these contrasting dynamics.
We considered, instead, the emotional impact of unemployment. One account is that unemployment encourages withdrawal emotions – guilt, hopelessness, self-blame – which discourage turnout. When joblessness is widespread, people’s awareness that others are in the same straits assuages these emotions and leads people to see unemployment as a social, rather than an individual, problem. Social awareness would explain the bounce-back dynamic in high-unemployment elections. Our study discerns one link in this causal chain, from a social awareness of unemployment to a dissipation of guilt. But it fails to discern the second one, from reduced guilt to heightened turnout.
A different, political causal chain is fully in evidence. As we have shown, the economy gets relatively less attention in campaigns when the unemployment rate is low. When the rate is high, challengers talk a lot about the state of the economy and blame incumbents for it. Our experimental evidence links this discourse of blame to anger among the unemployed and to their heightened intentions to vote.
At the outset we asserted that a study of unemployment and turnout would shed light on theories of political participation, more broadly. One broader lesson is that explanations of turnout that focus on the costs of going to the polls, and the opportunity costs of the time spent doing so, take us only so far.
Varying costs of participation are frequently the go-to explanation for shifts in turnout. For instance, to explain why people with higher incomes are more likely to turn out in the US, Rosenstone and Hansen (Reference Rosenstone and Hansen1993, 135) write that ‘people whose incomes are ample can more easily meet the opportunity costs of participation’. The recourse to costs, opportunity and otherwise, to explain the ebbs and flows of electoral participation reflects the influence of rational choice models of participation. These models discount the importance of benefits that the would-be voter derives from the outcome of the election; these benefits are public goods and one vote is unlikely to change the outcome (Riker and Ordeshook Reference Riker and Ordeshook1968; for a recent review, see Feddersen Reference Feddersen2004). If benefits come into play, they must be private ones related to the act of voting. The benefits have been stipulated as including the fulfillment of one’s felt duty to vote or the expression of one’s political identity. But these private, act-related benefits don’t appear to vary with the context of the election or with a person’s financial resources. So scholars like Rosenstone, attempting to make sense of the political behavior of the unemployed, are led back to (opportunity) costs.
Yet since variations in opportunity costs do not explain the patterns we observed, we broadened our scope to factors that rational choice models usually ignore. In particular, we hope to have demonstrated the advantages of taking emotions seriously in explaining citizen participation. A contribution of our article is to have shown the relevance of emotions that are frequently studied in lab settings to the real-world setting of elections and campaign mobilization.
What rational choice theorists should find familiar in our account is the figure of the strategic aspirant to office – in particular, the challenger who seeks to pin the blame for a bad economy on the incumbent. Social and political psychologists, in turn, will not be surprised that people experiencing an approach emotion like anger are more willing to act. These scholars have shown that people who experience anger feel more efficacious and are more accepting of risk; efficaciousness and risk-acceptance predispose people to take part in collective action. What may be more novel to these scholars is that anger encourages participation whereas reduced guilt does not. Guilt and shame are, after all, withdrawal emotions, so their abatement might have left our respondents more willing to go to the polls. It is possible that this asymmetric result is an artifact of our experimental design. For instance, we may have inadvertently crafted a more powerful treatment in our blame condition. Or it may be related to some aspect of the 2016 campaign. But it is also possible that anger is simply a more potent emotion, where political participation is involved. Further research will be required in order to further clarify the impact of diverse emotions on political mobilization.
Another avenue for future research is to broaden the exploration of distinct dimensions of political conditions on emotions and on mobilization. Our experiment did not allow us to study the effects on people who are not fully unemployed but rather underemployed. To the extent that their underemployment is involuntary, we expect their responses to be similar, though perhaps muted, given that they may feel their situation to be less dire than that of the jobless. How economic hardships that affect broader swaths of the polity, such as inflation or sluggish wage growth, is also a question to be explored. Full unemployment, in advanced economies with unemployment insurance, is rarely a plight faced by more than a relatively small percentage of workers. Guilt and isolation are likely to be less prominent in their responses to the hardships they face, with implications for their susceptibility to campaign statements and levels of political mobilization.
That the public’s emotional responses lie behind their political responses to adversity does not mean that strategic action is absent from the broader dynamics of political mobilization. Our study suggests a marriage of strategic action (on the part of candidates) and emotional reactions (on the part of voters). Political psychologists are right to stress the critical parts played by anger, fear and shame in political behavior. But politicians anticipate and manipulate these responses. Sorting out which emotions come into play and how elites anticipate and encourage them are crucial tasks for the future.
Scholars who study real-world ups-and-downs in political participation often strain against the limits of inherited theories. We conclude by noting that, even as Rosenstone favored an opportunity-cost account of unemployment and turnout in his classic 1982 paper, he also hinted at a psychologically sensitive explanation. This tension between economic and psychological understandings is palpable when he wrote about ‘the returns’ from ‘attending to an immediate, stressful personal problem’. And it is palpable in the words of an unemployed person whom he chose to quote, who described the effects of joblessness in terms of ‘beating yourself up’ and a ‘loss of confidence’ (p. 36). Our hope is that we have contributed toward a framework that takes into account both citizens’ emotions and elite strategic action.
Supplementary Material
Data replication sets can be found in Harvard Dataverse at: https://dx.doi.org/doi:10.7910/DVN/USKUR2 and online appendices at: https://doi.org/10.1017/S0007123418000248.
Acknowledgements
Thanks to Jim Alt, Kate Baldwin, Deborah Beim, Alex Coppock, Matthew Graham, Greg Huber, Virginia Oliveros, Kelly Rader, Philip Rehm, Milan Svolik and David Rueda for comments. We are grateful to the Russell Sage Foundation and to Yale’s MacMillan Center for International and Area Studies for financial support. The research reported here was reviewed by the Koç University Ethics Committee, protocol #2016.057.IRB3.035 and by the Yale University Human Subjects Review Committee, protocol #1602017257.


