

1. Introduction
Engineering design methodology is a field of study that explores various design techniques and their potential to enhance the overall design process. The field encompasses a wide range of research directions, such as studying the ideation process for new engineered systems, exploring various strategies applicable at different design stages, and examining human-AI interaction in the design process. Considering the diverse array of research directions, identifying the predominant ones at different points in time can help understand research trends and provide deeper insights into the field. The availability of large volumes of machine-readable data and advanced computational algorithms offers new approaches to understanding these topic trends, modeling how they emerge, and subsequently predicting future trends. One popular method to identify trends is through analyzing patterns in large text corpora. For example, Nie and Sun (Reference Nie and Sun2017) used Text Mining to classify research articles into four clusters and incorporate bibliometric characterization and network analysis to explore research trends within each cluster (Reference Nie and SunNie & Sun, 2017). Another study built topic evolutionary pathways by identifying topics through network analysis to forecast future research directions (Reference Huang, Chen, Zhang, Wang, Cao and LiuHuang et al., 2022). Among these studies, the most common technique used is network analysis.
Network analysis can be used in various applications. For example, network analysis can be used to identify keywords and summarize topics based on the keyword network (Reference Duvvuru, Kamarthi and SultornsaneeDuvvuru et al., 2012; Reference Shin, Jung and RhaShin et al., 2021) or construct co-word analysis and measure the co-occurrence relationship between keywords (Reference Nie and SunNie & Sun, 2017). Network analysis can also be leveraged to determine the research directions through the citation or co-citation analysis of literature papers (Bindu et al., Reference Bindu, Sankar and Kumar2019; Liu & Pan, Reference Liu and Pan2023; Zhang & Guan, Reference Zhang and Guan2017). In addition, some studies use a combination of different network analysis methods. For example, Liu and Pan (Reference Liu and Pan2023) implemented a series of networks, including collaboration, citation, co-citation, and theme networks, to reveal global trends in a specific research domain (Reference Liu and PanLiu & Pan, 2023). These methodologies represent established techniques within the field of bibliometrics. Bibliometrics is an application of statistical methods that deals with bibliographic data, scientific publications, and other related literature (Reference BroadusBroadus, 1987). Bibliometrics can identify literature patterns (Reference McBurney and NovakMcBurney & Novak, 2002) and reveal emerging trends in a specific domain (Reference Donthu, Kumar, Mukherjee, Pandey and LimDonthu et al., 2021).
While the aforementioned studies have successfully modeled trends within certain research topic ecosystems, very few of the studies provide a generalized approach to visualize research topic trends. One method often mentioned in literature is using well-developed tools with large databases, such as VOSviewer, to generate the networks (Reference NinglasariNinglasari, 2021; Reference Xie, Chen, Wang, Zheng and JiangXie et al., 2020). Here, our work differs from previous approaches by employing a generalized method that can be applied to specifically selected datasets lacking built-in tools for network generation.
Here, a case study is built on the proceedings included in the American Society of Mechanical Engineers (ASME) International Design Theory and Methodology Conference track, part of the larger ASME International Design Engineering and Technical Conference (DTM) from 2018 to 2022. The dataset was selected to represent small datasets that lack author-defined keywords and well-established analytical tools. The case study analyzes the evolution of topics and explores how the topics change over time. In particular, our study adopts the research approach outlined by Huang et al. (Reference Huang, Chen, Zhang, Wang, Cao and Liu2022) in their work on the identification of scientific topic evolution (Reference Huang, Chen, Zhang, Wang, Cao and LiuHuang et al., 2022). The research method involves creating a Sankey diagram, which provides an informative visualization of the research trends within the design methodology ecosystem. In addition, the keywords in our approach are obtained through keyword extraction algorithms, rather than using those provided directly by the authors. Therefore, the study presented here develops a general method and explores corpus that typically do not have pre-defined keywords, offering broader applicability compared to current approaches in literature.
2. Literature review
The growth of larger datasets has promoted research on bibliometric analysis (Reference McBurney and NovakMcBurney & Novak, 2002). One ability of bibliometric analysis is to reveal trending topics, which could provide future study directions to decision-makers (Reference Donthu, Kumar, Mukherjee, Pandey and LimDonthu et al., 2021; Reference Secinaro, Brescia, Calandra and BianconeSecinaro et al., 2020). A critical part of trend discovery is the topic identification process. One major topic identification technique is through topic modeling, which is a statistical technique that identifies groups of similar words. Examples of the most used topic models include Latent Dirichlet allocation (LDA) and Latent Semantic Analysis (LSA). LDA is a generative probabilistic model that represents documents as mixtures of underlying topics, with each topic consisting of similar words, whereas LSA uses singular value decomposition to reduce the document-term matrix and identify the most common topics within the documents (Reference Kalepalli, Tasneem, Teja and ManneKalepalli et al., 2020). However, since many topic models require the user to predetermine the number of topics, the results may not always be satisfactory. Additionally, those topic models that do not require a predetermined number of topics are quite computationally expensive. Therefore, it is necessary to explore other methods that do not rely on specifying the number of topics in advance. One such approach is network analysis, which identifies topics without the need for a specified number.
Network analysis is often integrated with word embeddings to include word meanings during the topic identification process. A popular technique that creates word embeddings is Word2Vec, which is a deep-learning model that can capture the meaning of words. The Word2Vec model, originally introduced by Mikolov et al. (Reference Mikolov, Chen, Corrado and Dean2013), begins by encoding words as one-hot numeric arrays, which form the word vectors. The word vectors are then input into a neural network, where the neural network iteratively updates these vectors to capture the semantic relationships between words. The original paper proposed two model architectures - the Continuous Bag-of-Words Model (CBOW) and the Skip-gram Model. According to their explanation, “the CBOW architecture predicts the current word based on the context, and the Skip-gram predicts surrounding words given the current word” (Reference Mikolov, Chen, Corrado and DeanMikolov et al., 2013, p. 5).
In addition to Word2Vec, other embedding models have been developed; among these models, FastText is highlighted here due to its notable performance. FastText was developed by Facebook’s AI research team in 2016 and aims to overcome the issues related to current word representation models’ inability to handle rare vocabulary. In the FastText model, each word “is represented as a bag of character n-grams.” For example, consider the word “eat”, its n-gram characters are “e”, “ea”, “eat”, and “at”. A vector represents each n-gram character, and the summation of these vectors forms the vector representation of the word “eat”. By considering the character level instead of the word level, FastText can provide vector representation for out-of-vocabulary words (Reference Bojanowski, Grave, Joulin and MikolovBojanowski et al., 2016, p.135). Because of the advantageous characteristics of word embedding techniques, such as their ability to generate visualizable networks and their flexibility in not requiring a predefined number of topics, our study also employs this technique. To ensure the rigor of this study, both Word2Vec and FastText are applied to our dataset.
Although many studies have incorporated network analysis into trend analysis, several areas remain underexplored. Specifically, very few studies show a clear visualization of the actual research trends. Although Huang et al. (Reference Huang, Chen, Zhang, Wang, Cao and Liu2022) have implemented a Sankey diagram for visualization, their approach can be more generalized by using keyword detection algorithms. Our study contributes by implementing a more generalized approach and testing it on a small dataset that lacks author-defined keywords and is incompatible with automated network construction tools. Therefore, this study aims to address the gaps by extending the research method of Huang et al. (Reference Huang, Chen, Zhang, Wang, Cao and Liu2022) and investigating the current research trends in the design methodology research community.
3. Research approach
The method developed and presented here builds on the approach by Huang et al. (Reference Huang, Chen, Zhang, Wang, Cao and Liu2022) with some novel extensions (Reference Huang, Chen, Zhang, Wang, Cao and LiuHuang et al., 2022). This section will first discuss the data collection process and then introduce the algorithms and software used to construct the networks. Once the networks are constructed, approaches used to identify topics are explained. Later, the mathematical formulas used to calculate the similarity between the two topics are also explained.
3.1. Data collection and processing
The dataset analyzed here consists of DTM conference proceedings spanning five years, from 2018 to 2022, comprising a total of 268 papers. The conference tends to attract a recurring group of researchers, with three universities—Penn State University (PSU), Massachusetts Institute of Technology (MIT), and Texas A&M University (TAMU)—producing the highest number of publications over the five-year period.
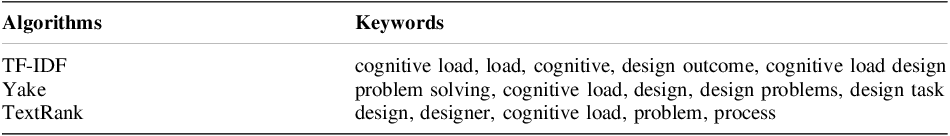
Firstly, the abstracts are pre-processed to eliminate unnecessary words. The next step is to extract key terms from the processed documents. Since the DTM dataset may include technical terms that consist of multiple words, both single-word keywords and multi-word key phrases are extracted. Please note that although the word “keyword” is used throughout this paper, it also includes key phrases. Given the variety of algorithms and their advantages, we use three different types of algorithms to extract key terms. After extraction, repeated words are filtered out. The three algorithms are Term Frequency-Inverse Document Frequency (TF-IDF) (Reference RobertsonRobertson, 2004), TextRank (Reference Mihalcea and TarauMihalcea & Tarau, 2004), and Yet Another Keyword Extractor (Yake) (Reference Campos, Mangaravite, Pasquali, Jorge, Nunes and JatowtCampos et al., 2020). The TF-IDF algorithm is one of the most frequently used keyword extraction methods. TF-IDF determines the importance of keywords by multiplying the term frequency (how often a single term appears in a document) with inverse document frequency (how often the same term appears in other documents across the corpus). Top-ranked keywords are then selected for further analysis (Reference RobertsonRobertson, 2004). The second algorithm is TextRank, which is selected due to its ability to capture semantic information (Reference Zhang, Li, Yue and YangZhang et al., 2020). TextRank starts by assigning an arbitrary value to each node in a network and recursively updating the weights of the nodes based on co-occurrence. If two nodes (words) frequently appear together, their weights will increase. In other words, if a node often co-occurs with many other nodes, it will be assigned a high weight (Reference Mihalcea and TarauMihalcea & Tarau, 2004). The third algorithm, Yake, is chosen for its superior performance compared to other unsupervised methods. Yake relies on the statistical significance of the words inside a document and extracts keywords based on local features such as position and frequency (Reference Campos, Mangaravite, Pasquali, Jorge, Nunes and JatowtCampos et al., 2020). Table 1 shows example keywords and key phrases generated by all three algorithms for a single document. Due to the unique characteristics of each method, output differences are expected. TF-IDF identifies keywords based on their significance across multiple documents and may split phrases, as seen in the first row of Table 1, whereas TextRank and Yake extract keywords from individual documents and better preserve the phrase structures. Given the unique output from each method, our work applies all three methods to capture as much information as possible.
Top five words identified by three algorithms

After finding the top-ranked keywords, the Word2Vec model pairs each word with a corresponding vector. With such a vector, the semantic similarity value can be calculated, which allows the model to determine synonymous words. Our study will use a skip-gram model as the Skip-gram models generally perform better than the CBOW model (Reference Irsoy, Benton and StratosIrsoy et al., 2020; Reference Johnson, Murty and NavakanthJohnson et al., 2023).
3.2. Network construction
The network construction through both Word2Vec and FastText follows the same procedure. Once the extracted words are converted into keyword vectors, a pairwise cosine similarity matrix is formed, where the rows and columns represent keyword vectors, and the entries denote their cosine similarity. After the similarity matrix is created, a threshold is applied to connect only keywords with a similarity score greater than the threshold value in the network.
Two programs are tested as methods to view the networks – NetworkX and VOSviewer. NetworkX is a Python package that develops networks from similarity matrices (Reference Hagberg, Schult, Swart, Hagberg, Varoquaux, Vaught and MillmanHagberg et al. 2008), and VOSviewer is an open-source software to visualize networks. To ensure compatibility, networks constructed in Python are stored in Pajek format and imported into VOSviewer. Subsequently, the networks are divided into keyword groups (referred to as communities in the remainder of the paper).
Each group of keywords shares a similar semantic meaning and can be categorized under the same research theme. There is a wide range of community detection algorithms inside the NetworkX package, including Modularity-based communities, Tree partitioning, Label propagation, Louvain Community Detection, and many more. All the algorithms within the NetworkX package have been tested in our study, however, the resulting communities are highly unbalanced, with the majority of nodes belonging to only a few communities, while the default community detection function in VOSviewer produces a much more balanced result. Therefore, VOSviewer is used to find communities. The community detection function used in VOSviewer is by maximizing the following Equations 1 and 2 adopted from van Eck & Waltman (Reference van Eck, Waltman, Ding, Rousseau and Wolfram2014) (Reference van Eck, Waltman, Ding, Rousseau and Wolframvan Eck & Waltman, 2014):
 $$V(C_1 , \cdots ,C_n ) = \mathop \sum \nolimits_{i \lt < j} \delta (C_i ,C_j )(S_{ij} - \gamma )$$
Where V(C 1, …, Cn ) is a function to be maximized and δ(c i , c j ) is a step function with a 0 or 1 output. C i represents the community for which the node i is assigned to, and S ij represents the similarity between node i and j. γ is a continuous resolution parameter that produces a higher number of communities with a higher value.
3.3. Topic identification and similarity calculation
After communities are identified, the next step is to assign a label to each community. These community labels are created based on common themes shared by the keywords. A widely used technique is to use some statistical calculation to determine the importance of keywords and select the keywords with the highest importance to be the community label. Our approach here is to use the Z-Score index which is a measure of node importance in a network. According to Guimerà et al. (Reference Guimerà, Sales-Pardo and Amaral2007), a node’s role is defined by two properties, one of which is the within-module degree Z-Score, which measures the cohesiveness of connections (Reference Guimerà, Sales-Pardo and AmaralGuimerà et al., 2007). The Z-Score calculation below (Equation 3) is derived from the within-module degree Z-Score, and Equation 4 represents the similarity calculation between two topics. The two equations are adopted from Huang et al. (Reference Huang, Chen, Zhang, Wang, Cao and Liu2022)’s work.
 $$z_i = {{N_M^i - \left(\mathop \sum \nolimits _{(j \in M)} N_M^j \right)/M^o } \over {\sqrt {\mathop \sum \nolimits_{(j \in M)} \left(N_M^j \right)^2 /M^0 -\left (\mathop \sum \nolimits_{(j \in M)} N_M^{\,j} /M^0 \right)^2 } }}$$
 $N_M^i $
and Mo represent the sum of edge weights between the ith node and others in community M, and the number of nodes in M, respectively. Z-Scores from Equation 3 are used to calculate the topic similarity between consecutive years, as shown in Equation 4.
$N_M^i $
and Mo represent the sum of edge weights between the ith node and others in community M, and the number of nodes in M, respectively. Z-Scores from Equation 3 are used to calculate the topic similarity between consecutive years, as shown in Equation 4. $Z_{W_t }^{'} $
represents the max-min normalized Z-Score corresponding to the keyword W
t
. H(M
t
) and H(M
t+1) in the numerator represents the nodes within communities M
t
and M
t+1, respectively. The denominator calculates the sum of all products of Z-Score pairs, where z
i
and z
j
are elements of the normalized Z-Score sets
$Z_{W_t }^{'} $
represents the max-min normalized Z-Score corresponding to the keyword W
t
. H(M
t
) and H(M
t+1) in the numerator represents the nodes within communities M
t
and M
t+1, respectively. The denominator calculates the sum of all products of Z-Score pairs, where z
i
and z
j
are elements of the normalized Z-Score sets $Z_t^{'} $
and
$Z_t^{'} $
and $Z_{t + 1}^{'} $
. Finally, v
W
t
represents the word vector transformed from a keyword W
t
(Reference Huang, Chen, Zhang, Wang, Cao and LiuHuang et al., 2022).
$Z_{t + 1}^{'} $
. Finally, v
W
t
represents the word vector transformed from a keyword W
t
(Reference Huang, Chen, Zhang, Wang, Cao and LiuHuang et al., 2022).
As described in the network construction section, a manually defined threshold (not included in the equations) eliminates certain edges during network construction and visualization. The goal is to construct a network with higher modularity, which indicates dense connections within community and sparse connections between nodes in different communities. Higher thresholds yield higher modularity but significantly reduce the number of nodes by removing lower-weight edges. The threshold is determined through trial and error to balance network quality and information retention. Trial and error shows that a range of 0.6 to 0.7 meets both criteria, making it the initial choice. To illustrate this process, assume there are three keywords, “complex system”, “CAD”, and “system architecture” from one community. The cosine similarity between “complex system” and “CAD” is 0.589, while the similarity between “complex system” and “system architecture” is 0.875. Since 0.875 exceeds the threshold, a weighted link (0.875) is created. If “complex system” has 135 links within its community, the sum of the total weights of these links is denoted as $N_M^i $
in Equation 3. To determine the similarity between two communities, the cosine similarity between each pair of nodes from both communities is calculated and summed up to obtain the overall similarity score.
$N_M^i $
in Equation 3. To determine the similarity between two communities, the cosine similarity between each pair of nodes from both communities is calculated and summed up to obtain the overall similarity score.
4. Results
4.1. Word2Vec
4.1.1. Community detection
Figure 1a demonstrates the detected communities for the 2018 network. The threshold is set at 0.58, a critical value where any further increase would remove nodes from the network. Each node represents a keyword extracted from abstracts, and communities are distinguished by color. There are 9 communities within the network, with each community containing a set of keywords as nodes.
(a) The 2018 network uses Word2Vec with a threshold value of 0.58 (b) The community comprises 133 nodes, with node size reflecting the number of connections. The boxed nodes represent some of the most highly connected nodes

Figure 1b is an example community in the 2018 network. Some of the most connected nodes identified in the figure are “engineering design task”, “novice”, “ownership bias”, “makerspace”, and “design idea”. These words all describe activities in the design process. The word with the highest Z-Score is “engineering design task”, which is selected as the label for this community. It is observed that there are some noise nodes in the networks that make the label ambiguous. To remove these noise nodes, a higher threshold is selected, and the resulting network exhibits a highly entangled structure, where nodes from different communities overlap with one another, lacking a distinct community boundary. To address this overlapping issue, another word embedding model, FastText, is explored in Section 4.2 to assess the potential for achieving better results.
To avoid redundancy, the remaining years’ topics and corresponding keyword sets are not discussed here, please refer to the GitHub link for further information (Repository). Figure 2 is a Sankey diagram that displays the topics from each year and the relationship pathways. Initially, topics are connected in the Sankey diagram if the similarity score between two topics is greater than 0.7 (Reference Huang, Chen, Zhang, Wang, Cao and LiuHuang et al., 2022; Reference Schwartz, Reichart and RappoportSchwartz et al., 2015). However, this threshold results in an excessive number of connections, making the main trends less apparent. Therefore, a cutoff value of 0.84 is selected for eliminating excess pathways. The results demonstrate that some of the topic terms don’t align well with a clear design method research topic. The reasons for these non-related topics will be discussed in detail in Section 5.
Sankey diagram from Word2Vec model with a threshold of 0.84

4.2. FastText
4.2.1. Community detection
Figure 3a is the keyword network generated using FastText. The initial threshold was set such that all nodes are kept in the network, so several irrelevant keywords appear in the network. For example, in Figure 3a, “result”, “low”, “pair”, “users”, etc. are not significant words. To increase the modularity of the network and further subdivide the existing cluster, we increased the threshold to 0.9. The resulting network for 2018 is displayed in Figure 3b, where many of the irrelevant words are removed and the communities are more distinct compared to the communities obtained by using Word2Vec. The remaining networks using FastText with higher thresholds from 2019 to 2022 can be assessed through the GitHub link.
2018 keyword network using FastText (a) with a threshold of 0.65 and (b) with a threshold of 0.9

Figure 4 shows the Sankey diagram generated through FastTest. A cutoff value of 0.81 was selected based on multiple trials, as this value provided the clearest visualization. Similar to Figure 2, each topic shown in Figure 4 represents the keyword with the highest Z-Score from each community in the corresponding year, with the connecting pathway indicating a close relationship between topics. For instance, “design fixation” and “biomimetic design” are often related in literature, where designers draw inspiration from nature to mitigate fixation. The differences between the two Sankey diagrams are expected, as each model produces different vector representations. However, there are still irrelevant topics in the figure. The reasons why our method generates these terms as research topics are discussed in detail in Section 5.
Sankey diagram from FastText model with a cut-off value of 0.81

5. Discussion
Two example pathways will be discussed in this section. One is from Figure 2, which is generated using Word2Vec, and the other is from Figure 4, which is generated using FastText. The influence of topics from previous years on the emergence of new topics in subsequent years will first be analyzed, followed by a discussion of the associated limitations in our study.
Large topics, such as “supportive”, are split into small topics, such as “brain activation”, “prototype system”, “best practice”, “mental workload”, and so on. These subtopics are closely related. For example, “brain activation” and “mental workload” are often discussed together in literature. However, some topics do not effectively represent the communities due to the limited effectiveness of keyword detection algorithms in extracting phrases. The term “supportive” originates from the phrase “supportive stimuli”. However, although three keyword extraction algorithms were used to preserve phrase structures, none of them detected the full phrase in this case and instead extracted only “supportive”. If the performance of keyword extraction algorithms increases, the result is more reasonable since “supportive stimuli” is highly related to “brain activation” and “mental workload”. Moreover, noise data such as “best practice”, “online”, and “prior knowledge” also appear in the figure. These are common terms that frequently occur across multiple documents. Additionally, it is noted that a considerable number of topics fade out during the evolution, which means there are no links between the topic and topics in the following year. Such behaviors may be due to different authors using different terminologies to represent the same concept.
The other Sankey diagram generated using FastText has different pathways than the Sankey diagram generated using Word2Vec. The situation is predictable since different models result in different keyword vectors, network configurations, and thus different Sankey diagrams. FastText is based on the character n-gram of words, therefore, FastText tends to group words with similar stems or words that share similar sub-word components. For example, in Figure 3b, the blue community consists of many words ending in “tion”. Since the language of the papers often exhibits rich morphology, meaning authors use different forms of words across papers, using FastText may offer potential benefits. Nevertheless, the drawbacks of FastText are also evident: words that share some n-grams do not necessarily share similar meanings. However, despite these drawbacks, the resulting network using FastText shows better clarity than the resulting network using Word2Vec.
Consider the other example pathway in Figure 4 that flows from “design fixation” to “biomimetic design”, and then from “biomimetic design” to “design cognition”, which further leads to “design space exploration”, and finally ends in “universal design”. The path begins with “design fixation”, which refers to the tendency of designers to rely on known ideas. The issue of design fixation can often be addressed by drawing inspiration from other sources, such as nature, which leads to “biomimetic design”, offering alternative solutions beyond conventional thinking. The pathway then progresses to “design cognition”, which focuses on designers’ mental activities. This connection is logical, as much research has studied the influence of biomimetic design thinking on design cognition. The path further transitions into “design space exploration”, where design cognition helps designers to explore a range of viable solutions. Finally, the path concludes with “universal design”. Together, the path highlights how ideas influence one another. Although to a lesser extent, noise data is also present in the network generated using the FastText model, such as “extraordinary” and “faucet”, similar to the Word2Vec model.
One limitation of this study is that these interpretations are subjective, and different people may have different interpretations of the diagram. Additionally, the diagrams show a limited representation of domain-specific topics. One reason is that the extracted keywords tend to be general, often including noisy and non-domain-specific terms. Another cause of general terms is that only a single word is extracted from multi-word key phrases. These general terms may lack precision, as they do not directly reflect the paper’s core themes. Although a high threshold has removed a significant number of irrelevant words from the keyword list, general words such as “worth” and “requirement” that frequently appear across papers remain in the network. In addition, since these terms often appear in multiple documents, the vector representations of these general terms will have a higher cosine similarity score with other keyword vectors, leading to a denser network connection. As a result, the general words are selected as a topic because these words have the largest Z-Score in the corresponding community. Given that the selected topics are significantly generic, it is challenging to obtain useful information, and thus difficult to interpret the results effectively. Another reason is that many words have closely related vector representations, which reduces the effectiveness of the community detection algorithm. Since the model is sensitive to the algorithm’s performance, the results are suboptimal. For instance, “faucet” is identified as a key topic despite not being a typical one. This phenomenon occurs because its associated community contains numerous general terms with stronger connections to “faucet” than to other, more technically relevant topics. Consequently, “faucet” achieves the highest Z-Score, surpassing more technically important topics. To address these issues, alternative keyword extraction and community detection methods should be explored. Advanced techniques, such as neural networks, could extract more specific keywords and potentially improve performance. Another approach is to define a broader theme for a group of similar keywords instead of using a single keyword to represent the entire community; this can be achieved through hierarchical clustering. Additionally, human involvement may also enhance accuracy.
6. Conclusion
This study proposed a framework for visualizing the research trends within the design methodology community through the creation of Sankey diagrams. By extracting keywords, transforming them into vectors, calculating cosine similarity, applying community detection algorithms, calculating similarity scores between topics, and constructing Sankey diagrams, our approach mapped relationships between research themes. The study compared Sankey diagrams from two models: Word2Vec and FastText. Both models can transform words into vectors, but FastText can handle out-of-vocabulary words due to its ability to learn from sub-word components. The two models produce different Sankey diagrams, indicating that the choice of model plays a crucial role in visualizing and interpreting research trends.
Since most of the prior research has relied on author-provided keywords for analysis, our study addresses this gap by presenting a generalized approach suitable for datasets without author-provided keywords, with our chosen dataset serving as a valuable case study. Furthermore, by systematically comparing the results of two different models, our study highlights the importance of model selection for data analysis, since the results are highly sensitive to the chosen model. Despite the contribution made by our study, several unsolved problems persist. First, the proposed method does not eliminate the presence of noise data. Some of the general words are not filtered out during the preprocessing stage and are selected as topics, yielding less informative results due to the distraction of off-topic words. Additionally, the threshold selection for network construction is arbitrary and lacks quantitative analysis.
Future work will aim to address these challenges in several ways. To mitigate the sensitivity to model selection, it is necessary to conduct a study to explore various models and compare the results to develop guidelines on model selection. Additionally, establishing a more systematic approach for determining threshold values is also important. In addition, the use of more advanced techniques, such as generative AI or neural networks, to extract more specific keywords will also need to be explored. Furthermore, the discussion section speculates that the phenomenon of topic fading may be due to inconsistent terminology used across papers, which will require further validation to confirm whether it is the actual cause. Additionally, to further assess the validity of this study, external expert evaluation will also be conducted in future work. Finally, while this study focuses on a specific dataset, the proposed method can also be applied to multidisciplinary datasets, thereby enabling broader application.


 Open access