





Introduction
In routine practice, an electrocardiogram is taken with leads placed in predetermined locations in supine position. Reference Uygur and Aydoğdu1 Electrocardiogram can be obtained with electrodes placed on the back in prone position. Clinicians may have to interpret back electrocardiograms taken in prone position in some important clinical conditions in children.
As in adults, children with acute respiratory distress syndrome may receive ventilatory support in prone position. Prone position increases the homogeneity of ventilation and can open dorsal lung regions. Reference Lupton-Smith, Argent and Rimensberger2 Prone position has been reported as a safe, simple, relatively harmless, and well-tolerated procedure that can improve oxygenation in children with acute respiratory distress syndrome. Reference Casado-Flores, De Azagra and Ruiz-López3–Reference Baudin, Emeriaud and Essouri5 In another study, however, prone position failed to significantly shorten ventilator-free days or improve other clinical endpoints in paediatric patients with acute lung injury. Reference Curley, Hibberd and Fineman6
Although rare, prone ventilation may be used for children with CHD. In a prospective randomised controlled study, Zheng et al. Reference Zheng, Chen and Lin7 reported that high-frequency oscillatory ventilation applied in prone position significantly improved oxygenation without severe complications in infants that developed post-operative acute respiratory distress syndrome after surgery for CHD. Inata et al. Reference Inata, Sofue and Hatachi8 reported that extracorporeal membrane oxygenation in prone position could be applied without neuromuscular blockage or increasing sedative/analgesic doses and major complications in paediatric patients.
It is difficult for patients with acute respiratory distress syndrome who are receiving oxygen support to switch from the prone to the supine position for electrocardiogram recording.
During the transition to the supine position, haemodynamic and respiratory instability may occur or the endotracheal tube may become dislodged. In such patients, an electrocardiogram can be taken by placing probes to the back of the patient. Reference Romero, Garcia and Diaz9 However, it is difficult to interpret prone back electrocardiograms because the amplitudes and durations of the electrocardiogram waves and durations of the intervals are unknown. Thus, it is essential to have a knowledge of how the amplitudes and durations of electrocardiogram waves and durations of the intervals are changed in the prone back position in healthy children. Herein, we aimed to determine the differences between electrocardiograms taken by placing electrocardiogram leads to the back of the patient in 12-lead prone position and 12-lead supine electrocardiograms used in routine practice in healthy children.
Material and methods
Ethical approval and consent to participate
This study was approved by Kayseri City Hospital Clinical Research Ethics Committee (December/2022, No: 752). Informed consent was obtained from the parents of the children.
Subjects
This study was conducted at Health Sciences University Kayseri Faculty of Medicine Kayseri City Hospital, Pediatric Cardiology Clinic. Children aged 3–7 years who presented to the paediatric cardiology outpatient clinic for a murmur were evaluated by a single paediatric cardiologist. The study group consisted of 50 healthy children with normal heart anatomy and function. Considering age-related electrocardiogram changes in healthy children, the age range of the children was limited to 3–7 years.
Transthoracic echocardiography
Echocardiographic examinations were performed using a Vivid Pro 7 (GE, Vingmed Ultrasound, Horten, Norway) echocardiography device. M-mode echocardiography was used to measure interventricular septum end-diastolic thickness, interventricular septum end-systolic thickness, left ventricular end-diastolic diameter, left ventricular end-systolic diameter, left ventricular posterior wall end-diastolic thickness, and left ventricular posterior wall end-systolic thickness. The z scores of these measurements were calculated using the Ped (Z)-paediatric calculator.
Exclusion criteria
Children with CHD, heart valve insufficiency, or stenosis due to acquired heart disease or a history of cardiac surgery due to CHD, clinical presentation of myopericarditis, acute illness, chronic illness, or any medication use were excluded.
Electrocardiogram
All electrocardiograms were taken by a single nurse when the children were quiet. GE Healthcare MAC 2000 device was used to take electrocardiogram recordings. In order to obtain a standard electrocardiogram, an amplitude setting of 10 mm/mV and a paper speed setting of 25 mm/sec were used. Care was taken to obtain electrocardiogram recordings free of artefacts.
Locations of the leads in supine position electrocardiogram
Per routine practice, the limb leads of supine electrocardiogram were placed in their standard locations (left and right wrist; left and right ankle), while the precordial leads were placed as the following: supine V1; fourth intercostal space at right sternal border, supine V2; fourth intercostal space at left sternal border, supine V3; midpoint between supine V2 and supine V4, supine V4; fifth intercostal space at midclavicular line, supine V5; between supine V4 and supine V6 on the same horizontal plane on anterior axillary line, supine V6; and on the same horizontal plane with supine V4 on midaxillary line.
Locations of the leads in prone position electrocardiogram
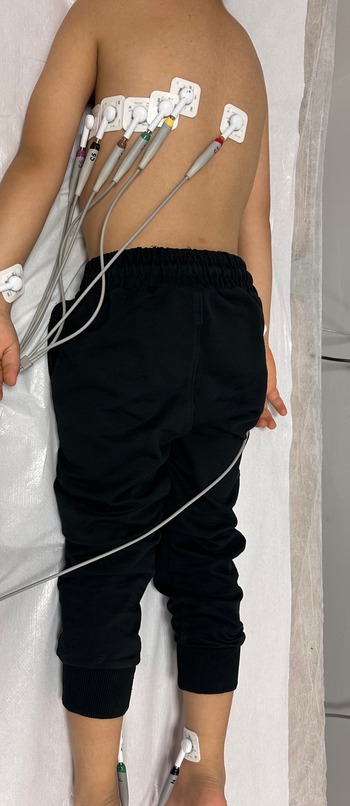
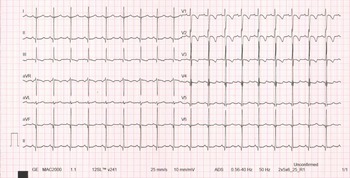
The child was placed in prone position. The limb leads were placed at their standard locations as in supine electrocardiogram. The back leads were placed close to the mirror-image locations of supine lead locations in the following manner: prone V1: fourth intercostal space at right spinal border; prone V2: fourth intercostal space at left spinal border; prone V3: midpoint between prone V2 and prone V4; prone V4: fifth intercostal space at midscapular line; prone V5: between prone V4 and prone V6 on the same horizontal plane on posterior axillary line; and prone V6: in the same position as supine V6. The location of the electrodes in a supine position in a child is shown (Figure 1). The location of the electrodes in the prone position is shown in a child (Figure 2). Figure 3 shows the supine position electrocardiogram recording in a child. Figure 4 shows the back electrocardiogram recording in the prone position in the same child.
The location of the electrodes in a supine position in a healthy child.

The location of the electrodes in the prone position in the same child.

Routine supine electrocardiogram of a healthy child.

Figure 3 Long description
This is a routine supine electrocardiogram of a healthy child. It shows multiple leads, including limb leads (I, II, III, aVR, aVL, aVF) and precordial leads (V1, V2, V3, V4, V5, V6). Each lead displays a tracing of the heart's electrical activity over time. The graph is a line graph with time on the x-axis and electrical voltage on the y-axis. The tracings show regular patterns indicative of a healthy heart rhythm.
Prone back electrocardiogram of the same child.

Analysis of electrocardiograms
First, the electrocardiograms were calibrated and then the measurements were done on them with the Image J software. The intervals and duration of waves were measured in milliseconds from the left of the line at the onset of the wave to the left of the line at the end of the wave. The amplitudes were measured in millimetres from the midpoint of the line on the midline to the midpoint of the line at the uppermost part of the wave. By this way, electrocardiogram lines were not included in the measurements.
The durations and amplitude of the waves and durations of the intervals were measured in lead DII. Only the amplitudes of the waves were measured in the precordial leads. The reason for determining only the amplitudes of the waves in the precordial leads was to avoid incorrect measurement of the durations due to low-amplitude or absent waves in the prone back leads.
QTc was calculated using the Bazett formula (QTc = QT/RR). The amplitudes of the P, Q, R, S, and T waves were measured as described above.
Statistical analysis
Study data were analysed using IBM SPSS Statistics Standard Concurrent User V 26 (IBM Corp., Armonk, New York, USA) statistical software package. Descriptive statistics were reported as the number of units (n), percentage (%), mean ± standard deviation, minimum (min), and maximum (max). The differences of numerical variables between the supine and prone groups were tested using paired samples t test; their resemblance was tested with the interclass correlation coefficient. The aggregation between supine and prone for P, Q, R, S, and T waves was evaluated with Bland–Altman plots. The difference between the supine and prone groups in each category was tested with two-proportion Z test with Bonferroni correction or Fisher’s exact test. p < 0.05 was considered statistically significant.
Results
There was a total of 50 healthy Turkish children with a mean age of 60.5 ± 17.5 (min–max: 36–84) months, of which 25 (50%) were girls and 25 (50%) were boys. The mean body weight, height, and body mass index of the children were 19.4 ± 5.0 kg, 111.7 ± 10.5 cm, and 15.34 ± 1.97 kg/m2, respectively. Mean systolic blood pressure and diastolic blood pressure were 105.82 ± 12.22 and 67.28 ± 8.83 mmHg, respectively.
All children had normal cardiac anatomy and function on echocardiography. Left ventricular parameters measured in M-mode and their z scores were within normal limits.
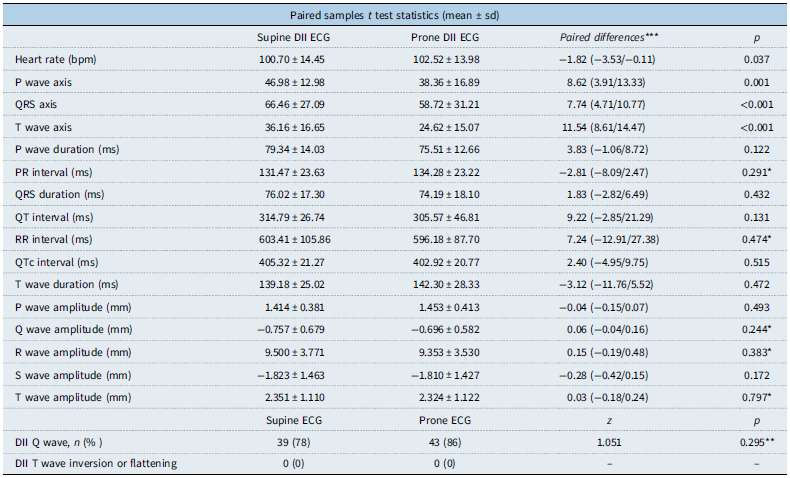
A comparison of prone DII and supine DII electrocardiograms revealed that heart rate, the duration and amplitude of all waves, and durations of the intervals were statistically similar. P wave axis, QRS wave axis, and T wave axis of supine and prone electrocardiograms ranged between 0 and 90. However, P wave axis, QRS axis, and T wave axis were smaller in prone electrocardiogram compared with the supine electrocardiogram (p = 0.001). (Table 1).
Duration of waves and intervals and amplitudes of waves in supine DII electrocardiogram (ECG) and prone DII ECG

Table 1 Long description
A table comparing various parameters of supine DII and prone DII electrocardiograms. The table has 23 rows and 5 columns. The columns are labeled as Supine DII ECG, Prone DII ECG, Paired differences, and p. The rows are labeled with different parameters such as Heart rate (bpm), P wave axis, QRS axis, T wave axis, P wave duration (ms), PR interval (ms), QRS duration (ms), QT interval (ms), RR interval (ms), QTc interval (ms), T wave duration (ms), P wave amplitude (mm), Q wave amplitude (mm), R wave amplitude (mm), S wave amplitude (mm), T wave amplitude (mm), Supine ECG, Prone ECG, DII Q wave, and DII T wave inversion or flattening. Each row provides the mean and standard deviation for each parameter in both supine and prone positions, along with the paired differences and p-values.
bpm = beats per minute; ms = millisecond; mm = millimetre.
* For interchangeable use of supine and prone ECG values, paired sample t test result should have p value > 0.05, interclass correlation coefficient value >0.6, and confidence interval should be narrow. Specifies the waves and intervals that provide this.
Numerical data are given as mean ± standard deviation.
**Two proportions Z test with Bonferroni correction.
***Mean of paired differences (95% confidence interval of the difference).
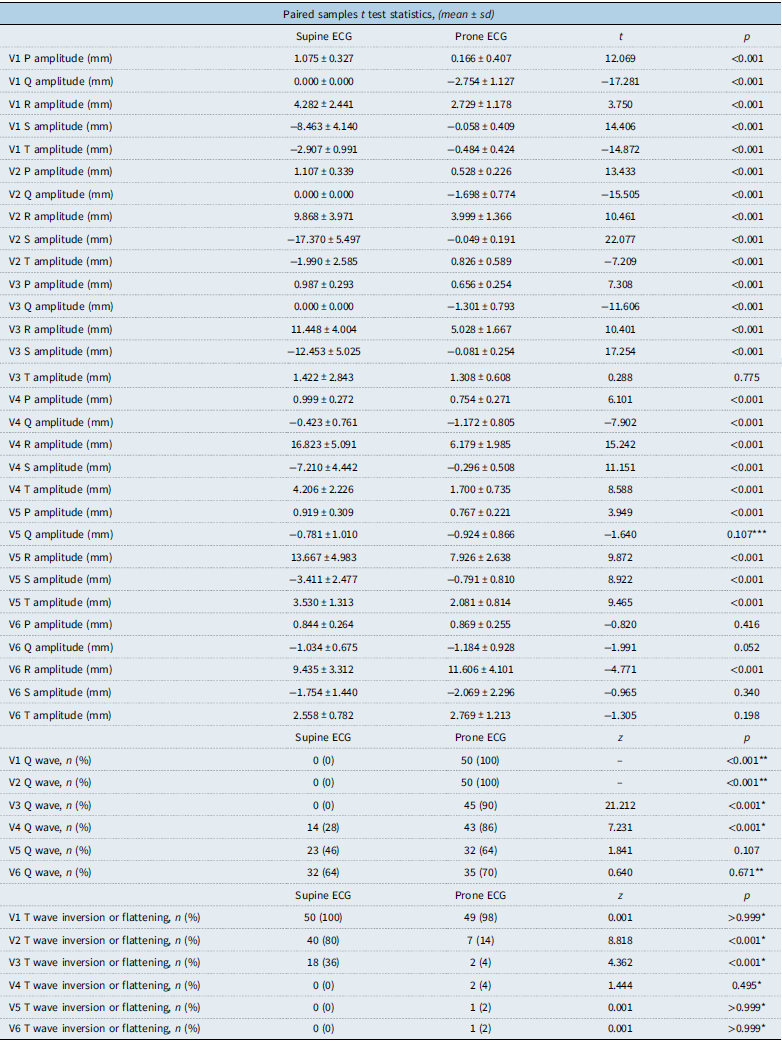
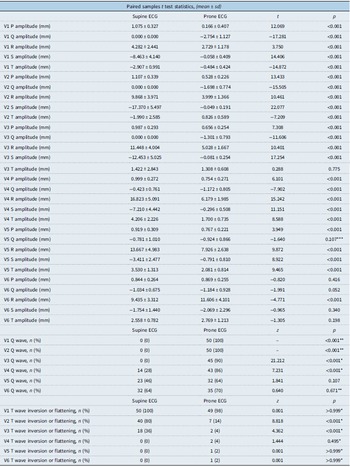
The average P wave, Q wave, R wave, S wave, and T wave amplitudes were significantly smaller in prone back leads (prone V1–prone V5) compared to supine precordial leads (supine V1–supine V5) (p < 0.001). The only exceptions were that the mean T wave amplitude in prone V3 and supine V3 was similar, and the mean Q wave amplitude in prone V5 and supine V5 was similar.
The average P wave, Q wave, S wave, and T wave amplitudes were similar when prone V6 was compared with supine V6. Average R wave amplitudes were higher in prone V6 compared to supine V6 (p < 0.001).
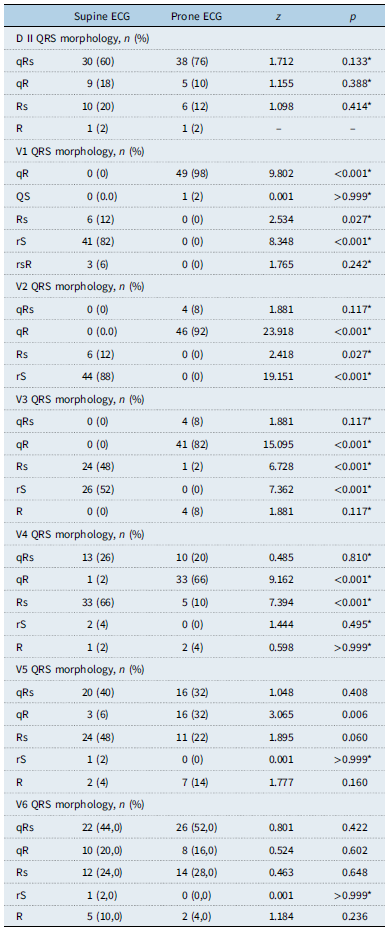
The mean T wave amplitude was negative in the precordial leads supine V1 and supine V2 and positive in supine V3–supine V6. The mean T wave amplitude was negative in prone lead prone V1 and positive in leads prone V2–prone V6. There was no ST segment elevation or depression in any lead on both supine and prone back electrocardiogram. There was no Q wave in the supine V1–supine V3 leads. There were different ratios of Q waves in the supine V4–supine V6 derivations. There were different ratios of Q waves in prone V1–prone V6 leads. (Table 2). Differences in QRS morphology were due to the varying frequency of Q wave occurrence, as well as the smaller R and S wave amplitudes in the prone V1–V5 leads. (Table 3). Figure 5 shows a schematic comparison of the amplitudes of P, Q, R, S, and T waves in supine V1–supine V6 and prone V1–prone V6 electrocardiograms.
Amplitudes of waves, Q wave present or absent, T wave inversion, or flattening in supine V1–V6 ECG and prone V1–V6 ECG
mm: millimeter, Numerical data are given as mean±standard deviation.
*Two proportions Z test with Bonferroni correction.
**Fisher’s exact test.
***For interchangeable use of supine and prone ECG values, paired sample t test result should have p value > 0.05, interclass correlation coefficient value >0.6, and confidence interval should be narrow. Specifies the waves and intervals that provide this.
QRS morphology comparison in supine DII and V1–V6 ECG versus prone DII and prone back V1–V6 ECG

Table 3 Long description
The table compares QRS morphology in supine and prone ECG leads across various derivations. It has 12 rows and 6 columns. The columns are labeled Supine ECG, Prone ECG, z, and p. The rows are labeled with different QRS morphologies such as qRs, qR, Rs, R, rS, and rsR for each lead from D II to V6. Each row shows the count and percentage of each morphology in both supine and prone positions, along with z and p values for statistical comparison. Notable trends include variations in Q wave occurrence and differences in R and S wave amplitudes between supine and prone positions.
*Two proportions Z test with Bonferroni correction.
Schematic comparison of the amplitudes of P, Q, R, S, and T waves in supine V1–supine V6 and prone V1–prone V6 electrocardiograms.

Bland–Altman plots show that as the absolute values of P, R, S, and T waves increase in supine precordial leads (supine V1–supine V5), the difference between them and prone back leads (prone V1–prone V5) increases linearly. Q wave supine precordial leads (supine V1–supine V3) were measured as zero in all children. In supine V4–supine V5, the difference between this value and the prone value shows a linear change until the Q wave becomes zero.
Discussion
Comparing changes in prone position electrocardiogram with supine position electrocardiogram in healthy children, our study provides the first and the newest data on a topic in children, which has not been published in the literature before.
-
a. We found no change in the amplitudes and durations of waves and the durations of the intervals in lead DII in prone position electrocardiogram in children. P wave axis, QRS axis, and T wave axis were all between 0° and 90° in both supine electrocardiogram and prone electrocardiogram. However, P wave axis, QRS axis, and T wave axis were smaller in prone back electrocardiogram, that is, they slightly shifted to the left.
-
b. A comparison of prone position back leads (prone V1–prone V5) and supine position precordial leads (supine V1–supine V5) showed that in the former, the mean P wave amplitude, mean R wave amplitude, mean S wave amplitude, and mean T wave amplitude were markedly smaller. Prone and supine V6s had similar mean P wave, S wave, and T wave amplitudes. The R wave amplitude was higher in prone V6.
-
c. We found that Q wave was not present in precordial leads supine V1–supine V3 in any child, present in supine V4 in some children, present in supine V5 in approximately half of the children, and present in supine V6 in most of the children; however, it was present in prone posterior leads prone V1 and prone V2 in all children while it was present in prone V3–prone V6 in most of the children.
-
d. ST segment elevation or depression were not observed in any lead in the supine and prone back electrocardiograms.
-
e. T wave inversion or flattening was present in prone V1 as in supine V1 in almost all children. We found that T wave inversion or flattening had a lower rate in leads prone V2 and prone V3 compared to leads supine V2 and supine V3. T wave inversion was absent in leads prone V4 and prone V6, as in leads supine V4 and supine V6, in almost all children.
-
f. A comparison based on QRS morphology revealed that the rS morphology was the most common morphology in supine V1–supine V3 while the Rs morphology was the most common morphology in leads supine V4–supine V5. We also found that QRS morphology changed, and the qR morphology became the most common morphology in leads prone V1–prone V5 as a result of the emergence of a Q wave. We found that the most common QRS morphology in both supine V6 and prone V6 derivations was qRs.
-
g. As the absolute values of P, R, S, and T waves increase in supine precordial leads (supine V1–supine V5), the difference between them and prone back leads (prone V1–prone V5) increases linearly.
Mangar et al. Reference Mangar, Lightly and Camporesi10 reported that electrocardiogram changes occurred solely by placing 12 paediatric patients in prone position without changing the lead positions. They reported changes in axis and QRS morphology in several leads in prone position. Ariagno et al. Reference Ariagno, Mirmiran, Adams, Saporito, Dubin and Baldwin11 obtained Holter recordings in both supine and prone positions in 16 premature infants with a corrected age of 1–3 months. They reported a longer QT interval and reduced heart rate variability in prone position. They suggested that prone position potentially increases vulnerability to the sudden infant death syndrome. Baker et al., Reference Baker, Talner and Milazzo12 on the other hand, reported that the mean QTc interval in electrocardiogram did not change by solely placing a patient in prone position without changing lead positions in healthy infants. In our study, which was conducted in healthy children, body position change alone (we did not change the positions of the limb leads) did not cause any change in the durations or amplitudes of the electrocardiogram waves or the duration of any interval in lead DII. A numerically smaller axis in the frontal plane in prone electrocardiogram in our study group can be explained by the anterior displacement of the heart in the thoracic cavity under the effect of gravity in prone position.
Similar to our study, Sanchez et al., Reference Sanchez, Farasat and Levy13 compared the electrocardiograms obtained by placing the leads in the same locations on the back in prone position with the standard electrocardiograms in 20 adult healthy participants. Prone electrocardiogram was highly compatible with standard electrocardiogram, and there was no significant difference in the QT interval measured in prone position electrocardiogram. The authors reported that prone electrocardiogram can be used for monitoring cardiac rhythm and detecting repolarisation abnormalities. Similar to our study, Daralammouri et al. Reference Daralammouri, Azamtta and Hamayel14 reported the prone posterior electrocardiogram changes obtained with electrodes placed on the back of healthy adults. They found that the mean heart rate was higher in prone position compared with supine position, whereas QRS duration and QTc interval were shorter. QRS axis was numerically smaller in prone position (40.5° ± 32°) than supine position (49° ± 28°). QRS amplitude was markedly smaller in prone posterior electrocardiogram. They reported QRS morphology changes with the appearance of Q waves in leads prone V1–prone V3 in prone back electrocardiogram.
Chieng et al. Reference Chieng, Sugumar and Kaye16 reported significantly reduced amplitudes of the R, S, and T waves in mirror-image prone back electrocardiogram among adults who were ventilated in prone position due to Coronavirus disease 2019. They reported that the qR morphology appeared in 90% of patients in leads prone V1–prone V3. Romero et al. Reference Inata, Sofue and Hatachi8 reported a significant reduction in QRS amplitude in prone back electrocardiogram in a total of 85 adults consisting of 45 patients with acute respiratory distress syndrome and 40 healthy adults. They also reported that the rate of inverted or flattened T waves was higher in leads prone V1–prone V3 compared with leads supine V1–supine V3. Since the heart is located anteriorly in the thoracic cavity, it is away from the prone electrocardiogram leads. In addition, the lungs and mediastinum intervene between the heart and the leads in prone back electrocardiogram, causing a reduction in the amplitudes of all waves, except for the Q wave, which was the case both in our study and other adult studies. There are no studies in the literature regarding the prone back electrocardiogram of children who undergo ventilation in the prone position.
Ventricular stimulation starts in the interventricular septum and propagates from left to right in the septum. Since the left ventricle is situated to the left and posteriorly while the right ventricle is located to the right and anteriorly, the Q wave, which is the first negative wave, is seen in supine left precordial leads. For the same reason, Q wave is seen in all posterior leads in prone back electrocardiogram as a requirement of the vectoral approach. This causes the QRS morphology of prone electrocardiogram to be significantly different.
In our study, the rate of T wave flattening or inversion was lower in leads prone V2 and prone V3 compared with leads supine V2 and supine V3. This difference from the adult study can be explained by a higher rate of T wave inversion or flattening in right precordial leads in supine position in children compared with adults.
As the absolute values of P, R, S, and T waves increase in supine precordial leads (supine V1–supine V5), the difference between them and prone back leads (prone V1–prone V5) increases linearly. We think that this can be explained by the vectorial approach, the location of the heart near the anterior in the chest, and the similarity of the frontal axes of P, QRS, and T waves in supine and prone electrocardiograms. It is natural that the chest leads are affected not only by the anteroposterior directions but also by the right-left and superior-inferior vectors.
There is debate regarding the optimal location of electrodes placed on the back in the prone position. Reference Cobos Gil, Diz-Díaz and Islas15 Chieng et al. Reference Chieng, Sugumar and Kaye16 obtained three different ECGs in 100 adult Coronavirus disease 2019: standard supine front; prone position with precordial leads attached to the front; and prone back in anatomical mirror position. In the supine V1–supine V3 derivations, they reported that in cases of anterior ischaemia with ST segment changes, this finding was not observed in the prone back ECG. Therefore, the authors stated that the prone back ECG is not reliable for detecting anterior myocardial damage in chest derivations. Similarly, Zhang et al. Reference Zhang, Liu and Chen17 reported how the prone back ECG obtained from a 70-year-old patient ventilated in the prone position in the “anatomical mirror position” could miss ST segment elevation in the anterior leads. Prone DII ECG provides quite clear and accurate information for rhythm and interval measurements, as in our study. Thus, a new prone ECG acquisition method based on the “mirror-image electrocardiogram concept” reported by Kors JA. and van Herpen Reference Kors and van Herpen18 has been revisited. The ECG obtained with this method may show morphological findings similar to the standard ECG.
Study limitations
The study was conducted in Turkish children only. The other limitations of our study were that the children were in a certain age range and their number was relatively small. The study only included prone back ECG findings in healthy children in the prone position. The study does not include ECG findings in children with myocarditis, myocardial damage, ischaemia, structural heart disease, or conduction system pathology. The study does not include prone back electrocardiogram findings in children ventilated in the prone position.
Conclusions
The duration and amplitudes of the waves and the duration of the intervals do not change in lead DII in prone back electrocardiogram in healthy children. P wave axis, QRS axis, and T wave axis were numerically smaller in prone back electrocardiogram, that is, they slightly shifted to the left. The amplitudes of all waves other than Q wave were markedly diminished in prone back electrocardiogram leads in healthy children (except for prone V6). The Q wave was seen in all children in prone V1 and prone V2 and in most children in leads prone V3–prone V6. ST segment elevation and depression were not observed in any leads in supine and prone back electrocardiograms. T wave flattening or inversion in leads prone V2 and prone V3 was less common compared with leads supine V2 and supine V3 in healthy children. The QRS morphology in prone back leads electrocardiogram is generally in the form of qR in healthy children (except for prone V6).
The data obtained from this study may make it possible to correctly interpret prone back electrocardiogram in children. Prone back electrocardiogram lead DII may be used to accurately interpret the amplitudes and durations of the waves and the durations of the intervals. The low amplitude seen in the P wave, R wave, S wave, and T wave in the prone dorsal leads (prone V1–prone V5) should not be misinterpreted as voltage depression. Since Q waves is observed in leads prone V1 and prone V2 in prone back electrocardiogram in all children, and leads prone V3 and prone V6 in most children, this normal finding will not be falsely interpreted. The absence of ST depression and elevation in prone back electrocardiogram indicates that prone back electrocardiogram is quite useful for the interpretation of myocardial inflammation and injury with electrocardiogram. T wave inversion in lead prone V1, as in supine V1, should be remembered as a common electrocardiogram feature in children and should not be erroneously interpreted as a pathological finding. The lower the P, R, S, and T wave amplitudes in supine precordial leads, the more similar they are to the amplitudes of the aforementioned waves obtained from the prone back lead. The higher the P, R, S, and T wave amplitudes in supine precordial leads, the less similar they are to the amplitudes of the aforementioned waves obtained from the prone back lead.
The prone back electrocardiogram can be considered as an alternative method for cases where electrocardiogram cannot be taken in supine position. Interpreting prone back electrocardiograms keeping all these changes in mind is essential for a clinical approach. There is a need for comprehensive studies involving all age groups. Studies should be conducted on prone back electrocardiogram changes in children with acquired/CHD and conduction system disorders. Comprehensive studies should also be conducted on prone back electrocardiogram findings in children who undergo ventilation in the prone position. Studies should be performed on a large sample of healthy children of all ages.
Acknowledgments
We thank our nurse, Fatma Karataş, who recorded the electrocardiograms with great care, and our medical secretary Tülin Ateş, who recorded the demographic data of the patients with great care.
Author contribution
The authors confirm contribution to the paper as follows: study conception and design: MA; data collection: MA, GNY, GK, KY, ENK, HKK, MZT, MK, MAD, SS, and FE; analysis and interpretation of results: MA, FE, and NN; draft manuscript preparation: MA, GNY, GK, KY, ENT, and FE. All authors reviewed the results and approved the final version of the manuscript.
Financial support
None.
Competing interests
The authors declare no competing interests.
Ethical standard
This study was approved by local clinical research ethics committee (December/2022, No: 752). The study was conducted in accordance with the declaration of Helsinki. Informed consent was obtained from the parents of all patients.
Consent to participate
Written informed consent to participate in this study was provided by participants’ parents.




 Open access

