

INTRODUCTION
Radiological characterization is important for the management of irradiated graphite for all graphite-moderated reactors (Magnox, AGR, HTR, RBMK) and new HTR reactor designs (generation IV reactors VHTR or MSR) for decommissioning in the choice of graphite treatment or storage methods (Fachinger et al. Reference Fachinger, von Lensa and Podruhzina2008). For graphite treatment, disposal, or recycling, the concentration of radioactive contaminants in spent graphite should be identified. The trace impurities (<0.01% wt) during 20–30 years of irradiation in the neutron flux are transmuted into the long-lived nuclides (e.g. 14C, 36Cl, isotopes of Np, Pu, Am, Cm).
The Ignalina Nuclear Power Plant (INPP) operated two RBMK-1500 water-cooled graphite-moderated channel-type power reactors. The total mass of graphite in the cores of both units at INPP is about 3600 tons. Graphite in the RBMK reactor column is made of GR-280 type graphite blocks, stacked on each other. The fuel/control channels inside the graphite stack are surrounded by graphite sleeves (GRP-2-125 grade graphite). Radiological characteristics of the RBMK graphite are crucial in the choice of the irradiated graphite treatment technology (either geological disposal, landfill storage or recycling). Both modeling and experiments should be combined in order to determine the long-lived induced activity of graphite (Remeikis et al. Reference Remeikis, Plukis, Juodis, Gudelis, Lukauskas, Druteikiene, Lujaniene, Luksiene, Plukiene and Duskesas2009).
To characterize the radioactive waste the experimentally validated model was developed for simulation of radiological characteristics of different parts of nuclear reactor during operation and decommissioning periods (Plukiene et al. Reference Plukiene, Plukis, Puzas, Remeikis, Duskesas and Germanas2011) using experimentally obtained graphite impurity concentrations and the available data from the scientific literature, which is limited for this specific sort of nuclear graphite (Ancius et al. Reference Ancius, Remeikis, Plukis, Plukiene, Ridikas and Cometto2005; Puzas et al. Reference Puzas, Remeikis, Ezerinskis, Serapinas, Plukis and Duskesas2010). As the calculation of neutron activation graphite structures has revealed that the principal uncertainty of induced activity is due to a high variation of impurity concentrations in nuclear graphite, it is extremely important to determine the impurity concentration in several samples from different graphite construction parts (Plukiene et al. Reference Plukienė, Plukis, Barkauskas, Gudelis, Gvozdaitė, Duškesas and Remeikis2014).
As mentioned above, there are several sorts of nuclear graphite (graphite sleeve, bushings—GRP-2-125, and graphite stack GR-280) used for RBMK reactor constructions (Almenas et al. Reference Almenas, Kaliatka and Ušpuras1998; Narkūnas et al. Reference Narkūnas, Smaizys and Poskas2005). The presence of impurities is due to the raw and additive materials involved in the fabrication of nuclear graphite. Concentration of impurities may vary depending on the production factory. Different batches of product of the same factory may have different impurity distributions (depending on the graphitization process temperature, etc.). The reactor grade graphite is obtained by purifying (combination of thermo diffusion and chemical purification using halides, freons or halide salts) the initial raw material or using materials of the highest purity in the process of graphitization. The documentation on the production graphite impurity concentration is limited as purification was mostly performed to reduce the concentration of neutron absorbing impurities (such as Li, B, Cd, or other rare earth metals) to obtain not higher than the 4.5–4.8 mb of thermal neutron absorption cross-section for graphite (Bushuev et al. Reference Bushuev, Zubarev and Proshin2002), without a detailed list of other (not so important for reactor operation) impurities. Several studies on the identification of the impurity concentrations in graphite from commercial and RBMK reactors have been performed by neutron activation and mass spectrometry methods (Virgiliev et al. Reference Virgiliev and Vlasov1994; Bulanienko et al. Reference Bulanienko, Frolov and Nikloaiev1996; Virgiliev Reference Virgiliev1998; Bylkin et al. Reference Bylkin, Davydova, Krajushkin and Shapovnikov2004). Concerning the RBMK-1500 graphite due to limited accessibility to the nuclear power plant samples only a few graphite sleeve samples were investigated previously (Ancius et al. Reference Ancius, Remeikis, Plukis, Plukiene, Ridikas and Cometto2005; Puzas et al. Reference Puzas, Remeikis, Ezerinskis, Serapinas, Plukis and Duskesas2010).
In this study, the stack, sleeve, and bushing samples of the virgin RBMK-1500 graphite were used for the determination of impurities in different graphite constructions. The use of non-destructive INAA and PGAA methods is extremely important as the total volume of the graphite sample is examined to obtain information whether impurities are more or less homogeneously distributed in the graphite matrix; this is especially important for U and Th impurities for the 3D reactor model validation. The features of different methods (INAA, PGAA, ICP-MS) for estimation of some nuclide groups have been discussed in this paper. Moreover, intercomparison of results obtained by different methods allows validation of the less sensitive but more affordable method such as ICP-MS, which provides higher uncertainties, but does not require thermal neutron source for analysis. Identification of the impurity concentration limits in the RBMK graphite samples has been performed for some key nuclides which can be detected by nuclear spectrometry in the spent graphite. This study is important for the development of management technologies of the irradiated graphite, especially for RBMK-type reactors.
SAMPLES AND EXPERIMENTAL METHODS
Instrumental Neutron Activation Analysis (INAA)
Six non-irradiated samples from different RBMK-1500 graphite construction parts, namely the stack, sleeve and bushing, were provided for INAA: N1: 2.205 g stack graphite; N2: 2.112 g bushing graphite; N3: 1.902 g sleeve graphite (all cut with the saw, without treatment); N4: 2.204 g stack graphite (treated with mix of HCl+HF for elimination of possible metals from the surface, H2O); N5: 2.433 g stack graphite (washed with H2O in ultrasound); N6: 1.982 g sleeve graphite (treated in the same way as sample N4). After crushing between polyethylene sheets, sample aliquots with masses 100.16 mg to 100.79 mg were analyzed using short-time irradiation (2 min), whereas for long-time irradiation (3 hr) the aliquot masses were in the range 99.95–100.94 mg. Irradiations were carried out in the LVR-15 experimental reactor (Research Centre Řež, Ltd.), at a thermal neutron fluence rate of 3×10¹³n cm–2s–1. The induced radionuclides were measured with high efficiency, high resolution coaxial High Purity Ge (HPGe) detectors after several decay times to achieve detection limits of elements determined as low as possible. Other details have already been given elsewhere (Kučera et al. Reference Kučera, Bennett, Oflaz, Paul, Fernandes, Kubešová, Bacchi, Stopic, Sturgeon and Grinberg2015). Altogether 45 elements were determined. For quality control purposes, U.S. NIST standard reference material (SRM) NIST SRM 1515 Apple Leaves was analyzed The results were in agreement with the NIST certified values within uncertainty margins or were very close to noncertified values, thus proving the accuracy of our results. The only exception is sodium, for which we are finding consistently higher results (30–38 ppm) compared with the NIST certified value (24.2 ppm±2.1 ppm). The probable explanation is contamination with sodium due to corrosion of the glass bottle, in which the material was distributed by NIST, over the time (Kameník et al. Reference Kameník, Kučera, Borovička and Havránek2015). All samples were analyzed in duplicates and the mean value was used for a further evaluation.
Prompt Gamma Activation Analysis (PGAA)
Three non irradiated samples from different RBMK-1500 graphite construction parts, namely the stack and sleeve were analyzed using the prompt gamma activation (PGAA): P1: 1.8929 g stack graphite (cut with the saw, treated with mix of HCl+HF for elimination of metals from the surface, H2O); P2: 1.567 g stack graphite (spall, treated with H2O); This sample was also used for control of possible Cl adhesion in other two samples. P3: 1.7594 g sleeve graphite (the same treatment as for sample P1).
The measurements were performed at Heinz Maier-Leibnitz Zentrum (Révay et al. Reference Révay, Kudejová, Kleszcz, Söllradl and Genreith2015) by prompt gamma activation analysis. For irradiation 20 MW water cooled heavy-water moderated reactor with thermal neutron fluence rate of 2×10¹⁰n cm–2 s–1 was used. For gamma detection the Compton-suppression spectrometer was used (60% HPGe detector surrounded by a BGO scintillator and connected in anticoincidence mode).
PGAA is based on the radioactive neutron capture and the characteristic gamma ray emission by excited (impurity) nucleus  $${}_{Z}^{A} X{\plus}n{\equals}{}_{Z}^{{A{\plus}1}} X{\asterisk}{\plus}\gamma $$
. Both neutrons and gammas are highly penetrating and pass through whole volume of the sample with almost no attenuation (for gamma rays). Shielding materials (Pb,6Li, B) can affect the results and they have to be taken into account by evaluating the results of analogous impurities in the sample. PGAA is much better for determination of light and rare earth elements in the matrix material compared with INAA, but analysis of the spectra is more complicated in the PGAA case (Révay Reference Révay2009).
$${}_{Z}^{A} X{\plus}n{\equals}{}_{Z}^{{A{\plus}1}} X{\asterisk}{\plus}\gamma $$
. Both neutrons and gammas are highly penetrating and pass through whole volume of the sample with almost no attenuation (for gamma rays). Shielding materials (Pb,6Li, B) can affect the results and they have to be taken into account by evaluating the results of analogous impurities in the sample. PGAA is much better for determination of light and rare earth elements in the matrix material compared with INAA, but analysis of the spectra is more complicated in the PGAA case (Révay Reference Révay2009).
Inductively Coupled Plasma Mass Spectrometry (ICP-MS)
The virgin RBMK-1500 graphite samples have been investigated using the double focusing high resolution sector field inductively coupled plasma mass spectrometer Element 2 (Thermo Scientific) at CPST (Lithuania). Six samples from different RBMK-1500 graphite construction parts: 2 stack, 2 sleeve, and 2 bushing samples were analyzed. M1: 0.1958 g sleeve graphite; M2: 0.2066 g sleeve graphite; M3: 0.2137 g stack graphite; M4: 0.2055 g stack graphite; M5: 0.2092 g bushing graphite; M6: 0.2014 g bushing graphite.
In order to prepare graphite samples for ICP-MS measurements, a chemical destruction of the samples was performed. The weighed graphite was placed in a clean tube. H2SO4: HNO3: HClO4=15: 4: 1 acid mixture was used to dissolve the sample. The chemical destruction of the sample was carried out by heating the tube. The procedure was repeated until a clear solution was obtained (approximately 7 times). The resulting solution was evaporated to give dry precipitate. The dissolved residue was measured using an ICP-MS spectrometer. For the solution-based analysis the Multi-Element standard solution VI CertiPUR (Merck, Darmstadt, Germany) of the concentration of 1 ppb was used for the optimization and calibration of the ICP-MS instrument.
INAA&GDMS, ICP-MS—Review of Previous RBMK-1500 Graphite Analysis Results
The experimental investigation of impurities in the INPP graphite sleeve samples using the neutron activation analysis (irradiation at ORPHEE (Φth=[1.2–2.5]×1013 cm–2 s–1) and OSIRIS (Φfast=2×1013 cm–2 s–1) and the GDMS was performed previously in collaboration with CEA (France) (Ancius et al. Reference Ancius, Remeikis, Plukis, Plukiene, Ridikas and Cometto2005) as well as at CPST (Lithuania) using high resolution ICP-MS technique (Puzas et al. Reference Puzas, Remeikis, Ezerinskis, Serapinas, Plukis and Duskesas2010). However, not all important impurity elements (Li, N, Nb, Pb) can be quantified by the gamma spectrometry after irradiation. Higher uncertainties of ICP-MS can be related to the complicated graphite chemical preparation procedure (graphite disarrangement with ultra pure acid, ultra clean dishes, etc.).
RESULTS
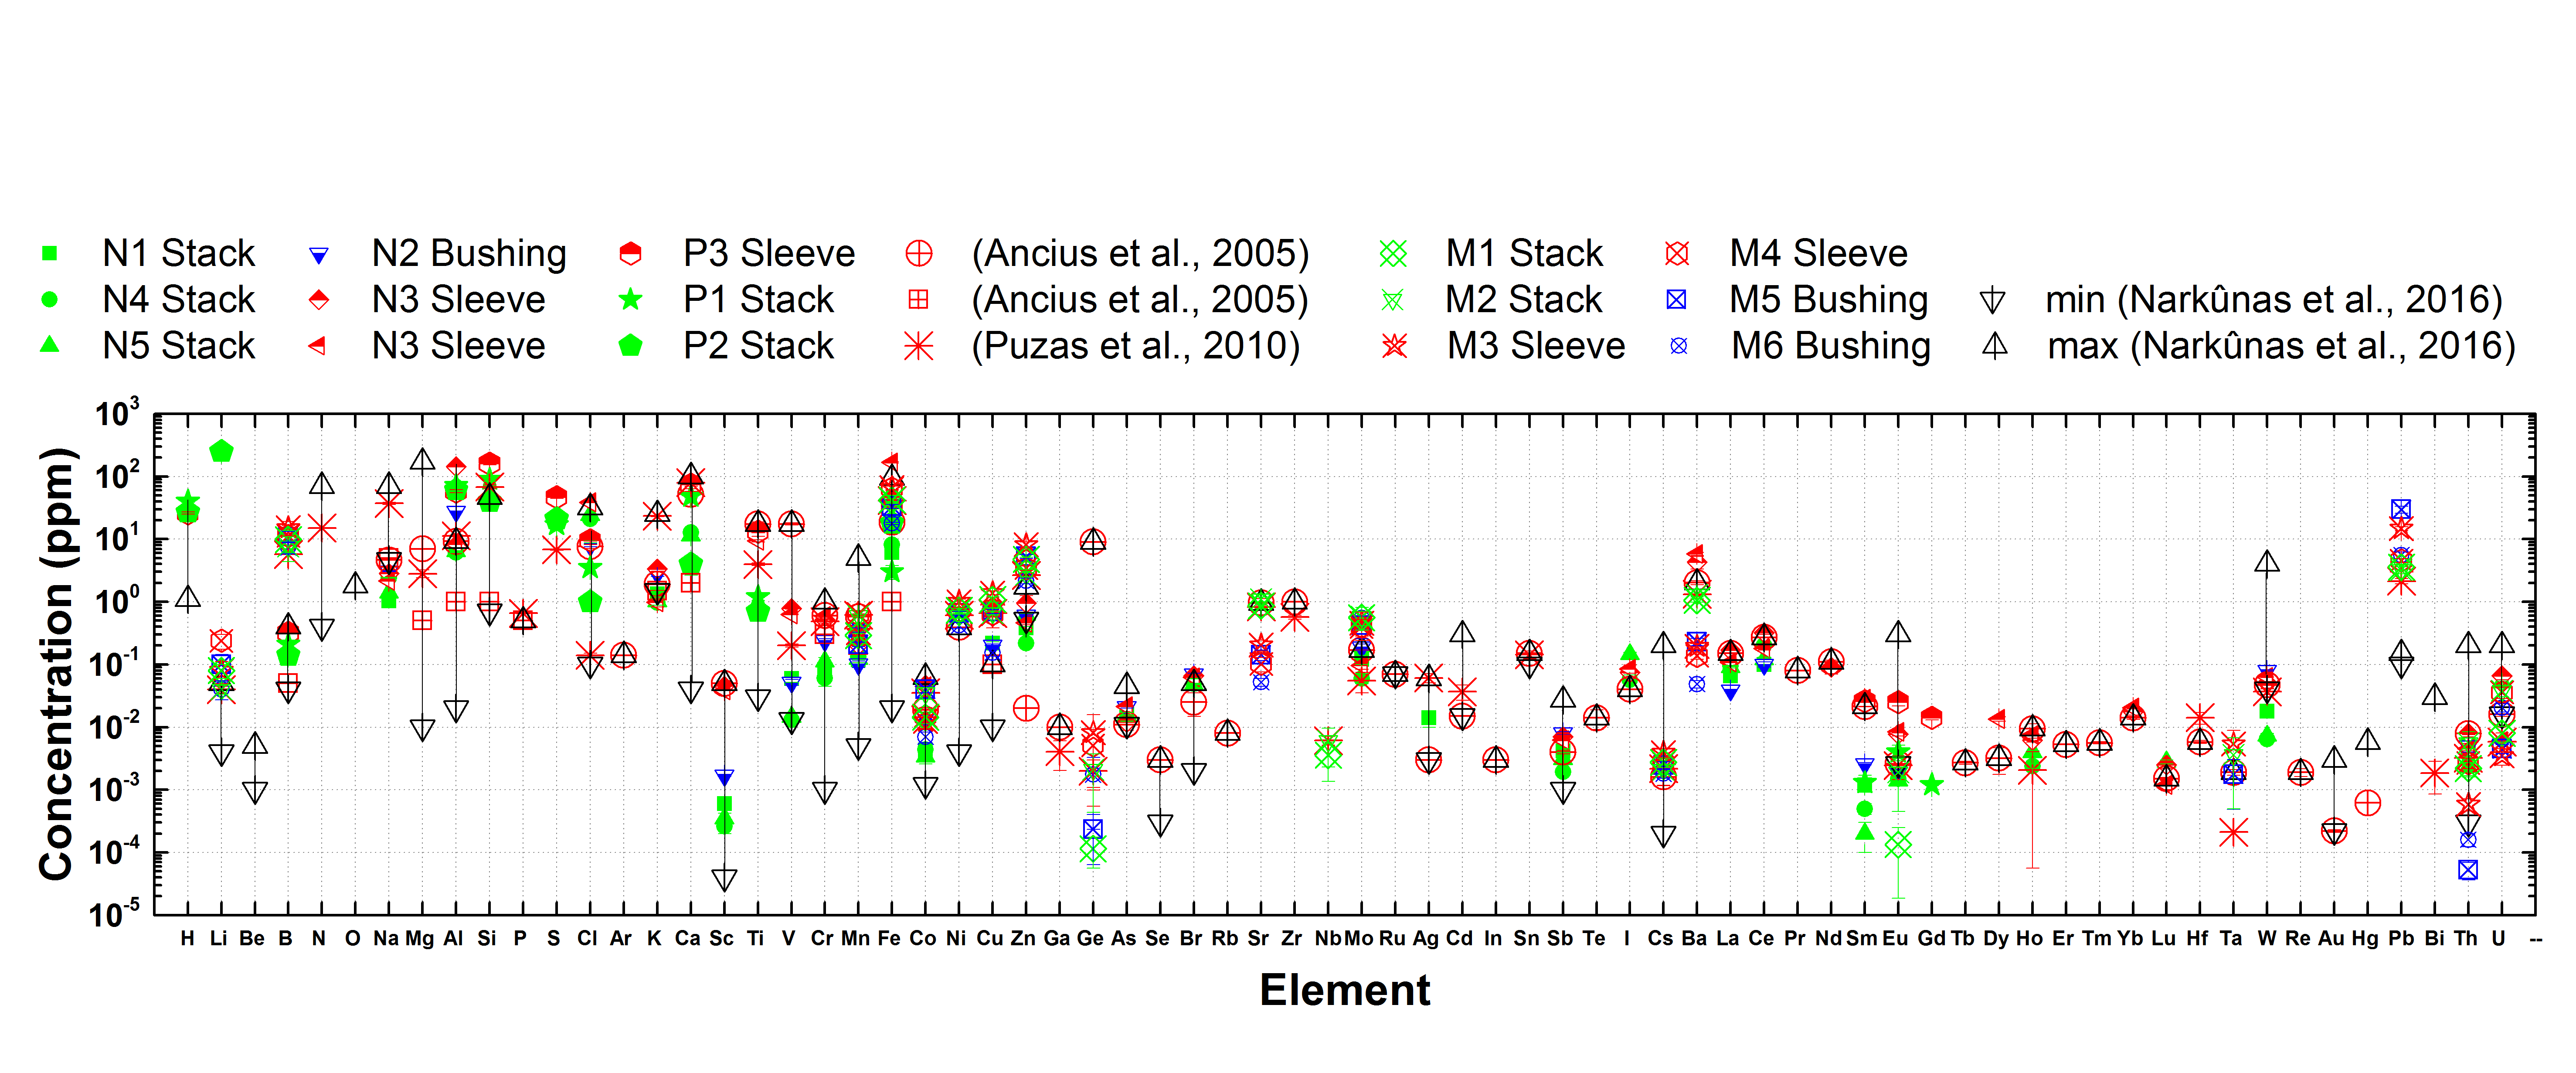
Fifteen graphite samples from different RBMK-1500 graphite construction parts, namely the stack, sleeve and bushings, were analyzed using INAA, PGAA, and ICP-MS methods and compared with those previously measured ones by (Ancius et al. Reference Ancius, Remeikis, Plukis, Plukiene, Ridikas and Cometto2005) and (Puzas et al. Reference Puzas, Remeikis, Ezerinskis, Serapinas, Plukis and Duskesas2010). The impurities of the RBMK-1500 graphite stack and bushing samples were analyzed for the first time. All the results from INAA, PGAA, ICP-MS and GDMS measurements are summarized in Figure 1. The actual measurements were compared with the minimal and maximal limits of impurity concentrations used in the modeling (Narkūnas et al. Reference Narkūnas, Šmaižys, Poškas and Bartkus2016).
Comparison of measurement results (INAA (indicated as N1-N6 samples), PGAA (P1-P3), ICP-MS (M1-M6) and previous INAA&GDMS(2005) (N and G samples), ICP-MS (2010) (M1-M6 samples) of impurities in the virgin RBMK-1500 graphite samples. The stack is in green color, sleeve in red color, and bushing in blue color. The minimal and maximal concentrations taken from (Narkūnas et al. Reference Narkūnas, Šmaižys, Poškas and Bartkus2016) are indicated by black open-triangles. (Please see electronic version for color figures.)
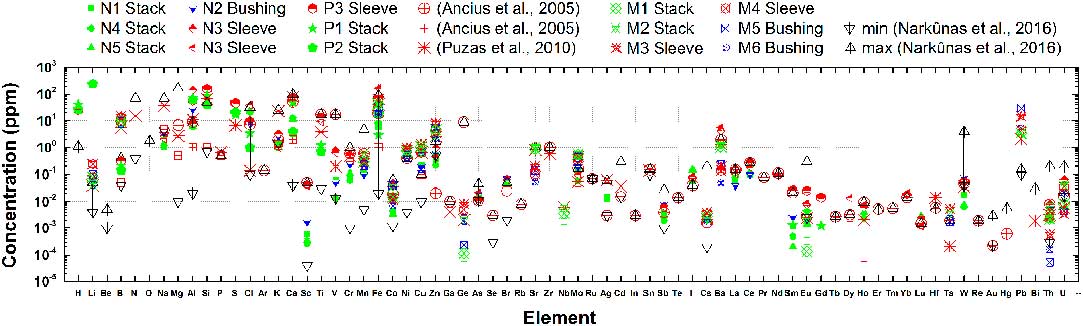
Seven elements, Al, Cl, Ca, Ti, Fe, Sm, and Eu, were measured by all three analysis methods PGAA, INAA, and ICP-MS. PGAA results agree with INAA results within the uncertainty range almost for all measured nuclides: Cl (in sleeve), Ca (sleeve), Ti (sleeve and stack), Fe (sleeve and stack), Sm (sleeve and stack). The Cl concentration obtained by the PGAA method is lower in the stack compared with the INAA method, but it is higher than the obtained value by ICP-MS (Puzas et al. Reference Puzas, Remeikis, Ezerinskis, Serapinas, Plukis and Duskesas2010). In the new ICP-MS measurements Cl was eliminated due to the graphite sample preparation with a mixture of H2SO4+ HNO3+ HClO4.
The PGAA Ca value agrees well compared both the ICP-MS and INAA result for the sleeve sample and is 2–10 times less in the graphite stack. This is important as 41Ca is the long-lived nuclide and its clearance level is very important for the radioactive waste classification in some countries (for instance in Lithuania). One of the most interesting impurities obtained by PGAA that had not been detected before with other techniques is Gadolinium. Gd in the activation with fast neutrons (158Gd[n,p]158Tb) results in long-lived 158Tb (180 yr) and may be important for the graphite sleeve (as more exposed to the harder neutron spectrum in the RBMK-1500). This should be checked by modeling and reveal or deny the importance of such an activation pathway.
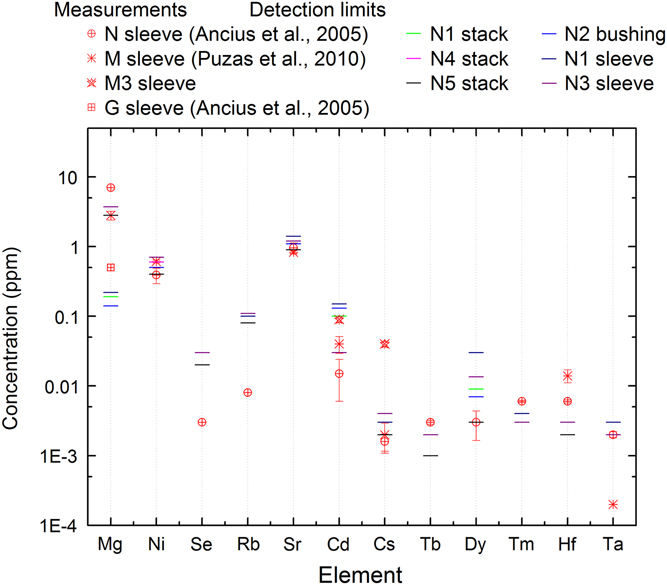
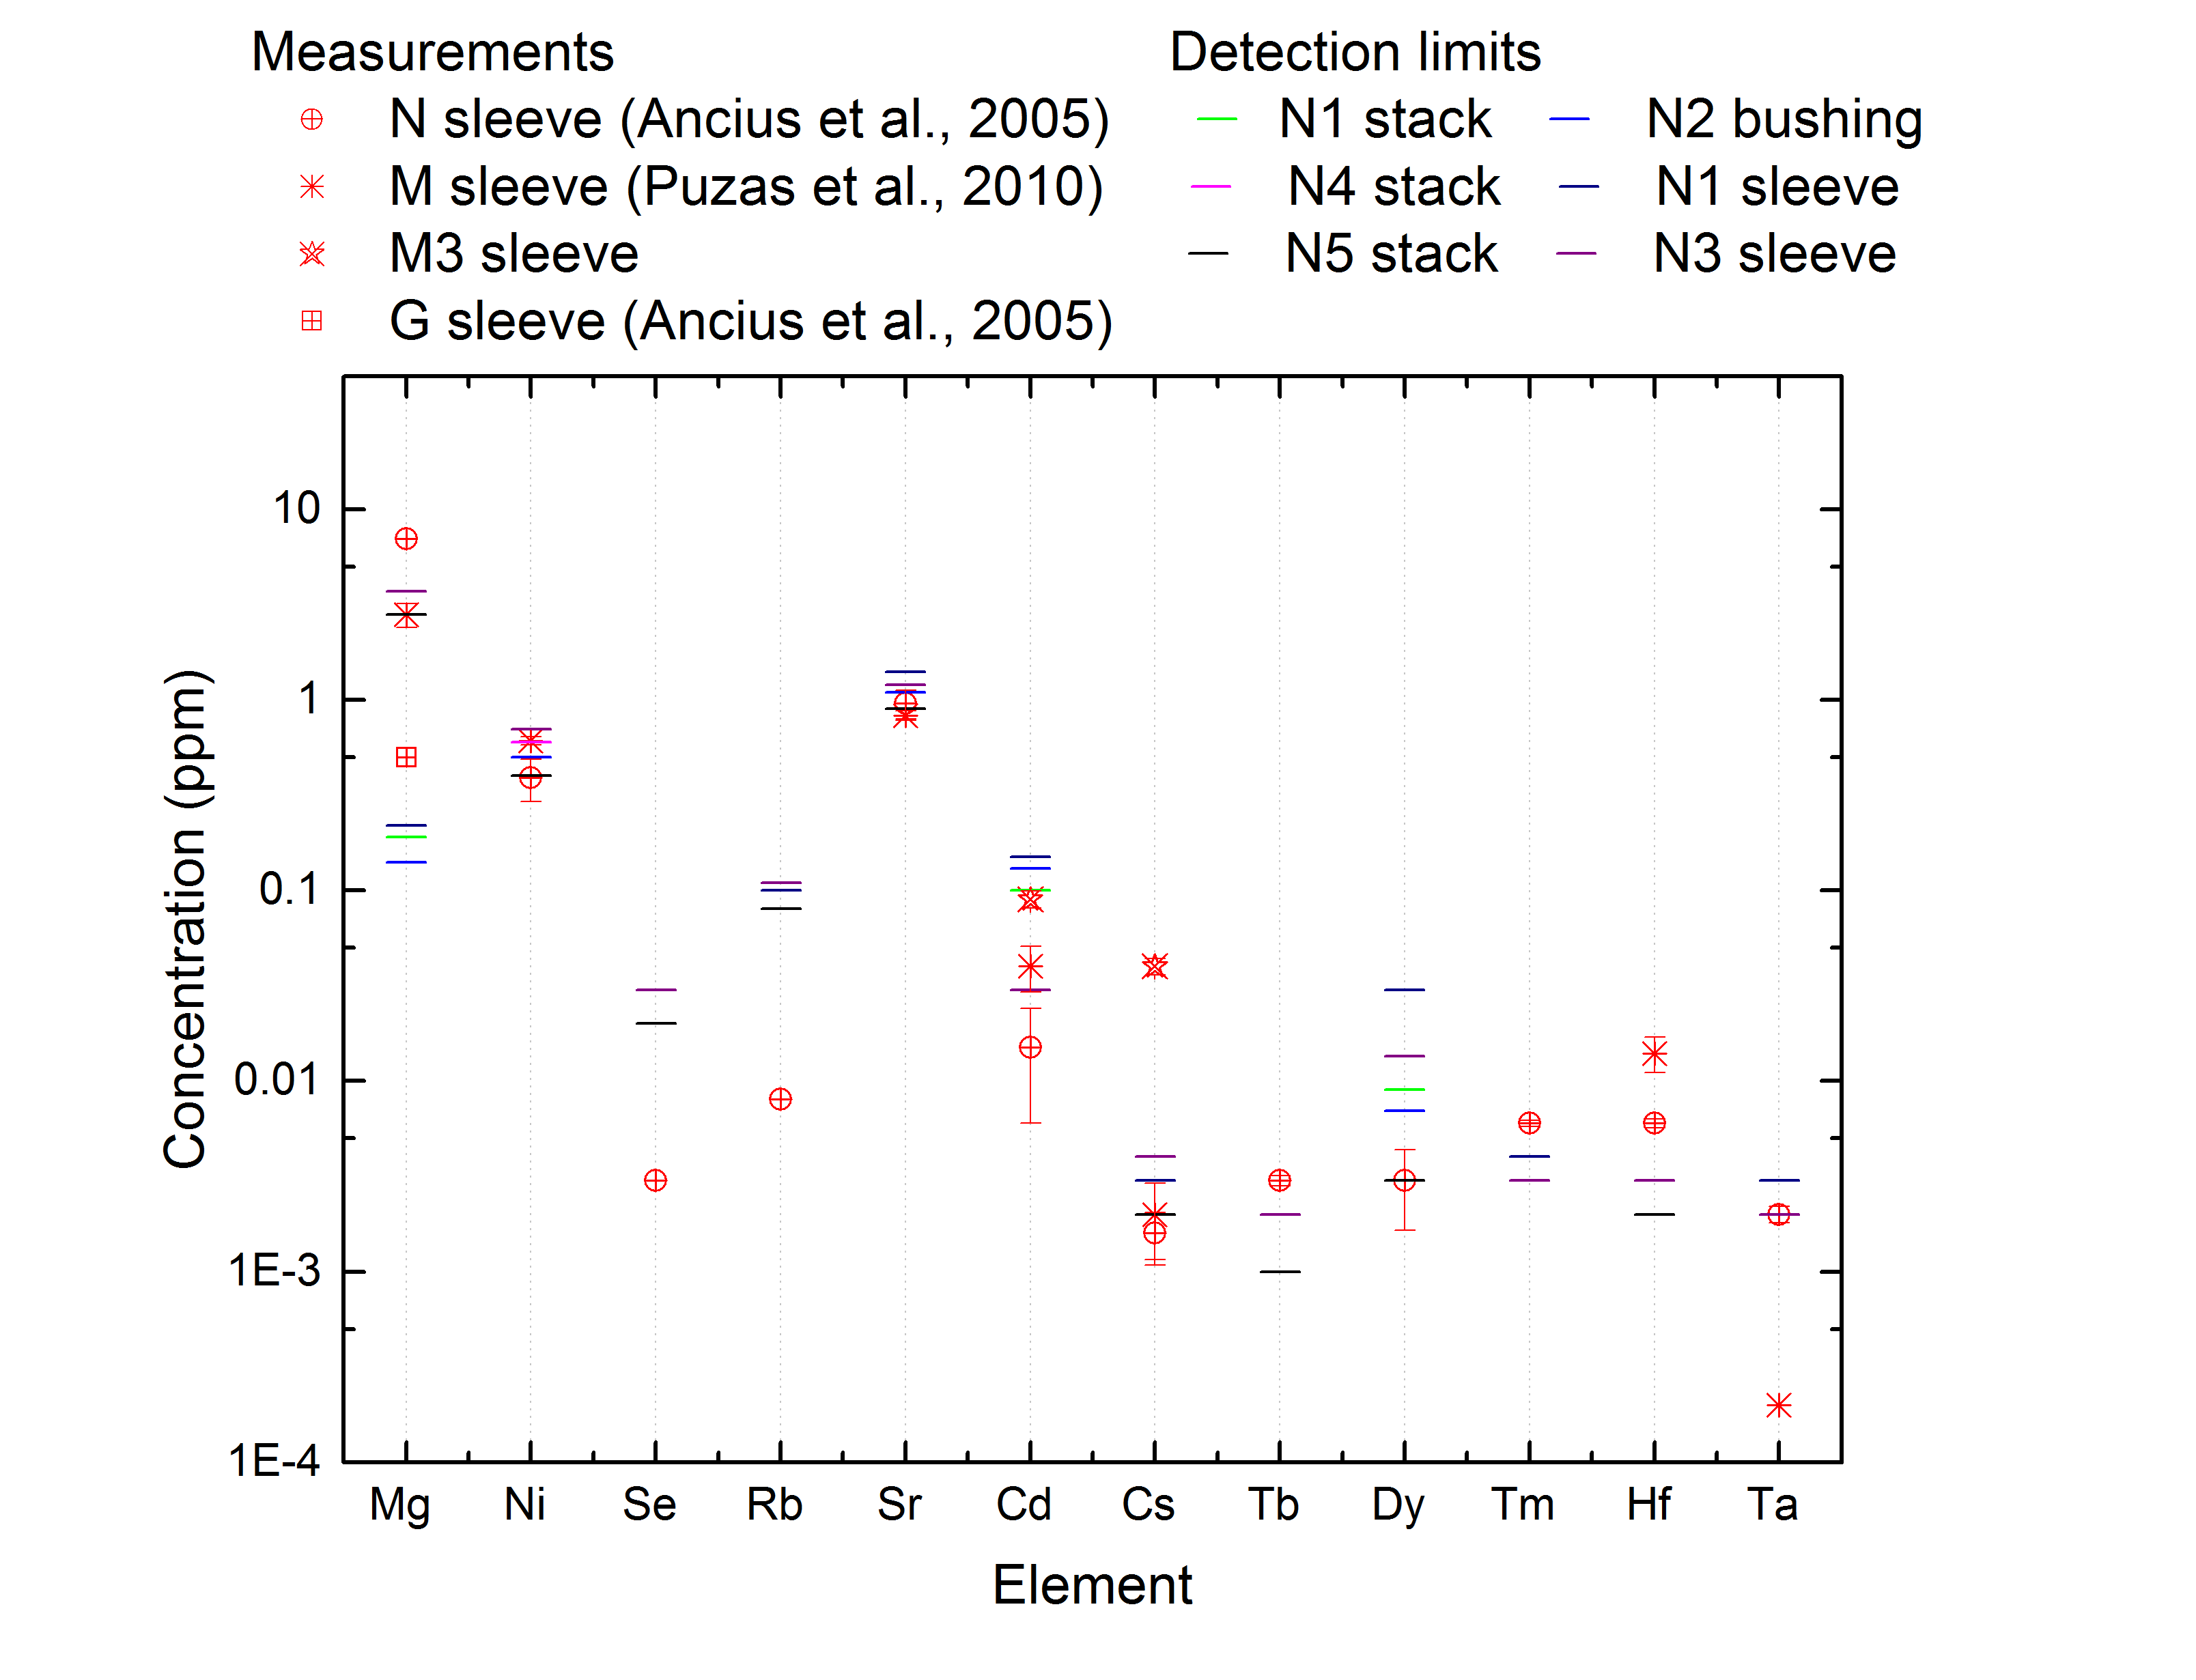
Generally, for all measured impurities, concentrations may vary by the orders of magnitude compared results between stack/sleeve or bushing materials and comparing the same construction material but of different sample. Concerning some elements for which in all INAA cases (stack, bushing, and sleeve) only detection limits have been estimated, their concentrations are mostly below the estimated impurity values measured by other methods as it is presented in Figure 2. INAA detection limits for Ni, Se, Rb, Sr, Dy, and Ta impurities could be used as the impurity concentration limit in a certain graphite construction.
Comparison of estimated detection limits of INAA for certain elements with measurement results by INAA&GDMS (Ancius et al. Reference Ancius, Remeikis, Plukis, Plukiene, Ridikas and Cometto2005) and ICP-MS (Puzas et al. Reference Puzas, Remeikis, Ezerinskis, Serapinas, Plukis and Duskesas2010) in virgin RBMK-1500 graphite samples.
Other elements that have been measured in the graphite samples by INAA, INAA&GDMS, and ICP-MS methods are presented in Figure 1, where a certain construction (stack, sleeve, or bushing) is indicated by a different color. RBMK-1500 graphite sleeve impurity values determined by INAA agree well with INAA&GDMS results for the most of nuclides. Slightly different impurity concentrations have been obtained for Mg, Al, V, Fe, Co, Zn, and U. Higher disagreement in graphite impurity concentrations for the graphite sleeve samples has been obtained comparing INAA and ICP-MS methods: Na (3 vs. 37 ppm); Al (144 vs. 11 ppm); Cl (10 vs. 0.14 ppm); K (3 vs. 23 ppm); Ti (12 vs. 4 ppm); Mo (0.4 vs. 0.05 ppm); Ba (4.3 vs. 1.3 ppm); U (0.066 vs. 0.006 ppm), for other impurities the obtained concentration values are comparable.
It was noted before that the impurities of the RBMK-1500 graphite stack samples were analyzed for the first time. As it appears from the results summarized in Figure 1— the stack (green symbols) is “cleaner” in comparison with the graphite sleeve and bushing material. Moreover, a similar conclusion can be drawn from PGAA results by comparing sleeve and stack impurities. Concentration for almost all PGAA detected elements with the exception of Al is lower in the stack of the RBMK-1500 graphite. The ICP-MS measurements performed in different stack, sleeve, and bushing graphite samples contrary to the INAA method results do not show the cleaner “stack” construction, and this may be related to the small sample used for the analysis and higher uncertainty of the method.
There are several light elements detected by the PGAA method that are summarized and compared in Table 1. The presence of Li in the graphite stack sample P2 in such a big quantity is doubtful as it is not determined in other samples and it would dramatically change the neutron multiplication coefficient (keff) of the system and should be better controlled in the nuclear graphite production (as in Bushuev et al. Reference Bushuev, Zubarev and Proshin2002, thermal neutron absorption cross section of graphite does not exceed 4.5–4.8 mb). H in PGAA can partly be explained by the sample treatment with H2O (humidity). B concentration of ~0.22 ppm detected by PGAA is in the same range for all three samples and is in between of the previous measurements (by ICP-MS and GDMS). B impurity concentration should be corrected in the model as too high value is used before now.
PGAA, ICP-MS, and GDMS impurity concentration of graphite samples and concentration used in the modeling of graphite activation of RBMK-1500.
* Data from Ancius et al. (Reference Ancius, Remeikis, Plukis, Plukiene, Ridikas and Cometto2005) and citations therein.
It was expected to obtain the N impurity (a 14C precursor) concentration by PGAA as it is impossible to measure it by other methods. But the result was not convincing, though it was measured in vacuum, still it had some N background from the neutron scattering in the graphite and interaction with N in the atmosphere. Currently the 15 ppm concentration of N is used in the model according to the experimental results of irradiated graphite (Remeikis et al. Reference Remeikis, Plukis, Plukienė, Garbaras, Barisevičiūtė, Gudelis, Gvozdaitė, Duškesas and Juodis2010). The S concentration detected by the PGAA method is higher compared with ICP-MS but values are in the same range if compared with values from the literature (Ancius et al. Reference Ancius, Remeikis, Plukis, Plukiene, Ridikas and Cometto2005).
The data about different impurity concentrations of some important nuclides (B, Ca, Gd) obtained PGAA are of great value.
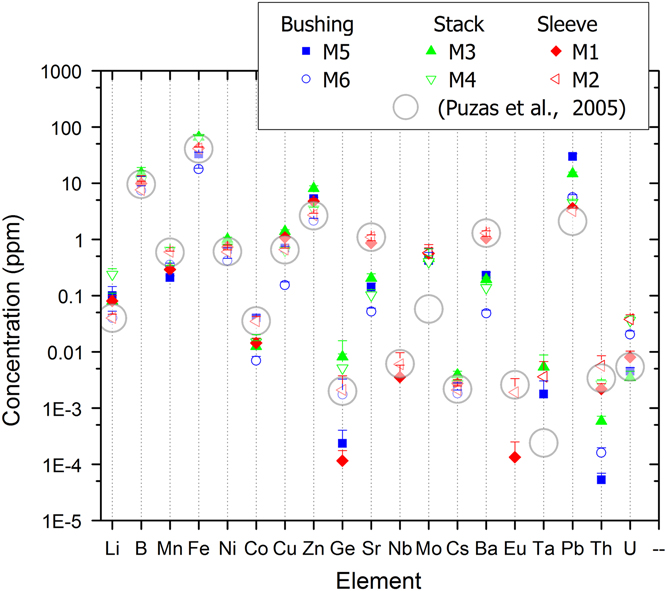
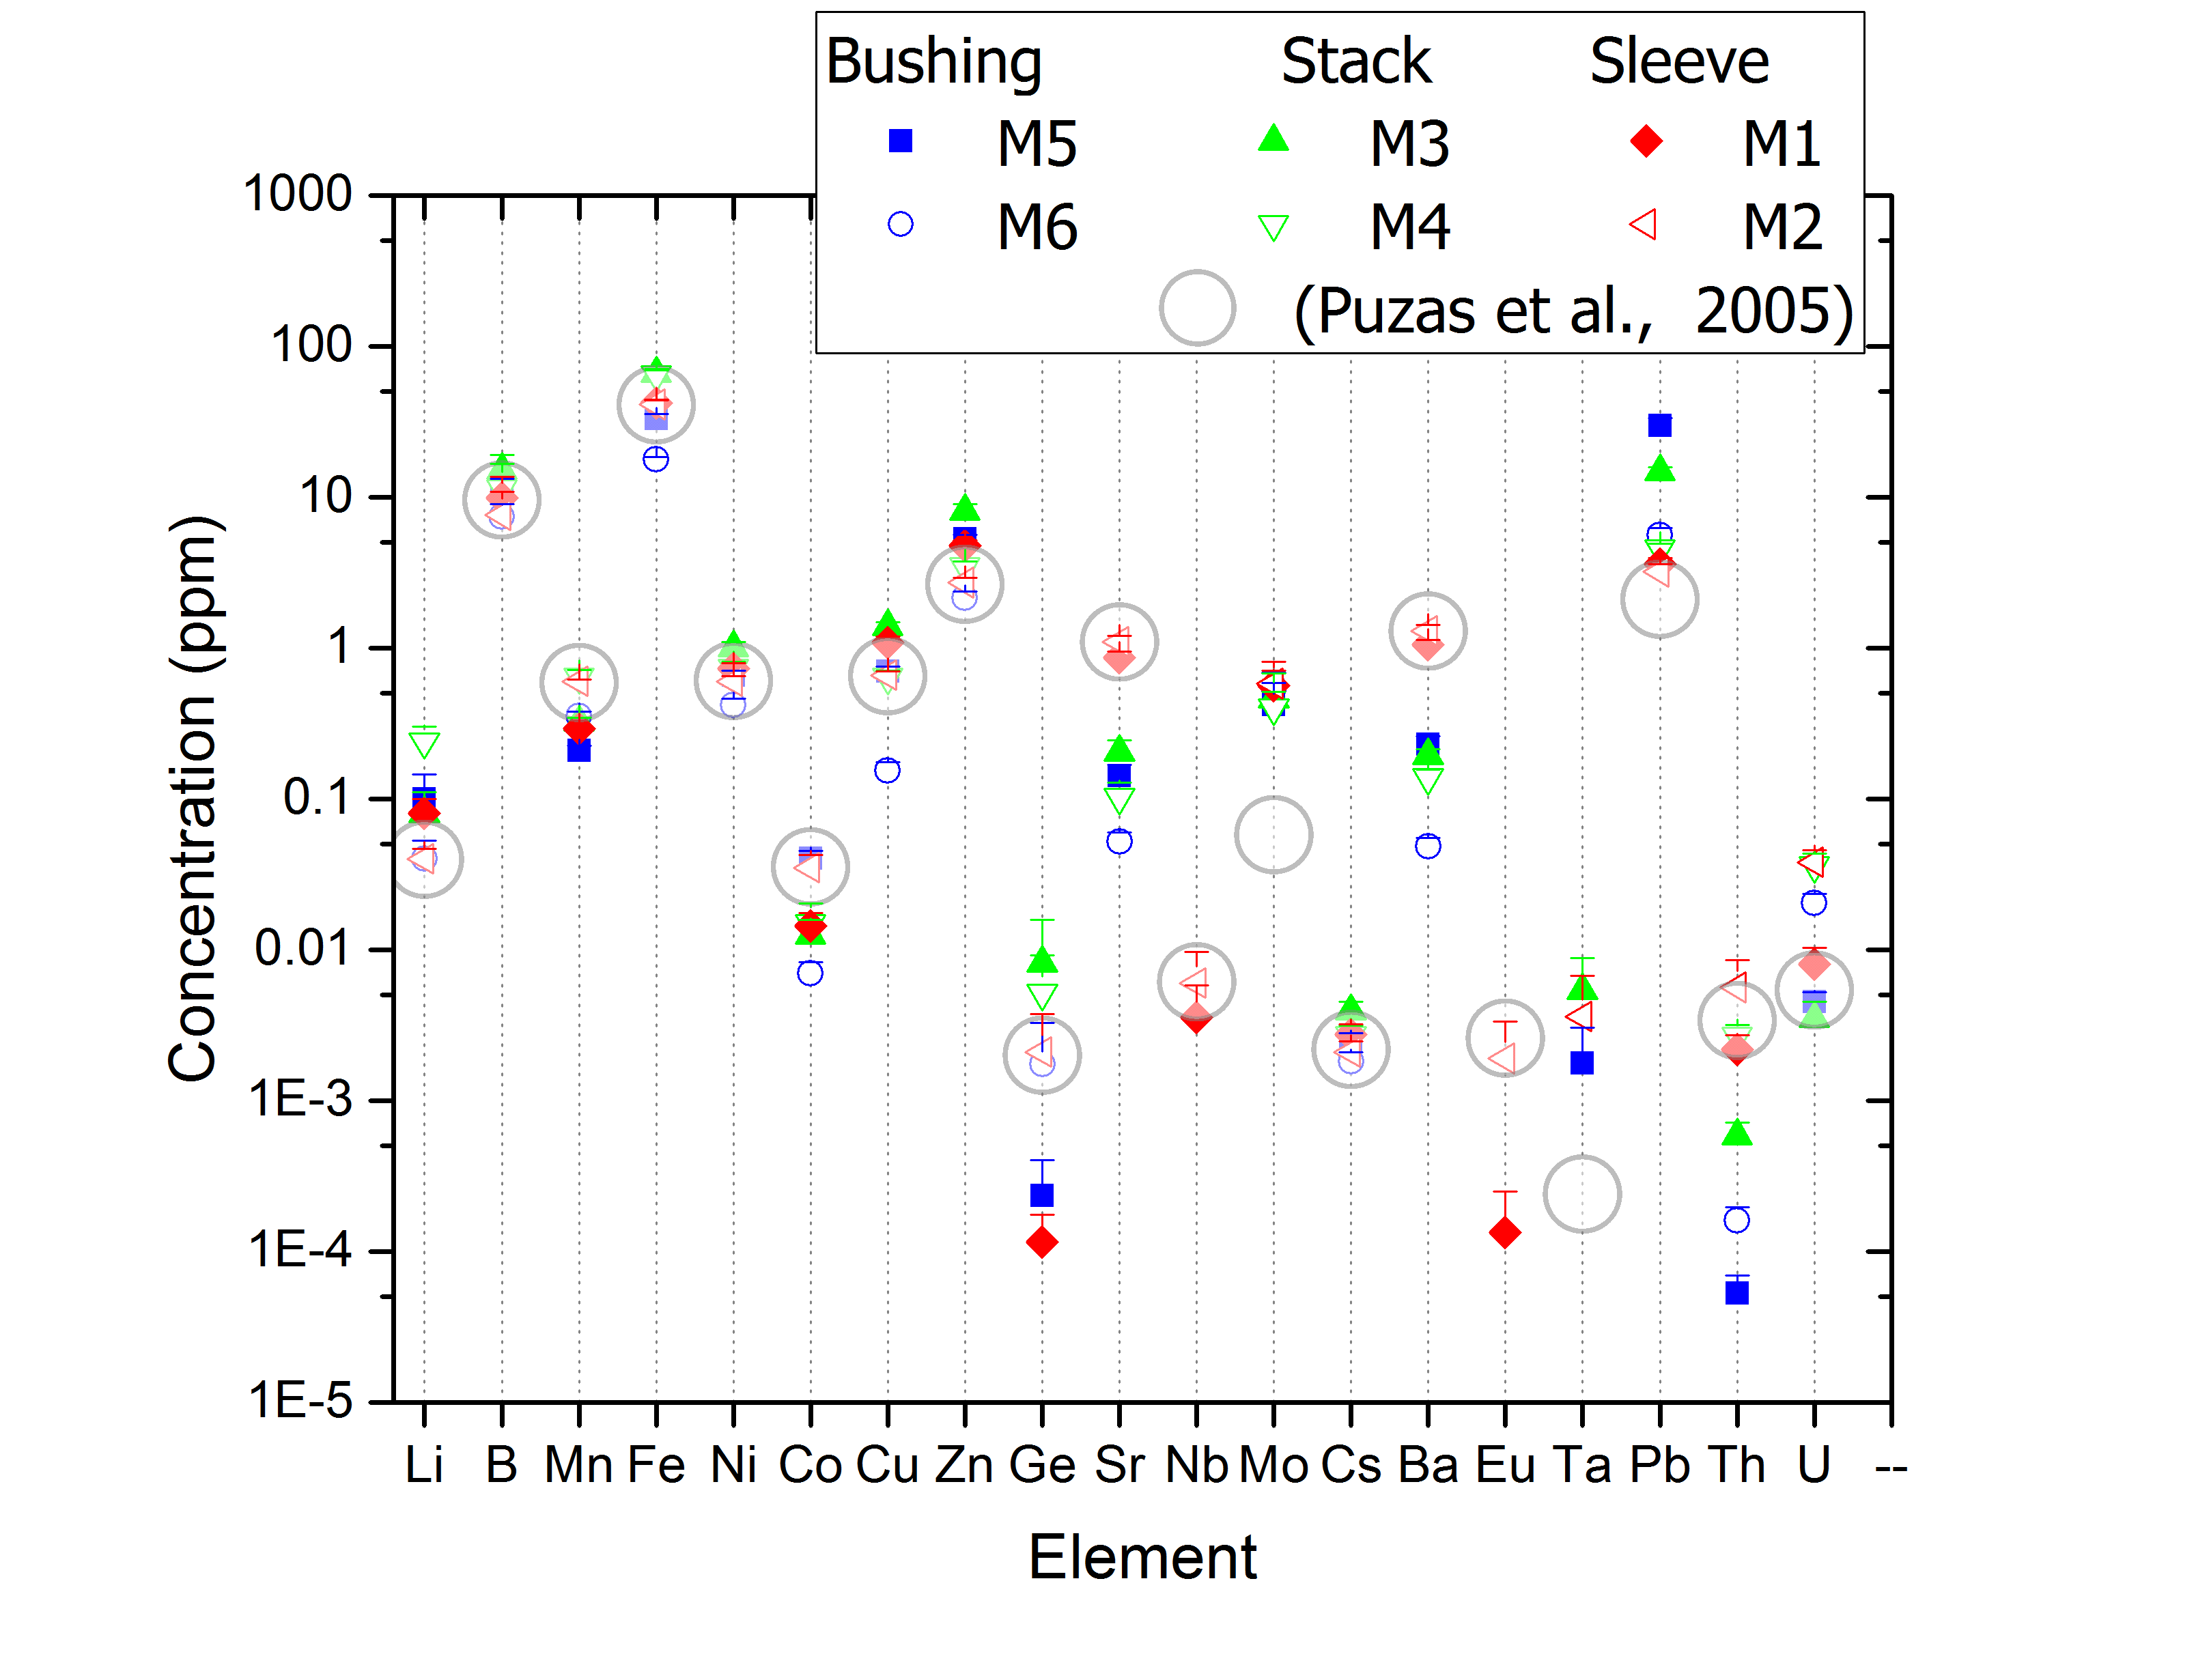
Nineteen important elements have been identified in the graphite stack, sleeve and bushing samples by ICP-MS method: Li, B, Mn, Fe, Ni, Co, Cu, Zn, Ge, Sr, Nb, Mo, Cs, Ba, Eu, Ta, Pb, Th, U. New ICP-MS results compared well with previous ICP-MS measurements (Puzas et al. Reference Puzas, Remeikis, Ezerinskis, Serapinas, Plukis and Duskesas2010). It was observed that in most cases the impurity concentrations are of the same order of magnitude, except for Li, Zn, Ge, Mo, Ta, Pb, and U—for which higher concentrations have been obtained. ICP-MS inter-comparison with results obtained by other methods (see Figure 1) revealed that despite complicated graphite chemical preparation procedure (graphite disarrangement with ultra pure acid, ultra clean dishes etc.) and in some cases higher uncertainties obtained with ICP-MS method, the method is sufficiently accurate for all measured nuclide determinations. However, weighted concentrations should be taken for the Co, Ge, Sr, Mo, Ba, Th, and U impurities if their inhomogeneous distribution in graphite is observed (see Figure 3). Questionably high concentrations of Pb have been observed by this method in the stack and bushing samples; this should be checked more carefully.
ICP-MS measurements versus previously measured ICP-MS (Puzas et al. Reference Puzas, Remeikis, Ezerinskis, Serapinas, Plukis and Duskesas2010).
As it can be observed from Figure 1, comparing the actual measurements with the current upper limits (Narkūnas et al. Reference Narkūnas, Šmaižys, Poškas and Bartkus2016), the measured values were exceeded for Al, Cl, Fe, Ni, Zn, Mo, and Ba. Gd impurity has been determined for the first time; other trace elements have not exceeded upper limits determined previously. The upper limit can be reduced for Mg, Mn, Cd, Sb, Cu, Cs, Eu, Th, and U.
The obtained information about different impurity concentrations of some key nuclides, which can be detected by gamma spectrometry or by destructive beta and alpha spectrometry analysis after chemical preparation in the spent graphite, is summarized in Table 2. Weighted average (
 $$\bar{K}_{w} {\equals}\mathop{\sum}\limits_i {(K_{i} /\sigma _{i}^{2} )} \,/\,\mathop{\sum}\limits_i {(1/\sigma _{i}^{2} )} $$
, where K i is measured value and σ i is uncertainty) of impurity concentrations in different graphite constructions (stack, sleeve and bushing) and maximal observed concentrations in the graphite for N, Cl, Mn, Fe, Co, Ni, Cu, Zn, Sr, Nb, Cs, Ba, Eu, U have been identified. The obtained data on weighted average of impurity concentrations in different graphite constructions will be used as input data for the 3D model of the RBMK-1500 graphite for optimized activation case (less conservative approach). The obtained data on the maximal impurity concentration will be used for the conservative approach for the RBMK-1500 graphite radiological characterization. Comparing with the current upper graphite impurity limits (Narkūnas et al. Reference Narkūnas, Šmaižys, Poškas and Bartkus2016), the higher impurity concentrations limits of Cl, Fe, Co, Ni, Zn, and Ba will be used for the RBMK-1500 reactor graphite characterization.
$$\bar{K}_{w} {\equals}\mathop{\sum}\limits_i {(K_{i} /\sigma _{i}^{2} )} \,/\,\mathop{\sum}\limits_i {(1/\sigma _{i}^{2} )} $$
, where K i is measured value and σ i is uncertainty) of impurity concentrations in different graphite constructions (stack, sleeve and bushing) and maximal observed concentrations in the graphite for N, Cl, Mn, Fe, Co, Ni, Cu, Zn, Sr, Nb, Cs, Ba, Eu, U have been identified. The obtained data on weighted average of impurity concentrations in different graphite constructions will be used as input data for the 3D model of the RBMK-1500 graphite for optimized activation case (less conservative approach). The obtained data on the maximal impurity concentration will be used for the conservative approach for the RBMK-1500 graphite radiological characterization. Comparing with the current upper graphite impurity limits (Narkūnas et al. Reference Narkūnas, Šmaižys, Poškas and Bartkus2016), the higher impurity concentrations limits of Cl, Fe, Co, Ni, Zn, and Ba will be used for the RBMK-1500 reactor graphite characterization.
Weighted average of impurity concentrations determined in different graphite constructions and maximal limits of main RBMK-1500 reactor graphite impurity concentrations.
CONCLUSIONS
Impurities in the graphite of the RBMK-1500 reactor have been determined using the instrumental neutron activation analysis (LVR-15 experimental reactor of the Research Centre Řež, Ltd.), the prompt gamma activation analysis (Heinz Maier-Leibnitz Zentrum) and the inductively coupled plasma mass spectrometer (CPST, Lithuania) and have been compared with the previously measured results. The impurities of the RBMK-1500 graphite stack samples were analyzed for the first time. From the INAA and PGAA analysis it was observed that stack was “cleaner” compared with the graphite sleeve and bushing material. Those methods were extremely important as the total volumes of the graphite samples were examined and the obtained results suggest that impurities of Al, Cl, Ca, Fe, Zn, Co, Sr, Mo, Ba, Eu, Th and U can be distributed non-homogeneously. Inter-comparison of all measured results obtained by different methods allowed validation of the less sensitive but more affordable ICP-MS method as sufficiently accurate for the determination of main measured nuclides, but averaged concentrations of several samples should be used for the determination of inhomogeneously-distributed impurities. Limits for the RBMK-1500 reactor graphite impurities have been determined:
∙ The lower concentrations for Na, K, Sc, V, Cr, Mn, Sb, Cs, Sm, and Ho but higher concentrations for Al, Si, S, Fe, Br, Mo, Ba, Eu, Gd, and U were obtained from INAA, PGAA, and ICP-MS analyses, comparing with other measurements (Ancius et al. Reference Ancius, Remeikis, Plukis, Plukiene, Ridikas and Cometto2005; Puzas et al. Reference Puzas, Remeikis, Ezerinskis, Serapinas, Plukis and Duskesas2010).
∙ According to the Al, Cl, Fe, Ni, Zn, Mo, and Ba measurements upper limits of their concentration should be increased if compared to earlier used limits (Narkūnas et al. Reference Narkūnas, Šmaižys, Poškas and Bartkus2016). Gd impurity has been determined for the first time. The upper limit of concentration can be reduced for Mg, Mn, Cd, Sb, Cu, Cs, Eu, Th, and U as significantly lower values have been obtained in all measured samples.
∙ The obtained data on weighted averaged impurity concentrations in the different graphite constructions could be used as input data for modeling of an optimized graphite activation–less conservative approach to the consideration of RBMK-1500 irradiated graphite.
∙ The obtained data on the maximal impurity concentration of some nuclides as having high contributions to the graphite activation will be used for the modeling of conservative approach of the RBMK-1500 graphite radiological characterization. Nuclide activities estimated by modeling in the graphite will be cross-checked for nuclides, which have been detected by nuclear spectrometry in the irradiated graphite.
This study is important for the development of management technologies of the irradiated graphite and especially for RBMK-type reactors. The new impurity data will be used in the RBMK-1500 3D numerical model for the graphite radiological characterization (conservative and less conservative approaches) and will be reported elsewhere.
ACKNOWLEDGMENTS
The authors would like to acknowledge the INPP personnel for providing the INPP virgin graphite samples. This work is based upon experiments performed at the PGAA instrument operated by Zsolt Révay at the Heinz Maier-Leibnitz Zentrum (MLZ) in Garching, Germany, and upon experiments performed at INAA instrument operated by Jan Kučera at the Nuclear Physics Institute of CAS Řež, Czech Republic within the CANAM infrastructure supported by the Ministry of Education, Youth and Sports of the Czech Republic by project No. LM2015056. Dissemination of the research is funded by the European Social Fund under the measure No 09.3.3-LMT-K-712 “Development of Competences of Scientists, Other Researchers and Students through Practical Research Activities”.
SUPPLEMENTARY MATERIAL
To view supplementary material for this article, please visit https://doi.org/10.1017/RDC.2018.93


 Open access