

Introduction
Lycium barbarum (LB), commonly known as wolfberry, is a traditional Chinese medicinal and edible plant that has been cultivated in China for thousands of years (Zhang et al. Reference Zhang, Xiao and Guo2022). The Ningxia Hui Autonomous Region is the world’s largest producer, yielding approximately 140,000 tons of dried fruits annually, underscoring its global significance in wolfberry cultivation (Cui et al. Reference Cui, Li and Hao2022). All parts of LB, including its fruits, roots, and leaves, possess considerable nutritional and medicinal value. Numerous clinical and experimental studies have demonstrated that LB polysaccharide extracts exhibit diverse biological activities, including antioxidant (Jia et al. Reference Jia, Yu and Du2024), lipid-lowering (Zhang et al. Reference Zhang, Zhang and Yang2024), hypoglycemic (Zhao et al. Reference Zhao, Zhao and Zhang2023), anticancer, and immunomodulatory effects (Miranda et al. Reference Miranda, Basilicata and Vestuto2024). These biological properties are closely associated with the active compounds in LB, such as polysaccharides, polyphenols, alkaloids, and vitamins (Yu et al. Reference Yu, Yan and Zhang2023). Among these, polysaccharides are regarded as the major contributors to LB’s pharmacological functions (Wu et al. Reference Wu, Guo and Lin2018). In addition, recent studies have revealed that LB is also rich in flavonoids, which enhance its antioxidant potential by scavenging reactive oxygen species (ROS) (Liao et al. Reference Liao, Guo and Niu2022).
Flavonoids, a major class of plant polyphenols characterized by a 2-phenylchromanone backbone, exhibit remarkable structural diversity and bioactivity. They are widely recognized for their preventive and therapeutic potential against metabolic and chronic diseases such as cancer, obesity, diabetes, hypertension and hyperlipidemia (Chen et al. Reference Chen, Cao and Huang2022; Jennings et al. Reference Jennings, Thompson and Tresserra-Rimbau2024; Zhu et al. Reference Zhu, Dai and Zhao2024). Major flavonoids identified in LBPs include quercetin, nicotiflorin, rutin and 7-O-β-D-glucopyranosyl rutin (Zhou et al. Reference Zhou, Xiao and Fan2017). However, limited information is available regarding how fermentation affects the composition and bioactivity of flavonoids in LBPs.
The increasing demand for natural flavonoids and the global emphasis on sustainable production underscore the limitations of conventional extraction and chemical synthesis methods. Microbial fermentation provides an eco-friendly and efficient strategy for producing primary and secondary metabolites while simultaneously enhancing their bioactivity (Grujović et al. Reference Grujović, Mladenović and Semedo-Lemsaddek2022). Previous studies have demonstrated that fermentation can elevate polyphenol and flavonoid levels in plant-derived materials, thereby improving their antioxidant capacity (Lee et al. Reference Lee, Hwang and Lee2009; Wang et al. Reference Wang, Jin and Zhang2022). However, the metabolic mechanisms underlying flavonoid biosynthesis during fermentation remain largely unresolved (Sun et al. Reference Sun, Sun and Zhang2022).
Omics-based technologies – particularly metabolomics – offer powerful tools for elucidating these mechanisms. Building on previous findings that fermentation enhances the utilization efficiency of LBPs, the present study employed untargeted metabolomics, multivariate statistical analysis and high-performance liquid chromatography–mass spectrometry (HPLC–MS) to characterize alterations in bioactive secondary metabolites. These findings provide mechanistic insights into fermentation-mediated metabolic regulation and support the standardized and value-added utilization of LBPs.
Materials and methods
Reagents and materials
LBPs were dried to a constant weight at 60°C in a temperature-controlled oven and subsequently stored at room temperature until further analysis. The LBPs material was sourced from Ningxia Green Health Source Biotechnology Co., Ltd. (Yinchuan, China). Bacillus subtilis PFK1702, Lactobacillus, and yeast were sourced from Hunan Pufik Biotechnology Co., Ltd. (Changsha, China). Chromatography-grade methanol, acetonitrile, and dimethyl sulfoxide were purchased from Merck (Darmstadt, Germany). A fiber analyzer (ANKOM A2000I, Ankom Technology, USA) and a Soxhlet extractor (FOSS Group, Denmark) were used in the study. An oxygen bomb calorimeter (C6000, IKA, Germany) was used in this study. A UV-Vis spectrophotometer (P9, Shanghai Meppan Instrument Co., Ltd., China) was employed for absorbance measurements.
Fermentation and extraction of LBPs
The control group (CON) consisted of unfermented LBPs, whereas the experimental groups were fermented for 3 days (F3) and 5 days (F5), each with three biological replicates. A mixed inoculum containing equal proportions of Bacillus subtilis PFK1702, Lactobacillus, and yeast was prepared and activated in a 1% (w/v) glucose solution at 37 °C for 3 h in 250 mL conical flasks. The activated inoculum was then mixed with dried LBPs at a ratio of 1:1 (w/w, inoculum to substrate) and adjusted to a moisture content of approximately 45%. Solid-state fermentation was carried out under anaerobic conditions at 37°C for 3 days or 5 days. After fermentation, the products were oven-dried at 65°C for 4 h, extracted with distilled water at a solid-to-liquid ratio of 1:40 (w/v) at 30°C for 4 h, filtered, and subsequently freeze-dried for further analysis.
Physicochemical properties of LBPs
Crude protein content
Crude protein (CP) was determined by the Kjeldahl method (GB/T 6432-2018). Samples were dried, digested at 400°C for 4 h, then cooled. Nitrogen was measured with a KJELTEC 8420, and CP was calculated using a 6.25 conversion factor.
Crude fat content
Crude fat (EE) was measured by Soxhlet extraction (GB/T 6433-2006). Samples were extracted at 90 °C for 6 h using a SOXTEC 8000 with petroleum ether. Samples were re-dried, and EE was calculated from weight difference.
Crude fiber content
Crude fiber (CF) was analyzed with an ANKOM A2000i (GB/T 6434-2006). Samples were treated with boiling dilute H2SO4, NaOH and acetone. Samples were dried, ashed and weighed to calculate CF.
Energy value
Gross energy (GE) was measured with an IKA C6000 calorimeter. Samples were dried, ground (1 mm) and ∼0.5 g was weighed into a crucible.
Total polysaccharide
The total polysaccharide content was determined using the phenol–sulfuric acid method (He et al. Reference He, Zhang and Jia2022). Briefly, 1.0 mL of appropriately diluted sample solution was mixed with 1.0 mL of 5% phenol solution, followed by the addition of 5.0 mL of concentrated sulfuric acid. The mixture was vortexed and incubated in a water bath at 30°C for 20 min for color development, then cooled to room temperature. Absorbance was measured at 490 nm using a UV–Vis spectrophotometer. Glucose was used as the standard, and results were expressed as milligrams of glucose equivalent per gram of dry sample (mg/g).
Total polyphenol
The total polyphenol content was measured using the Folin–Ciocalteu colorimetric method (Mamy et al. Reference Mamy, Huang and Akpabli-Tsigbe2022). In brief, 1.0 mL of sample extract was mixed with 5.0 mL of 10% Folin–Ciocalteu reagent and allowed to react for 5 min. Subsequently, 4.0 mL of 7.5% sodium carbonate solution was added, and the mixture was incubated at room temperature in the dark for 30 min. Absorbance was recorded at 765 nm using a UV–Vis spectrophotometer. Gallic acid was used as the standard, and results were expressed as milligrams of gallic acid equivalent per gram of dry sample (mg/g).
Metabolomics sample preparation
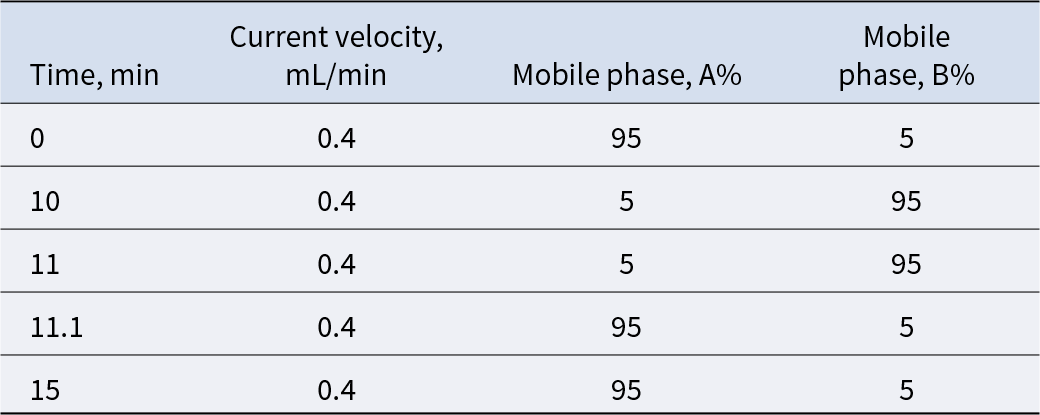
Freeze-dried fermented LBPs powder was ground and passed through a 20-mesh sieve. A 100 mg sample was extracted with 1 mL of 70% methanol, vortexed intermittently (30 s every 30 min, six times), and incubated overnight at 4°C. The extracts were filtered through a 0.22 µm membrane and stored at 4°C until analysis. Untargeted metabolomic profiling was performed using UPLC–MS/MS (SHIMADZU CBM30A system coupled with a QTRAP® 4500 + mass spectrometer). Chromatographic separation was achieved on a Waters HSS T3 C18 column (2.1 × 100 mm, 1.8 µm) with 0.1% formic acid in water (solvent A) and acetonitrile (solvent B) as the mobile phases. The flow rate was 0.4 mL/min, the column temperature was maintained at 40°C, and the injection volume was 2 µL. The gradient elution program is shown in Table 1. Mass spectrometric detection was conducted under electrospray ionization (ESI) in both positive and negative ion modes with the following parameters: source temperature, 550°C; ion spray voltage, + 5500 V/–4500 V; curtain gas, 25 psi; gas I, 55 psi; gas II, 60 psi; collision energy, high mode.
UPLC layer elution conditions

Statistical analysis
Statistical analyses were performed using SPSS 25.0, and data are expressed as mean ± SD. One-way ANOVA followed by Duncan’s multiple range test was conducted to assess significant differences among groups, with P < 0.05 considered statistically significant. Metabolite identification was carried out using triple quadrupole mass spectrometry (MRM mode) with a proprietary Suzhou Pan-Microbial database. After quality control, data processing and statistical analysis were performed in R software (v4.2.2). Orthogonal partial least squares discriminant analysis (OPLS-DA) was applied to distinguish metabolic profiles among LBP samples. Variable importance in projection (VIP) values were used to screen differential metabolites. P-values and fold changes were calculated and adjusted for false discovery rate (FDR). Hierarchical clustering was conducted to visualize metabolite distribution patterns across groups. Kyoto Encyclopedia of Genes and Genomes (KEGG) pathway analysis was performed for metabolite annotation and functional enrichment.
Results
Effects of fermentation on the physicochemical properties of LBPs
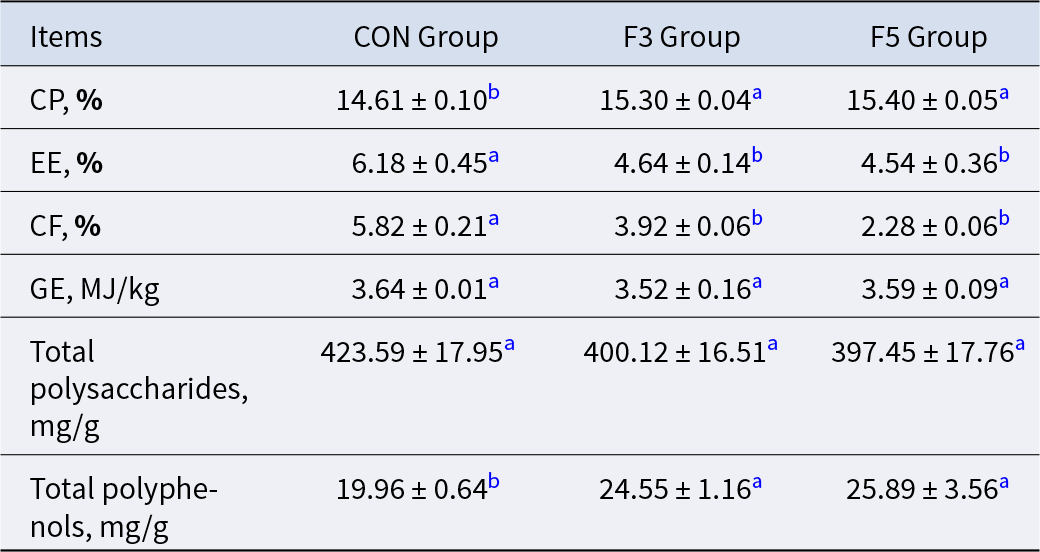
As shown in Table 2, fermentation significantly modified the nutrient composition of LBPs. The CP content increased significantly in both fermented groups (P < 0.05), rising by 4.72% in F3 and 5.41% in F5 compared with CON. The EE content decreased markedly (P < 0.05), showing reductions of 24.92% and 26.54% in the F3 and F5 groups, respectively. Similarly, the CF content declined significantly (P < 0.05), by 30.65% and 60.83% in F3 and F5, respectively. In contrast, GE content showed only slight fluctuations, with no significant differences among groups (P > 0.05). The total polysaccharide content also showed no significant differences (P > 0.05), although a slight decreasing trend was observed, with reductions of 5.54% and 7.12% in F3 and F5 relative to CON. Conversely, total polyphenol content increased significantly after fermentation (P < 0.05), by 23.0% in F3 and 29.71% in F5 compared with CON. Collectively, these findings indicate that prolonged fermentation promotes polyphenol accumulation and improves the overall nutritional quality of LBPs.
Effects of fermentation duration on the physicochemical properties of LBPs

a,b Means in the same row with different superscript letters differ significantly (P < 0.05). The raw data are provided in Appendix 1.
Nontargeted metabolomics analysis
Effect of probiotic fermentation on metabolites of LBPs
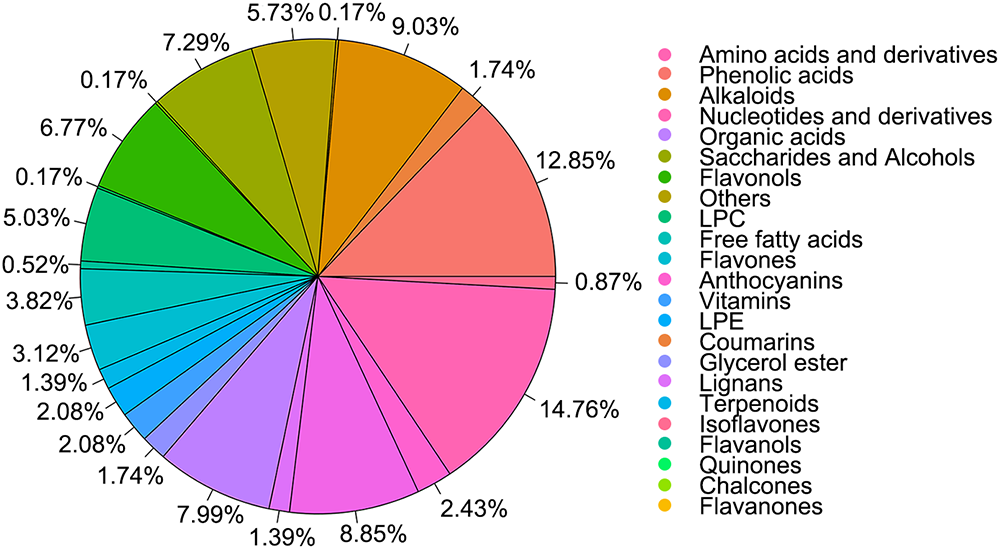
UPLC-MS/MS was employed to comprehensively characterize the metabolite profiles of the CON, F3 and F5 groups. Both qualitative and quantitative analyses, together with quality control (QC) assessments, were performed on mixed fermented extracts of LBPs. The analysis generated total ion chromatograms (TICs) and multiple reaction monitoring (MRM) chromatograms under both positive and negative ionization modes, exhibiting stable ion intensities across retention times. In total, 576 metabolites were identified, classified into 23 chemical categories. These included amino acids and their derivatives, phenolic acids, alkaloids, nucleotides, organic acids, sugar alcohols, lysophosphatidylcholines, free fatty acids, flavonoids, anthocyanins and lysophosphatidylethanolamines (Figure 1). Collectively, these findings demonstrate that fermentation markedly diversifies the metabolite composition of LBPs, reflecting extensive biochemical transformations driven by microbial activity.
Pie chart illustrating the classification of metabolites identified in mixed samples from fermented extract of LBPs. The raw data for this chart are provided in Appendix 2.

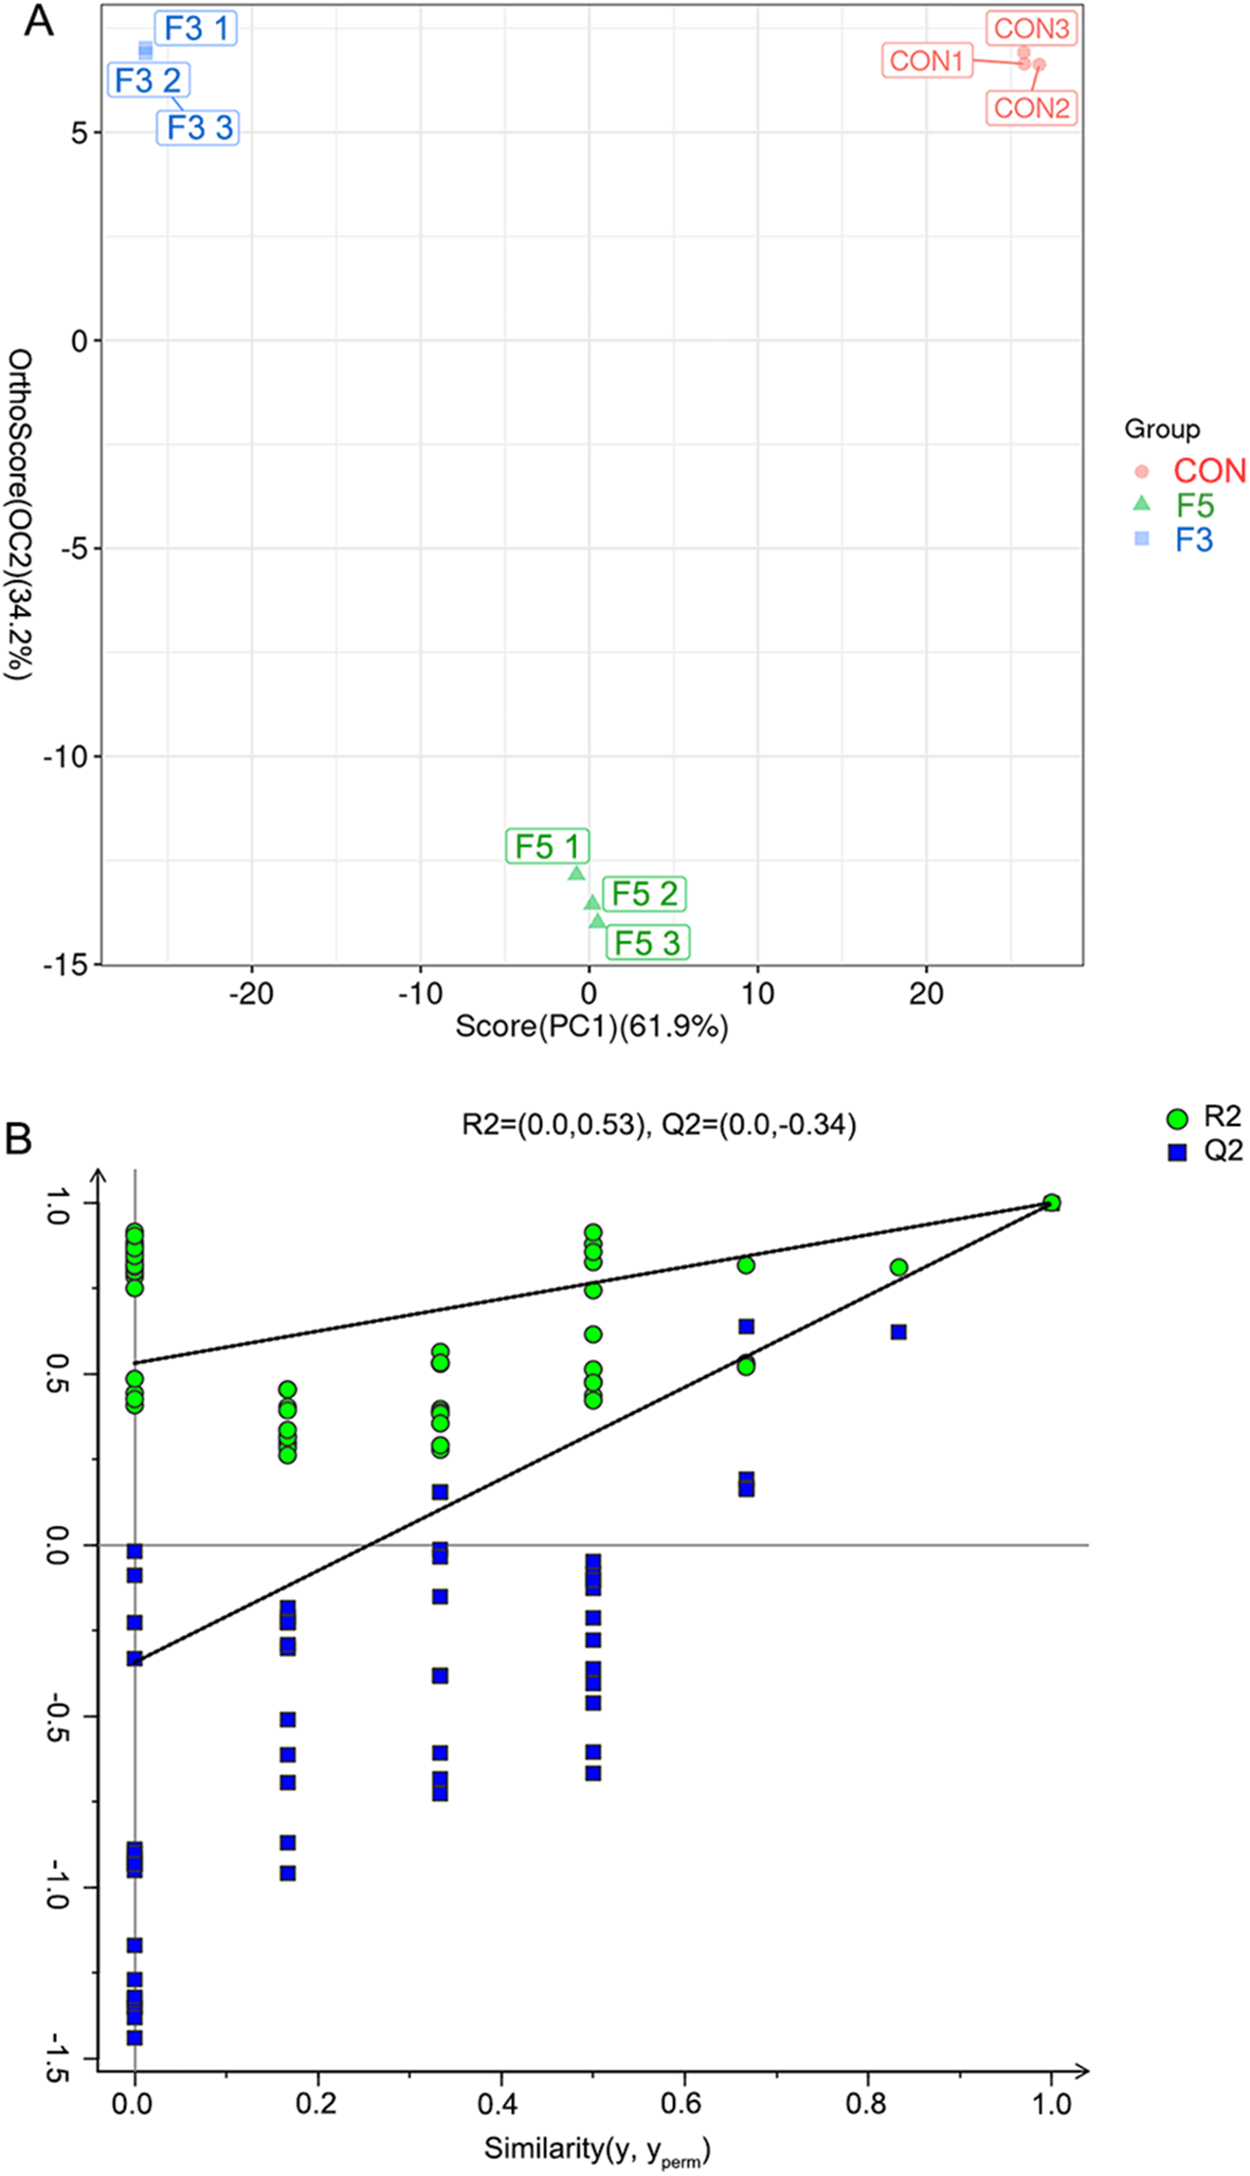
Differential metabolite analysis using supervised OPLS-DA
OPLS-DA was employed to reduce data dimensionality and effectively capture group-specific metabolic variations. This supervised method minimizes the influence of irrelevant variables, thereby improving model interpretability. The OPLS-DA score plot revealed a clear separation among the CON, F3 and F5 groups (Figure 2A), indicating substantial metabolic differences between groups and strong consistency within each group. Model reliability was validated through permutation testing (n = 200), which yielded R 2 = 0.53 and Q 2 = − 0.34, suggesting a robust model with minimal risk of overfitting (Figure 2B). These findings confirm that fermentation induced distinct metabolic reprogramming in LBPs.
(A) OPLS-DA score plot for metabolomic data from fermented extract of LBPs. The x-axis represents predictive principal components, and the y-axis indicates orthogonal components. The percentages denote the proportion of variance explained by each component. (B) Permutation test plot based on 200 permutations, showing R 2 = (0.0, 0.53) and Q2 = (0.0, − 0.34). The raw data for the graphs are provided in Appendix 3.

Differential analysis of flavonoid metabolites in LBPs
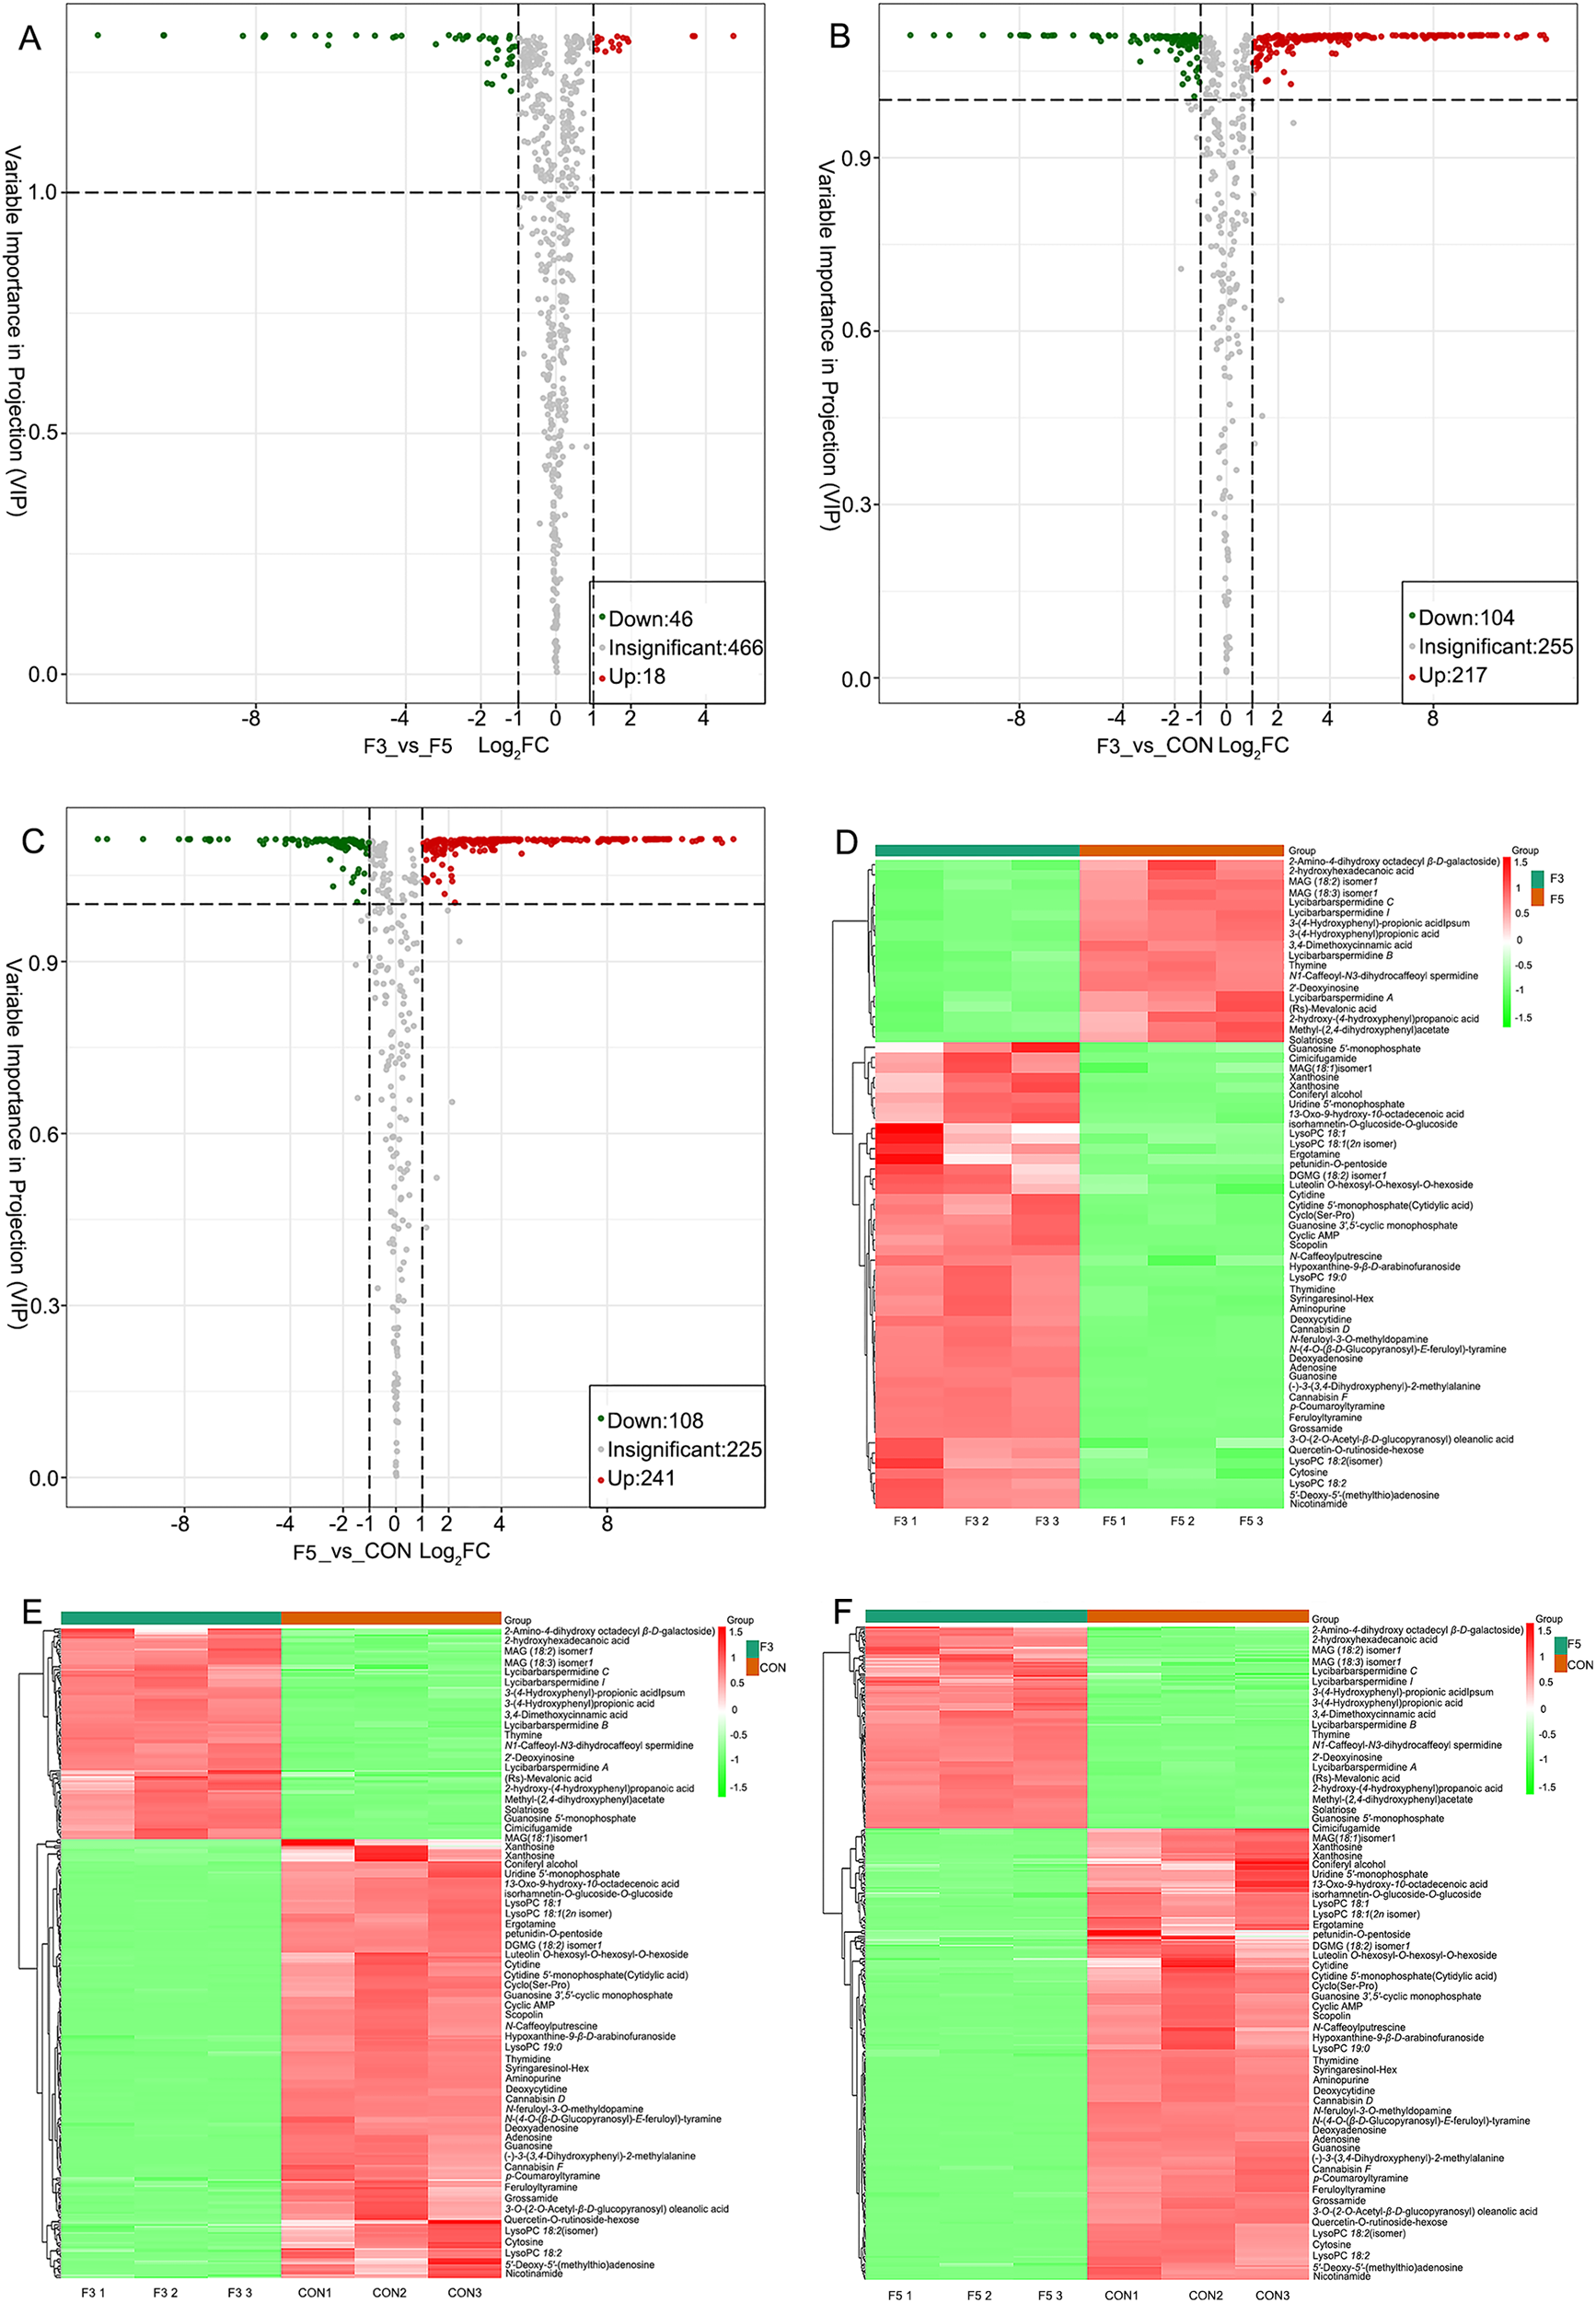
Metabolomics data are inherently high-dimensional and complex, requiring the integration of both univariate and multivariate statistical approaches to accurately identify differential metabolites. The OPLS-DA model generated variable importance in projection (VIP) scores, enabling precise discrimination of metabolites among groups. To enhance the robustness of metabolite selection, univariate statistical parameters – including P-values and fold changes – were incorporated, with P-values adjusted using the false discovery rate (FDR) correction. Comparative analysis between the F3 and F5 groups identified 64 differential metabolites belonging to 17 chemical classes, including 46 downregulated and 18 upregulated compounds (Figure 3A). In the F3 versus CON comparison, 321 metabolites were detected across 21 classes, comprising 104 downregulated and 217 upregulated compounds (Figure 3B). Similarly, the F5 versus CON comparison revealed 349 metabolites across 21 classes, including 108 downregulated and 241 upregulated compounds (Figure 3C). Collectively, these results indicate that fermentation markedly reshapes the metabolic profile of LBPs, with an increasing number of metabolites being upregulated as fermentation duration extends.
(A, B, C) Volcano plots of differential metabolites in fermented extract of LBPs. Each dot represents a metabolite. The x-axis shows the log2 fold change between groups, while the y-axis represents the VIP values. Red dots indicate significantly upregulated metabolites, green dots indicate significantly downregulated metabolites, and gray dots indicate metabolites without significant differences. (D, E, F) Heatmaps illustrating hierarchical clustering of differential metabolites. The dendrogram on the left shows the clustering structure. Color intensity reflects normalized relative metabolite abundance, with red indicating high abundance and green indicating low abundance. The raw data for this chart are provided in Appendix 4.

Hierarchical cluster analysis (HCA) was performed to visualize the distribution patterns of differential metabolites across groups. Metabolite abundances were normalized using unit variance (UV) scaling, and heatmaps were generated with the pheatmap package in R. Figures 3D–F present sample names on the horizontal axis and metabolite identities on the vertical axis. Samples were clearly separated into three clusters (F3, F5 and CON), indicating strong within-group consistency and distinct metabolic differentiation among treatments. Upregulated metabolites were identified based on VIP scores (≥1) and ranked according to the number of compounds detected in each fermentation group. Significant compositional changes occurred before and after fermentation, with phenolic compounds representing the most abundant class (105 species). The upregulated metabolites were primarily flavonoids, isoflavones, flavonols, flavanols, coumarins, anthocyanins and organic acids. Notably, flavonoids constituted the predominant fermentation-related metabolites, displaying diverse biological activities that contribute substantially to the enhanced biofunctional properties of LBPs. Overall, hierarchical clustering confirmed that fermentation promoted the accumulation of flavonoid-related metabolites, reflecting enhanced secondary metabolism during microbial fermentation.
Nontargeted metabolomic analysis identified 16 key flavonoid metabolites in fermented LBPs, including 6,7,8-tetrahydroxy-5-methoxyflavone, diosmetin, rhamnocitrin (7-methylkaempferol), hispidulin, nepetin, 6-hydroxyluteolin-5-glucoside, luteolin-7-O-glucoside (cynaroside), selgin-7-O-hexoside, iristectorigenin-B-O-glucoside, tricin-7-O-glucoside, tricin-4’-O-glucoside, luteolin-7-O-rutinoside, luteolin-7-O-β-D-gentiobioside, luteolin-O-hexosyl-O-hexosyl-O-hexoside, diosmetin-7-O-galactoside and tricin-O-saccharic acid. Collectively, these findings indicate that fermentation promotes the accumulation of bioactive flavonoids – particularly luteolin- and tricin-derived compounds – which may contribute to the enhanced antioxidant capacity of fermented LBPs.
KEGG pathway enrichment analysis of differential metabolites in LPBs
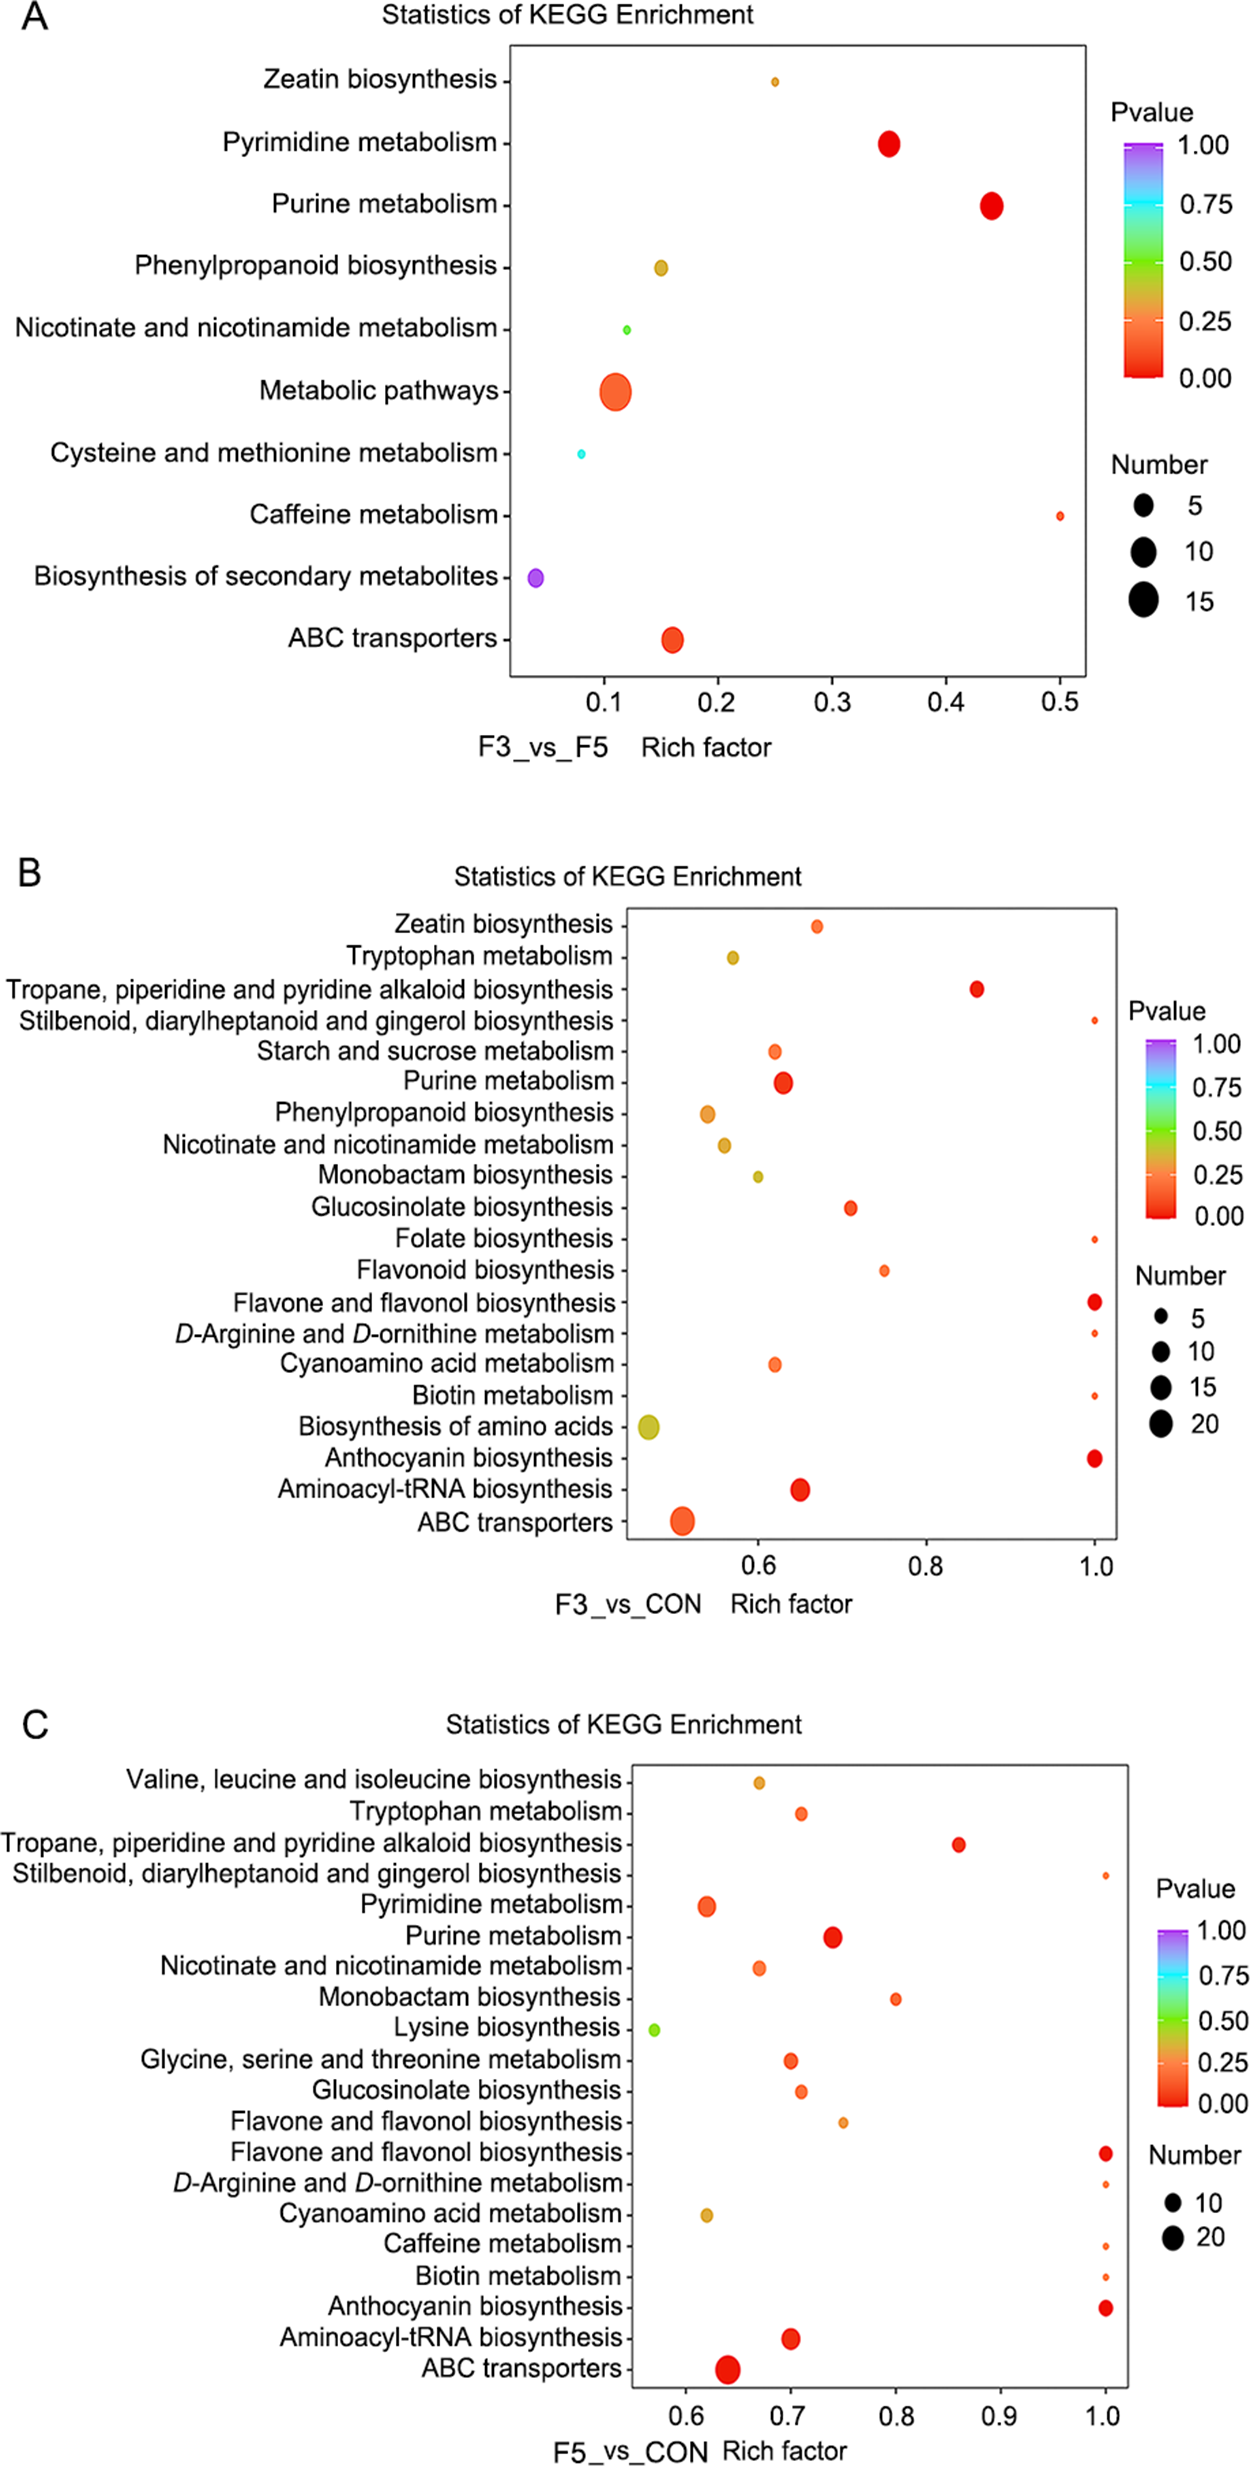
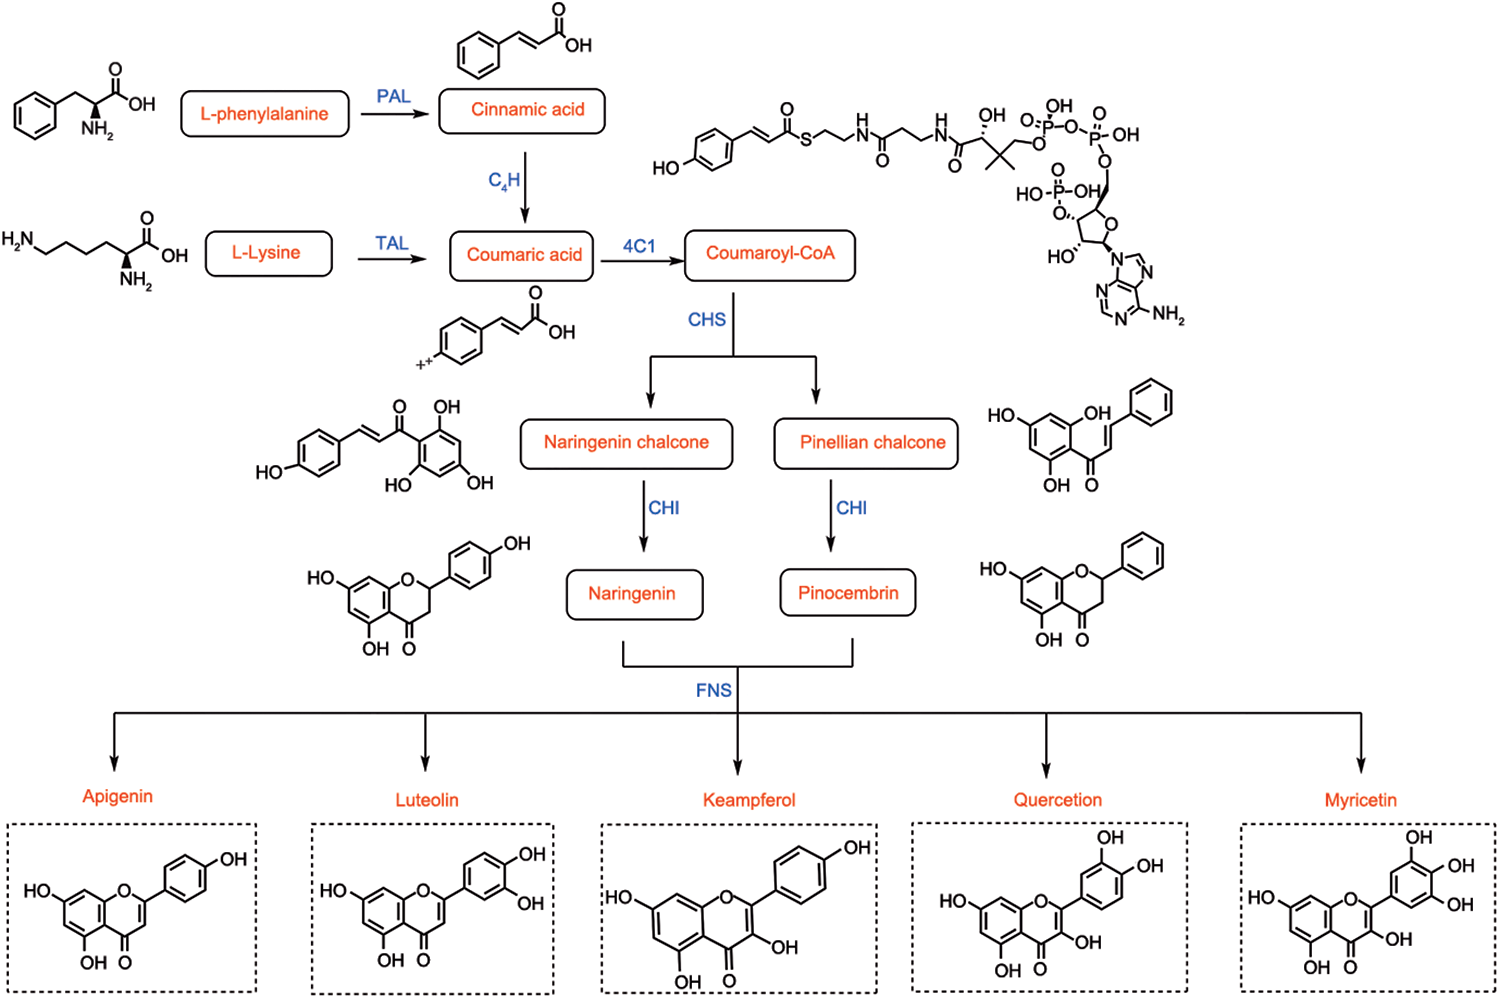
Functional annotation and pathway enrichment analyses were conducted using the KEGG database to elucidate the metabolic pathways associated with differential metabolites (Kanehisa and Goto Reference Kanehisa and Goto2000). A total of 352 differential metabolites were identified during LBPs fermentation, spanning 71 distinct metabolic pathways. These metabolites mainly comprised amino acids and their derivatives, phenolic acids, flavonols, lysophosphatidylcholines, alkaloids, flavonoids, organic acids and anthocyanins. Pathway enrichment analysis enabled visual comparison of the differential metabolic pathways among fermentation stages (Figure 4). The results revealed that fermentation primarily affected pathways related to secondary metabolite biosynthesis, ATP-binding cassette (ABC) transporters, amino acid biosynthesis, purine metabolism, aminoacyl-tRNA biosynthesis and pyrimidine metabolism. Furthermore, KEGG pathway analysis identified luteolin-7-O-glucoside (cynaroside) as a key metabolite involved in the flavonoid biosynthesis pathway (Figure 5). A total of 15 flavonoid metabolites were detected in the F3 group and 16 in the F5 group. The fold changes of upregulated metabolites were higher in the F5 group than in the F3 group, indicating enhanced flavonoid biosynthesis with prolonged fermentation. Overall, KEGG enrichment analysis demonstrated that extended fermentation activates multiple secondary metabolic pathways – particularly those associated with flavonoid biosynthesis – thereby promoting the accumulation of bioactive flavonoids in LBPs.
KEGG pathway enrichment analysis of differential metabolites in fermented extract of LBPs. The x-axis displays the Rich factor for each pathway, and the y-axis lists pathway names. Dot size reflects the number of enriched metabolites; dot color represents statistical significance (P-value), with red indicating higher significance. The raw data for this chart are provided in Appendix 5.

Proposed metabolic pathway of flavonoid biosynthesis in fermented extract of LBPs, based on KEGG annotation. The raw data for this chart are provided in Appendix 5.

Discussion
Nutrient composition and content are key indicators of feed quality, directly influencing palatability and feed conversion efficiency through their effects on nutrient availability. In this study, the CP content of LBPs significantly increased after fermentation, likely due to microbial metabolism and protein biosynthesis. This enhancement may be attributed to yeast activity, which converts urea and other nitrogenous compounds into microbial proteins, as previously reported in other fermented plant by-products (Brabender et al. Reference Brabender, Hussain and Rodriguez2018). Additionally, Bacillus and Lactobacillus species utilize carbohydrates as energy sources during growth, indirectly increasing protein levels through microbial biomass accumulation, consistent with findings from fermented soybean and corn by-products (Canibe and Jensen Reference Canibe and Jensen2003). In contrast, EE, a key energy component, decreased markedly following fermentation. This reduction is likely associated with microbial lipase activity, which hydrolyzes lipid components and promotes lipid catabolism (Parfene et al. Reference Parfene, Horincar and Tyagi2013). Similarly, Bacillus sphaericus regulates lipid metabolism-related genes, further accelerating lipid degradation (Shi et al. Reference Shi, Zi and Lu2020). CF, which influences feed palatability, also declined significantly with extended fermentation. This decrease may result from enzymatic hydrolysis by Bacillus and Saccharomyces cerevisiae, which secrete laccase and cellulase to degrade fibrous materials into simple sugars (Chen et al. Reference Chen, Deng and Jiang2024). Overall, these findings are consistent with previous studies demonstrating that microbial fermentation improves feed digestibility and nutrient availability (Rajesh et al. Reference Rajesh, Imelda-Joseph and Raj2010). Collectively, the results suggest that mixed-microbe fermentation enhances the nutritional quality of LBPs by increasing protein content, modulating lipid catabolism, and reducing fiber complexity, thereby improving feed digestibility and utilization.
LBPs are rich in bioactive compounds, primarily polysaccharides and polyphenols, which play a significant role in physiological regulation. In this study, the observed decrease in total polysaccharide content after fermentation is likely due to microbial consumption of monosaccharide precursors, such as glucose and mannose, during the early fermentation stages (Yu et al. Reference Yu, Hu and Ahmadi2022). During the later stages, limited secretion of cellulases and laccases may have hindered the breakdown of complex polysaccharides into fermentable sugars, reducing the substrate availability for microbial metabolism (Pandey et al. Reference Pandey, Chand and Tewari2018). Polyphenols, structurally diverse plant secondary metabolites, are widely distributed in roots, stems, leaves and fruits, providing multiple bioactive functions. Their antioxidant, anti-inflammatory and antimicrobial properties enhance the biological potential of plant extracts, particularly under fermentation-induced transformations. Consistent with previous studies on other plant by-products, fermentation with Lactococcus lactis, Aspergillus oryzae and Saccharomyces cerevisiae promotes the release and biotransformation of polyphenolic compounds, highlighting the critical role of microbial enzymatic activity. Specifically, Aspergillus oryzae produces enzymes such as glycosidases, amylases and xylanases that release polyphenols from glycosidic bonds, thus increasing their bioavailability. Meanwhile, S. cerevisiae and L. lactis produce esterases, β-galactosidase, polysaccharide-degrading enzymes and β-glucosidase, which collectively promote the biotransformation of polyphenolic compounds, including the conversion of flavonoid glycosides into aglycones, thereby enhancing antioxidant capacity (John et al. Reference John, Böttcher and Aßkamp2019). The findings of this study corroborate those reported by Xia et al. (Reference Xia, Qiang and Geng2022), confirming that mixed-microbe fermentation significantly increases the total polyphenol content in LBPs, thereby enhancing their antioxidant activity. These results suggest that mixed-microbe fermentation enhances the antioxidant potential of LBPs by modulating flavonoid metabolic pathways.
Flavonoids, widely distributed in plants and dietary sources, exhibit diverse biological activities – including antiviral, anti-inflammatory, cardioprotective, antidiabetic, anticancer and anti-aging effects – that collectively promote human health (Calis et al. Reference Calis, Mogulkoc and Baltaci2020; Zhang et al. Reference Zhang, Zhao and Tao2023). Previous studies have demonstrated that solid-state fermentation markedly enhances flavonoid production, including hesperidin, nobiletin and tangeretin, particularly when Aspergillus niger CGMCC 3.6189 is used as the fermenting strain (Mamy et al. Reference Mamy, Huang and Akpabli-Tsigbe2022), underscoring the pivotal role of microbial enzymes in flavonoid biotransformation. Yeast fermentation has also been shown to stimulate glucose metabolism through specific biosynthetic pathways, thereby increasing the synthesis of flavonoids, such as limonene, glycyrrhetinic acid, kaempferol, resveratrol and quercetin (Rodriguez et al. Reference Rodriguez, Strucko and Stahlhut2017), consistent with observations from other plant-derived substrates. Furthermore, Aspergillus oryzae fermentation enhances polyphenol content by secreting glycosidases, amylases and xylanases, which hydrolyze glycosidically bound polyphenols into free, bioactive forms – a mechanism likewise reported in citrus peel and soybean by-product fermentations. In the present study, fermentation of LBPs led to pronounced increases in two Tricin-derived flavonoid glucosides, with 9.83-fold and 9.79-fold increases in Tricin 7-O-glucoside and Tricin 4′-O-glucoside, respectively. Both compounds share Tricin as their structural core, suggesting that Tricin derivatives are the predominant flavonoid metabolites formed during LBPs fermentation, likely due to selective enzymatic hydrolysis of flavonoid glycosides. Tricin, a known constituent of LB pulp and a secondary metabolite in various plant species, participates in lignin biosynthesis and exhibits potent anti-inflammatory and anticancer activities (Bai et al. Reference Bai, He and Roller2015). Notably, tricin 7-O-glucoside and tricin 4′-O-glucoside have rarely been reported in LBPs, highlighting the novelty of their identification in this study. Additionally, a 9.81-fold increase in iristectorigenin B-O-glucoside – an isoflavonoid glycoside found in Euphorbia and Iridaceae rhizomes – was observed. This compound is known for its antioxidant, anti-inflammatory, anti-osteoarthritic and anti-platelet effects (Duan et al. Reference Duan, Huang and Guan2022; Shukla et al. Reference Shukla, Srivastava and Kumar2020), indicating fermentation-mediated enrichment of bioactive isoflavonoids. Moreover, rhamnocitrin (7-methylkaempferol), hispidulin and nepetin were detected in LBPs extracts for the first time, implying that fermentation facilitates the release or biosynthesis of previously undetected flavonoids. These compounds exhibited notable variation in structure, VIP and FC values across fermentation stages, likely reflecting enzymatic glycoside cleavage and differences in metabolite solubility. Such variation may arise from the predominance of flavonoids in glycosidic forms, which are highly soluble in polar solvents and thus particularly sensitive to enzymatic activity, extraction efficiency and fermentation conditions (Wilson et al. Reference Wilson, Wu and Tian2019). Collectively, these findings demonstrate that mixed-microbe fermentation enhances the flavonoid profile of LBPs by promoting tricin-derivative accumulation, enriching isoflavonoids, and facilitating the release of previously undetected flavonoids, thereby improving their overall bioactive potential.
Fermentation duration has a profound effect on glycosylation and other structural modifications, thereby modulating flavonoid composition and bioactivity. For example, solid-state fermentation of citrus peels by Aspergillus niger revealed that fermentation time critically influences flavonoid accumulation and antioxidant activity, underscoring the temporal dependence of enzymatic biotransformation (Mamy et al. Reference Mamy, Huang and Akpabli-Tsigbe2022). Similarly, liquid fermentation and untargeted metabolomic analysis of Acanthopanax senticosus leaves demonstrated that both polyphenol content and fermentation duration markedly shaped metabolite profiles and overall fermentation outcomes (Zeng et al. Reference Zeng, Jiang and Yang2018), highlighting a strong link between fermentation kinetics and secondary metabolite accumulation. Previous studies have shown that lactic acid bacteria typically dominate around day 3, acidifying the medium and suppressing competing microorganisms, thereby creating favorable conditions for subsequent enzymatic reactions. By day 5, yeast and Bacillus species usually prevail, enhancing the activity of diverse metabolic enzymes and promoting further flavonoid transformation (Ho et al. Reference Ho, Fleet and Zhao2018). Xie et al. (Reference Xie, Bai and Zhang2023) reported that total flavonoid content in Aurantii fructus was closely correlated with microbial growth dynamics across fermentation durations, emphasizing the regulatory role of microbial activity in flavonoid biosynthesis. Total flavonoid levels increased from 0.766 ± 0.123 mg/100 g on day 3 to 0.850 ± 0.192 mg/100 g on day 5, reflecting a time-dependent accumulation trend. Conversely, Lim et al. (Reference Lim, Nguyen and Pal2022) observed that curcumin, demethoxycurcumin, bisdemethoxycurcumin, phenolic compounds and total flavonoids in fermented wild turmeric peaked on day 3 before declining, indicating that the optimal fermentation period varies among substrates and microbial consortia. In the present study, flavonoid levels were significantly higher in both F3 and F5 groups compared with the CON, confirming the positive effects of microbial fermentation. Notably, the concentration of lignan O-hexosyl-O-hexosyl-O-hexoside differed markedly between F3 and F5, with most flavonoids showing greater accumulation in F5, suggesting that extended fermentation enhances enzymatic modification and glycosylation. Overall, extending fermentation to 5 days proved more effective than shorter durations in promoting flavonoid accumulation, likely due to increased enzymatic activity and progressive structural transformation. These findings are consistent with previous reports highlighting the time-dependent nature of secondary metabolite accumulation during microbial fermentation, underscoring the importance of optimizing fermentation duration to maximize bioactive compound production. Collectively, our results indicate that extending mixed-microbe fermentation enhances flavonoid accumulation in LBPs by stimulating enzymatic activity, promoting glycosylation and facilitating structural diversification, thereby improving their bioactive potential.
Flavonoids share a core C6–C3–C6 structure composed of two benzene rings linked by a three-carbon bridge, which serves as the fundamental scaffold for diverse structural modifications. The flavonoid biosynthetic pathway begins with the conversion of L-phenylalanine to cinnamic acid, catalyzed by L-phenylalanine ammonia-lyase, a rate-limiting enzyme that influences the overall flux of flavonoid synthesis. Cinnamic acid is hydroxylated to coumaric acid by cinnamate-4-hydroxylase, a key step that determines the hydroxylation pattern of downstream flavonoids. Alternatively, L-tyrosine can be converted to coumaric acid through tyrosine ammonia-lyase activity, providing an additional entry point for flavonoid biosynthesis. Coumaroyl-CoA ligase and chalcone synthase catalyze the formation of naringenin and pinocembrin chalcones, which are subsequently converted to naringenin and pinocembrin by chalcone isomerase, representing critical branching points that drive flavonoid diversity. Flavonoid synthase subsequently converts these intermediates into a wide range of flavonoid metabolites, whose structural diversity is further modulated by glycosylation, methylation and acylation reactions. Structural variations among flavonoid metabolites primarily result from differences in hydroxylation patterns, B-ring substitution sites, heterocyclic saturation and fermentation-induced modifications such as enzymatic glycoside cleavage or methylation, as reported in other fermented plant by-products. Additionally, genetic variability in flavonoid biosynthetic enzymes, such as PAL, CHS and CHI, can significantly influence the accumulation of specific metabolites, including luteolin-7-O-glucoside (cynaroside), highlighting both genetic and enzymatic contributions to metabolite heterogeneity (Zhu et al. Reference Zhu, Liu and Wang2020). These findings indicate that mixed-microbe fermentation enhances the diversity and bioactive potential of flavonoids in LBPs by modulating enzyme-mediated hydroxylation, glycosylation and structural transformations along the biosynthetic pathway.
Microorganisms produce a wide range of enzymes during fermentation, which play pivotal roles in regulating diverse metabolic processes. For example, S. cerevisiae can regulate genes involved in malonyl-CoA metabolism and enhance the activity of enzymes such as chalcone synthase, cytochrome P450 reductase, flavonoid 2-hydroxylase, and C-glycosyltransferase. These enzymes catalyze the formation of compounds such as naringin, chamomile alcohol, apigenin and lignans, either directly or indirectly through C-glycosylation of 2-hydroxy flavonoid intermediates generated by flavonoid 2-hydroxylase, a mechanism also observed in other plant by-product fermentations (Lv et al. Reference Lv, Marsafari and Koffas2019; Wang et al. Reference Wang, Yang and Lin2016). Meanwhile, B. subtilis secretes a phosphotransferase that catalyzes flavonoid-specific reactions, selectively modifying the C-7’ hydroxyl of the A-ring or the C-4’ hydroxyl group of the B-ring, particularly in catechol-containing structures with 3’,4’-dihydroxy groups, this demonstrating the enzyme’s structural specificity and its role in metabolite variation (Hsu et al. Reference Hsu, Tsai and Chang2023). In the present study, naringenin chalcone was synthesized via chalcone synthase in the presence of propanoyl-CoA and subsequently cyclized to naringenin by chalcone isomerase, illustrating the key enzymatic steps contributing to flavonoid accumulation during fermentation. Furthermore luteolin-7-O-glucoside (cynaroside) formation was facilitated by flavonoid synthase, consistent with previous reports that flavonoid synthase activity promotes glycosylation and diversification of flavonoid metabolites in fermented plant materials. However, the specific substrates and enzymes responsible for the synthesis of other differential flavonoid metabolites remain unidentified, suggesting that additional microbial or enzymatic pathways may contribute to flavonoid diversity, as observed in other mixed-microbe fermentations of plant by-products.
Conclusions
This study investigated the effects of varying fermentation durations on LBPs. The results demonstrated that fermentation significantly increased CP content while concurrently reducing EE and CF levels. Fermentation also led to a decrease in total polysaccharide content and a notable increase in total polyphenol levels in the LBPs extract. Nontargeted metabolomic analysis identified 16 flavonoid metabolites whose levels were elevated after 3 or 5 days of fermentation. These metabolites included 6,7,8-tetrahydroxy-5-methoxyflavone, diosmetin, rhamnocitrin (7-methylkaempferol), hispidulin, nepetin, luteolin-7-O-glucoside (cynaroside), 6-hydroxyluteolin 5-glucoside, selgin 7-O-hexoside, iristectorigenin B-O-glucoside, tricin 7-O-glucoside, tricin 4′-O-glucoside, luteolin-7-O-rutinoside, luteolin-7-O-β-D-gentiobioside, luteolin O-hexosyl-O-hexosyl-O-hexoside and diosmetin-7-O-galactoside. These findings suggest that microbial fermentation promotes the accumulation of bioactive flavonoids, with a 5-day fermentation duration identified as optimal for maximizing flavonoid enrichment. Additionally, KEGG pathway enrichment analysis suggested that luteolin-7-O-glucoside (cynaroside) may be involved in the flavonoid biosynthetic pathway of LBPs, although further experimental validation is needed.
Limitations and perspectives
This study employed untargeted metabolomics to investigate changes in flavonoid metabolism and associated pathways in fermented LBPs extracts. Although the mixed microbial consortium exhibited promising metabolic activity, the specific microorganisms involved and their underlying mechanisms remain unclear and warrant further investigation. Furthermore, despite the comprehensive metabolomic profiling of fermented LBPs extracts, the precise bioactive components and their quantitative levels have yet to be determined. Future research should aim to identify these components and clarify their biological functions, thereby supporting their potential applications in functional foods and the development of bioactive compounds.
Supplementary Material
The supplementary material for this article can be found at https://doi.org/10.1017/anr.2025.10022.
Acknowledgements
This work was supported by the Natural Science Foundation of Ningxia Hui Autonomous Region (2020AAC03079), the Ningxia Higher Education Institutions’ First-Class Discipline Construction Fund (Herbology Discipline) (NXYLXK2017A01), the National Key Research and Development Program of China (2022YFD1300905), and the Shaoyang Science and Technology Program (2024PT6121). We also thank Dr. Qianming Jiang (University of Illinois) for her valuable assistance in revising the English version of this manuscript.
Author Contributions
J.L., C.H., and B.L. were the principal investigators of the study, responsible for conducting the experiments and writing the manuscript. D.X. revised the manuscript. As corresponding authors, S.W. and G.Z. designed the study and revised the manuscript.
Conflict(s) of Interest
The authors declare that there is no conflict of interest.
Ethics Statement
As the study did not involve animals or humans, ethical approval was not required.


 Open access