


Introduction
Numerous studies over the past two decades have documented the existence of mental health disparities among the transgender and gender diverse (TGD) population, which is the term used by the World Professional Association for Transgender Health (WPATH; Coleman et al., Reference Coleman, Radix, Bouman, Brown, de Vries, Deutsch, Ettner, Fraser, Goodman, Green, Hancock, Johnson, Karasic, Knudson, Leibowitz, Meyer-Bahlburg, Monstrey, Motmans, Nahata and Arcelus2022) to refer to people who experience a mismatch between their gender identity and their sex assigned at birth. For example, a large systematic review that included the results of 165 studies across multiple countries found that TGD people have a higher prevalence of mental health problems, most commonly mood and anxiety disorders, substance use disorders, and suicidality (Pinna et al., Reference Pinna, Paribello, Somaini, Corona, Ventriglio, Corrias, Frau, Murgia, El Kacemi, Galeazzi, Mirandola, Amaddeo, Crapanzano, Converti, Piras, Suprani, Manchia, Fiorillo and Carpiniello2022). Compared to the general population, TGD people also present higher rates of disordered eating (Rasmussen et al., Reference Rasmussen, Dalgaard, Roloff, Pinholt, Skrubbeltrang, Clausen and Kjaersdam Telléus2023), trauma exposure- and stress-related disorders (Feil et al., Reference Feil, Riedl, Böttcher, Fuchs, Kapelari, Gräßer, Toth and Lampe2023), and personality disorders (Anzani et al., Reference Anzani, Panfilis, Scandurra and Prunas2020). In line with international research, studies conducted in Spain report elevated levels of depression, anxiety, substance use, and suicidality in TGD people (Bergero-Miguel et al., Reference Bergero-Miguel, García-Encinas, Villena-Jimena, Pérez-Costillas, Sánchez-Álvarez, de Diego-Otero and Guzman-Parra2016; Guzmán-Parra et al., Reference Guzmán-Parra, Sánchez-Álvarez, de Diego-Otero, Pérez-Costillas, de Antonio, Navais-Barranco, Castro-Zamudio and Bergero-Miguel2016). More recently, an increasing number of studies have shown an elevated prevalence of neurodevelopmental disorders in TGD people compared to the general population, including autism spectrum disorders (ASD) and attention deficit hyperactivity disorder (ADHD) (Thrower et al., Reference Thrower, Bretherton, Pang, Zajac and Cheung2020). These mental health disparities have been understood from a gender minority stress framework, which posits that elevated rates of psychopathology in TGD populations are a consequence of chronic stress stemming from societal prejudice and discrimination (Hendricks & Testa, Reference Hendricks and Testa2012; Testa et al., Reference Testa, Habarth, Peta, Balsam and Bockting2015). In this regard, research suggests an association between minority stress and poor mental health among TGD individuals (Mezza et al., Reference Mezza, Mezzalira, Pizzo, Maldonato, Bochicchio and Scandurra2024) and that both social and medical affirmative practices can buffer these stressors and result in improved mental health outcomes (Chelliah et al., Reference Chelliah, Lau and Kuper2024).
While the mental health difficulties faced by TGD individuals have been extensively documented, much less research has been devoted to exploring the mental health of people who decide to detransition, that is, to discontinue or reverse the steps taken during their gender transition. Detransition is often associated with a shift in their gender self-conceptualization and may involve returning to a previous gender presentation or discontinuing previously initiated gender-affirming medical treatments (Littman, Reference Littman2021; MacKinnon, Kia, et al., Reference MacKinnon, Kia, Salway, Ashley, Lacombe-Duncan, Abramovich, Enxuga and Ross2022; Pullen Sansfaçon et al., Reference Pullen Sansfaçon, Gelly, Gravel, Medico, Baril, Susset and Paradis2023; Vandenbussche, Reference Vandenbussche2022). Detransition is a minority experience among TGD individuals (Feigerlova, Reference Feigerlova2025) that involves heterogeneous pathways, psychosocial experiences, and challenges (Expósito-Campos et al., Reference Expósito-Campos, Pérez-Fernández and Salaberria2024; MacKinnon et al., Reference MacKinnon, Kia, Gould, Ross, Abramovich, Enxuga and Lam2025), including detransition-specific minority stressors that can have a significant impact on the mental health of those who go through this process (Gelly et al., Reference Gelly, Atgé-Delbays and Pullen Sansfaçon2025). However, this phenomenon remains under-researched and poorly understood among clinicians and researchers.
In fact, only a few studies conducted in the last 5 years provide data on the mental health status of people with a history of detransition. For example, a cross-sectional survey-based study of 100 detransitioners by Littman (Reference Littman2021) found that, prior to the start of gender transition, 32% of participants reported having been diagnosed with depression, 27% with anxiety, and around 10% with post-traumatic stress disorder (PTSD) (11%), eating disorders (ED) (10%), and neurodevelopmental disorders such as ADHD (12%) and ASD (10%). In addition, 37% reported having experienced trauma. In another cross-sectional survey-based study of 78 detransitioned participants, Littman et al. (Reference Littman, O’Malley, Kerschner and Bailey2024) found an average number of lifetime diagnoses of 3.7, with depression (79.5%), anxiety (79.9%), ADHD (41%), PTSD (38.5%), ED (29.5%), and ASD and bipolar disorder (both 21.8%) being among the most commonly reported. Vandenbussche (Reference Vandenbussche2022) reported a high prevalence of diagnosed mental health problems in a cross-sectional community-based survey of 237 detransitioners, particularly depression (70%), anxiety (63%), PTSD (33%), ADHD (24%), ASD (20%), ED (19%), and personality disorders (17%). In Spain, Gómes-Porras et al. (Reference Gómes-Porras, Hurtado-Murillo, Gómez-Balaguer, Pazos-Guerra, Martín-González, Broccoli, Meneses González, Rodríguez-Collados, Del Castillo Villaescusa, Cuñar-Navarro and Morillas-Ariño2020) found that half of the patients who detransitioned in a clinical sample had a prior history of mental health conditions, including depression, personality disorders, and suicide attempts. Pazos Guerra et al. (Reference Pazos Guerra, Gómez Balaguer, Gomes Porras, Hurtado Murillo, Solá Izquierdo and Morillas Ariño2020) identified associated psychopathology, such as psychosis and self-harm, as significant factors in the detransition process.
Taken together, this literature provides evidence that both TGD and detransitioned people experience a high prevalence of mental health problems. Yet, the lack of a comparison group in these studies prevents a better understanding of the common and divergent mental health experiences of TGD and detransitioning people, which has important implications for clinical practice. It is entirely possible that both populations differ in their psychological profiles, personality variables, or psychopathological symptoms due to different gender trajectories, gender self-conceptualization, and pathways of identity development over time (Klimstra & Denissen, Reference Klimstra and Denissen2017). In care settings, this means that TGD individuals and those who detransition may have different clinical characteristics and mental health experiences that require tailored interventions and support mechanisms to meet their specific needs. Therefore, investigating and understanding these potential differences is critical to advancing clinical care that is sensitive to their unique experiences.
The Current Study
This study aims to fill this gap by comparing the mental health status of TGD and detransitioning participants using clinical assessment tools. Specifically, the data presented in this paper correspond to participants’ clinical assessments of personality and psychopathological symptoms, ED, and ASD. These data were drawn from a larger mixed-methods exploratory study of gender transition and detransition experiences among Spanish-speaking adults. The study used a two-pronged qualitative–quantitative approach consisting of: (a) a qualitative component through semi-structured interviews to explore participants’ experiences and needs; and (b) a quantitative component through self-report questionnaires to assess their gender-related experiences and mental health. The overall aim of the project was to understand the experiences, needs, and mental health of participants with diverse gender identities and trajectories in order to improve mental health services and psychological care.
The primary aim of this article is to compare two subsamples: one consisting of TGD participants and another of participants who have detransitioned. To our knowledge, this is the first study to recruit, analyze, and compare TGD and detransitioned participants simultaneously, as well as the first to assess a sample of detransitioners through validated clinical assessment tools. The use of clinical assessment tools in this study was not intended to pathologize the experiences of TGD or detransitioning individuals, but to identify specific areas of psychological distress and needs relevant to clinical work with these populations. Given the exploratory nature of the study and the absence of prior comparative research in this area, we were not able to establish pre-determined specific hypotheses regarding the results of the analysis.
Data Transparency and Openness
The study’s design and analyses were not pre-registered. The code and deidentified data on which the study’s conclusions are based are available on the Open Science Framework at https://osf.io/bthp2/?view_only=b2bf74540f2a422395f9ac1c09e7fe88. All instruments, methods, and statistical packages are reported and cited both in the text and in the references section. We also report how we determined the sample size, all data exclusions, and all measures in the study. As this was a nonexperimental, cross-sectional, exploratory study, there were no manipulations. The study was approved by the Ethics Committee for Research Involving Human Subjects (M10_2021_283) and included in the Register of Personal Data Processing (TI0305) of the University of the Basque Country. All procedures were carried out in accordance with the Declaration of Helsinki and its later amendments.
Method
Participants
Participants were considered eligible for the study if they: (a) currently self-identified as TGD or as having detransitioned, regardless of the steps taken during gender transition (social, medical, or both); (b) were 18 years of age or older; and (c) lived in a Spanish-speaking country and were fluent in Spanish. We excluded individuals with any physical or mental health condition that would interfere with their participation or who did not have sufficient availability to participate. We did not predetermine our sample size, which was limited by the study’s qualitative component, the difficulty in accessing the populations of interest, and the extensive nature of the evaluation performed.
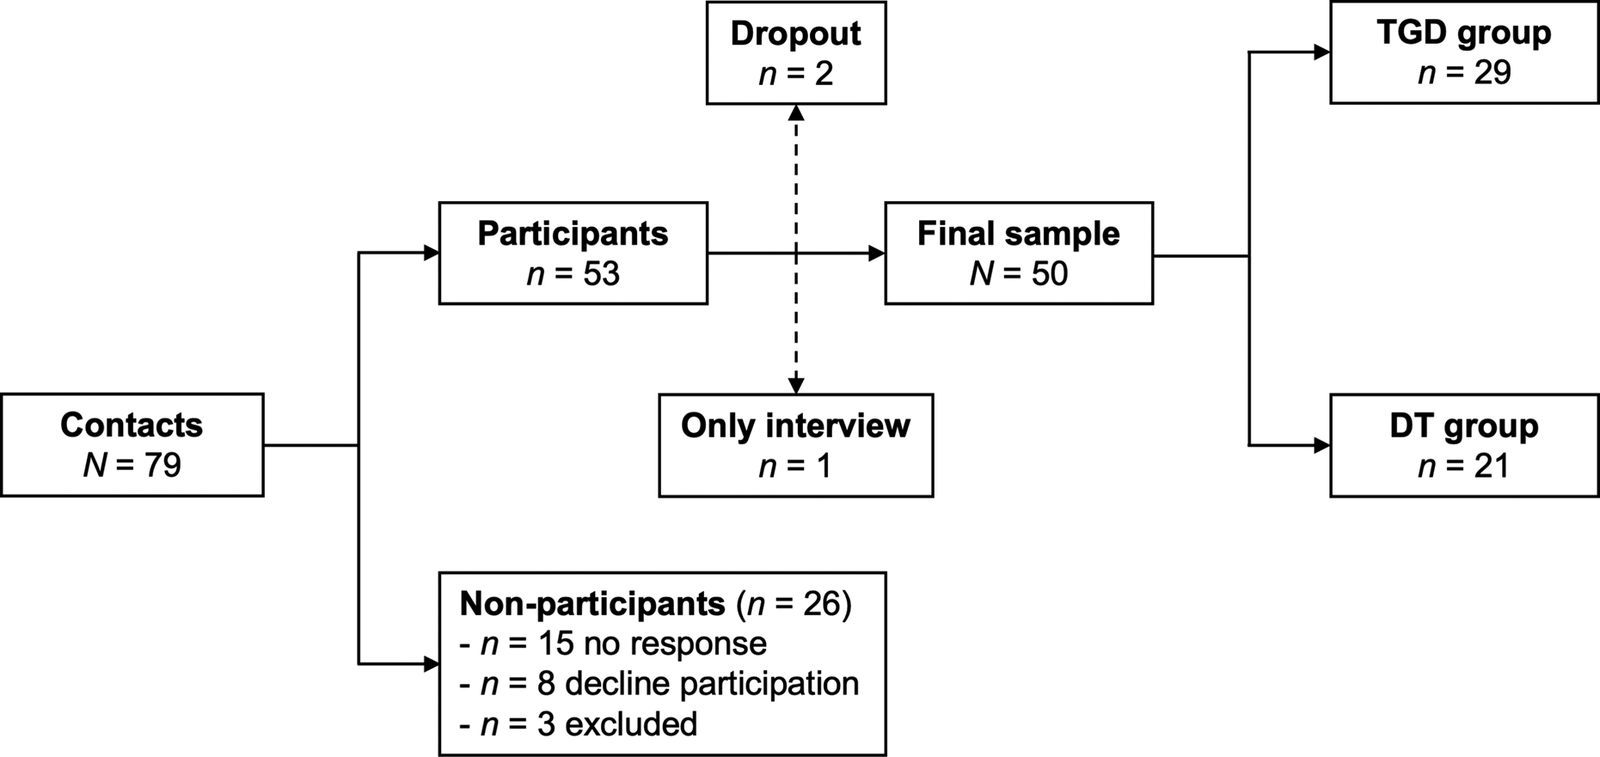
From January 2023 to June 2024, a total of 79 individuals expressed interest in the study, of which 53 ultimately provided informed consent to participate (67.1% participation rate). However, of those, one participant did not complete the self-report questionnaires, and two chose to withdraw after completing the assessment. Of the remaining 26 interested individuals, most either did not respond to further contact or declined to participate (Figure 1).
Participant flow chart.

The primary objective of the study was to compare TGD participants with those with an experience of detransition. Therefore, we categorized our analytical sample into two groups: a “TGD group” and a “detransition group” (DT group). To do so, we used participants’ experiences of having stopped, shifted, or reversed some or all of the social, administrative, and/or medical changes associated with their gender transition, along with the presence or absence of a self-reported change in their gender self-conceptualization. Given the lack of similar comparative studies, we made this decision in an effort to be consistent with previous research and to align with the recognition that detransition experiences involve a change in identity or gender-related self-understanding (Hildebrand-Chupp, Reference Hildebrand-Chupp2020; Littman, Reference Littman2021; MacKinnon et al., Reference MacKinnon, Kia, Gould, Ross, Abramovich, Enxuga and Lam2025; Pullen Sansfaçon et al., Reference Pullen Sansfaçon, Gravel, Gelly, Planchat, Paradis and Medico2024; Vandenbussche, Reference Vandenbussche2022). Thus, the first group (TGD) included participants who indicated no changes in their gender self-conceptualization after gender transition (n = 29), while the second group (DT) comprised those who stopped, shifted, or reversed transition-related changes and reported a shift in their gender self-conceptualization following gender transition (n = 21). A detailed description of the sociodemographic characteristics, gender trajectories, and history of mental health of the whole study sample can be found elsewhere (Expósito-Campos et al., Reference Expósito-Campos, Salaberria and Pérez-Fernández2025).
TGD Group (n = 29)
The mean age of TGD participants was 28.28 years (SD = 8.42, range = 18–47), and the majority (72.4%) were assigned female at birth (AFAB). In terms of current gender self-conceptualization, 55.5% defined themselves as men, 27.6% as women, and 17.2% as nonbinary. More than half of the participants (55.2%) identified as bisexual, pansexual, or fluid. The majority lived in Spain (96.6%), did not have university studies (58.6%), and reported a monthly income of ≤1,000€ (75.8%). All participants had socially transitioned, and 24 had medically transitioned (all reported gender-affirming hormonal treatment [GAHT] and 12 reported gender-affirming surgery [GAS]). Two participants had discontinued GAHT.
DT Group (n = 21)
The mean age of DT participants was 29.19 years (SD = 9.08, range = 18–49), and 66.7% were AFAB. In terms of gender self-conceptualization, 71.4% had reidentified with their assigned sex at birth (28.6% defined themselves as men and 42.9% as women), 19% identified as nonbinary, and 9.5% were questioning their identity. A total of 57.1% of participants identified as bisexual, pansexual, or fluid. Most lived in Spain (85.7%), did not have a university degree (71.4%), and reported an income of ≤1,000€ (71.4%). All participants had socially transitioned, and 18 had medically transitioned (all reported GAHT and 10 reported GAS). Of those who started GAHT (n = 18), all had discontinued, and seven had taken measures to reverse their medical transition.
Measures
Sociodemographic and Gender Trajectory Characteristics
Using two brief, ad hoc, self-constructed surveys, participants were asked questions about their age, sex assigned at birth, current gender self-conceptualization, sexual orientation, country of residence, educational level, and socioeconomic status. We also gathered information about the types of steps participants took (social, administrative, hormonal, and/or surgical) to transition or detransition.
Screening of ED
We used the SCOFF (Sick-Control-One stone-Fat-Food) survey, developed by Morgan et al. (Reference Morgan, Reid and Lacey1999) and validated in Spanish by Garcia-Campayo et al. (Reference Garcia-Campayo, Sanz-Carrillo, Ibañez, Lou, Solano and Alda2005). This is a screening instrument that assesses the possible presence of ED using five items (e.g., “Would you say that food dominates your life?”) with two response options (yes [1] or no [0]) (score range = 0–5). For the SCOFF, a cutoff of two or more positive responses indicates the possible presence of an ED. Its Spanish validation demonstrated a sensitivity of 97.7%, a specificity of 94.4%, and a test–retest correlation of .97. A Cronbach’s alpha value of .55 [95% CI .31, .71] was obtained in this study.
Screening for ASD
We used the 10-item version of the Autism Quotient (AQ-10), developed by Allison et al. (Reference Allison, Auyeung and Baron-Cohen2012) and adapted to Spanish by López (Reference López2020). The AQ-10 is a screening instrument that assesses the possible presence of ASD. It consists of 10 items (e.g., “I find it difficult to work out people’s intentions”) with four response options ranging from 1 (definitely disagree) to 4 (definitely agree), which are then dichotomized into positive (1) or negative (0) responses (score range = 0–10). A score of 6 or higher on the AQ-10 suggests a possible presence of ASD. The Spanish adaptation of the scale demonstrated a sensitivity of 89% and a specificity of 91%. The instrument had an internal consistency of .60 in the Spanish adaptation and of .66 [95% CI .52, .76] in the present study.
Personality and Psychopathological Symptoms
We used the Personality Assessment Inventory (PAI), developed by Morey (Reference Morey1991) and validated in Spanish by Ortiz-Tallo et al. (Reference Ortiz-Tallo, Santamaría, Cardenal and Sánchez2011). This instrument assesses several areas of personality and psychopathology in adults through 344 items organized into 22 scales: (a) four validity scales (inconsistency, infrequency, negative impression, and positive impression); (b) 11 clinical scales (somatic concerns, anxiety, anxiety-related disorders, depression, mania, paranoia, schizophrenia, borderline features, antisocial features, alcohol problems, and drug problems); (c) five treatment consideration scales (aggression, suicidal ideation, stress, nonsupport, and treatment rejection); and (d) two interpersonal scales (dominance and warmth). All of the clinical scales, as well as the aggression scale, have subscales that provide more information about the participants’ personality and symptomatology variables. Items are scored on a Likert scale with four response options (false, slightly true, mainly true, and very true).
The PAI also includes five supplementary validity indicators (end-of-questionnaire inconsistency, malingering, rogers discriminant function, defensiveness, and Cashel discriminant function) and three supplementary indices (suicide potential, violence potential, and treatment process) to aid in clinical interpretation. The PAI presents additional data on 26 critical items that alert to issues that may require attention, grouped into: (a) delusions and hallucinations; (b) risk of self-harm; (c) risk of aggression; (d) substance abuse; (e) traumatic stressors; (f) risk of malingering; (g) lack of integrity; and (h) idiosyncratic response.
Raw scores are converted to T-scores with a mean of 50 and a standard deviation of 10, and both general and clinical reference scales are available. Since most of the participants in this study came from community settings, we used the general reference scales. The internal consistency of the clinical, treatment consideration, and interpersonal scales in the Spanish validation ranged from .64 to .89.
The Cronbach’s alpha values for the PAI scales in the study ranged from .58 to .94. Specifically, the following values were obtained: .87 [95% CI .79, .92] for somatic concerns, .90 [95% CI .84, .94] for anxiety, .75 [95% CI .63, .83] for anxiety-related disorders, .91 [95% CI .86, .95] for depression, .81 [95% CI .71, .87] for mania, .81 [95% CI .71, .87] for paranoia, .80 [95% CI .63, .87] for schizophrenia, .86 [95% CI .79, .91] for borderline features, .76 [95% CI .64, .84] for antisocial features, .82 [95% CI .68, .93] for alcohol problems, .78 [95% CI .47, .85] for drug problems, .83 [95% CI .73, .88] for aggression, .94 [95% CI .89, .96] for suicidal ideation, .58 [95% CI .28, .76] for stress, .79 [95% CI .63, .88] for nonsupport, .70 [95% CI .50, .81] for treatment rejection, .74 [95% CI .61, .83] for dominance, and .73 [95% CI .57, .83] for warmth.
Procedure
To engage TGD individuals, and particularly those who have detransitioned, we implemented various convenience sampling strategies useful for hard-to-reach populations, including snowball sampling, sampling through community organizations, and respondent-driven sampling (Bonevski et al., Reference Bonevski, Randell, Paul, Chapman, Twyman, Bryant, Brozek and Hughes2014). We also created a dedicated website to provide detailed information about the study objectives, methodology, and research team members, where potential participants could register through an online form or contact the research team via WhatsApp, social media, or email. We also shared recruitment flyers on X/Twitter and Instagram and promoted the study on a relevant Reddit community (r/detrans) known to be frequented by potential participants. Finally, we sent email invitations to various LGBTQ+ organizations, gender identity services at public hospitals, and healthcare providers specializing in gender-affirming care.
Interested individuals were contacted by the research team to explain the purpose and structure of the study, the level of commitment required for participation, and the potential benefits and inconveniences. They were also informed of the anonymous and confidential nature of the study, their rights as participants, and how their personal data would be handled. Participants were also given the opportunity to ask questions about the study. Individuals who agreed to participate were asked to sign an online consent form, after which meetings were scheduled. Participants could choose between a face-to-face or online format for their participation. Online participation was facilitated by Psypocket, a secure platform developed by the General Council of Psychology in Spain that ensures compliance with the Organic Law on the Protection of Personal Data. Each participant was provided with a unique, randomly generated username and password to access the platform. Prior to the assessment, participants completed two short online surveys that collected basic sociodemographic information and details about their gender trajectory.
During the assessment, participants were asked to complete a series of self-report questionnaires assessing various aspects of their gender-related experiences and mental health. To mitigate potential trust issues, which are not uncommon among minority populations and particularly among TGD individuals (Owen-Smith et al., Reference Owen-Smith, Woodyatt, Sineath, Hunkeler, Barnwell, Graham, Stephenson and Goodman2016), participants were given a detailed explanation of the purpose of each questionnaire, the variables they intended to measure, and why we were interested in assessing them. Participants were also given the opportunity to ask questions about the questionnaires and clarify any difficulties they had in understanding the items. We made this decision in an effort to be transparent, in line with recommendations for conducting research with TGD participants (Vincent, Reference Vincent2018). All assessments were conducted by a single investigator (the first author), who is a licensed general health psychologist with experience in transgender health and formal training in the administration and interpretation of the PAI. As a reward for their time, participants received a detailed report of their study results, including an explanation of their interpretation and clinical significance.
Data Analysis
To analyze between-group differences in the possible presence of ED and ASD, we computed total scores and classified participants into “positive” and “negative” screeners based on the cutoff score of each questionnaire. To analyze between-group differences in psychopathology and personality, we first computed T-scores for each scale using TEACorrige, an online correction platform for the PAI. We then performed a visual inspection of the responses and scores of the four validity scales. Based on this, and following the recommendations of the PAI manual, we excluded 4 of the 50 PAI profiles: one for errors in the response that made it uninterpretable, one for careless/random responding (high scores in both inconsistency [T = 76] and infrequency [T = 72]), one for negative distortion (very high score in negative impression [T = 103]), and another for positive distortion (very high score in positive impression [T = 67]).
We then examined the additional validity indicators for the remaining 46 valid PAI profiles. Six profiles had high scores on the end-of-questionnaire inconsistency scale (T > 69), indicating inconsistency between responses to the first and second halves of the PAI. Therefore, to ensure the least amount of bias in our analyses, and as recommended by the PAI manual, we decided to use an abbreviated PAI profile for these participants based only on their responses to the first 165 items. These abbreviated PAI profiles included scores for the main clinical, treatment consideration, and interpersonal scales, but not for any of the subscales or additional indicators. This left us with a sample of 46 PAI profiles with full score data for the main scales (n = 27 for the TGD group and n = 19 for the DT group) and 40 PAI profiles with full data for the subscales and additional indicators (n = 23 for the TGD group and n = 17 for the DT group).
We used the cutoff points established by the PAI manual to classify the scores obtained on the main scales and subscales as moderately elevated (i.e., at least 1 standard deviation above the mean) and high (i.e., at least 2 standard deviations above the mean). However, because low and very low scores on some of the scales and subscales also provide useful clinical information, we used cutoff points, where available, to classify scores into low (i.e., at least 1 standard deviation below the mean) and very low (i.e., at least 2 standard deviations below the mean). Finally, we examined the number of participants who responded positively (i.e., mainly true or very true) to critical items, focusing on those with clinical significance: delusions and hallucinations, risk of self-harm, risk of aggression, substance abuse, and traumatic stressors. Information on these items was only available for the 40 complete PAI profiles.
We used RStudio (version 4.4.1; Posit Team, 2024) for all statistical procedures, with a conventional confidence level of 95% (α = .05) for statistical significance. We conducted both score-based and proportion-based analyses for each assessment instrument. Differences between the TGD and the DT groups were analyzed using tests of association for categorical variables (proportions) and two-sample t-tests for continuous variables (mean T-scores). We also computed an associated effect size and 95% confidence intervals (CI). All tests were two-tailed. Percentages were rounded to one decimal place, while test statistics, effect sizes, and CI were rounded to two decimal places. P-values were rounded to three decimal places.
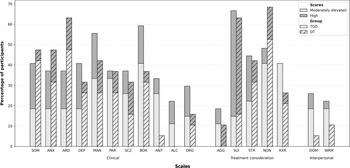
For the tests of association, we followed the work of Fagerland et al. (Reference Fagerland, Lydersen and Laake2017) and conducted a Suissa–Shuster exact unconditional test using the exact.test function from the “Exact” R package (version 3.3; Calhoun, Reference Calhoun2024). We employed the z-pooled (zp) statistic for these calculations. The difference between proportions (indicated by Δ) is reported as the effect size, along with Agresti–Min exact unconditional 95% CI. For the two-sample t-tests, following recommendations by various authors (Delacre et al., Reference Delacre, Lakens and Leys2017, Reference Delacre, Lakens, Ley, Liu and Leys2021; Karch, Reference Karch2021; Noguchi et al., Reference Noguchi, Konietschke, Marmolejo-Ramos and Pauly2021), we performed permutated Welch’s t-tests using the perm.t.test function from the “MKinfer” R package (version 1.2; Kohl, Reference Kohl2024). For the effect size, we computed Hedge’s g with bias-corrected and accelerated bootstrap 95% CI using the DurgaDiff function from the “Durga” R package (version 2.0; Khan & McLean, Reference Khan and McLean2024). We set a value of 10,000 for both permutations and bootstrap samples. Figure 2 was created using Matplotlib (Hunter, Reference Hunter2007) through the PyCharm integrated development environment (version 2024.3.4; JetBrains, 2024).
Proportion of participants within each group with moderately elevated or high T-scores on the main PAI scales.
Notes. SOM = Somatic concerns; ANX = Anxiety; ARD = Anxiety-related disorders; DEP = Depression; MAN = Mania; PAR = Paranoia; SCZ = Schizophrenia; BOR = Borderline features; ANT = Antisocial features; ALC = Alcohol problems; DRG = Drug problems; AGG = Aggression; SUI = Suicidal ideation; STR = Stress; NON = Nonsupport; RXR = Treatment rejection; DOM = Dominance; WRM = Warmth; TGD = Transgender and gender diverse; DT = Detransition.

Results
Below, we first present the results for the screenings of ED and ASD. Then, results for the PAI are presented according to the following structure: (a) validity scales; (b) clinical scales and subscales; (c) treatment consideration scales; (d) interpersonal scales; and (e) critical items and complementary indices.
Screening of ED and ASD
Fourteen participants (28%) scored above the SCOFF cutoff, suggesting the possible presence of an ED. The percentage of participants with scores above the cutoff was similar across the groups (TGD = 27.6% vs. DT = 28.6%, zp = −0.08, p = .966, Δ = − .01 [95% CI -0.27, 0.24]). Fourteen participants (28%) scored above the AQ-10 cutoff, suggesting the possible presence of ASD. The percentage of DT participants who scored above the cutoff was higher (TGD = 17.2% vs. DT = 42.9%); this difference was marginally statistically significant (zp = −1.99, p = .054, Δ = − .26 [95% CI −0.50, 0.00]).
Personality and Psychopathological Symptoms
Validity Scales
The mean T-scores of both groups were within the normal range for all scales. There were no statistically significant differences between the TGD and DT groups (Table 1). However, the TGD group had a higher mean T-score (M = 60.89) than the DT group (M = 53.89) on negative impression. Although this difference was not statistically significant (t = −1.90, p = .068), it was associated with a moderate effect size (Hedges’ g = 0.53 [95% CI 0.01, 1.08]). In fact, there was a statistically significantly higher number of participants in the TGD group who scored moderately elevated on negative impression compared to the DT group (TGD = 29.6% vs. DT = 0%, zp = 2.61, p = .009, Δ = .30 [95% CI 0.09, 0.49]).
Analysis of group mean differences on the PAI validity, clinical, treatment consideration, and interpersonal scales

Notes. M = 50, SD = 10. CI = Confidence interval.
a Mean T-score above the cutoff for moderately elevated scores (T ≥ 60 for all clinical, treatment consideration, and interpersonal scales except for mania [T ≥ 55] and treatment rejection [T ≥ 50]).
b Mean T-score above the cutoff for high scores (T ≥ 70 for all clinical, treatment consideration, and interpersonal scales except for mania [T ≥ 65] and treatment rejection [T ≥ 61]).
Clinical Scales and Subscales
Clinical Scales. Figure 2 shows the percentage of participants in each group who scored moderately elevated or high in each of the PAI main clinical scales. A notable number of TGD participants obtained scores within this range on all scales, particularly borderline features (59.3%), mania (55.6%), somatic concerns (40.7%), and depression (40.7%). In the DT group, many participants also scored moderately elevated or high on all scales (except antisocial features and alcohol problems), particularly anxiety-related disorders (63.2%), somatic concerns (47.4%), anxiety (47.4%), and mania (42.1%).
From a clinical viewpoint, the mean T-scores for the TGD group were above the reference mean for each scale, except for alcohol problems. The mean score for mania was the most elevated and within the range of clinical concern (T = 55–64). Borderline features and anxiety-related disorders were also particularly elevated. However, except for mania, none of the mean T-scores for the remaining scales fell into the range of clinical concern. The DT group, on the other hand, obtained mean T-scores above the reference mean on every clinical scale, except for antisocial features, alcohol problems, and drug problems. The mean score for anxiety-related disorders was the most elevated and within the range of clinical concern (T = 60–69) (Table 1).
In terms of differences, the TGD group scored statistically significantly higher than the DT group on antisocial features (MTGD = 53.30 vs. MDT = 47.37, p = .049) and alcohol problems (MTGD = 51.81 vs. MDT = 45.58, p = .029). In both cases, this difference was associated with a moderate effect size (Hedges’ g = 0.59 [95% CI -0.01, 1.15] and Hedges’ g = 0.60 [95% CI 0.13, 1.01], respectively) (Table 1). Similarly, a significantly higher proportion of TGD participants scored moderately elevated or high on antisocial features (TGD = 33.3% vs. DT = 5.3%, zp = 2.27, p = .023, Δ = .28 [95% CI 0.04, 0.49]) and alcohol problems (TGD = 22.2% vs. DT = 0%, zp = 2.20, p = .029, Δ = .22 [95% CI 0.03, 0.42]). The number of DT participants with moderately elevated scores on anxiety-related disorders was significantly higher (TGD = 18.5% vs. DT = 47.4%, zp = −2.09, p = .042, Δ = − .29 [95% CI −0.54, −0.01]).
Clinical Subscales. Of the 40 PAI profiles considered, the TGD group’s mean T-scores showed elevations above the reference mean in all subscales, except for hypervigilance. Obsessive-compulsive and traumatic stress were in the range of clinical concern (T = 55–64 and T = 60–64, respectively). Mean T-scores for identity problems and negative relationships were also moderately elevated and in the clinical concern range (both T = 60–69) (Table 2). The DT group also scored above the reference mean on all scales except hypervigilance, self-harm, antisocial behavior, egocentricity, and stimulus seeking. Social detachment and obsessive-compulsive were within the range of clinical concern (T = 60–69 and T = 55–64, respectively) (Table 2).
Analysis of group mean differences on the PAI clinical and treatment consideration subscales
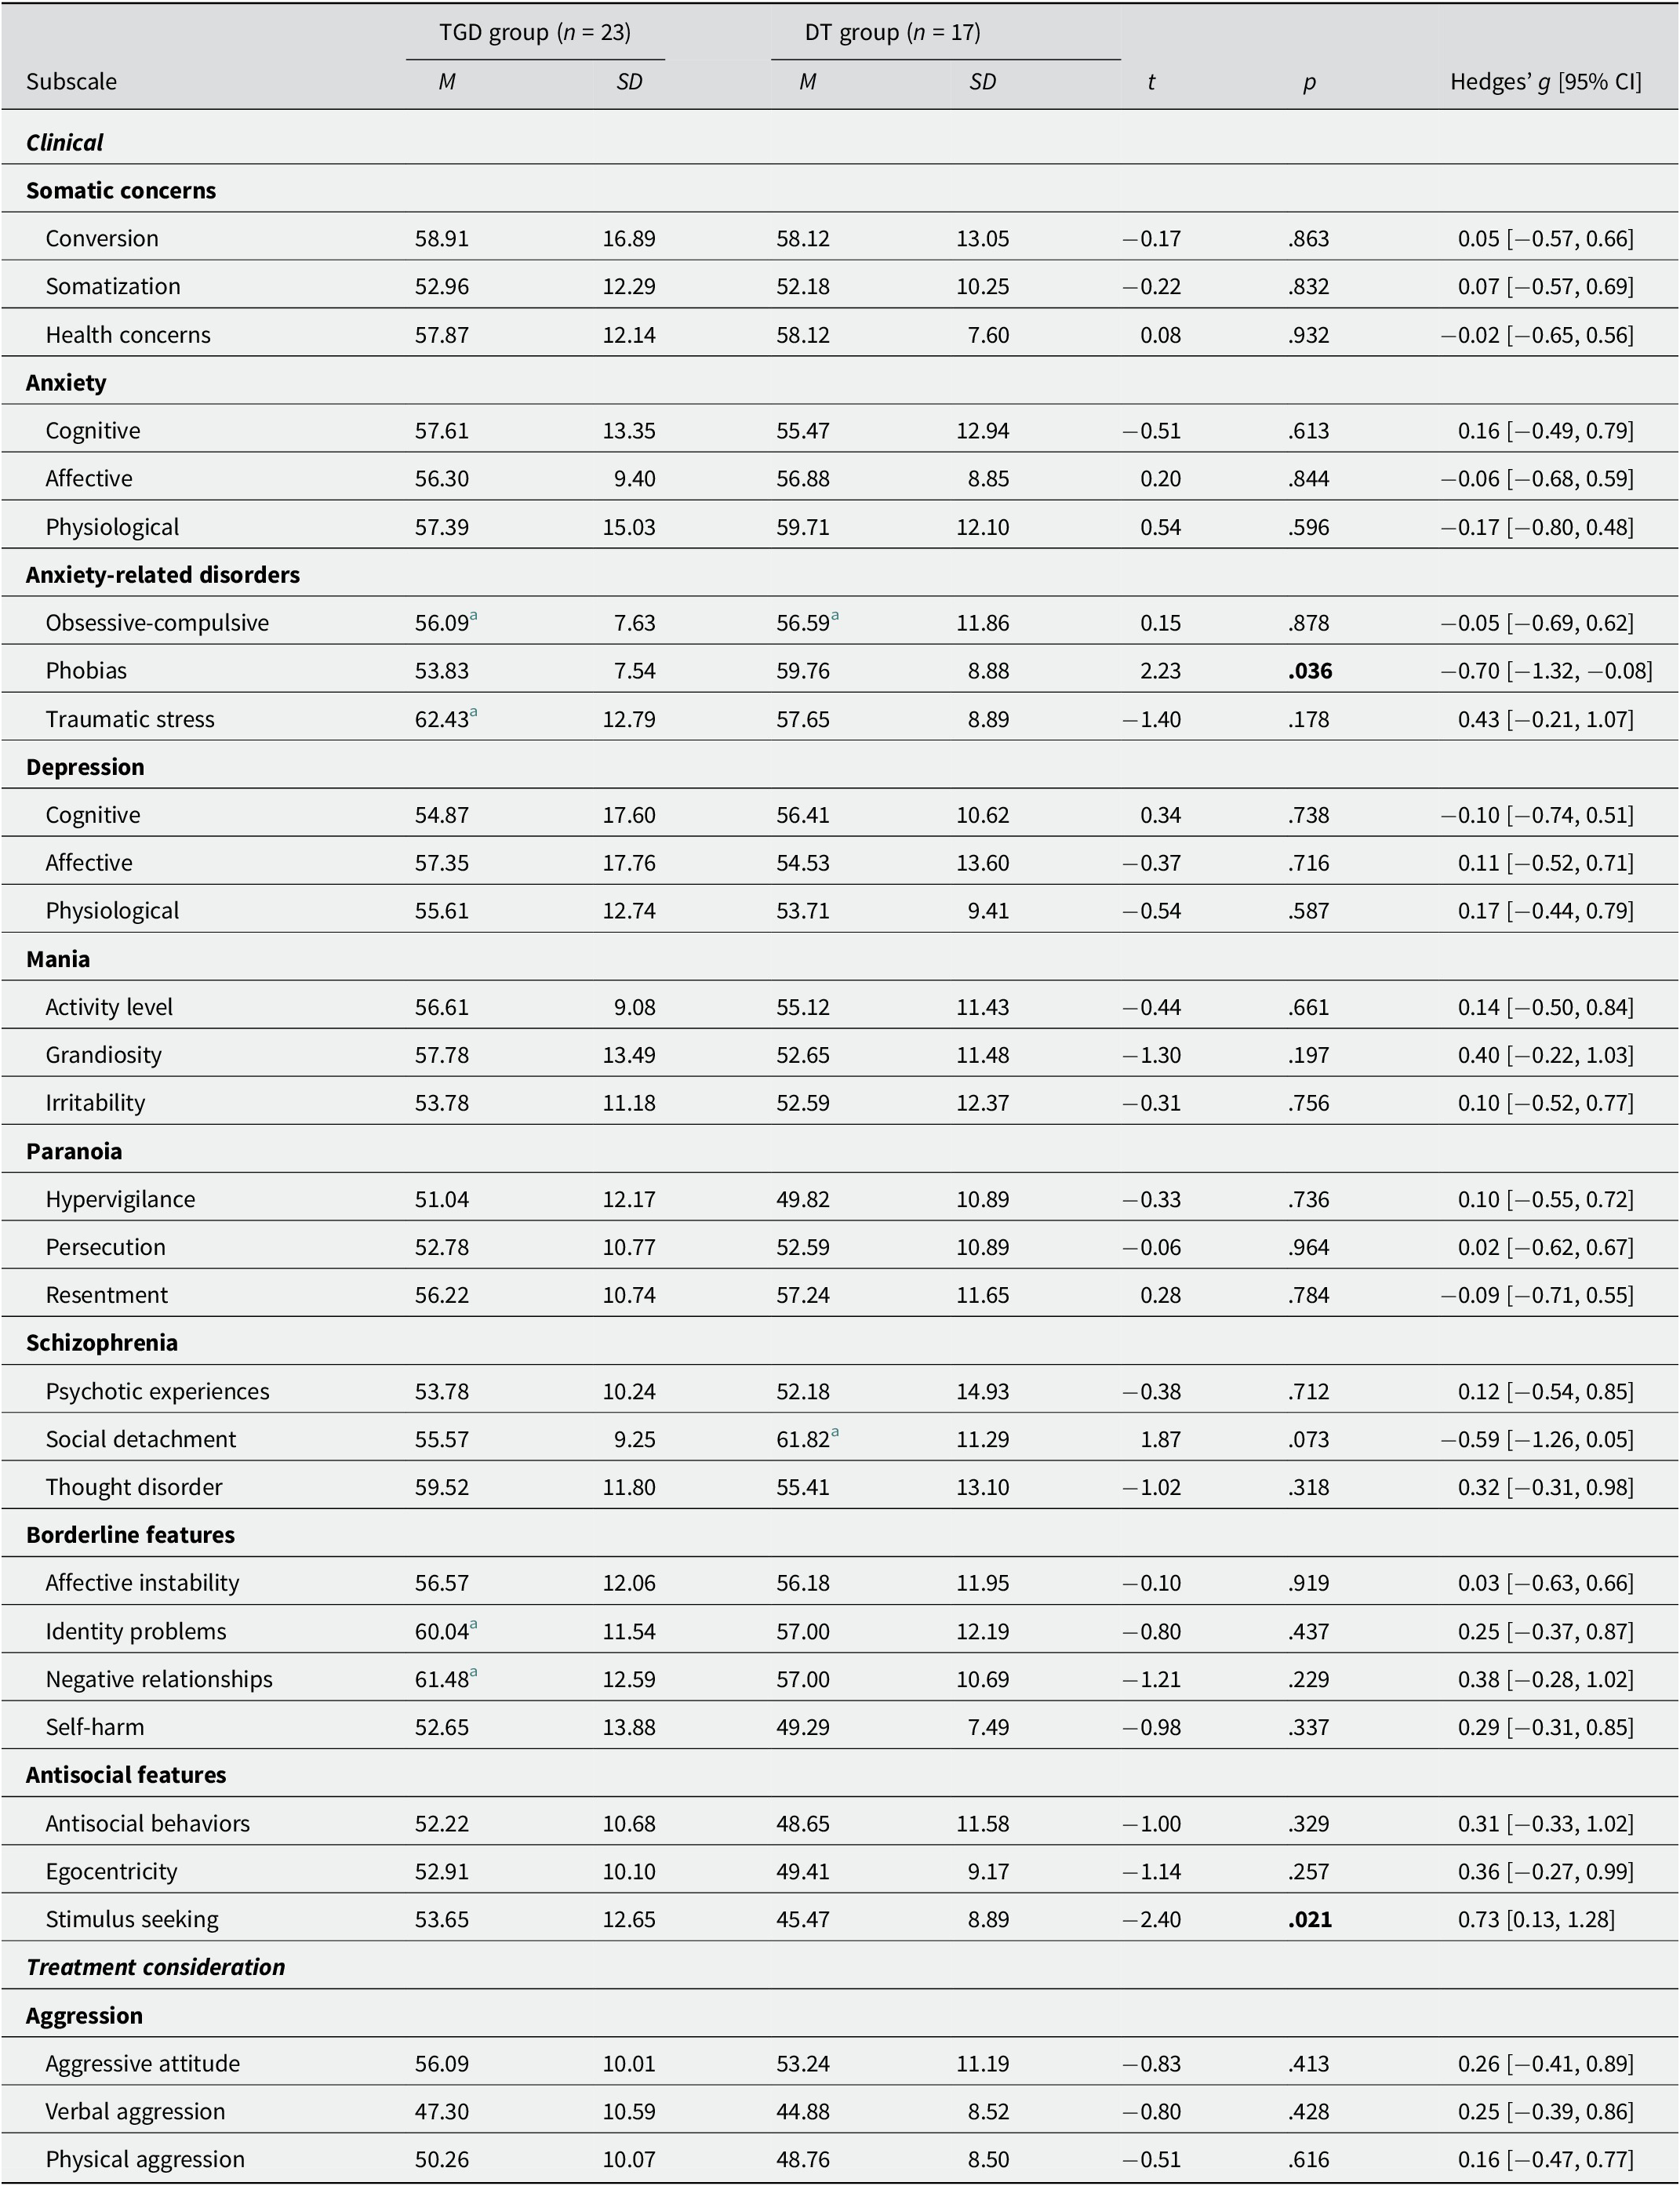
Notes. M = 50, SD = 10. CI = Confidence interval.
a Mean T-score above the cutoff for moderately elevated scores (T ≥ 60 for all subscales except for obsessive-compulsive [T ≥ 55]).
In terms of differences, the DT group scored statistically significantly higher on phobias than the TGD group (MTGD = 53.83 vs. MDT = 59.76, p = .036), a difference associated with a moderate effect size (Hedges’ g = −0.70 [95% CI −1.32, −0.08]) (Table 2). In fact, a significantly greater number of DT participants scored high on phobias (TGD = 0% vs. DT = 17.6%, zp = −2.09, p = .034, Δ = − .18 [95% CI −0.42, −0.01]). In addition, significantly more DT than TGD participants scored high on social detachment (TGD = 8.7% vs. DT = 35.3%, zp = −2.08, p = .044, Δ = − .27 [95% CI −0.52, −0.01]). Conversely, the TGD group obtained a statistically significantly higher T-score on stimulus seeking (MTGD = 53.65 vs. MDT = 45.47, p = .021), and this difference was associated with a moderate effect size (Hedges’ g = 0.73 [95% CI 0.13, 1.28]) (Table 2). The TGD group also had a statistically significantly greater number of participants with moderately elevated or high T-scores on self-harm (TGD = 34.8% vs. DT = 5.9%, zp = 2.16, p = .031, Δ = .29 [0.02, 0.52]).
Treatment Consideration Scales
As can be seen in Figure 2, there was a very high percentage of participants in both groups who scored moderately elevated or high on suicidal ideation (TGD = 66.7%, DT = 63.2%), nonsupport (TGD = 48.1%, DT = 68.4%), and stress (TGD = 44.4%, DT = 42.1%). In the suicidal ideation scale specifically, around half of the participants in both groups scored high (T ≥ 70) (TGD = 51.9%, DT = 47.4%). TGD participants’ mean T-scores were above the reference mean for all scales except aggression and treatment rejection. The mean T-score for stress was within the range of clinical concern (T = 60–69), while the mean score for suicidal ideation was well above the highest cutoff point of T ≥ 70. For the DT group, we observed elevated scores for suicidal ideation, stress, and nonsupport. Specifically, suicidal ideation was in the upper part of the clinical concern range (T = 60–69). There were no statistically significant differences between the TGD and DT groups (Table 1).
Interpersonal Scales
Figure 2 shows that about a quarter of TGD participants scored moderately elevated or high on dominance (25.9%) and warmth (22.2%), and that this percentage was higher compared to the DT group. In fact, there were no DT participants with high scores in any of these scales, and almost a third (31.6%) scored very low on dominance, and 21.1% on warmth. In terms of differences, the TGD group scored statistically significantly higher than the DT group on dominance (MTGD = 53.70 vs. MDT = 44.89, p = .010), a difference associated with a large effect size (Hedges’ g = 0.81 [95% CI 0.20, 1.41]) (Table 1). A statistically significantly higher number of DT participants scored very low on this scale (TGD = 0% vs. DT = 31.6%, zp = −3.13, p = .002, Δ = −0.32 [95% CI −0.55, −0.04]).
Critical Items and Complementary Indices
Seventy-four percent of TGD participants answered mainly true or very true to at least one critical item. The categories with the highest percentage of positive respondents were traumatic stressors (65.2%) and risk of self-harm (43.5%). Similarly, 76.5% of DT participants agreed with at least one critical item from the categories examined, and the categories with the highest percentage of positive respondents were traumatic stressors (41.2%) and risk of self-harm (29.4%). There were no statistically significant differences between the groups.
Five TGD participants (21.7%) exhibited scores on the complementary indices indicating suicide potential, and four (17.4%) indicating violence potential. In the DT group, only one participant (5.9%) obtained a score indicative of suicide potential. No statistically significant differences between the groups were observed.
Discussion
This study aimed to investigate and compare the mental health status of 29 TGD participants and 21 participants with experiences of detransition through validated self-report clinical assessment tools. The combined application of the PAI with screening measures for ED (SCOFF) and ASD (AQ-10) allowed us to identify both shared vulnerabilities and unique group-specific profiles, which offer a comprehensive and nuanced understanding of mental health in TGD and DT populations.
ED and ASD Screening
Firstly, we observed that 28% of the study sample obtained scores indicating the possible presence of ED, which is consistent with findings from other studies showing an increased prevalence of ED among TGD people (Rasmussen et al., Reference Rasmussen, Dalgaard, Roloff, Pinholt, Skrubbeltrang, Clausen and Kjaersdam Telléus2023). The observed percentage of potential ED in our TGD sample (27.6%) is also consistent with the range of 28–34.2% of participants screened positive using the SCOFF in the studies included in Rasmussen et al.’s (Reference Rasmussen, Dalgaard, Roloff, Pinholt, Skrubbeltrang, Clausen and Kjaersdam Telléus2023) meta-analysis. Regarding DT participants, the lack of studies using validated measures precludes direct comparisons; however, the figures observed in our study (28.6%) are consistent with the 19–29.5% prevalence rates of self-reported ED diagnoses in the survey-based online studies by Littman et al. (Reference Littman, O’Malley, Kerschner and Bailey2024) and Vandenbussche (Reference Vandenbussche2022). In general, the findings resonate with a growing body of literature suggesting elevated rates of disordered eating in gender minority populations. Although the lack of group differences suggests that, irrespective of their gender trajectories or transition status, TGD and DT individuals may be similarly vulnerable to disordered eating, it is possible that body dissatisfaction, which is an important ED risk factor (McLean & Paxton, Reference McLean and Paxton2019), may manifest differently in TGD individuals (e.g., gender dysphoria-related distress) and DT individuals (e.g., post-transition body distress).
Secondly, we found that 28% of the study sample screened positive for the possible presence of ASD. The figure for TGD participants (17.2%) is within the 6–26% prevalence range reported by Thrower et al. (Reference Thrower, Bretherton, Pang, Zajac and Cheung2020) and within the 1.2–68% prevalence range reported by Kallitsounaki and Williams’ (Reference Kallitsounaki and Williams2023) meta-analysis. In the DT group, however, the observed rate of 42.9% positive screeners is significantly higher than the prevalence of self-reported ASD diagnoses in Littman (Reference Littman2021) (10%), Vandenbussche (Reference Vandenbussche2022) (20%), and Littman et al. (Reference Littman, O’Malley, Kerschner and Bailey2024) (21.8%). The differential pattern observed in our study, with a trend toward more DT participants screening positive for ASD, raises important considerations about whether underlying neurodivergence/neurodiverse characteristics may influence identity development in a subset of individuals with a history of detransition, which future research will need to elucidate. At the same time, our findings should be interpreted with caution, as elevated scores on the AQ-10 may also be explained by higher levels of social anxiety (Nobili et al., Reference Nobili, Glazebrook, Bouman, Glidden, Baron-Cohen, Allison, Smith and Arcelus2018), which is consistent with the observed higher scores on the phobia subscale and the higher rates of elevated scores on the social detachment subscale in the DT group.
Personality and Psychopathological Symptoms
With a few exceptions, we observed a trend toward more elevated scores on all scales and subscales in the TGD group, highlighting the burden of mental health problems in TGD people, as demonstrated by numerous previous studies (Pinna et al., Reference Pinna, Paribello, Somaini, Corona, Ventriglio, Corrias, Frau, Murgia, El Kacemi, Galeazzi, Mirandola, Amaddeo, Crapanzano, Converti, Piras, Suprani, Manchia, Fiorillo and Carpiniello2022). The DT group also showed elevated scores on many of the PAI scales examined. However, the results should be interpreted in light of the fact that, compared to the DT group, TGD participants scored higher on average on negative impression, and there was also a significantly higher proportion of TGD participants who scored as moderately elevated on this scale. While it is entirely possible that TGD participants experienced heightened levels of psychological distress, the findings may also suggest different patterns of reporting of mental health symptoms or help-seeking behavior in the two groups, with TGD participants being more comfortable or confident in disclosing psychological difficulties. This finding contradicts previous literature showing that fear of being pathologized is a common barrier for TGD populations when seeking mental healthcare (Snow et al., Reference Snow, Cerel, Loeffler and Flaherty2019). However, it may also be the case that TGD participants in our study were more aware of their mental health difficulties or overreported their symptoms to “call for attention” or “prove” the legitimacy of their mental health needs, which may serve as a means of seeking validation and care.
In terms of the clinical scales and subscales, the results showed different mental health and personality profiles between the groups. TGD participants showed particularly marked elevations in borderline features and mania. Elevated borderline features, including identity problems and negative relationships, may indicate that TGD participants experienced persistent difficulties with identity stability and self-concept. While this observation is consistent with previous literature showing a high prevalence of BPD among TGD individuals (Anzani et al., Reference Anzani, Panfilis, Scandurra and Prunas2020), it has been argued that stigma-related stressors may lead to symptoms that can be confounded with diagnostic criteria for BPD (Goldhammer et al., Reference Goldhammer, Crall and Keuroghlian2019), thus increasing their scores on this scale. This would be consistent with the fact that the TGD group scored above the clinical concern range on the traumatic stress subscale, as well as the fact that almost two-thirds of this group responded positively to at least one critical item in the traumatic stressors category. Elevations on mania, on the other hand, are difficult to interpret because of the paucity of research in this area. However, this observation, together with elevated scores on depression and antisocial features, could reflect problems with emotion regulation. This would also help contextualize the significantly higher mean scores obtained by TGD participants on alcohol problems, as substance use can act as a coping mechanism, and the higher number of TGD participants with elevated scores on self-harm. In general, the findings for the TGD group suggest a constellation of distress characterized by emotional dysregulation and instability, more externalizing symptoms, and the communication of distress in a more overt way.
Participants in the DT group, on the other hand, showed higher scores for anxiety-related disorders, anxiety, and somatic concerns. In particular, this group had significantly higher scores on phobias and significantly higher rates of social detachment, suggesting a psychological profile characterized by persistent preoccupation, avoidance, and social inhibition. This, together with low scores on antisocial features, alcohol problems, and drug problems, may indicate that DT participants, contrary to TGD participants, are more prone to internalizing symptoms. Elevations on somatic concerns may suggest distress over bodily changes or general health concerns related to medical gender transition. In our view, the findings for the DT group can be interpreted in two ways. First, the tendency toward anxiety-related symptoms and social inhibition may be indicative of detransition-related stigma and shame, post-detransition physical distress, and difficulties with social relationships, which is consistent with recent findings in the detransition literature (Expósito-Campos et al., Reference Expósito-Campos, Pérez-Fernández and Salaberria2024). Second, given the evidence for a relationship between anxiety and ASD (Jolliffe et al., Reference Jolliffe, Adams and Simpson2023), it is possible that the PAI results for the DT group are better explained by the fact that almost half of the participants in this group scored above the cutoff on the AQ-10, suggesting a significant presence of autistic traits and possibly ASD. This would also help to explain why DT participants scored significantly lower on dominance and had lower scores on warmth. In general, the results of the DT group suggest a pattern of distress characterized by more social inhibition and internalizing symptoms.
Perhaps the most concerning findings came from the treatment consideration scales, where both TGD and DT participants scored high on suicidal ideation, with over 60% scoring in the elevated range and almost 50% scoring in the highest range, indicating acute clinical concern. These findings corroborate previous studies documenting elevated suicidality in TGD populations (Kohnepoushi et al., Reference Kohnepoushi, Nikouei, Cheraghi, Hasanabadi, Rahmani, Moradi, Moradi, Moradpour and Moradi2023) and extend them to DT individuals, highlighting detransition as a period of mental health vulnerability and risk. Furthermore, the high levels of stress and nonsupport reported by both groups represent significant psychosocial challenges, exacerbating an already complicated process.
Although we did not include measures of gender minority stress in this study, our findings could also be interpreted through this framework (Testa et al., Reference Testa, Habarth, Peta, Balsam and Bockting2015). Thus, for TGD individuals, the observed elevations in emotional dysregulation and substance use may reflect coping mechanisms developed in response to chronic stressors such as discrimination, interpersonal rejection, or identity nonaffirmation and nondisclosure. For participants in the DT group, the pattern of social detachment, phobias, and anxiety may represent a different manifestation of detransition-related minority stress linked to the potential social challenges of detransition, including feelings of isolation and perceived stigma around their experiences (MacKinnon, Gould, et al., Reference MacKinnon, Gould, Ashley, Enxuga, Kia and Ross2022; Vandenbussche, Reference Vandenbussche2022).
Clinical Implications
Our findings have several important implications for clinical practice. First, they highlight the need for routine screening for ED and ASD in gender minority populations. This includes considering how body dissatisfaction and underlying neurodiversity may influence and intersect with gender dysphoria and gender identity development. Secondly, the findings highlight the need for comprehensive psychological assessments and interventions that consider shared and distinct vulnerabilities and needs. In this regard, TGD individuals may benefit from interventions that address emotion dysregulation, impulsivity, and maladaptive coping (Expósito-Campos et al., Reference Expósito-Campos, Pérez-Fernández and Salaberria2023). Following a minority stress framework, these interventions should not only target symptoms but also build resilience against potential social stressors. In addition, the results suggest that a history of trauma may be a salient issue in this population, highlighting the need to integrate trauma-informed care into treatment planning. For their part, DT individuals may benefit from interventions that focus more on reducing anxiety and developing social connections, as well as coping with potential detransition-specific stressors and building supportive communities to buffer stigma. However, it remains important to address interpersonal functioning and social support in both groups, as their scores indicate challenges in this area. Finally, the high rates of suicidal ideation for both TGD and DT individuals underline the urgent need to develop suicide prevention and suicide risk assessment strategies. This is particularly important for individuals who detransition, who may be unable to access post-detransition care due to a lack of formal resources and services (MacKinnon et al., Reference MacKinnon, Expósito-Campos and Gould2023).
Strengths and Limitations
This is the first study to compare TGD people and those with experiences of detransition, and the first to examine the mental health status of participants who have detransitioned using validated clinical assessment tools. Despite its exploratory nature, it constitutes an important contribution that highlights common and divergent mental health vulnerabilities, risks, and needs, providing mental health professionals with useful information to inform their clinical practice and researchers with avenues for future research. Furthermore, building on previous theoretical contributions (Hildebrand-Chupp, Reference Hildebrand-Chupp2020) and empirical work (Littman, Reference Littman2021; MacKinnon et al., Reference MacKinnon, Kia, Gould, Ross, Abramovich, Enxuga and Lam2025; Pullen Sansfaçon et al., Reference Pullen Sansfaçon, Gravel, Gelly, Planchat, Paradis and Medico2024; Vandenbussche, Reference Vandenbussche2022), we used a clearly defined operational criterion to divide the sample into the TGD and DT groups, which contributes to much-needed conceptual clarity in detransition research. In addition, data collection took place during assessment sessions of up to 3 hours, which gave participants the opportunity to clarify their questions and doubts, thus increasing the accuracy and correctness of their responses to the assessment tools.
However, there are also a number of limitations. First, this is an exploratory cross-sectional study, which does not allow us to examine the mental health status of participants over time or to make any claims about causality. Secondly, as the data are from a convenience sample, our findings may not be generalizable to other populations of TGD people or those with experiences of detransition due to sampling bias and should therefore be interpreted with caution. Thirdly, we did not include measures of transition- or detransition-related minority stress in this analysis, which has been shown to impact both TGD and DT individuals’ mental health (Gelly et al., Reference Gelly, Atgé-Delbays and Pullen Sansfaçon2025; Mezza et al., Reference Mezza, Mezzalira, Pizzo, Maldonato, Bochicchio and Scandurra2024). Finally, the small size of the two study groups significantly limited the statistical power of our comparative analyses.
Conclusion
Using validated clinical assessment tools, we found that 28% of participants screened positive for ED and 28% screened positive for ASD, with a higher proportion in the DT group. We also found high levels of psychological distress, suicidality, and lack of support in both groups. On average, the TGD group’s psychopathological profiles were characterized by a pattern of externalizing symptoms, while the DT group showed a more pronounced internalizing pattern of symptoms. The current study provides some preliminary evidence that TGD and DT participants may exhibit different psychopathological and interpersonal profiles, highlighting the need for tailored clinical assessments and interventions. Future research should examine whether such characteristics predict or moderate long-term outcomes after gender transition and how they may interact with other psychosocial variables, as well as the impact of specific minority stressors on the mental health of both TGD and DT individuals. Understanding these factors is essential for improving clinical outcomes and care for individuals navigating complex gender trajectories.
Data availability statement
The code and deidentified data supporting this study are available on the Open Science Framework at https://osf.io/bthp2/?view_only=b2bf74540f2a422395f9ac1c09e7fe88.
Acknowledgments
The authors would like to extend their gratitude to the study participants for sharing their time and experiences, as well as to the organizations and many people who helped disseminate and recruit for the study.
Author contribution
P.E.-C. played a role in conceptualization, data curation, formal analysis, funding acquisition, investigation, methodology, visualization, writing—original draft, and writing—review and editing. J.I.P.-F. played a role in conceptualization, project administration, resources, supervision, and writing—review and editing. K.S. played a role in conceptualization, funding acquisition, project administration, resources, supervision, and writing—review and editing.
Funding statement
This work was supported by the Predoctoral Fellowship Program of the Department of Education of the Government of the Basque Country (grant number PRE_2021_1_0392) and the Osaklinik Research Group (grant number IT-1450-22), which is funded by the Government of the Basque Country.
Competing interests
The authors declare none.


 Open access