


1. Introduction
There is a largely missing population of intermediate-mass black holes (IMBHs) with masses higher than those formed by stable, single stars today (
 $M_\bullet\lesssim 100\,\textrm{M}_{\odot}$
) and less massive than the supermassive black holes (SMBHs;
$M_\bullet\lesssim 100\,\textrm{M}_{\odot}$
) and less massive than the supermassive black holes (SMBHs;
 $10^5\,\textrm{M}_{\odot}\leq M_\bullet\lesssim 10^{10}\,\textrm{M}_{\odot}$
)Footnote a known to reside at the centres of massive galaxies. Not surprisingly, astronomers around the world have been hotly pursuing the much-anticipated discovery of IMBHs for some time (e.g. Miller & Colbert Reference Miller and Colbert2004). In addition to providing a fundamental input to the cosmic inventory of our Universe, the abundance, or rarity, of IMBHs has implications for the formation of the Universe’s SMBHs (Graham Reference Graham2016b; Mezcua Reference Mezcua2017; Koliopanos Reference Koliopanos2017; Sahu, Graham, & Davis Reference Sahu, Graham and Davis2019a; Inayoshi, Visbal, & Haiman Reference Inayoshi, Visbal and Haiman2020).
$10^5\,\textrm{M}_{\odot}\leq M_\bullet\lesssim 10^{10}\,\textrm{M}_{\odot}$
)Footnote a known to reside at the centres of massive galaxies. Not surprisingly, astronomers around the world have been hotly pursuing the much-anticipated discovery of IMBHs for some time (e.g. Miller & Colbert Reference Miller and Colbert2004). In addition to providing a fundamental input to the cosmic inventory of our Universe, the abundance, or rarity, of IMBHs has implications for the formation of the Universe’s SMBHs (Graham Reference Graham2016b; Mezcua Reference Mezcua2017; Koliopanos Reference Koliopanos2017; Sahu, Graham, & Davis Reference Sahu, Graham and Davis2019a; Inayoshi, Visbal, & Haiman Reference Inayoshi, Visbal and Haiman2020).
As yet, there is no consensus as to how SMBHs came to be. While the observed extent of quasar activity over the history of our Universe has revealed that the accretion of baryons fattened them up (e.g. Soltan Reference Soltan1982; Shankar et al. Reference Shankar, Salucci, Granato, De Zotti and Danese2004), we do not know what their (potentially range of) birth masses were. Some theories have speculated that their birth or ‘seed’ masses were
 $\approx$
 $10^5\,{\textrm M}_{\odot}$
, thereby providing a kick-start to explain the early formation of the high-z, active galactic nuclei (AGN) with sizeable black hole masses around
$10^5\,{\textrm M}_{\odot}$
, thereby providing a kick-start to explain the early formation of the high-z, active galactic nuclei (AGN) with sizeable black hole masses around
 $\approx$
 $10^9\,{\textrm M}_{\odot}$
(e.g. Mortlock et al. Reference Mortlock2011; Yang et al. Reference Yang2020; Mignoli et al. Reference Mignoli2020). Theories have included primordial black holes (e.g. Grobov et al. Reference Grobov, Rubin, Samarchenko and Zhizhin2011), massive metal-free Population III stars, which subsequently collapse (or collide, e.g. Alister Seguel et al. Reference Alister Seguel, Schleicher, Boekholt, Fellhauer and Klessen2020) to form massive black holes (e.g. Madau & Rees Reference Madau and Rees2001; Schneider et al. Reference Schneider, Ferrara, Natarajan and Omukai2002), or the direct collapse of massive gas clouds, effectively bypassing the stellar phase of evolution (e.g. Bromm & Loeb Reference Bromm, Loeb, Holt and Reynolds2003; Mayer et al. Reference Mayer, Kazantzidis, Escala and Callegari2010).
$10^9\,{\textrm M}_{\odot}$
(e.g. Mortlock et al. Reference Mortlock2011; Yang et al. Reference Yang2020; Mignoli et al. Reference Mignoli2020). Theories have included primordial black holes (e.g. Grobov et al. Reference Grobov, Rubin, Samarchenko and Zhizhin2011), massive metal-free Population III stars, which subsequently collapse (or collide, e.g. Alister Seguel et al. Reference Alister Seguel, Schleicher, Boekholt, Fellhauer and Klessen2020) to form massive black holes (e.g. Madau & Rees Reference Madau and Rees2001; Schneider et al. Reference Schneider, Ferrara, Natarajan and Omukai2002), or the direct collapse of massive gas clouds, effectively bypassing the stellar phase of evolution (e.g. Bromm & Loeb Reference Bromm, Loeb, Holt and Reynolds2003; Mayer et al. Reference Mayer, Kazantzidis, Escala and Callegari2010).
The suggestion of massive seeds arose from the notion that the ‘Eddington limit’ (Eddington Reference Eddington1925) of gas accretion onto a black hole implied that stellar-mass black holes did not have sufficient time to grow into the SMBHs observed in the young, high-redshift AGN. However, the Eddington limit on the accretion rate applies only to (unrealistic) spherical conditions (Nayakshin, Power, & King Reference Nayakshin, Power and King2012; Alexander & Natarajan Reference Alexander and Natarajan2014) and can be significantly exceeded in real systems. For example, super-critical (super-Eddington) accretion flows onto massive black holes can occur when the accretion flow is mostly confined to the disk plane while most of the radiation emerges in outflows along the rotation axis (Abramowicz, Calvani, & Nobili Reference Abramowicz, Calvani and Nobili1980; Jiang, Stone, & Davis Reference Jiang, Stone and Davis2014; Pezzulli, Valiante, & Schneider Reference Pezzulli, Valiante and Schneider2016). Hyper-Eddington accretion rates can exist in spherically symmetric accretion flows when energy advection reduces radiative efficiency (Inayoshi, Haiman, & Ostriker Reference Inayoshi, Haiman and Ostriker2016). Thus, the practicality of super-critical accretion has been invoked to explain the early existence of SMBHs at high redshifts (Volonteri & Rees Reference Volonteri and Rees2005; Volonteri Reference Volonteri2012; Volonteri & Bellovary Reference Volonteri and Bellovary2012; Volonteri, Silk, & Dubus Reference Volonteri, Silk and Dubus2015). Besides, most ultra-luminous X-ray sources are nowadays explained as stellar-mass X-ray binaries accreting much faster than their Eddington limit (Feng & Soria Reference Feng and Soria2011; Kaaret, Feng, & Roberts Reference Kaaret, Feng and Roberts2017). Such accretion negates the need for massive black hole seeds.
An additional motive for starting AGN with massive seeds was that black holes with masses intermediate between that of stellar-mass black holes and SMBHs had not been directly observed, and therefore seemed not to exist. However, this may be a sample selection bias because the sphere-of-gravitational-influence around such IMBHs, where one would directly observe a Keplerian rotation curve, is typically too small to resolve spatially. Furthermore, there is now a rapidly rising number of IMBH candidates based upon indirect estimates of the black hole mass (Farrell et al. Reference Farrell, Webb, Barret, Godet and Rodrigues2009; Secrest et al. Reference Secrest, Satyapal, Gliozzi, Cheung, Seth and Böker2012; Baldassare et al. Reference Baldassare, Reines, Gallo and Greene2015; Graham, Ciambur, & Soria Reference Graham, Ciambur and Soria2016; Kızıltan, Baumgardt, & Loeb Reference Kızıltan, Baumgardt and Loeb2017; Nguyen et al. Reference Nguyen2017, Reference Nguyen2019; Chilingarian et al. Reference Chilingarian, Katkov, Zolotukhin, Grishin, Beletsky, Boutsia and Osip2018; Mezcua et al. Reference Mezcua, Civano, Marchesi, Suh, Fabbiano and Volonteri2018; Jiang et al. Reference Jiang2018; Graham & Soria Reference Graham and Soria2019; Graham, Soria, & Davis Reference Graham, Soria and Davis2019; Woo et al. Reference Woo, Cho, Gallo, Hodges-Kluck, Le, Shin, Son and Horst2019; Lin et al. Reference Lin2020). In addition, there are currently five IMBH candidates in the Milky Way (Takekawa et al. Reference Takekawa, Oka, Iwata, Tsujimoto and Nomura2020).
There is no shortage of scenarios for how a bridging population of IMBHs may have arisen. Possible pathways include the runaway collapse of dense ‘nuclear star clusters’ (Portegies Zwart & McMillan Reference Portegies Zwart and McMillan2002; Davies, Miller, & Bellovary Reference Davies, Miller and Bellovary2011; Lupi et al. Reference Lupi, Colpi, Devecchi, Galanti and Volonteri2014; Stone, Küpper, & Ostriker Reference Stone, Küpper and Ostriker2017), especially if gas-drag and dynamical friction are in play at the centre of a galaxy, or the gas-fuelled growth of a stellar-mass black hole that has not yet devoured enough material to become an SMBH (Natarajan Reference Natarajan2021). These ideas would place, at least some, IMBHs at the centres of galaxies, where established black hole mass scaling relations involving some property of the host galaxy can be applied.
Recent Chandra X-ray Observatory (CXO; Weisskopf et al. Reference Weisskopf, Tananbaum, Van Speybroeck and O’Dell2000) observations (Soria Reference Soria2016, see also Chilingarian et al. Reference Chilingarian, Katkov, Zolotukhin, Grishin, Beletsky, Boutsia and Osip2018 and Bi, Feng, & Ho Reference Bi, Feng and Ho2020), have discovered IMBH candidates at the centresFootnote b of several nearby, low-mass galaxies. Long exposures have enabled the discovery of faint X-ray point sources (consistent with low-mass black holes accreting with low Eddington ratios) in galaxies, which have been predicted to host a central IMBH based upon each galaxy’s velocity dispersion, luminosity, and spiral arm pitch angle (Koliopanos et al. Reference Koliopanos2017; Graham & Soria Reference Graham and Soria2019; Graham et al. Reference Graham, Soria and Davis2019). The high-energy X-ray photons, originating from the (not so) dead centres of the galaxies, are likely coming from the accretion disks around black holes because of their point source nature, where emission favours active black holes rather than spatially extended star formation.
Several studies have identified IMBH candidates in galaxies based on single, or a few, black hole mass estimates. In this work, we have selected a galaxy, NGC 3319, where we can apply a wealth of independent black hole mass estimates. NGC 3319 is a gas-rich, bulgeless, late-type galaxy. It is a strongly barred spiral galaxy classified as SBcd(rs) (de Vaucouleurs et al. Reference de Vaucouleurs, de Vaucouleurs, Corwin Herold, Buta, Paturel and Fouque1991) and has its bar aligned with the major axis (Randriamampandry et al. Reference Randriamampandry, Combes, Carignan and Deg2015). Moreover, Jiang et al. (Reference Jiang2018) identify it as possessing a low-luminosity AGN with a high-accretion-rate signalled by a nuclear X-ray point source and assume a black hole mass between
 $3\times10^2\,\textrm{M}_{\odot}$
and
$3\times10^2\,\textrm{M}_{\odot}$
and
 $3\times10^5\,\textrm{M}_{\odot}$
based on a high Eddington ratio of 1 to
$3\times10^5\,\textrm{M}_{\odot}$
based on a high Eddington ratio of 1 to
 $10^{-3}$
, despite a non-detection in the radio. Using the X-ray variability, they report an estimate of
$10^{-3}$
, despite a non-detection in the radio. Using the X-ray variability, they report an estimate of
 ${\sim}10^{5 \pm 2}\,\text{M}_{\odot}$
, and using the ‘fundamental plane of black hole activity’, they reported an upper limit of 10
${\sim}10^{5 \pm 2}\,\text{M}_{\odot}$
, and using the ‘fundamental plane of black hole activity’, they reported an upper limit of 10
 $^5$
M
$^5$
M
 $_{\odot}$
in the absence of radio data. NGC 3319 had previously been recognised as a possible low-ionisation nuclear emission line region (LINER) galaxy (Heckman, Balick, & Crane Reference Heckman, Balick and Crane1980; Pogge Reference Pogge1989), or at least it possessed an uncertain H ii nucleus (Ho, Filippenko, & Sargent Reference Ho, Filippenko and Sargent1997). Recently, Baldi et al. (Reference Baldi2018) classified its nuclear type as a LINER based on BPT (Baldwin, Phillips, & Terlevich Reference Baldwin, Phillips and Terlevich1981) diagram diagnostics. This classification is of significance since AGN with black holes are suspected sources of stimulating LINER spectral emission (Heckman Reference Heckman1980).
$_{\odot}$
in the absence of radio data. NGC 3319 had previously been recognised as a possible low-ionisation nuclear emission line region (LINER) galaxy (Heckman, Balick, & Crane Reference Heckman, Balick and Crane1980; Pogge Reference Pogge1989), or at least it possessed an uncertain H ii nucleus (Ho, Filippenko, & Sargent Reference Ho, Filippenko and Sargent1997). Recently, Baldi et al. (Reference Baldi2018) classified its nuclear type as a LINER based on BPT (Baldwin, Phillips, & Terlevich Reference Baldwin, Phillips and Terlevich1981) diagram diagnostics. This classification is of significance since AGN with black holes are suspected sources of stimulating LINER spectral emission (Heckman Reference Heckman1980).
In this study, we endeavour to constrain better the mass of the potential IMBH in the nucleus of NGC 3319 via a meta-analysis of multiple mass estimates based on independently measured quantities. In the numerous subsections of Section 2, we present a detailed analysis and application of 10 separate black hole mass scaling relations and ultimately combine these estimates to yield an overall black hole mass estimate with confidence limits. The uncertainty on each mass estimate is used to weight every estimate before combining the results, via standard statistical techniques, to obtain the final mass estimate whose uncertainty is naturally less than that of the individual mass estimates. In the final section (Section 3), we discuss the results of our investigation, comment on the implications, and remark on the benefit from continued study of NGC 3319.
Following Jiang et al. (Reference Jiang2018), we adopt a redshift-independent luminosity distance of
 $14.3\pm 1.1$
Mpc (Cepheid variable star distance from Sakai et al. Reference Sakai1999), with a physical scale of
$14.3\pm 1.1$
Mpc (Cepheid variable star distance from Sakai et al. Reference Sakai1999), with a physical scale of
 $69\pm5\,\text{pc}\,\text{arcsec}^{-1}$
. All values from the literature have been adjusted to accommodate our adopted distance to NGC 3319. Black hole masses (
$69\pm5\,\text{pc}\,\text{arcsec}^{-1}$
. All values from the literature have been adjusted to accommodate our adopted distance to NGC 3319. Black hole masses (
 $M_\bullet$
) and other masses throughout this work are represented as logarithmic (solar) mass values, i.e.
$M_\bullet$
) and other masses throughout this work are represented as logarithmic (solar) mass values, i.e.
 $\mathcal{M}\equiv\log{M}$
, where M is mass in units of solar masses (M
$\mathcal{M}\equiv\log{M}$
, where M is mass in units of solar masses (M
 $_\odot$
). All uncertainties are presented as (or have been scaled to)
$_\odot$
). All uncertainties are presented as (or have been scaled to)
 $1\,\sigma \approx 68.3\%$
confidence intervals. All magnitudes are given in the AB system (Oke Reference Oke1974).
$1\,\sigma \approx 68.3\%$
confidence intervals. All magnitudes are given in the AB system (Oke Reference Oke1974).
2. Black hole mass estimates
In the following subsections (2.1–2.10), we applied 10 different black hole mass scaling relations to estimate the mass of the black hole (NGC 3319*) residing at the centre of NGC 3319. We use the latest, and thus in some instances morphology-dependent, black hole scaling relations. Although the use of reverberation mapping has revealed that AGN extend the
 $M_\bullet$
–
$M_\bullet$
–
 $M_{\textrm{bulge},\star}$
relation to black hole masses of
$M_{\textrm{bulge},\star}$
relation to black hole masses of
 $10^5\,\textrm{M}_{\odot}$
(Graham & Scott Reference Graham and Scott2015), the paucity of confirmed IMBHs (and thus their dearth in the construction of black hole mass scaling relations) requires us to extrapolate these relations to reach into the IMBH regime.Footnote c Albeit, we note that NGC 205 (Nguyen et al. Reference Nguyen2019) and NGC 404 (Nguyen et al. Reference Nguyen2017) now extend the relations down to
$10^5\,\textrm{M}_{\odot}$
(Graham & Scott Reference Graham and Scott2015), the paucity of confirmed IMBHs (and thus their dearth in the construction of black hole mass scaling relations) requires us to extrapolate these relations to reach into the IMBH regime.Footnote c Albeit, we note that NGC 205 (Nguyen et al. Reference Nguyen2019) and NGC 404 (Nguyen et al. Reference Nguyen2017) now extend the relations down to
 $\sim$
10
$\sim$
10
 $^4$
and
$^4$
and
 $\sim$
10
$\sim$
10
 $^5$
M
$^5$
M
 $_{\odot}$
, respectively. In Section 2.11, we combine the black hole mass estimates, accounting for the different levels of scatter in each estimate.
$_{\odot}$
, respectively. In Section 2.11, we combine the black hole mass estimates, accounting for the different levels of scatter in each estimate.
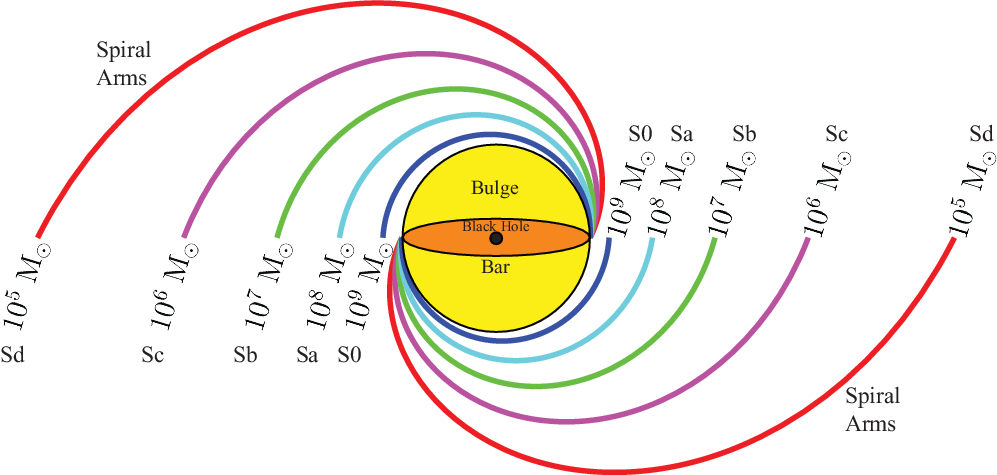
Spiral galaxy arms with varying degrees of tightness, with the corresponding galaxy morphological type and central black hole mass in units of our Sun’s mass. This template can be used to estimate central black hole masses in spiral galaxies. The outermost spiral ![]() has
has
 $|\phi|=26.^{\!\!\circ}7$
, which is indicative of a central black hole with a mass of
$|\phi|=26.^{\!\!\circ}7$
, which is indicative of a central black hole with a mass of
 $10^5\,\textrm{M}_{\odot}$
via Equation (8) from Davis et al. (Reference Davis, Graham and Seigar2017).
$10^5\,\textrm{M}_{\odot}$
via Equation (8) from Davis et al. (Reference Davis, Graham and Seigar2017).
2.1. The
 $\text{M}_\bullet$
–
$\phi$
relation
$\text{M}_\bullet$
–
$\phi$
relation


The aesthetic beauty of ‘spiral nebulae’ has been observed for 176 yr, since Lord Rosse’s observations of the Whirlpool Galaxy (NGC 5194). However, significant mysteries still abound between the nature of these striking features and properties of their host galaxies (D’Onghia, Vogelsberger, & Hernquist Reference D’Onghia, Vogelsberger and Hernquist2013). The seminal works that established the spiral density wave theory (Lin & Shu Reference Lin and Shu1964, Reference Lin and Shu1966; Lin, Yuan, & Shu Reference Lin, Yuan and Shu1969) have provided perhaps the most lucid and lasting explanation of (grand design) spiral genesis. Indeed, the spiral density theory has been supported by observations in numerous studies (Davis et al. Reference Davis2015; Pour-Imani et al. Reference Pour-Imani, Kennefick, Kennefick, Davis, Shields and Shameer Abdeen2016; Yu & Ho Reference Yu and Ho2018; Peterken et al. Reference Peterken, Merrifield, AragÓn-Salamanca, Drory, Krawczyk, Masters, Weijmans and Westfall2019; Miller et al. Reference Miller, Kennefick, Kennefick, Shameer Abdeen, Monson, Eufrasio, Shields and Davis2019; Vallée Reference Vallée2019, Reference Vallée2020; Abdeen et al. Reference Abdeen, Kennefick, Kennefick, Miller, Shields, Monson and Davis2020; Griv et al. Reference Griv, Gedalin, Shih, Hou and Jiang2020, Reference Griv, Gedalin and Jiang2021).
In particular, Lin & Shu (Reference Lin and Shu1966) predicted that the geometry of spiral patterns should be governed by two primary galactic properties: (i) the density of the galactic disk and (ii) the central gravitational potential (mass) of the galaxy. Specifically, the pitch angle of the spiral pattern at a distance R from a galaxy’s centre should be directly proportional to the density of the disk at R and inversely proportional to the mass of the galaxy
 $\leq $
R. Davis et al. (Reference Davis2015) tested this prediction and found a tight trivariate relationship between the pitch angle, the stellar bulge mass, and the neutral atomic hydrogen density in the disk of a galaxy. Additional studies pertaining to dark matter halos have also shown a correlation between pitch angle and the central mass concentration, as determined by the shear of the rotation curve of a galaxy (Seigar et al. Reference Seigar, Bullock, Barth and Ho2006, Reference Seigar, Davis, Berrier and Kennefick2014). These theoretical and observational studies provide perhaps the best explanations of why the pitch angle correlates with its host galaxy: the pitch angle is clearly related to the central mass of a galaxy, of which the ‘barge’ (bar and bulge) and black hole are integral components entwined via coevolution.
$\leq $
R. Davis et al. (Reference Davis2015) tested this prediction and found a tight trivariate relationship between the pitch angle, the stellar bulge mass, and the neutral atomic hydrogen density in the disk of a galaxy. Additional studies pertaining to dark matter halos have also shown a correlation between pitch angle and the central mass concentration, as determined by the shear of the rotation curve of a galaxy (Seigar et al. Reference Seigar, Bullock, Barth and Ho2006, Reference Seigar, Davis, Berrier and Kennefick2014). These theoretical and observational studies provide perhaps the best explanations of why the pitch angle correlates with its host galaxy: the pitch angle is clearly related to the central mass of a galaxy, of which the ‘barge’ (bar and bulge) and black hole are integral components entwined via coevolution.
The geometry of logarithmic spirals closely matches the shape of spiral arms in galaxies. Quantitatively, the shape (tightness of winding) of a logarithmic spiral is governed by the absolute value of its pitch angle,Footnote d
 $|\phi|$
, as introduced by von der Pahlen (Reference von der Pahlen1911). Seigar et al. (Reference Seigar, Kennefick, Kennefick and Lacy2008) first presented evidence of a strong relationship between pitch angle and the mass of a spiral galaxy’s central black hole. As the sample of spiral galaxies with directly measured black hole masses grew incrementally in size over the years, Berrier et al. (Reference Berrier2013) and later Davis et al. (Reference Davis, Graham and Seigar2017) presented refinements to the
$|\phi|$
, as introduced by von der Pahlen (Reference von der Pahlen1911). Seigar et al. (Reference Seigar, Kennefick, Kennefick and Lacy2008) first presented evidence of a strong relationship between pitch angle and the mass of a spiral galaxy’s central black hole. As the sample of spiral galaxies with directly measured black hole masses grew incrementally in size over the years, Berrier et al. (Reference Berrier2013) and later Davis et al. (Reference Davis, Graham and Seigar2017) presented refinements to the
 $M_\bullet$
–
$M_\bullet$
–
 $\phi$
relation. A graphical representation of the relation found by Davis et al. (Reference Davis, Graham and Seigar2017, Equation (8)) is shown in Figure 1. We employ Equation (8) from Davis et al. (Reference Davis, Graham and Seigar2017) to convert measured pitch angles into black hole masses, including an intrinsic scatter of 0.33 dex (added in quadrature with a full propagation of errors on the pitch angle measurement, as well as errors on the slope and intercept of the relation).
$\phi$
relation. A graphical representation of the relation found by Davis et al. (Reference Davis, Graham and Seigar2017, Equation (8)) is shown in Figure 1. We employ Equation (8) from Davis et al. (Reference Davis, Graham and Seigar2017) to convert measured pitch angles into black hole masses, including an intrinsic scatter of 0.33 dex (added in quadrature with a full propagation of errors on the pitch angle measurement, as well as errors on the slope and intercept of the relation).
The existence of an
 $M_\bullet$
–
$M_\bullet$
–
 $\phi$
relation has been seen not only in observations (Seigar et al. Reference Seigar, Kennefick, Kennefick and Lacy2008; Berrier et al. Reference Berrier2013; Davis et al. Reference Davis, Graham and Seigar2017) but also in simulations. Mutlu-Pakdil et al. (Reference Mutlu-Pakdil, Seigar, Hewitt, Treuthardt, Berrier and Koval2018) measured the pitch angles for a random sample of 95 galaxies drawn from the Illustris simulation (Vogelsberger et al. Reference Vogelsberger2014) and recovered an
$\phi$
relation has been seen not only in observations (Seigar et al. Reference Seigar, Kennefick, Kennefick and Lacy2008; Berrier et al. Reference Berrier2013; Davis et al. Reference Davis, Graham and Seigar2017) but also in simulations. Mutlu-Pakdil et al. (Reference Mutlu-Pakdil, Seigar, Hewitt, Treuthardt, Berrier and Koval2018) measured the pitch angles for a random sample of 95 galaxies drawn from the Illustris simulation (Vogelsberger et al. Reference Vogelsberger2014) and recovered an
 $M_\bullet$
–
$M_\bullet$
–
 $\phi$
relation that was consistent with that found from observational studies. Thus, the nascent
$\phi$
relation that was consistent with that found from observational studies. Thus, the nascent
 $M_\bullet$
–
$M_\bullet$
–
 $\phi$
relation has already garnered empirical and theoretical (via theory and simulations) support to become a full-fledged black hole mass scaling relation. Its progress has proliferated in only 13 years; future improvements in observations and sample size should add to its established legitimacy. The search for the primary relation with black hole mass continues, and the lack of a spiral pattern in early-type galaxies rules out the
$\phi$
relation has already garnered empirical and theoretical (via theory and simulations) support to become a full-fledged black hole mass scaling relation. Its progress has proliferated in only 13 years; future improvements in observations and sample size should add to its established legitimacy. The search for the primary relation with black hole mass continues, and the lack of a spiral pattern in early-type galaxies rules out the
 $M_\bullet$
–
$M_\bullet$
–
 $\phi$
relation, just as the absence of bulges in some late-type galaxies negates the
$\phi$
relation, just as the absence of bulges in some late-type galaxies negates the
 $M_\bullet$
–
$M_\bullet$
–
 $M_{\textrm{bulge},\star}$
relation. Nonetheless, the low level of scatter in both relations make them valuable black hole mass estimators.
$M_{\textrm{bulge},\star}$
relation. Nonetheless, the low level of scatter in both relations make them valuable black hole mass estimators.
Left (Original)—Spitzer
 $$8.0\,{\mu} {\rm{m}}$$
image of NGC 3319. Here, the image has been aligned, pointing the top of the image in the direction of the galaxy’s position angle (
$$8.0\,{\mu} {\rm{m}}$$
image of NGC 3319. Here, the image has been aligned, pointing the top of the image in the direction of the galaxy’s position angle (
 $43.^{\!\!\circ}0$
east of north), and the image has been cropped into a square that is
$43.^{\!\!\circ}0$
east of north), and the image has been cropped into a square that is
 $5{^\prime} \times 5{^\prime}$
(
$5{^\prime} \times 5{^\prime}$
(
 $20.7\,{\textrm{kpc}} \times 20.7\,{\textrm{kpc}}$
). Middle (Deprojected)—here, the original image has been deprojected to an artificial face-on orientation, achieved by stretching the x-axis by a factor of
$20.7\,{\textrm{kpc}} \times 20.7\,{\textrm{kpc}}$
). Middle (Deprojected)—here, the original image has been deprojected to an artificial face-on orientation, achieved by stretching the x-axis by a factor of
 $a/b\equiv(1-\epsilon_{\textrm{outer}})^{-1}=1.77$
, where a is the semi-major axis length, and b is the semi-minor axis length of the outer isophotes (Salo et al. Reference Salo2015). Right (Spiral Arcs)—the spiral arcs measured by sparcfire (Davis & Hayes Reference Davis and Hayes2014) are overlaid upon the deprojected image. Fitted lines depict: (used) Z-wise spiral arcs
$a/b\equiv(1-\epsilon_{\textrm{outer}})^{-1}=1.77$
, where a is the semi-major axis length, and b is the semi-minor axis length of the outer isophotes (Salo et al. Reference Salo2015). Right (Spiral Arcs)—the spiral arcs measured by sparcfire (Davis & Hayes Reference Davis and Hayes2014) are overlaid upon the deprojected image. Fitted lines depict: (used) Z-wise spiral arcs ![]() , (ignored) S-wise spiral arcs
, (ignored) S-wise spiral arcs ![]() , and the galactic bar
, and the galactic bar ![]() . The reported pitch angle,
. The reported pitch angle,
 $31.^{\!\!\circ}7\pm 4.^{\!\!\circ}5$
, is the weighted-mean pitch angle of the dominant-chirality red spiral arcs (see Section 2.1.1).
$31.^{\!\!\circ}7\pm 4.^{\!\!\circ}5$
, is the weighted-mean pitch angle of the dominant-chirality red spiral arcs (see Section 2.1.1).

Several software programs have been devised to handle the quantitative measurement of spiral galaxy pitch angle. In this work, we utilise three of the most prominent and robust packages to measure pitch angle: 2dfft (Davis et al. Reference Davis, Berrier, Shields, Kennefick, Kennefick, Seigar, Lacy and Puerari2012, Reference Davis, Berrier, Shields, Kennefick, Kennefick, Seigar, Lacy and Puerari2016; Seigar et al. Reference Seigar, Mutlu-Pakdil, Hewitt and Treuthardt2018), spirality (Shields et al. Reference Shields2015a,Reference Shieldsb), and sparcfire (Davis & Hayes Reference Davis and Hayes2014). Each code uses an independent method of measuring pitch angle, each with its unique advantage.Footnote e Each routine measures pitch angle after the original galaxy image (Figure 2, left panel) has been deprojected to an artificial face-on orientation (Figure 2, middle panel). We adopt the outer isophote position angle (
 $PA_{\textrm{outer}}$
, degrees east of north) and ellipticity (
$PA_{\textrm{outer}}$
, degrees east of north) and ellipticity (
 $\epsilon_{\textrm{outer}}$
) values for NGC 3319 from Salo et al. (Reference Salo2015):
$\epsilon_{\textrm{outer}}$
) values for NGC 3319 from Salo et al. (Reference Salo2015):
 $PA_{\textrm{outer}}=43.^{\!\!\circ}0\pm 0.^{\!\!\circ}7$
and
$PA_{\textrm{outer}}=43.^{\!\!\circ}0\pm 0.^{\!\!\circ}7$
and
 $\epsilon_{\textrm{outer}}=0.435\pm 0.003$
. This ellipticity is equivalent to an inclination of the disk,
$\epsilon_{\textrm{outer}}=0.435\pm 0.003$
. This ellipticity is equivalent to an inclination of the disk,
 $i_{\textrm{disk}} \equiv \cos^{-1}(1-\epsilon_{\textrm{outer}})=55.^{\!\!\circ}6\pm 0.^{\!\!\circ}2$
.
$i_{\textrm{disk}} \equiv \cos^{-1}(1-\epsilon_{\textrm{outer}})=55.^{\!\!\circ}6\pm 0.^{\!\!\circ}2$
.
We measured the pitch angles from a Spitzer Space Telescope Infrared Array Camera (IRAC)
 $8.0\,{\rm{\mu}}{\textrm{m}}$
image obtained from the Spitzer Heritage Archive.Footnote f Recent studies (Pour-Imani et al. Reference Pour-Imani, Kennefick, Kennefick, Davis, Shields and Shameer Abdeen2016; Miller et al. Reference Miller, Kennefick, Kennefick, Shameer Abdeen, Monson, Eufrasio, Shields and Davis2019) have presented observational evidence that 8.0-
$8.0\,{\rm{\mu}}{\textrm{m}}$
image obtained from the Spitzer Heritage Archive.Footnote f Recent studies (Pour-Imani et al. Reference Pour-Imani, Kennefick, Kennefick, Davis, Shields and Shameer Abdeen2016; Miller et al. Reference Miller, Kennefick, Kennefick, Shameer Abdeen, Monson, Eufrasio, Shields and Davis2019) have presented observational evidence that 8.0-
 ${\rm{\mu}}{\textrm{m}}$
light highlights the physical location of the spiral density wave in spiral galaxies. 8.0-
${\rm{\mu}}{\textrm{m}}$
light highlights the physical location of the spiral density wave in spiral galaxies. 8.0-
 ${\rm{\mu}}{\textrm{m}}$
light comes from the glow of warm dust around nascent natal star-forming regions that have been shocked into existence by the spiral density wave.
${\rm{\mu}}{\textrm{m}}$
light comes from the glow of warm dust around nascent natal star-forming regions that have been shocked into existence by the spiral density wave.
2.1.1. sparcfire
sparcfire (Davis & Hayes Reference Davis and Hayes2014) uses computer vision techniques to identify the pixel clusters that form the architecture of spiral arms in spiral galaxies and fits logarithmic spiral segments to the clusters. sparcfire classifies each spiral based on its chirality: Z-wise, spirals that grow radially in a counterclockwise direction (
 $\phi<0$
); and S-wise, spirals that grow radially in a clockwise direction (
$\phi<0$
); and S-wise, spirals that grow radially in a clockwise direction (
 $\phi>0$
). Based on the number and arc lengths of the ensemble of fitted spirals, we adopted a dominant chirality for the galaxy and ignored all spurious arcs matching the secondary chirality. We calculated a weighted-arithmetic-mean pitch angle for the galaxy based on a weight for each arc (
$\phi>0$
). Based on the number and arc lengths of the ensemble of fitted spirals, we adopted a dominant chirality for the galaxy and ignored all spurious arcs matching the secondary chirality. We calculated a weighted-arithmetic-mean pitch angle for the galaxy based on a weight for each arc (
 $w_i$
) such that
$w_i$
) such that
 $w_i\equiv s_i/r_{0,i}$
, where
$w_i\equiv s_i/r_{0,i}$
, where
 $s_i$
is the arc length and
$s_i$
is the arc length and
 $r_{0,i}$
is the inner radius (from the origin at the galactic centre) for an individual arc segment. Therefore, the highest weighting resides with long arcs near the centre of the galaxy and short, possibly spurious arc segments in the outer region of the galaxy, are made insignificant.
$r_{0,i}$
is the inner radius (from the origin at the galactic centre) for an individual arc segment. Therefore, the highest weighting resides with long arcs near the centre of the galaxy and short, possibly spurious arc segments in the outer region of the galaxy, are made insignificant.
As seen in the right panel of Figure 2, the dominant chirality is Z-wise. We computed the pitch angle and converted it to a black hole mass prediction via the
 $M_\bullet$
–
$M_\bullet$
–
 $\phi$
relation as follows:
$\phi$
relation as follows:
 \begin{eqnarray}
|\phi|_{\text{SPARCFIRE}}=31.^{\!\!\circ}7\pm 4.^{\!\!\circ}5 \rightarrow \mathcal{M}_\bullet(|\phi|_{\text{SPARCFIRE}})=4.15\pm 0.86.\end{eqnarray}
\begin{eqnarray}
|\phi|_{\text{SPARCFIRE}}=31.^{\!\!\circ}7\pm 4.^{\!\!\circ}5 \rightarrow \mathcal{M}_\bullet(|\phi|_{\text{SPARCFIRE}})=4.15\pm 0.86.\end{eqnarray}
2.1.2. 2DFFT
2dfft (Davis et al. Reference Davis, Berrier, Shields, Kennefick, Kennefick, Seigar, Lacy and Puerari2012, Reference Davis, Berrier, Shields, Kennefick, Kennefick, Seigar, Lacy and Puerari2016; Seigar et al. Reference Seigar, Mutlu-Pakdil, Hewitt and Treuthardt2018) is a two-dimensional fast Fourier transform software package that decomposes a galaxy image into logarithmic spirals. It computes the amplitude of each Fourier component by decomposing the observed distribution of light in an image into a superposition of logarithmic spirals as a function of pitch angle,
 $\phi$
, and harmonic mode, m, i.e. the order of rotational symmetry (e.g. twofold, threefold, and higher order symmetries). For the face-on view of NGC 3319 (Figure 2, middle panel), the maximum amplitude is achieved with
$\phi$
, and harmonic mode, m, i.e. the order of rotational symmetry (e.g. twofold, threefold, and higher order symmetries). For the face-on view of NGC 3319 (Figure 2, middle panel), the maximum amplitude is achieved with
 $m=2$
(i.e. two spiral arms) and
$m=2$
(i.e. two spiral arms) and
 \begin{equation}|\phi|_{\text{2DFFT}}=28.^{\!\!\circ}4\pm 3.^{\!\!\circ}5\rightarrow \mathcal{M}_\bullet(|\phi|_{\text{2DFFT}})=4.72\pm 0.70.\end{equation}
2.1.3. spirality
spirality (Shields et al. Reference Shields2015a,b) is a template-fitting software. Given a face-on image of a spiral galaxy, it computes a library of spiral coordinate systems with varying pitch angles. For NGC 3319 (Figure 2, middle panel), the best-fitting spiral coordinate system has a pitch angle of
 \begin{eqnarray}
|\phi|_{\text{SPIRALITY}}=24.^{\!\!\circ}4\pm 4.^{\!\!\circ}1\rightarrow \mathcal{M}_\bullet(|\phi|_{\text{SPIRALITY}})=5.40\pm 0.74.\end{eqnarray}
\begin{eqnarray}
|\phi|_{\text{SPIRALITY}}=24.^{\!\!\circ}4\pm 4.^{\!\!\circ}1\rightarrow \mathcal{M}_\bullet(|\phi|_{\text{SPIRALITY}})=5.40\pm 0.74.\end{eqnarray}
2.1.4. Weighted-mean pitch angle and black hole mass
The
 $M_\bullet$
–
$M_\bullet$
–
 $\phi$
relation is a tight relation with intrinsically low scatter. However, the slope of the relation is relatively steep, and thus small changes in pitch angle equate to large changes in black hole mass. Specifically, a change in pitch angle of only
$\phi$
relation is a tight relation with intrinsically low scatter. However, the slope of the relation is relatively steep, and thus small changes in pitch angle equate to large changes in black hole mass. Specifically, a change in pitch angle of only
 $5.^{\!\!\circ}8$
is associated with a 1.0 dex change in black hole mass. For late-type spiral galaxies like NGC 3319, their open spiral structures often feature inherent flocculence and asymmetries amongst individual spiral arms. Furthermore, due to the diminished total masses of these galaxies (as compared to early-type spiral galaxies), galaxy harassment and tidal interactions are more impactful in disrupting their spiral structures.
$5.^{\!\!\circ}8$
is associated with a 1.0 dex change in black hole mass. For late-type spiral galaxies like NGC 3319, their open spiral structures often feature inherent flocculence and asymmetries amongst individual spiral arms. Furthermore, due to the diminished total masses of these galaxies (as compared to early-type spiral galaxies), galaxy harassment and tidal interactions are more impactful in disrupting their spiral structures.
Left (Original)—Spitzer
 $3.6\,{\mu}{\textrm{m}},\star$
image of NGC 3319. Here, the image has been aligned so that the top of the image is pointing in the direction of the galaxy’s position angle (
$3.6\,{\mu}{\textrm{m}},\star$
image of NGC 3319. Here, the image has been aligned so that the top of the image is pointing in the direction of the galaxy’s position angle (
 $43.^{\!\!\circ}0$
east of north), and the image has been cropped, so it is
$43.^{\!\!\circ}0$
east of north), and the image has been cropped, so it is
 $5{^\prime} \times 7{^\prime}$
(
$5{^\prime} \times 7{^\prime}$
(
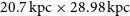 $20.7\,{\textrm{kpc}} \times 28.98\,{\textrm{kpc}}$
). The black pixels indicate no intensity, and white pixels (pixel intensity of 8.2 MJy sr–1) indicate
$20.7\,{\textrm{kpc}} \times 28.98\,{\textrm{kpc}}$
). The black pixels indicate no intensity, and white pixels (pixel intensity of 8.2 MJy sr–1) indicate
 $\mu_{3.6\,{\mu}{\textrm{m}},\star}\leq 18.188$
mag arcsec–2. Second from Left (Model)—model produced by isofit and cmodel (Ciambur Reference Ciambur2015), which includes a sky background of 0.0180 MJy sr–1 (Salo et al. Reference Salo2015). Second from Right (Residual)—residual image, such that Residual
$\mu_{3.6\,{\mu}{\textrm{m}},\star}\leq 18.188$
mag arcsec–2. Second from Left (Model)—model produced by isofit and cmodel (Ciambur Reference Ciambur2015), which includes a sky background of 0.0180 MJy sr–1 (Salo et al. Reference Salo2015). Second from Right (Residual)—residual image, such that Residual
 $\equiv$
Original – Model. Right (Division)—division image, such that Division
$\equiv$
Original – Model. Right (Division)—division image, such that Division
 $\equiv$
Residual
$\equiv$
Residual
 $\div$
Original. The division image depicts the relative difference between the original and the residual image. Pixel values are between zero (black) and one (white), representing maximal and minimal change, respectively.
$\div$
Original. The division image depicts the relative difference between the original and the residual image. Pixel values are between zero (black) and one (white), representing maximal and minimal change, respectively.

The average uncertainty amongst our Equations (1)–(3) is
 $4.^{\!\!\circ}0$
(a difference of 0.68 dex in black hole mass). Nonetheless, all three of the pitch angle measurements possess overlapping error bars. To produce a more robust pitch angle measurement, we combine all three measurements (Equations (1)–(3)) to yield a weighted-arithmetic-mean pitch angle,
$4.^{\!\!\circ}0$
(a difference of 0.68 dex in black hole mass). Nonetheless, all three of the pitch angle measurements possess overlapping error bars. To produce a more robust pitch angle measurement, we combine all three measurements (Equations (1)–(3)) to yield a weighted-arithmetic-mean pitch angle,
 \begin{equation}\bar{\phi}=\frac{\sum_{i=1}^{N} w_{i} \phi_i}{\sum_{i=1}^{N} w_{i}},\end{equation}
and associated uncertainty,
 \begin{equation}\delta\bar{\phi}=\frac{\sqrt{\sum_{i=1}^{N}(w_i\delta \phi_i)^2}}{\sum_{i=1}^{N}w_i}=\sqrt{\frac{1}{\sum_{i=1}^{N}w_i}},\end{equation}
with a weight for each measurement that is inversely proportional to the square of the uncertainty of its measurement, i.e. inverse-variance weighting,
 $w_i=\left(\delta\phi_i\right)^{-2}$
. This yields
$w_i=\left(\delta\phi_i\right)^{-2}$
. This yields
 \begin{equation}|\bar{\phi}|=28.^{\!\!\circ}0\pm 2.^{\!\!\circ}3\rightarrow \mathcal{M}_\bullet(|\bar{\phi}|)=4.79\pm 0.54.\end{equation}
Our use of the independent black hole mass scaling relations, and their reported
 $\pm 1\,\sigma$
scatter, assumes a normal distribution for each. Assuming a normal distribution for our weighted mean, we can then calculate the probability of having an IMBH. Given a mass estimate for a black hole and its associated error (
$\pm 1\,\sigma$
scatter, assumes a normal distribution for each. Assuming a normal distribution for our weighted mean, we can then calculate the probability of having an IMBH. Given a mass estimate for a black hole and its associated error (
 $\delta\mathcal{M}_\bullet$
), we can compute the probability that the black hole is less-than-supermassive (
$\delta\mathcal{M}_\bullet$
), we can compute the probability that the black hole is less-than-supermassive (
 $\mathcal{M}_\bullet\leq 5$
) as follows:
$\mathcal{M}_\bullet\leq 5$
) as follows:
 \begin{equation}P(\mathcal{M}_\bullet\leq 5)=\frac{1}{2}\left[1+{\textrm{erf}}\left(\frac{5-\mathcal{M}_\bullet}{\delta\mathcal{M}_\bullet\sqrt{2}}\right)\right]\end{equation}
(Weisstein Reference Weisstein2002). Doing so for the mass estimate from Equation (6), we find
 $P(\mathcal{M}_\bullet\leq 5)=65\%$
. We have additionally checked the pitch angle in alternative imaging that also traces star formation in spiral arms, by using the Galaxy Evolution Explorer (GALEX) far-ultraviolet (FUV) passband (1350–1750 Å). We found that the pitch angle from GALEX FUV imaging,
$P(\mathcal{M}_\bullet\leq 5)=65\%$
. We have additionally checked the pitch angle in alternative imaging that also traces star formation in spiral arms, by using the Galaxy Evolution Explorer (GALEX) far-ultraviolet (FUV) passband (1350–1750 Å). We found that the pitch angle from GALEX FUV imaging,
 $27.^{\!\!\circ}5\pm 3.^{\!\!\circ}9$
, is highly consistent with that from 8.0-
$27.^{\!\!\circ}5\pm 3.^{\!\!\circ}9$
, is highly consistent with that from 8.0-
 ${\rm \mu}{\textrm m}$
imaging.
${\rm \mu}{\textrm m}$
imaging.
Surface brightness profile decompositions produced by profiler (Ciambur Reference Ciambur2016). Panels (from left to right): linear major-axis, log major-axis, linear equivalent-axis, and log equivalent-axis profiles;
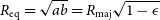 $R_{\textrm{eq}}=\sqrt{ab}= R_{\textrm{maj}}\sqrt{1-\epsilon}$
and
$R_{\textrm{eq}}=\sqrt{ab}= R_{\textrm{maj}}\sqrt{1-\epsilon}$
and
 $R_{\textrm{maj}}\equiv a$
. Subplots (from top to bottom): surface brightness profile
$R_{\textrm{maj}}\equiv a$
. Subplots (from top to bottom): surface brightness profile ![]() and model
and model ![]() built from the summation of the following components: PSF
built from the summation of the following components: PSF ![]() , bar
, bar ![]() , disk
, disk ![]() , and spiral arms
, and spiral arms ![]() , the faint outer spiral arm (at
, the faint outer spiral arm (at
 $R_{\textrm{maj}}\approx140{^{\prime\prime}}\equiv R_{\textrm{eq}}\approx85{^{\prime\prime}}$
) lies below the plotted region; residual profile with total rms scatter (
$R_{\textrm{maj}}\approx140{^{\prime\prime}}\equiv R_{\textrm{eq}}\approx85{^{\prime\prime}}$
) lies below the plotted region; residual profile with total rms scatter (
 $\Delta_{\textrm{rms}}$
); ellipticity profile; position angle profile; and fourth-order cosine Fourier harmonic coefficient,
$\Delta_{\textrm{rms}}$
); ellipticity profile; position angle profile; and fourth-order cosine Fourier harmonic coefficient,
 $B_4$
(
$B_4$
(
 $B_2$
,
$B_2$
,
 $B_3$
,
$B_3$
,
 $B_6$
,
$B_6$
,
 $B_8$
, and
$B_8$
, and
 $B_{10}$
harmonics are also fit and contribute to the model).
$B_{10}$
harmonics are also fit and contribute to the model).

2.2. The
${\text M}_\bullet$
–
${\text M}_{{\textrm{gal}},\star}$
relation


For our second estimate, we used the total stellar mass of NGC 3319 as a predictor of the black hole mass at its centre. We began by obtaining Spitzer images and masks for NGC 3319 from the S
 $^4$
G catalogue (Sheth et al. Reference Sheth2010).Footnote g We elected to use the
$^4$
G catalogue (Sheth et al. Reference Sheth2010).Footnote g We elected to use the
 $3.6\,{\rm \mu}{\textrm{m}},\star$
stellar image from Querejeta et al. (Reference Querejeta2015). The
$3.6\,{\rm \mu}{\textrm{m}},\star$
stellar image from Querejeta et al. (Reference Querejeta2015). The
 $3.6\,{\rm \mu}{\textrm m},\star$
image has been created after determining the amount of glowing dust present (by analysing the empirical
$3.6\,{\rm \mu}{\textrm m},\star$
image has been created after determining the amount of glowing dust present (by analysing the empirical
 $3.6$
and
$3.6$
and
 $4.5\,{\rm \mu}{\textrm m}$
images) and subsequently subtracting the dust light from the
$4.5\,{\rm \mu}{\textrm m}$
images) and subsequently subtracting the dust light from the
 $3.6\,{\rm \mu}{\textrm m}$
image. Thus, the
$3.6\,{\rm \mu}{\textrm m}$
image. Thus, the
 $3.6\,{\rm \mu}{\textrm m},\star$
image shows only the light emitted from the stellar population, and its luminosity can be directly converted into a stellar mass. We adopted a
$3.6\,{\rm \mu}{\textrm m},\star$
image shows only the light emitted from the stellar population, and its luminosity can be directly converted into a stellar mass. We adopted a
 $3.6\,{\rm \mu}{\textrm m}$
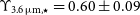
stellar mass-to-light ratio,
$3.6\,{\rm \mu}{\textrm m}$
stellar mass-to-light ratio,
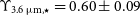
 $\Upsilon_{3.6\,{\rm \mu}{\textrm m},\star}=0.60\pm 0.09$
from Meidt et al. (Reference Meidt2014),Footnote h along with a solar absolute magnitude,
$\Upsilon_{3.6\,{\rm \mu}{\textrm m},\star}=0.60\pm 0.09$
from Meidt et al. (Reference Meidt2014),Footnote h along with a solar absolute magnitude,
 $\mathfrak{M}_{3.6\,{\rm \mu}{\textrm m},\odot}=6.02$
mag (AB), at
$\mathfrak{M}_{3.6\,{\rm \mu}{\textrm m},\odot}=6.02$
mag (AB), at
 $3.6\,{\rm \mu}{\textrm m}$
(Oh et al. Reference Oh, de Blok, Walter, Brinks and Kennicutt Robert2008).
$3.6\,{\rm \mu}{\textrm m}$
(Oh et al. Reference Oh, de Blok, Walter, Brinks and Kennicutt Robert2008).
To model the light from NGC 3319, we utilised the isophotal fitting and modelling software routines isofit and cmodel (Ciambur Reference Ciambur2015), respectively. After masking extraneous light sources, we ran isofit on the
 $3.6\,{\rm \mu}{\textrm m},\star$
image (Figure 3, left panel) and used cmodel to extract, and create a representation of, the galaxy (Figure 3, second panel). The quality of the extraction can be seen in the residual images presented in the right two panels of Figure 3.
$3.6\,{\rm \mu}{\textrm m},\star$
image (Figure 3, left panel) and used cmodel to extract, and create a representation of, the galaxy (Figure 3, second panel). The quality of the extraction can be seen in the residual images presented in the right two panels of Figure 3.
The extracted galaxy was then analysed by the surface brightness profile fitting software profiler (Ciambur Reference Ciambur2016). This works by convolving the galaxy model with the Spitzer (IRAC channel 1) point spread function (PSF) with a full width at half maximum (FWHM) of
 $$1''.66$$
for the cryogenic missionFootnote i until an optimal match is achieved.Footnote j We present the resulting galaxy surface brightness profiles and multicomponent fits for both the major axis (Figure 4, left two panels) and the geometric mean axis, equivalent to a circularised representation of the galaxy (Figure 4, right two panels).
$$1''.66$$
for the cryogenic missionFootnote i until an optimal match is achieved.Footnote j We present the resulting galaxy surface brightness profiles and multicomponent fits for both the major axis (Figure 4, left two panels) and the geometric mean axis, equivalent to a circularised representation of the galaxy (Figure 4, right two panels).
We confirm that NGC 3319 is a bulgeless galaxy and does not require a traditional Sérsic bulge component (Sérsic Reference Sérsic1963; Ciotti Reference Ciotti1991; Graham & Driver Reference Graham and Driver2005). Instead, we generate a convincing fit that adequately captures all of the light of the galaxy (with a total rms scatter,
 $\Delta_{rms}<0.11$
mag) using five components: a Ferrers bar (Ferrers Reference Ferrers1877); an exponential disk; two Gaussian components to capture spiral arm crossings of the major axis; and a point source at the centre. We calculate a total integrated
$\Delta_{rms}<0.11$
mag) using five components: a Ferrers bar (Ferrers Reference Ferrers1877); an exponential disk; two Gaussian components to capture spiral arm crossings of the major axis; and a point source at the centre. We calculate a total integrated
 $3.6\,{\rm \mu}{\textrm m},\star$
apparent magnitude of
$3.6\,{\rm \mu}{\textrm m},\star$
apparent magnitude of
 $12.42\pm 0.11$
mag (AB). Additional component magnitudes are tabulated in Table 1. Based on its distance (
$12.42\pm 0.11$
mag (AB). Additional component magnitudes are tabulated in Table 1. Based on its distance (
 $14.3\pm 1.1$
Mpc), we determine an absolute magnitude of
$14.3\pm 1.1$
Mpc), we determine an absolute magnitude of
 $-18.37\pm 0.20$
mag for the galaxy at
$-18.37\pm 0.20$
mag for the galaxy at
 $3.6\,{\rm \mu}{\textrm m},\star$
. Applying
$3.6\,{\rm \mu}{\textrm m},\star$
. Applying
 $\Upsilon_{3.6\,{\rm \mu}{\textrm m},\star}=0.60\pm 0.09$
(Meidt et al. Reference Meidt2014) and
$\Upsilon_{3.6\,{\rm \mu}{\textrm m},\star}=0.60\pm 0.09$
(Meidt et al. Reference Meidt2014) and
 $\mathfrak{M}_{3.6\,{\rm \mu}{\textrm m},\odot}=6.02$
mag (AB) yields a total logarithmic stellar mass of
$\mathfrak{M}_{3.6\,{\rm \mu}{\textrm m},\odot}=6.02$
mag (AB) yields a total logarithmic stellar mass of
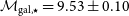 $\mathcal{M}_{{\textrm{gal}},\star}=9.53\pm 0.10$
(cf. Georgiev et al. Reference Georgiev, Böker, Leigh, Lützgendorf and Neumayer2016,
$\mathcal{M}_{{\textrm{gal}},\star}=9.53\pm 0.10$
(cf. Georgiev et al. Reference Georgiev, Böker, Leigh, Lützgendorf and Neumayer2016,
 $\mathcal{M}_{{\textrm{gal}},\star}=9.53\pm 0.16$
) for NGC 3319.
$\mathcal{M}_{{\textrm{gal}},\star}=9.53\pm 0.16$
) for NGC 3319.
NGC 3319 component magnitudes and masses. Columns: (1) Surface brightness profile component. (2)
 $3.6\,{\rm \mu}{\textrm m},\star$
apparent magnitude (AB). (3)
$3.6\,{\rm \mu}{\textrm m},\star$
apparent magnitude (AB). (3)
 $3.6\,{\rm \mu}{\textrm m},\star$
absolute magnitude (AB). (4) Logarithmic (solar) mass.
$3.6\,{\rm \mu}{\textrm m},\star$
absolute magnitude (AB). (4) Logarithmic (solar) mass.

Savorgnan et al. (Reference Savorgnan, Graham and Marconi2016) discovered a distinct red and blue sequence for early- and late-type galaxies in the
 $M_\bullet$
–
$M_\bullet$
–
 $M_{{\textrm{gal}},\star}$
diagram, forming a revision to the core-Sérsic (giant early-type galaxies) and Sérsic (spiral and low-mass early-type galaxy) sequence from Graham (Reference Graham2012), Graham & Scott (Reference Graham and Scott2013), and Scott et al. (Reference Scott, Graham and Schombert2013). van den Bosch (Reference van den Bosch2016) subsequently showed this separation including additional galaxies, albeit with less reliable black hole masses, while Terrazas et al. (Reference Terrazas, Bell, Henriques, White, Cattaneo and Woo2016) captured it in terms of star formation rate. Here, we apply the latest relation established for spiral galaxies with directly measured black hole masses. Applying Equation (3) (with
$M_{{\textrm{gal}},\star}$
diagram, forming a revision to the core-Sérsic (giant early-type galaxies) and Sérsic (spiral and low-mass early-type galaxy) sequence from Graham (Reference Graham2012), Graham & Scott (Reference Graham and Scott2013), and Scott et al. (Reference Scott, Graham and Schombert2013). van den Bosch (Reference van den Bosch2016) subsequently showed this separation including additional galaxies, albeit with less reliable black hole masses, while Terrazas et al. (Reference Terrazas, Bell, Henriques, White, Cattaneo and Woo2016) captured it in terms of star formation rate. Here, we apply the latest relation established for spiral galaxies with directly measured black hole masses. Applying Equation (3) (with
 $\upsilon\equiv1$
) from Davis et al. (Reference Davis, Graham and Cameron2018), this total galaxy stellar mass predicts a central black hole mass as follows:
$\upsilon\equiv1$
) from Davis et al. (Reference Davis, Graham and Cameron2018), this total galaxy stellar mass predicts a central black hole mass as follows:
 \begin{equation}\mathcal{M}_{{\textrm{gal}},\star}=9.53\pm 0.10\rightarrow \mathcal{M}_\bullet(M_{{\textrm{gal}},\star})=3.38\pm 1.02,\end{equation}
with
 $P(\mathcal{M}_\bullet\leq 5)=94\%$
.
$P(\mathcal{M}_\bullet\leq 5)=94\%$
.
As can be seen in the images and from the ellipticity profile, there is no mistaking that NGC 3319 possesses a strong bar that accounts for most of the light from the inner
 $R_{\textrm{maj}}\lesssim 30{^{\prime\prime}}$
(
$R_{\textrm{maj}}\lesssim 30{^{\prime\prime}}$
(
 $\lesssim $
2.1 kpc) region of the galaxy. There is no obvious evidence of a bulge (spheroid) component; thus, NGC 3319 is considered to be a bulgeless galaxy. Even if one were to describe the bar as a pseudobulge mistakenly, its logarithmic ‘bulge’ mass would only be
$\lesssim $
2.1 kpc) region of the galaxy. There is no obvious evidence of a bulge (spheroid) component; thus, NGC 3319 is considered to be a bulgeless galaxy. Even if one were to describe the bar as a pseudobulge mistakenly, its logarithmic ‘bulge’ mass would only be
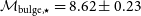 $\mathcal{M}_{\textrm{bulge},\star}=8.62\pm 0.23$
(see Table 1). If applied to the
$\mathcal{M}_{\textrm{bulge},\star}=8.62\pm 0.23$
(see Table 1). If applied to the
 $M_\bullet$
–
$M_\bullet$
–
 $M_{\textrm{bulge},\star}$
relation from (Davis et al. Reference Davis, Graham and Cameron2019a, their Equation (11)), this would still comfortably predict an IMBH of
$M_{\textrm{bulge},\star}$
relation from (Davis et al. Reference Davis, Graham and Cameron2019a, their Equation (11)), this would still comfortably predict an IMBH of
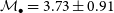 $\mathcal{M}_\bullet=3.73\pm 0.91$
, with
$\mathcal{M}_\bullet=3.73\pm 0.91$
, with
 $P(\mathcal{M}_\bullet\leq 5)=92\%$
.
$P(\mathcal{M}_\bullet\leq 5)=92\%$
.
2.3. The
${M}_\bullet$
–
${M}_{NC},\star$
relation


From our surface brightness profile decomposition of NGC 3319, we extracted a central point source apparent magnitude of
 $\mathfrak{m}_{3.6\,{\rm \mu}{\textrm m},\star}=20.22\pm 0.32\,\text{mag}$
, yielding an absolute magnitude of
$\mathfrak{m}_{3.6\,{\rm \mu}{\textrm m},\star}=20.22\pm 0.32\,\text{mag}$
, yielding an absolute magnitude of
 $\mathfrak{M}_{3.6\,{\rm \mu}{\textrm m},\star}=-10.57\pm 0.36\,\text{mag}$
. We will assume that this luminosity is due to the nuclear cluster (NC) of stars. Of course, some contribution of flux will come from the AGN. Therefore, we estimate an upper limit to the nuclear star cluster mass using
$\mathfrak{M}_{3.6\,{\rm \mu}{\textrm m},\star}=-10.57\pm 0.36\,\text{mag}$
. We will assume that this luminosity is due to the nuclear cluster (NC) of stars. Of course, some contribution of flux will come from the AGN. Therefore, we estimate an upper limit to the nuclear star cluster mass using
 $\Upsilon_{3.6\,{\rm \mu}{\textrm m},\star}=0.60\pm 0.09$
and
$\Upsilon_{3.6\,{\rm \mu}{\textrm m},\star}=0.60\pm 0.09$
and
 $\mathfrak{M}_{3.6\,{\rm \mu}{\textrm m},\odot}=6.02$
mag (AB), to give
$\mathfrak{M}_{3.6\,{\rm \mu}{\textrm m},\odot}=6.02$
mag (AB), to give
 $\mathcal{M}_{\textrm{NC},\star}\leq 6.41\pm 0.16$
. We deem this to be a reasonable estimate since it lies between the recent estimates of
$\mathcal{M}_{\textrm{NC},\star}\leq 6.41\pm 0.16$
. We deem this to be a reasonable estimate since it lies between the recent estimates of
 $\mathcal{M}_{\textrm{NC},\star}=6.24\pm 0.07$
(Georgiev & Böker Reference Georgiev and Böker2014; Georgiev et al. Reference Georgiev, Böker, Leigh, Lützgendorf and Neumayer2016) and
$\mathcal{M}_{\textrm{NC},\star}=6.24\pm 0.07$
(Georgiev & Böker Reference Georgiev and Böker2014; Georgiev et al. Reference Georgiev, Böker, Leigh, Lützgendorf and Neumayer2016) and
 $\mathcal{M}_{\textrm{NC},\star}=6.76\pm 0.07$
(Jiang et al. Reference Jiang2018), both from Hubble Space Telescope imaging of NGC 3319.
$\mathcal{M}_{\textrm{NC},\star}=6.76\pm 0.07$
(Jiang et al. Reference Jiang2018), both from Hubble Space Telescope imaging of NGC 3319.
Using the new
 $M_\bullet$
–
$M_\bullet$
–
 $M_{{\textrm{NC}},\star}$
relation of Graham (Reference Graham2020),Footnote k given by
$M_{{\textrm{NC}},\star}$
relation of Graham (Reference Graham2020),Footnote k given by
 \begin{align}
\!\!\mathcal{M}_\bullet(M_{\textrm{NC},\star})= (2.62\pm 0.42)\log\!\bigg(\frac{M_{\textrm{NC},\star}}{10^{7.83}\,\textrm{M}_{\odot}}\bigg) + (8.22\pm 0.20),\end{align}
\begin{align}
\!\!\mathcal{M}_\bullet(M_{\textrm{NC},\star})= (2.62\pm 0.42)\log\!\bigg(\frac{M_{\textrm{NC},\star}}{10^{7.83}\,\textrm{M}_{\odot}}\bigg) + (8.22\pm 0.20),\end{align}
and with an intrinsic scatter of 1.31 dex. However, due to AGN contamination, we treat this as an upper limit black hole mass estimate. Therefore, we predict the following black hole mass:
 \begin{equation}\mathcal{M}_{\textrm{NC},\star}\leq 6.41\pm 0.16\rightarrow \mathcal{M}_\bullet(M_{\textrm{NC},\star})\leq 4.51\pm 1.51,\end{equation}
with
 $P(\mathcal{M}_\bullet\leq 5)\geq63\%$
.
$P(\mathcal{M}_\bullet\leq 5)\geq63\%$
.
2.4. The
${\text M}_\bullet$
–
${\text v}_{\textrm{rot}}$
relation


From HyperLedaFootnote l (Paturel et al. Reference Paturel, Theureau, Bottinelli, Gouguenheim, Coudreau-Durand, Hallet and Petit2003), we adopted their apparent maximum rotation velocity of the gas,
 $v_{\textrm{max,g}} = 84.33\pm 1.80\,{\textrm{km}\,{\text s}^{-1}}$
(homogenised value derived from 24 independent measurements), which is the observed maximum rotation velocity uncorrected for inclination effect. We then converted this to a maximum physical rotation velocity corrected for inclination (
$v_{\textrm{max,g}} = 84.33\pm 1.80\,{\textrm{km}\,{\text s}^{-1}}$
(homogenised value derived from 24 independent measurements), which is the observed maximum rotation velocity uncorrected for inclination effect. We then converted this to a maximum physical rotation velocity corrected for inclination (
 $v_{\textrm{rot}}$
) via
$v_{\textrm{rot}}$
) via
 \begin{equation}v_{\textrm{rot}} \equiv \frac{v_{\textrm{max,g}}}{\sin{i_{\textrm{disk}}}} = 102.21\pm 2.20\,{\textrm{km}\,{\text s}^{-1}}.\end{equation}
Application of Equation (10) from Davis et al. (Reference Davis, Graham and Combes2019b) gives
 \begin{equation}v_{\textrm{rot}}=102.21\pm 2.20\,{\textrm{km}\,{\text s}^{-1}}\rightarrow \mathcal{M}_\bullet(v_{\textrm{rot}})=3.90\pm 0.59,\end{equation}
with
 $P(\mathcal{M}_\bullet\leq 5)=97\%$
.
$P(\mathcal{M}_\bullet\leq 5)=97\%$
.
2.5. The
${M}_\bullet$
–
$\sigma_0$
relation


We obtained the central stellar velocity dispersion from Ho et al. (Reference Ho, Greene, Filippenko and Sargent2009) and utilised Equation (2) from Sahu et al. (Reference Sahu, Graham and Davis2019b) to predict a black hole mass as follows:
 \begin{equation}\sigma_0=87.4\pm 9.2\,{\textrm{km}\,{\text s}^{-1}}\rightarrow \mathcal{M}_\bullet(\sigma_0)=6.08\pm 0.67,\end{equation}
with
 $P(\mathcal{M}_\bullet\leq 5)=5\%$
. This black hole mass estimate is the highest of all our estimates; it is our only discrete mass estimate of NGC 3319* with
$P(\mathcal{M}_\bullet\leq 5)=5\%$
. This black hole mass estimate is the highest of all our estimates; it is our only discrete mass estimate of NGC 3319* with
 $\mathcal{M}_\bullet>5.2$
.
$\mathcal{M}_\bullet>5.2$
.
Ho et al. (Reference Ho, Greene, Filippenko and Sargent2009) presented a catalogue of pre-existing velocity dispersions, observed sometime between 1982 and 1990 (Ho, Filippenko, & Sargent Reference Ho, Filippenko and Sargent1995). The measurements were weighted-mean dispersions from the blue- and red-side of the Double Spectrograph (Oke & Gunn Reference Oke and Gunn1982) mounted at the Cassegrain focus of the Hale 5.08 m telescope at Palomar Observatory. However, Ho et al. (Reference Ho, Greene, Filippenko and Sargent2009) found that the blue-side spectral resolution is insufficient to reliably measure dispersions for most of the later-type galaxies in their sample, as was the case for NGC 3319. Ho et al. (Reference Ho, Greene, Filippenko and Sargent2009) only presented a red-side velocity dispersion for NGC 3319. Moreover, Ho et al. (Reference Ho, Filippenko and Sargent1995) noted that for their observations of NGC 3319 ‘the continuum shape of its spectrum may be uncertain because of imperfect correction for spatial focus variations’.
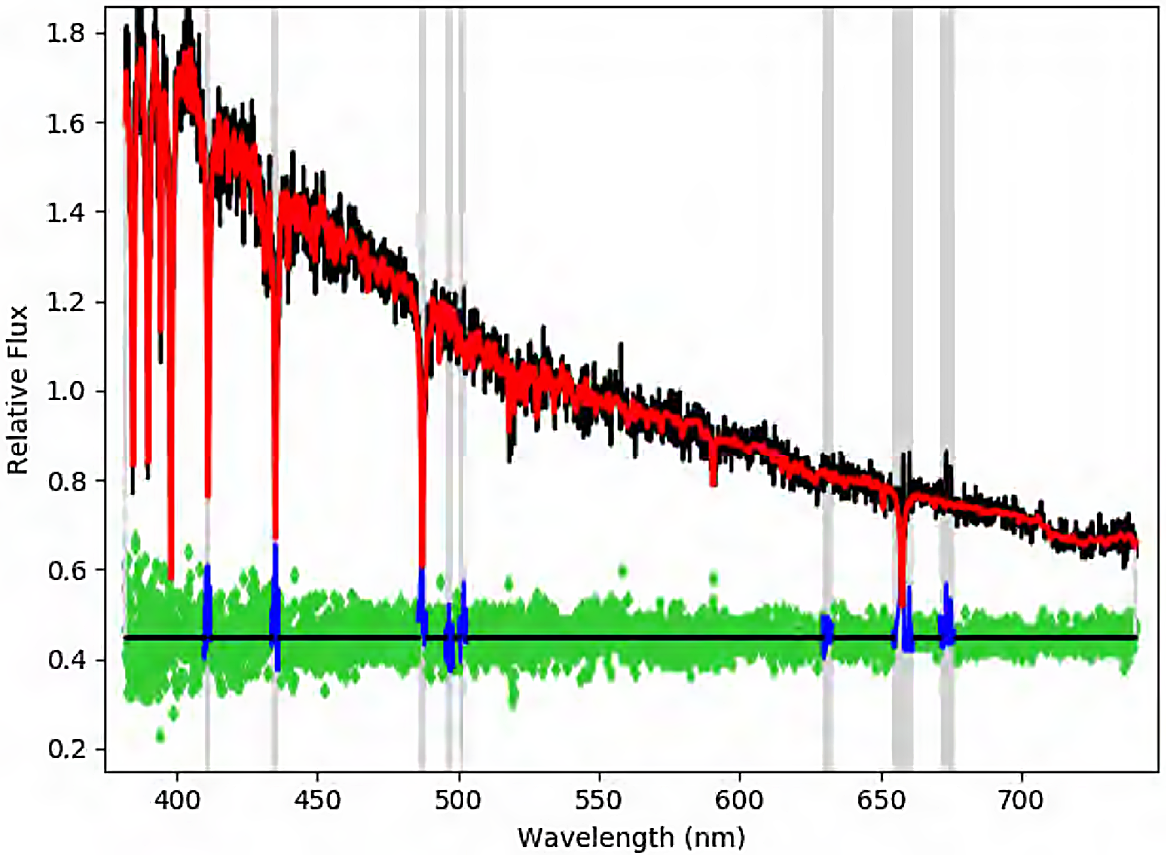
Although Jiang et al. (Reference Jiang2018) do present a spectrum of NGC 3319 (see their Figure 5) from the Sloan Digital Sky Survey (SDSS), they do not report on the velocity dispersion. The SDSS Data Release 12 (Alam et al. Reference Alam2015) statesFootnote m that ‘best-fit velocity-dispersion values
 $\lesssim $
100 km s–1 are below the resolution limit of the SDSS spectrograph and are to be regarded with caution’. Nonetheless, we have attempted to measure the velocity dispersion from the SDSS spectrum (Figure 5) and found
$\lesssim $
100 km s–1 are below the resolution limit of the SDSS spectrograph and are to be regarded with caution’. Nonetheless, we have attempted to measure the velocity dispersion from the SDSS spectrum (Figure 5) and found
 $\sigma_0 = 99\pm 9\,{\textrm{km}\,{\text s}}^{-1}$
(given the aforementioned resolution limit, this is likely an upper limit), albeit with a discrepant estimate of its recessional velocity. We found
$\sigma_0 = 99\pm 9\,{\textrm{km}\,{\text s}}^{-1}$
(given the aforementioned resolution limit, this is likely an upper limit), albeit with a discrepant estimate of its recessional velocity. We found
 $cz=860\pm 6\,{\textrm{km}\,{\text s}}^{-1}$
, which is markedly different from the SDSS value (
$cz=860\pm 6\,{\textrm{km}\,{\text s}}^{-1}$
, which is markedly different from the SDSS value (
 $cz=713\pm 5\,{\textrm{km}\,{\text s}}^{-1}$
), or even the mean heliocentric radial velocity from HyperLeda (
$cz=713\pm 5\,{\textrm{km}\,{\text s}}^{-1}$
), or even the mean heliocentric radial velocity from HyperLeda (
 $cz=738\pm 7\,{\textrm{km}\,{\text s}}^{-1}$
). Although
$cz=738\pm 7\,{\textrm{km}\,{\text s}}^{-1}$
). Although
 $\sigma_0\lesssim 100$
km s–1, and is thusly suspicious, our measurement of
$\sigma_0\lesssim 100$
km s–1, and is thusly suspicious, our measurement of
 $\sigma_0 = 99\pm 9\,{\textrm{km}\,{\text s}}^{-1}$
is consistent with the value from (Ho et al. Reference Ho, Filippenko and Sargent1995). Better spectral resolution should provide greater clarity as to the velocity dispersion of this galaxy, which might also be influenced by the nuclear star cluster.
$\sigma_0 = 99\pm 9\,{\textrm{km}\,{\text s}}^{-1}$
is consistent with the value from (Ho et al. Reference Ho, Filippenko and Sargent1995). Better spectral resolution should provide greater clarity as to the velocity dispersion of this galaxy, which might also be influenced by the nuclear star cluster.
Fit to the SDSS spectrum of NGC 3319 by ppxf (Cappellari Reference Cappellari2017). The relative flux of the observed spectrum ![]() is overplotted by the ppxf fit
is overplotted by the ppxf fit ![]() to the spectrum. The residuals to the fit
to the spectrum. The residuals to the fit ![]() are at the bottom (normalised about the arbitrary horizontal black line) along with residuals from the masked emission features
are at the bottom (normalised about the arbitrary horizontal black line) along with residuals from the masked emission features ![]() , while grey vertical bands delineate the masked regions not included in the
, while grey vertical bands delineate the masked regions not included in the
 $\chi^2$
minimisation of the fit. The fit is consistent with
$\chi^2$
minimisation of the fit. The fit is consistent with
 $\sigma_0 = 99\pm 9\,{\textrm{km}\,{\text s}}^{-1}$
and
$\sigma_0 = 99\pm 9\,{\textrm{km}\,{\text s}}^{-1}$
and
 $cz=860\pm 6\,{\textrm{km}\,{\text s}}^{-1}$
.
$cz=860\pm 6\,{\textrm{km}\,{\text s}}^{-1}$
.
2.6. The
${M}_\bullet$
–
${L}_{2-10\,\textrm{keV}}$
relation


Mayers et al. (Reference Mayers2018) studied a sample of 30 AGN (
 $z\leq 0.23$
,
$z\leq 0.23$
,
 $L_{2-10\,\textrm{keV}}\geq10^{40.8}\,{\textrm{erg}\,{\text s}^{-1}}$
, and
$L_{2-10\,\textrm{keV}}\geq10^{40.8}\,{\textrm{erg}\,{\text s}^{-1}}$
, and
 $\mathcal{M}_\bullet\geq5.45$
), with black hole masses estimated via Bentz & Katz (Reference Bentz and Katz2015) and reported a trend between black hole mass and X-ray luminosity. From the 2–10keV band CXO observations of the nuclear point source in NGC 3319, Jiang et al. (Reference Jiang2018) calculated a luminosity of
$\mathcal{M}_\bullet\geq5.45$
), with black hole masses estimated via Bentz & Katz (Reference Bentz and Katz2015) and reported a trend between black hole mass and X-ray luminosity. From the 2–10keV band CXO observations of the nuclear point source in NGC 3319, Jiang et al. (Reference Jiang2018) calculated a luminosity of
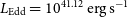
 $L_{2-10\,\textrm{keV}}=10^{39.0\pm 0.1}\,{\textrm{erg}\,{\text s}^{-1}}$
. We applied the
$L_{2-10\,\textrm{keV}}=10^{39.0\pm 0.1}\,{\textrm{erg}\,{\text s}^{-1}}$
. We applied the
 $M_\bullet$
–
$M_\bullet$
–
 $L_{2-10\,\textrm{keV}}$
relation of (Mayers et al. Reference Mayers2018, extracted from Figure 11),
$L_{2-10\,\textrm{keV}}$
relation of (Mayers et al. Reference Mayers2018, extracted from Figure 11),
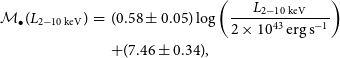 \begin{eqnarray}
\mathcal{M}_\bullet(L_{2-10\,\textrm{keV}}) &=& (0.58\pm 0.05)\log\left(\frac{L_{2-10\,\textrm{keV}}}{2\times10^{43}\,{\textrm{erg}\,{\text s}^{-1}}}\right)\nonumber\\
&& + (7.46\pm 0.34),\end{eqnarray}
\begin{eqnarray}
\mathcal{M}_\bullet(L_{2-10\,\textrm{keV}}) &=& (0.58\pm 0.05)\log\left(\frac{L_{2-10\,\textrm{keV}}}{2\times10^{43}\,{\textrm{erg}\,{\text s}^{-1}}}\right)\nonumber\\
&& + (7.46\pm 0.34),\end{eqnarray}
with a scatter of 0.89 dex, such that
 \begin{align}
\!\!\!L_{2-10\,\textrm{keV}}=10^{39.0\pm 0.1}\,{\textrm{erg}\,{\text s}^{-1}}\rightarrow \mathcal{M}_\bullet(L_{2-10\,\textrm{keV}})=4.97\pm 0.98,\end{align}
\begin{align}
\!\!\!L_{2-10\,\textrm{keV}}=10^{39.0\pm 0.1}\,{\textrm{erg}\,{\text s}^{-1}}\rightarrow \mathcal{M}_\bullet(L_{2-10\,\textrm{keV}})=4.97\pm 0.98,\end{align}
with
 $P(\mathcal{M}_\bullet\leq 5)=51\%$
. However, given that the Eddington ratio will vary over time, as the AGN duty cycle turns the AGN on and off, this is unlikely to be a stable mass estimate.Footnote n The fundamental plane of black hole activity (Section 2.9) can offer additional insight, with its counterbalance from the waxing/waning radio emission.Footnote o
$P(\mathcal{M}_\bullet\leq 5)=51\%$
. However, given that the Eddington ratio will vary over time, as the AGN duty cycle turns the AGN on and off, this is unlikely to be a stable mass estimate.Footnote n The fundamental plane of black hole activity (Section 2.9) can offer additional insight, with its counterbalance from the waxing/waning radio emission.Footnote o
In what follows (Sections 2.7–2.9) are three black hole mass estimates from Jiang et al. (Reference Jiang2018), which are explicitly described here.
2.7. The
${M}_\bullet$
–
$\sigma_{\textrm{NXS}}^2$
relation


From the light curves obtained by the CXO observations, Jiang et al. (Reference Jiang2018) estimated the X-ray variability, represented as the (10 ks) normalised excess variance (
 $\sigma_{\textrm{NXS}}^2$
). They found
$\sigma_{\textrm{NXS}}^2$
). They found
 $\sigma_{\textrm{NXS}}^2=0.093\pm 0.088$
. By applying the
$\sigma_{\textrm{NXS}}^2=0.093\pm 0.088$
. By applying the
 $M_\bullet$
–
$M_\bullet$
–
 $\sigma_{\textrm{NXS}}^2$
relation from (Pan et al. Reference Pan, Yuan, Zhou, Dong and Liu2015, Figure 4), Jiang et al. (Reference Jiang2018) obtained
$\sigma_{\textrm{NXS}}^2$
relation from (Pan et al. Reference Pan, Yuan, Zhou, Dong and Liu2015, Figure 4), Jiang et al. (Reference Jiang2018) obtained
 \begin{equation}\sigma_{\textrm{NXS}}^2=0.093\pm 0.088\rightarrow \mathcal{M}_\bullet(\sigma_{\textrm{NXS}}^2)=5.18\pm 1.92,\end{equation}
with
 $P(\mathcal{M}_\bullet\leq 5)=46\%$
. Clearly, with an upper 1
$P(\mathcal{M}_\bullet\leq 5)=46\%$
. Clearly, with an upper 1
 $\sigma$
estimate for the black hole mass of
$\sigma$
estimate for the black hole mass of
 $\sim$
10
$\sim$
10
 $^7$
M
$^7$
M
 $_{\odot}$
, on its own this is not evidence for an IMBH.
$_{\odot}$
, on its own this is not evidence for an IMBH.
2.8. Eddington ratio
Based upon the median radio-quiet quasar spectral energy distribution (SED) of Elvis et al. (Reference Elvis1994), Jiang et al. (Reference Jiang2018) determined a bolometric luminosity of
 $L_{\textrm{bol}}=(3.6\pm 1.1)\times10^{40}\,{\textrm{erg}\,{\text s}^{-1}}$
for NGC 3319*, by scaling the SED to the CXO luminosity (
$L_{\textrm{bol}}=(3.6\pm 1.1)\times10^{40}\,{\textrm{erg}\,{\text s}^{-1}}$
for NGC 3319*, by scaling the SED to the CXO luminosity (
 $L_{2-10\,\textrm{keV}}=10^{39.0\pm 0.1}\,{\textrm{erg}\,{\text s}^{-1}}$
) and integrating the entire SED. Using XMM-Newton and CXO observations of NGC 3319*, Jiang et al. (Reference Jiang2018) also determined a hard X-ray photon index of
$L_{2-10\,\textrm{keV}}=10^{39.0\pm 0.1}\,{\textrm{erg}\,{\text s}^{-1}}$
) and integrating the entire SED. Using XMM-Newton and CXO observations of NGC 3319*, Jiang et al. (Reference Jiang2018) also determined a hard X-ray photon index of
 $\Gamma=2.02\pm 0.27$
. Following Jiang et al. (Reference Jiang2018), we converted this into an Eddington ratio,
$\Gamma=2.02\pm 0.27$
. Following Jiang et al. (Reference Jiang2018), we converted this into an Eddington ratio,
 $\log(L_{\textrm{bol}}/L_{\textrm{Edd}})=-0.56\pm 0.99$
, with an Eddington luminosity,
$\log(L_{\textrm{bol}}/L_{\textrm{Edd}})=-0.56\pm 0.99$
, with an Eddington luminosity,
 $L_{\textrm{Edd}}\equiv1.26\times10^{38}\,M_\bullet(\textrm{M}_{\odot}^{-1}\,{\textrm{erg}\,{\text s}}^{-1})$
, via Equation (2) from Shemmer et al. (Reference Shemmer, Brandt, Netzer, Maiolino and Kaspi2008). Therefore,
$L_{\textrm{Edd}}\equiv1.26\times10^{38}\,M_\bullet(\textrm{M}_{\odot}^{-1}\,{\textrm{erg}\,{\text s}}^{-1})$
, via Equation (2) from Shemmer et al. (Reference Shemmer, Brandt, Netzer, Maiolino and Kaspi2008). Therefore,
 $L_{\textrm{Edd}}=10^{41.12\pm 1.00}\,{\textrm{erg}\,{\text s}^{-1}}$
.
$L_{\textrm{Edd}}=10^{41.12\pm 1.00}\,{\textrm{erg}\,{\text s}^{-1}}$
.
From this point in the calculation, Jiang et al. (Reference Jiang2018) arbitrarily selected
 $L_{\textrm{bol}}/L_{\textrm{Edd}}=0.1^{+0.9}_{-0.099}$
, implying
$L_{\textrm{bol}}/L_{\textrm{Edd}}=0.1^{+0.9}_{-0.099}$
, implying
 $M_\bullet=3^{+297}_{-2.7}\times10^3\,\textrm{M}_\odot$
. Thus, Jiang et al. (Reference Jiang2018) broadened the mass estimate to a range from
$M_\bullet=3^{+297}_{-2.7}\times10^3\,\textrm{M}_\odot$
. Thus, Jiang et al. (Reference Jiang2018) broadened the mass estimate to a range from
 $M_\bullet=3\times10^2$
to
$M_\bullet=3\times10^2$
to
 $3\times10^5\,\textrm{M}_{\odot}$
for arbitrary Eddington ratios ranging from 1 to
$3\times10^5\,\textrm{M}_{\odot}$
for arbitrary Eddington ratios ranging from 1 to
 $10^{-3}$
, a range of 3 dex. For our purposes, we will remain with the calculated
$10^{-3}$
, a range of 3 dex. For our purposes, we will remain with the calculated
 $\log(L_{\textrm{bol}}/L_{\textrm{Edd}})=-0.56$
with
$\log(L_{\textrm{bol}}/L_{\textrm{Edd}})=-0.56$
with
 $L_{\textrm{Edd}}=10^{41.12}\,{\textrm{erg}\,{\text s}^{-1}}$
, but will follow Jiang et al. (Reference Jiang2018)’s conservative 3 dex range of uncertainty by broadening our estimate to
$L_{\textrm{Edd}}=10^{41.12}\,{\textrm{erg}\,{\text s}^{-1}}$
, but will follow Jiang et al. (Reference Jiang2018)’s conservative 3 dex range of uncertainty by broadening our estimate to
 \begin{equation}L_{\textrm{Edd}}=10^{41.12\pm 1.50}\,{\textrm{erg}\,{\text s}^{-1}}\rightarrow \mathcal{M}_\bullet(L_{\textrm{Edd}})=3.02\pm 1.50,\end{equation}
with
 $P(\mathcal{M}_\bullet\leq 5)=91\%$
.
$P(\mathcal{M}_\bullet\leq 5)=91\%$
.
2.9. Fundamental plane of black hole activity
Baldi et al. (Reference Baldi2018) obtained high-resolution (
 $\leq $
 $$0.''2$$
) 1.5 GHz-radio images of the core in NGC 3319 but failed to detect a source; therefore, establishing an upper limit to the luminosity,
$$0.''2$$
) 1.5 GHz-radio images of the core in NGC 3319 but failed to detect a source; therefore, establishing an upper limit to the luminosity,
 $L_{1.5\,{\textrm{GHz}}}\leq 10^{35.03}\,{\textrm{erg}\,{\text s}}^{-1}$
.Footnote p This radio luminosity can be applied to the fundamental plane of black hole activity (Merloni, Heinz, & di Matteo Reference Merloni, Heinz and di Matteo2003; Falcke, Körding, & Markoff Reference Falcke, Körding and Markoff2004; Gültekin et al. Reference Gültekin, Cackett, Miller, Di Matteo, Markoff and Richstone2009; Plotkin et al. Reference Plotkin, Markoff, Kelly, Körding and Anderson2012; Dong & Wu Reference Dong and Wu2015; Liu, Han, & Zhang Reference Liu, Han and Zhang2016; Nisbet & Best Reference Nisbet and Best2016), which demonstrates an empirical correlation between the continuum X-ray, radio emission, and mass of an accreting black hole. This fundamental plane applies to supermassive, as well as stellar-mass black holes; therefore, it should also be suitable for the intervening population of IMBHs (e.g. Gültekin et al. Reference Gültekin, Cackett, King, Miller and Pinkney2014). Using the fundamental plane of black hole activity, Jiang et al. (Reference Jiang2018) reported a black hole mass estimate of
$L_{1.5\,{\textrm{GHz}}}\leq 10^{35.03}\,{\textrm{erg}\,{\text s}}^{-1}$
.Footnote p This radio luminosity can be applied to the fundamental plane of black hole activity (Merloni, Heinz, & di Matteo Reference Merloni, Heinz and di Matteo2003; Falcke, Körding, & Markoff Reference Falcke, Körding and Markoff2004; Gültekin et al. Reference Gültekin, Cackett, Miller, Di Matteo, Markoff and Richstone2009; Plotkin et al. Reference Plotkin, Markoff, Kelly, Körding and Anderson2012; Dong & Wu Reference Dong and Wu2015; Liu, Han, & Zhang Reference Liu, Han and Zhang2016; Nisbet & Best Reference Nisbet and Best2016), which demonstrates an empirical correlation between the continuum X-ray, radio emission, and mass of an accreting black hole. This fundamental plane applies to supermassive, as well as stellar-mass black holes; therefore, it should also be suitable for the intervening population of IMBHs (e.g. Gültekin et al. Reference Gültekin, Cackett, King, Miller and Pinkney2014). Using the fundamental plane of black hole activity, Jiang et al. (Reference Jiang2018) reported a black hole mass estimate of
 $\leq $
 $10^5\,\textrm{M}_{\odot}$
. However, it is typically the 5 GHz, not the 1.5 GHz luminosity as we have, that is employed in the fundamental plane relation. Therefore, we follow the radiative flux density,
$10^5\,\textrm{M}_{\odot}$
. However, it is typically the 5 GHz, not the 1.5 GHz luminosity as we have, that is employed in the fundamental plane relation. Therefore, we follow the radiative flux density,
 $S_\nu\propto\nu^{\alpha_R}$
, conversion of Qian et al. (Reference Qian, Dong, Xie, Liu and Li2018) by adopting
$S_\nu\propto\nu^{\alpha_R}$
, conversion of Qian et al. (Reference Qian, Dong, Xie, Liu and Li2018) by adopting
 $\alpha_R=-0.5\pm 0.1$
as the typical radio spectral index of bright (high Eddington ratio) AGN. Doing so, this predicts an associated 5 GHz luminosity of
$\alpha_R=-0.5\pm 0.1$
as the typical radio spectral index of bright (high Eddington ratio) AGN. Doing so, this predicts an associated 5 GHz luminosity of
 $L_{5\,{\textrm{GHz}}}\leq 10^{34.77\pm 0.05}\,{\textrm{erg}\,{\text s}}^{-1}$
. Using this value along with
$L_{5\,{\textrm{GHz}}}\leq 10^{34.77\pm 0.05}\,{\textrm{erg}\,{\text s}}^{-1}$
. Using this value along with
 $L_{2-10\,\textrm{keV}}=10^{39.0\pm 0.1}\,{\textrm{erg}\,{\text s}^{-1}}$
(Section 2.6), we applied the relation of (Gültekin et al. Reference Gültekin, King, Cackett, Nyland, Miller, Di Matteo, Markoff and Rupen2019, Equation (8)) to predict the following upper limit to the black hole mass:
$L_{2-10\,\textrm{keV}}=10^{39.0\pm 0.1}\,{\textrm{erg}\,{\text s}^{-1}}$
(Section 2.6), we applied the relation of (Gültekin et al. Reference Gültekin, King, Cackett, Nyland, Miller, Di Matteo, Markoff and Rupen2019, Equation (8)) to predict the following upper limit to the black hole mass:
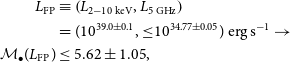 \begin{align}L_{\textrm{FP}}& \equiv \left(L_{2-10\,\textrm{keV}},L_{5\,{\textrm{GHz}}}\right)\nonumber \\
& = (10^{39.0\pm 0.1},{\leq }10^{34.77\pm 0.05})\,{\textrm{erg}\,{\text s}}^{-1}\rightarrow\nonumber \\
\mathcal{M}_\bullet(L_{\textrm{FP}})&\leq 5.62\pm 1.05,\end{align}
\begin{align}L_{\textrm{FP}}& \equiv \left(L_{2-10\,\textrm{keV}},L_{5\,{\textrm{GHz}}}\right)\nonumber \\
& = (10^{39.0\pm 0.1},{\leq }10^{34.77\pm 0.05})\,{\textrm{erg}\,{\text s}}^{-1}\rightarrow\nonumber \\
\mathcal{M}_\bullet(L_{\textrm{FP}})&\leq 5.62\pm 1.05,\end{align}
with
 $P(\mathcal{M}_\bullet\leq 5)\geq28\%$
.Footnote q
$P(\mathcal{M}_\bullet\leq 5)\geq28\%$
.Footnote q
However, two issues make this particular prediction problematic. The first is that the radio and X-ray data were not obtained simultaneously, and the timescale for variations in flux will be short for IMBHs given that it scales with the size of the ‘event horizon’ and thus with the black hole mass. The second issue is that the ‘fundamental plane of black hole activity’ is applicable to black holes with low accretion rates (Merloni et al. Reference Merloni, Heinz and di Matteo2003, their final paragraph of Section 6), and NGC 3319* is considered to have a high accretion rate (Jiang et al. Reference Jiang2018, see Section 3.2). Therefore, we do not include this estimate in our derivation of the black hole mass.
Determination of the PDF of the black hole mass estimates for NGC 3319*. The PDF ![]() is the best-fit skew-kurtotic-normal distribution to the Sum
is the best-fit skew-kurtotic-normal distribution to the Sum ![]() of each of the seven selected black hole mass estimates’ normal distributions;
of each of the seven selected black hole mass estimates’ normal distributions; ![]() . The solid vertical line
. The solid vertical line ![]() indicates the position of
indicates the position of
 $\mathcal{\widehat{M}}_\bullet$
. The dotted vertical lines
$\mathcal{\widehat{M}}_\bullet$
. The dotted vertical lines ![]() demarcate
demarcate
 $\mathcal{\widehat{M}}_\bullet-\delta^-\mathcal{\widehat{M}}_\bullet$
(left) and
$\mathcal{\widehat{M}}_\bullet-\delta^-\mathcal{\widehat{M}}_\bullet$
(left) and
 $\mathcal{\widehat{M}}_\bullet+\delta^+\mathcal{\widehat{M}}_\bullet$
(right, overlapping with the dashed line). The dashed vertical lines
$\mathcal{\widehat{M}}_\bullet+\delta^+\mathcal{\widehat{M}}_\bullet$
(right, overlapping with the dashed line). The dashed vertical lines ![]() demarcate the upper- and lower bound mass definitions of an IMBH.
demarcate the upper- and lower bound mass definitions of an IMBH.

2.10. The
$\textbf{M}_\bullet$
–
$\mathcal{C}_{\text{FUV,tot}}$
relation


Dullo et al. (Reference Dullo, Bouquin, Gil de Paz, Knapen and Gorgas2020) present a relationship between the black hole mass and its host galaxy’s UV
 $-3.6\,{\mu}{\textrm m}$
colourFootnote r from their study of 67 galaxies with directly measured black hole masses. From Table D1 in Dullo et al. (Reference Dullo, Bouquin, Gil de Paz, Knapen and Gorgas2020), the predicted black hole mass for NGC 3319* is
$-3.6\,{\mu}{\textrm m}$
colourFootnote r from their study of 67 galaxies with directly measured black hole masses. From Table D1 in Dullo et al. (Reference Dullo, Bouquin, Gil de Paz, Knapen and Gorgas2020), the predicted black hole mass for NGC 3319* is
 $\mathcal{M}_\bullet=5.36\pm 0.85$
, based on its FUV
$\mathcal{M}_\bullet=5.36\pm 0.85$
, based on its FUV
 $-3.6\,{\mu}{\textrm m}$
colour (
$-3.6\,{\mu}{\textrm m}$
colour (
 $\mathcal{C}_{\text{FUV,tot}}$
).Footnote s However, we can further refine this prediction by accounting for the internal dust extinction in NGC 3319. Given that NGC 3319 is bulgeless, we treat it as being all disk. Using our adopted inclination,
$\mathcal{C}_{\text{FUV,tot}}$
).Footnote s However, we can further refine this prediction by accounting for the internal dust extinction in NGC 3319. Given that NGC 3319 is bulgeless, we treat it as being all disk. Using our adopted inclination,
 $i_{\textrm{disk}}=55.^{\!\!\circ}6\pm 0.^{\!\!\circ}2$
, and applying Equations (2) and (4) from (Dullo et al. Reference Dullo, Bouquin, Gil de Paz, Knapen and Gorgas2020, see also Driver et al. Reference Driver, Popescu, Tuffs, Graham, Liske and Baldry2008), we find that these corrections make NGC 3319
$i_{\textrm{disk}}=55.^{\!\!\circ}6\pm 0.^{\!\!\circ}2$
, and applying Equations (2) and (4) from (Dullo et al. Reference Dullo, Bouquin, Gil de Paz, Knapen and Gorgas2020, see also Driver et al. Reference Driver, Popescu, Tuffs, Graham, Liske and Baldry2008), we find that these corrections make NGC 3319
 $0.57\pm 0.16$
mag brighter in the ultraviolet and
$0.57\pm 0.16$
mag brighter in the ultraviolet and
 $0.05\pm 0.02$
mag brighter at
$0.05\pm 0.02$
mag brighter at
 $3.6\,{\mu}{\textrm m}$
.Footnote t Thus, the change in colour will be
$3.6\,{\mu}{\textrm m}$
.Footnote t Thus, the change in colour will be
 $0.52\pm 0.14$
mag bluer, which updates the FUV
$0.52\pm 0.14$
mag bluer, which updates the FUV
 $-3.6\,{\mu}{\textrm m}$
colour from Bouquin et al. (Reference Bouquin2018) to an internal-dust-corrected
$-3.6\,{\mu}{\textrm m}$
colour from Bouquin et al. (Reference Bouquin2018) to an internal-dust-corrected
 $\mathcal{C}_{\text{FUV,tot}}=1.16\pm 0.14$
mag. Using the BCES bisector (Akritas & Bershady Reference Akritas and Bershady1996)
$\mathcal{C}_{\text{FUV,tot}}=1.16\pm 0.14$
mag. Using the BCES bisector (Akritas & Bershady Reference Akritas and Bershady1996)
 $M_\bullet$
–
$M_\bullet$
–
 $\mathcal{C}_{\text{FUV,tot}}$
relation for late-type galaxies with a slope of
$\mathcal{C}_{\text{FUV,tot}}$
relation for late-type galaxies with a slope of
 $1.03\pm 0.13$
from Table 2 in Dullo et al. (Reference Dullo, Bouquin, Gil de Paz, Knapen and Gorgas2020), we obtain a black hole mass which is
$1.03\pm 0.13$
from Table 2 in Dullo et al. (Reference Dullo, Bouquin, Gil de Paz, Knapen and Gorgas2020), we obtain a black hole mass which is
 $1.03\pm 0.13\times0.52\pm 0.14=0.53\pm 0.16$
dex smaller than reported in Table D1. This revision reduces the tabulated estimate of
$1.03\pm 0.13\times0.52\pm 0.14=0.53\pm 0.16$
dex smaller than reported in Table D1. This revision reduces the tabulated estimate of
 $\mathcal{M}_\bullet$
from
$\mathcal{M}_\bullet$
from
 $5.36\pm 0.85$
to
$5.36\pm 0.85$
to
 $4.83\pm 0.87$
. Thus,
$4.83\pm 0.87$
. Thus,
 \begin{eqnarray}\mathcal{C}_{\text{FUV,tot}}=1.16\pm 0.14\,{\textrm{mag}}\rightarrow\mathcal{M}_\bullet(\mathcal{C}_{\text{FUV,tot}})=4.83\pm 0.87,\end{eqnarray}
with
 $P(\mathcal{M}_\bullet\leq 5)=58\%$
.
$P(\mathcal{M}_\bullet\leq 5)=58\%$
.
NGC 3319* mass predictions. Columns: (1) Black hole mass scaling relation predictor. (2) Logarithmic black hole (solar) mass. (3) Probability that NGC 3319* is
 $\leq $
 $10^5\,\textrm{M}_{\odot}$
, via Equation (7).
$10^5\,\textrm{M}_{\odot}$
, via Equation (7).

a Excluded from the black hole mass PDF.
2.11. Probability density function
With such a multitude of mass estimates and a hesitancy to place confidence in one measurement alone, we combined the aforementioned mass estimates (except for that from Equation (15)) to yield a single black hole mass estimate for NGC 3319*. We did so by analysing the probability density function (PDF) of the distribution of mass estimates (see Figure 6). For our seven selected black hole mass estimates (Equations (6), (8), (12), (13), (16), (17), and (19)), we let a normal distribution represent each estimate with their respective means (
 $\mathcal{\bar{M}}_\bullet$
) and standard deviations (
$\mathcal{\bar{M}}_\bullet$
) and standard deviations (
 $\delta\mathcal{\bar{M}}_\bullet$
). We then added the seven Gaussians together to produce a combined summation. To ensure the area of the summation is equal to one, we divided each of the seven Gaussian addends by seven so that the area under each Gaussian equalled
$\delta\mathcal{\bar{M}}_\bullet$
). We then added the seven Gaussians together to produce a combined summation. To ensure the area of the summation is equal to one, we divided each of the seven Gaussian addends by seven so that the area under each Gaussian equalled
 $1/7$
.
$1/7$
.
We fit a skew-kurtotic-normal distribution to the summation and measured the peak (mode) black hole mass of the PDF as
 \begin{equation}\mathcal{\widehat{M}}_\bullet \equiv \mathcal{M}_\bullet(\max{P}) = 4.50_{-0.52}^{+0.51},\end{equation}
where
 $\mathcal{M}_\bullet(\max{P})$
is the black hole mass when the probability (P) reaches its maximum (
$\mathcal{M}_\bullet(\max{P})$
is the black hole mass when the probability (P) reaches its maximum (
 $\max{P}=0.272$
). We quantify its standard error as
$\max{P}=0.272$
). We quantify its standard error as
 \begin{eqnarray}\delta^+\mathcal{\widehat{M}}_\bullet &\equiv& \frac{{\textrm{RWHM}}}{\sqrt{2N\ln{2}}} = 0.51\ \ \ \textrm{and}\nonumber\\[5pt]
\delta^-\mathcal{\widehat{M}}_\bullet &\equiv& \frac{{\textrm{LWHM}}}{\sqrt{2N\ln{2}}} = 0.52,\end{eqnarray}
\begin{eqnarray}\delta^+\mathcal{\widehat{M}}_\bullet &\equiv& \frac{{\textrm{RWHM}}}{\sqrt{2N\ln{2}}} = 0.51\ \ \ \textrm{and}\nonumber\\[5pt]
\delta^-\mathcal{\widehat{M}}_\bullet &\equiv& \frac{{\textrm{LWHM}}}{\sqrt{2N\ln{2}}} = 0.52,\end{eqnarray}
with right width at half max
 ${\textrm{RWHM}}=1.59$
dex, left width at half max
${\textrm{RWHM}}=1.59$
dex, left width at half max
 ${\textrm{LWHM}}=1.63$
dex, the number of predictors
${\textrm{LWHM}}=1.63$
dex, the number of predictors
 $N=7$
, and
$N=7$
, and
 $P(\mathcal{\widehat{M}}_\bullet\leq 5)=84\%$
. For a complete comparison of all the mass estimates, see Table 2 and Figure 7.
$P(\mathcal{\widehat{M}}_\bullet\leq 5)=84\%$
. For a complete comparison of all the mass estimates, see Table 2 and Figure 7.
Forest plot of the 10 different black hole mass estimates of NGC 3319*. Seven discrete mass estimates (
 $\blacksquare$
) are used to generate the
$\blacksquare$
) are used to generate the
 $\mathcal{\widehat{M}}_\bullet$
estimate (
$\mathcal{\widehat{M}}_\bullet$
estimate (
 $\bullet$
) at the bottom of the figure. The black hole mass estimate from the X-ray luminosity,
$\bullet$
) at the bottom of the figure. The black hole mass estimate from the X-ray luminosity,
 $\mathcal{M}_\bullet({L}_{2-10\,{\textrm{keV}}})$
, is plotted (
$\mathcal{M}_\bullet({L}_{2-10\,{\textrm{keV}}})$
, is plotted (
 $\square$
), but not included in the calculation of
$\square$
), but not included in the calculation of
 $\mathcal{\widehat{M}}_\bullet$
. Nor are the upper limit black hole mass estimates included in the calculation of
$\mathcal{\widehat{M}}_\bullet$
. Nor are the upper limit black hole mass estimates included in the calculation of
 $\mathcal{\widehat{M}}_\bullet$
. The black hole mass estimates from the nuclear star cluster mass,
$\mathcal{\widehat{M}}_\bullet$
. The black hole mass estimates from the nuclear star cluster mass,
 $\mathcal{M}_\bullet(\mathcal{M}_{\textrm{NC},\star})$
, and the fundamental plane of black hole activity,
$\mathcal{M}_\bullet(\mathcal{M}_{\textrm{NC},\star})$
, and the fundamental plane of black hole activity,
 $\mathcal{M}_\bullet(L_{\textrm{FP}})$
, are upper limit black hole mass estimates depicted by left-pointing open triangles (
$\mathcal{M}_\bullet(L_{\textrm{FP}})$
, are upper limit black hole mass estimates depicted by left-pointing open triangles (
 $\triangleleft$
). The vertical lines are equivalent to those found in Figure 6.
$\triangleleft$
). The vertical lines are equivalent to those found in Figure 6.

3. Discussion
We have presented multiple mass estimates for NGC 3319*, eight of which are discrete estimates, and two are upper limits (Sections 2.3 and 2.9). The non-detection of a nuclear source in the radio observations places an upper limit that is indeed higher than most of our other mass estimates. This missing radio detection begs for future deep, high spatial resolution radio (along with simultaneous X-ray) observations to provide an improved mass estimate for NGC 3319* via the fundamental plane of black hole activity. Nonetheless, the upper limit mass estimate from the fundamental plane of black hole activity (Equation (18)) is in agreement with our other mass estimate derived from X-ray measurements (Equation (15)).
We can use the (distance-adjusted) star formation rate (SFR) for the bar of NGC 3319 (
 $\textrm{SFR}_{\textrm{bar}}=0.023\pm0.004\,\textrm{M}_{\boldsymbol{\odot}}\,\textrm{yr}^{-1}$
) from Zhou et al. (Reference Zhou, Cao and Wu2015), along with our stellar mass for the bar, and the scaling relations of Lehmer et al. (Reference Lehmer2019), to estimate the expected X-ray luminosities (for the 0.5–8keV band) from high-mass and low-mass X-ray binaries in the bar. We estimate
$\textrm{SFR}_{\textrm{bar}}=0.023\pm0.004\,\textrm{M}_{\boldsymbol{\odot}}\,\textrm{yr}^{-1}$
) from Zhou et al. (Reference Zhou, Cao and Wu2015), along with our stellar mass for the bar, and the scaling relations of Lehmer et al. (Reference Lehmer2019), to estimate the expected X-ray luminosities (for the 0.5–8keV band) from high-mass and low-mass X-ray binaries in the bar. We estimate
 $L_\textrm{X}\textrm{(HMXB)}_{\text{bar}}=(1.20\pm0.37)\times10^{38}\,\textrm{erg}\,{\text s}^{-1}$
and
$L_\textrm{X}\textrm{(HMXB)}_{\text{bar}}=(1.20\pm0.37)\times10^{38}\,\textrm{erg}\,{\text s}^{-1}$
and
 $L_\textrm{X}\textrm{(LMXB)}_{\text{bar}}=(7.41\pm4.08)\times10^{37}\,\textrm{erg}\,{\text s}^{-1}$
, respectively. Going further, we can integrate Equations (11) and (12) from Lehmer et al. (Reference Lehmer2019) to predict the expected number of sources in the bar (from either HMXBs or LMXBs) with luminosities greater than or equal to the observed X-ray luminosity of
$L_\textrm{X}\textrm{(LMXB)}_{\text{bar}}=(7.41\pm4.08)\times10^{37}\,\textrm{erg}\,{\text s}^{-1}$
, respectively. Going further, we can integrate Equations (11) and (12) from Lehmer et al. (Reference Lehmer2019) to predict the expected number of sources in the bar (from either HMXBs or LMXBs) with luminosities greater than or equal to the observed X-ray luminosity of
 $\text{NGC}\ 3319^{\ast} $
, which yields
$\text{NGC}\ 3319^{\ast} $
, which yields
 $ N_\textrm{HMXB}\sim0.013 $
and
$ N_\textrm{HMXB}\sim0.013 $
and
 $N_\textrm{LMXB}\sim0.0048$
. If we take their inverses, this gives the probabilities that
$N_\textrm{LMXB}\sim0.0048$
. If we take their inverses, this gives the probabilities that
 $\text{NGC}\ 3319^{\ast} $
is not an IMBH, but rather a stellar-mass HMXB (
$\text{NGC}\ 3319^{\ast} $
is not an IMBH, but rather a stellar-mass HMXB (
 ${\sim}1\hbox{-}\text{in}\hbox{-}77$
) or LMXB (
${\sim}1\hbox{-}\text{in}\hbox{-}77$
) or LMXB (
 ${\sim}1\hbox{-}\text{in}\hbox{-}208$
) anywhere in the bar region.Footnote u Moreover, simulations show that IMBHs are very effective at ejecting and/or disrupting stellar-mass black hole binaries, which are prone to sink inward and gravitationally interact with a central IMBH, if one exists (Leigh et al. Reference Leigh, Lützgendorf, Geller, Maccarone, Heinke and Sesana2014).
${\sim}1\hbox{-}\text{in}\hbox{-}208$
) anywhere in the bar region.Footnote u Moreover, simulations show that IMBHs are very effective at ejecting and/or disrupting stellar-mass black hole binaries, which are prone to sink inward and gravitationally interact with a central IMBH, if one exists (Leigh et al. Reference Leigh, Lützgendorf, Geller, Maccarone, Heinke and Sesana2014).
Amongst our numerous mass estimates, it is perhaps the most well-known black hole mass scaling relation (
 $M_\bullet$
–
$M_\bullet$
–
 $\sigma_0$
) that produces the highest mass estimate. Indeed, Equation (13) provides the only mass estimate that is not consistent with
$\sigma_0$
) that produces the highest mass estimate. Indeed, Equation (13) provides the only mass estimate that is not consistent with
 $\mathcal{M}_\bullet\leq 5$
. It would be of interest to obtain a suitably high-spectral resolution measurement of
$\mathcal{M}_\bullet\leq 5$
. It would be of interest to obtain a suitably high-spectral resolution measurement of
 $\sigma_0$
for NGC 3319 to confirm or revise the solitary measurement that is (now) at least 31 yr old. Although it is not unprecedented to find a black hole that is anomalously under massive with respect to the
$\sigma_0$
for NGC 3319 to confirm or revise the solitary measurement that is (now) at least 31 yr old. Although it is not unprecedented to find a black hole that is anomalously under massive with respect to the
 $M_\bullet$
–
$M_\bullet$
–
 $\sigma_0$
relation (Zaw et al. Reference Zaw, Rosenthal, Katkov, Gelfand, Chen, Greenhill, Brisken and Noori2020).
$\sigma_0$
relation (Zaw et al. Reference Zaw, Rosenthal, Katkov, Gelfand, Chen, Greenhill, Brisken and Noori2020).
We have used the latest refinement of the
 $M_\bullet$
–
$M_\bullet$
–
 $\sigma_0$
relation by Sahu et al. (Reference Sahu, Graham and Davis2019b) to estimate the black hole mass. Building on Davis et al. (Reference Davis, Graham and Seigar2017), Sahu et al. (Reference Sahu, Graham and Davis2019b) have determined that
$\sigma_0$
relation by Sahu et al. (Reference Sahu, Graham and Davis2019b) to estimate the black hole mass. Building on Davis et al. (Reference Davis, Graham and Seigar2017), Sahu et al. (Reference Sahu, Graham and Davis2019b) have determined that
 $M_\bullet\propto\sigma_0^{5.82\pm 0.75}$
from an analysis of 46 spiral galaxies with central velocity dispersion measurements and directly measured black hole masses. However, none of these galaxies have black hole masses below
$M_\bullet\propto\sigma_0^{5.82\pm 0.75}$
from an analysis of 46 spiral galaxies with central velocity dispersion measurements and directly measured black hole masses. However, none of these galaxies have black hole masses below
 $\sigma_0 \approx 100$
km s–1 (
$\sigma_0 \approx 100$
km s–1 (
 $M_\bullet = 10^6\,\textrm{M}_\odot$
). Sahu et al. (Reference Sahu, Graham and Davis2019b, see their Figure 2) have revealed a tendency for galaxies with central velocity dispersions less than
$M_\bullet = 10^6\,\textrm{M}_\odot$
). Sahu et al. (Reference Sahu, Graham and Davis2019b, see their Figure 2) have revealed a tendency for galaxies with central velocity dispersions less than
 $\sim$
100 km s–1 to reside above the
$\sim$
100 km s–1 to reside above the
 $M_\bullet$
–
$M_\bullet$
–
 $\sigma_0$
relation defined by the galaxies with higher velocity dispersions and directly measured black hole masses (i.e. spatially resolved kinematics, not reverberation mapping nor single-epoch spectra coupled with a constant virial f-factor). Therefore, should the velocity dispersion of NGC 3319 be lower than
$\sigma_0$
relation defined by the galaxies with higher velocity dispersions and directly measured black hole masses (i.e. spatially resolved kinematics, not reverberation mapping nor single-epoch spectra coupled with a constant virial f-factor). Therefore, should the velocity dispersion of NGC 3319 be lower than
 $\sigma_0 \approx 100\, \textrm{km}\,{\text s}^{-1}$
, a shallower
$\sigma_0 \approx 100\, \textrm{km}\,{\text s}^{-1}$
, a shallower
 $M_\bullet$
–
$M_\bullet$
–
 $\sigma_0$
relation than used here will be required.
$\sigma_0$
relation than used here will be required.
Baldassare et al. (Reference Baldassare, Dickey, Geha and Reines2020) demonstrated that extrapolations of the shallow
 $M_\bullet$
–
$M_\bullet$
–
 $\sigma_0$
relation for ‘classical bulges’ from Kormendy & Ho (Reference Kormendy and Ho2013) appear (perhaps superficially) valid down to black hole masses of
$\sigma_0$
relation for ‘classical bulges’ from Kormendy & Ho (Reference Kormendy and Ho2013) appear (perhaps superficially) valid down to black hole masses of
 $10^5\,\textrm{M}_{\odot}$
, with black hole mass estimates derived from single-epoch spectroscopic (virial; with assumption of an f-factor to account for the unknown broadline region geometry) masses. If we exclude the
$10^5\,\textrm{M}_{\odot}$
, with black hole mass estimates derived from single-epoch spectroscopic (virial; with assumption of an f-factor to account for the unknown broadline region geometry) masses. If we exclude the
 $M_\bullet$
–
$M_\bullet$
–
 $\sigma_0$
mass estimate altogether, our
$\sigma_0$
mass estimate altogether, our
 $\mathcal{\widehat{M}}_\bullet$
black hole mass estimate for NGC 3319* (Equation (20)) becomes
$\mathcal{\widehat{M}}_\bullet$
black hole mass estimate for NGC 3319* (Equation (20)) becomes
 $\mathcal{\widehat{M}}_\bullet = 4.14_{-0.49}^{+0.50}$
, with
$\mathcal{\widehat{M}}_\bullet = 4.14_{-0.49}^{+0.50}$
, with
 $P(\mathcal{\widehat{M}}_\bullet\leq 5)=96\%$
, based on the remaining six discrete measures used in Figure 6. Additionally, if we treat the nuclear star cluster upper limit mass estimate as a discrete estimate, we arrive at
$P(\mathcal{\widehat{M}}_\bullet\leq 5)=96\%$
, based on the remaining six discrete measures used in Figure 6. Additionally, if we treat the nuclear star cluster upper limit mass estimate as a discrete estimate, we arrive at
 $\mathcal{\widehat{M}}_\bullet = 4.19_{-0.47}^{+0.48}$
, also with
$\mathcal{\widehat{M}}_\bullet = 4.19_{-0.47}^{+0.48}$
, also with
 $P(\mathcal{\widehat{M}}_\bullet\leq 5)=96\%$
. This is based again on seven measures, except now excluding the
$P(\mathcal{\widehat{M}}_\bullet\leq 5)=96\%$
. This is based again on seven measures, except now excluding the
 $M_\bullet$
–
$M_\bullet$
–
 $\sigma_0$
and
$\sigma_0$
and
 $M_\bullet$
–
$M_\bullet$
–
 $L_X$
relation estimates, as well as the fundamental plane estimate.
$L_X$
relation estimates, as well as the fundamental plane estimate.
3.1. Similarity to the IMBH in LEDA 87300
The IMBH candidate in LEDA 87300 (RGG 118) has been proclaimed the ‘smallest’ reported in a galaxy nucleusFootnote v (Baldassare et al. Reference Baldassare, Reines, Gallo and Greene2015, Reference Baldassare, Reines, Gallo and Greene2017; Graham et al. Reference Graham, Ciambur and Soria2016). We adopt the same redshift (
 $z=0.02647\pm 0.00026$
) as Graham et al. (Reference Graham, Ciambur and Soria2016), but instead invoke the latest cosmographic parameters (
$z=0.02647\pm 0.00026$
) as Graham et al. (Reference Graham, Ciambur and Soria2016), but instead invoke the latest cosmographic parameters (
 $H_0 = 67.66\pm0.42\,\text{km}\,\text{s}^{-1}\,\text{Mpc}^{-1}$
,
$H_0 = 67.66\pm0.42\,\text{km}\,\text{s}^{-1}\,\text{Mpc}^{-1}$
,
 $\Omega_\Lambda=0.6889\pm 0.0056$
, and
$\Omega_\Lambda=0.6889\pm 0.0056$
, and
 $\Omega_{\textrm m}=0.3111\pm 0.0056$
) from (Planck Collaboration et al. Reference Planck2020, Equation (28)) to calculate a Hubble flow (comoving radial) distance of
$\Omega_{\textrm m}=0.3111\pm 0.0056$
) from (Planck Collaboration et al. Reference Planck2020, Equation (28)) to calculate a Hubble flow (comoving radial) distance of
 $116.6\pm 1.3$
Mpc (Wright Reference Wright2006). This adjustment yields a mass of
$116.6\pm 1.3$
Mpc (Wright Reference Wright2006). This adjustment yields a mass of
 $\mathcal{M}_\bullet=4.48^{+0.52}_{-0.69}$
for the IMBH (LEDA 87300*) in LEDA 87300, as determined by Graham et al. (Reference Graham, Ciambur and Soria2016), with
$\mathcal{M}_\bullet=4.48^{+0.52}_{-0.69}$
for the IMBH (LEDA 87300*) in LEDA 87300, as determined by Graham et al. (Reference Graham, Ciambur and Soria2016), with
 $P(\mathcal{M}_\bullet\leq 5)=84\%$
. This was based on a virial f-factor of 2.8 (Graham et al. Reference Graham, Onken, Athanassoula and Combes2011) and the assumption that the
$P(\mathcal{M}_\bullet\leq 5)=84\%$
. This was based on a virial f-factor of 2.8 (Graham et al. Reference Graham, Onken, Athanassoula and Combes2011) and the assumption that the
 $M_\bullet$
–
$M_\bullet$
–
 $\sigma_0$
relation for AGN and quiescent galaxies can be extrapolated below
$\sigma_0$
relation for AGN and quiescent galaxies can be extrapolated below
 $10^6$
M
$10^6$
M
 $_\odot$
. Thus, the masses of NGC 3319* and LEDA 87300* are nearly identical,
$_\odot$
. Thus, the masses of NGC 3319* and LEDA 87300* are nearly identical,
 $3.14_{-2.20}^{+7.02}\times10^4\,\textrm{M}_\odot$
and
$3.14_{-2.20}^{+7.02}\times10^4\,\textrm{M}_\odot$
and
 $3.00_{-2.38}^{+6.93}\times10^4\,\textrm{M}_\odot$
, respectively. However, given the overlapping error bars associated with both black holes, the best we can conclude at this time is that their masses may be similar.
$3.00_{-2.38}^{+6.93}\times10^4\,\textrm{M}_\odot$
, respectively. However, given the overlapping error bars associated with both black holes, the best we can conclude at this time is that their masses may be similar.
3.2. Environment and secular evolution
NGC 3319 is a relatively isolated galaxy in a group of four galaxies: NGC 3104, 3184, 3198, and 3319 (Tully Reference Tully1988). Its nearest neighbour at present is most likely NGC 3198. NGC 3198 is at a distance (d) from us of
 $14.5\pm 1.3$
Mpc (Cepheid variable star distance from Kelson et al. Reference Kelson1999), J2000 right ascension (
$14.5\pm 1.3$
Mpc (Cepheid variable star distance from Kelson et al. Reference Kelson1999), J2000 right ascension (
 $\alpha$
) of
$\alpha$
) of
 $10^{\textrm h}19^{\textrm m}55^{\textrm s}$
, and J2000 declination (
$10^{\textrm h}19^{\textrm m}55^{\textrm s}$
, and J2000 declination (
 $\delta$
) of
$\delta$
) of
 $+45{^{\circ}}33{^\prime}09{^{\prime\prime}}$
, while NGC 3319 is at
$+45{^{\circ}}33{^\prime}09{^{\prime\prime}}$
, while NGC 3319 is at
 $d=14.3\pm 1.1$
Mpc,
$d=14.3\pm 1.1$
Mpc,
 $\alpha=10^{\textrm h}39^{\textrm m}09{.\!^{\textrm s}}8$
, and
$\alpha=10^{\textrm h}39^{\textrm m}09{.\!^{\textrm s}}8$
, and
 $$\delta = + 41^\circ 41'15.''9$$
. Based on the heliocentric spherical coordinates of each galaxy, the physical distance between galaxies is
$$\delta = + 41^\circ 41'15.''9$$
. Based on the heliocentric spherical coordinates of each galaxy, the physical distance between galaxies is
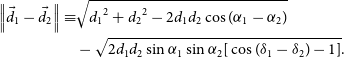 \begin{align}\left \| \vec{d_1}-\vec{d_2} \right \| \equiv & \sqrt{{d_1}^2+{d_2}^2-2d_1d_2\cos(\alpha_1-\alpha_2)}\\
& -\sqrt{2d_1d_2\sin\alpha_1\sin\alpha_2[\cos(\delta_1-\delta_2)-1]}.\nonumber\end{align}
\begin{align}\left \| \vec{d_1}-\vec{d_2} \right \| \equiv & \sqrt{{d_1}^2+{d_2}^2-2d_1d_2\cos(\alpha_1-\alpha_2)}\\
& -\sqrt{2d_1d_2\sin\alpha_1\sin\alpha_2[\cos(\delta_1-\delta_2)-1]}.\nonumber\end{align}
The physical separation between NGC 3198 and NGC 3319 is thus
 $1.3\pm 0.2$
Mpc.
$1.3\pm 0.2$
Mpc.
With this level of isolation, NGC 3319 will likely experience many gigayears of relative tranquillity, without any significant galaxy mergers. If so, NGC 3319* should continue to coevolve along with its host galaxy via secular accretion and feedback. There is no telling evidence that NGC 3319 has experienced a recent major merger. However, we do note that Moore & Gottesman (Reference Moore and Gottesman1998) detected a small system (
 $4.2\times10^7\,\textrm{M}_{\odot}$
), just
$4.2\times10^7\,\textrm{M}_{\odot}$
), just
 $11{^\prime}$
(
$11{^\prime}$
(
 $46\pm 4$
kpc) south of NGC 3319. Moore & Gottesman (Reference Moore and Gottesman1998) postulate that tidal interactions between this object and NGC 3319 likely explain the distorted spiral structure, H i tail, and velocity perturbations in the southern half of the galaxy.
$46\pm 4$
kpc) south of NGC 3319. Moore & Gottesman (Reference Moore and Gottesman1998) postulate that tidal interactions between this object and NGC 3319 likely explain the distorted spiral structure, H i tail, and velocity perturbations in the southern half of the galaxy.
3.3. Direct measurements of NGC 3319*
Stellar remnant black holes are thought to exist between the Tolman–Oppenheimer–Volkoff limit of
 $\approx$
 $2.17\,\textrm{M}_{\odot}$
for cold, non-rotating neutron stars (Tolman Reference Tolman1939; Oppenheimer & Volkoff Reference Oppenheimer and Volkoff1939; Margalit & Metzger Reference Margalit and Metzger2017; Shibata et al. Reference Shibata, Fujibayashi, Hotokezaka, Kiuchi, Kyutoku, Sekiguchi and Tanaka2017; Ruiz, Shapiro, & Tsokaros Reference Ruiz, Shapiro and Tsokaros2018; Rezzolla, Most, & Weih Reference Rezzolla, Most and Weih2018)Footnote w and
$2.17\,\textrm{M}_{\odot}$
for cold, non-rotating neutron stars (Tolman Reference Tolman1939; Oppenheimer & Volkoff Reference Oppenheimer and Volkoff1939; Margalit & Metzger Reference Margalit and Metzger2017; Shibata et al. Reference Shibata, Fujibayashi, Hotokezaka, Kiuchi, Kyutoku, Sekiguchi and Tanaka2017; Ruiz, Shapiro, & Tsokaros Reference Ruiz, Shapiro and Tsokaros2018; Rezzolla, Most, & Weih Reference Rezzolla, Most and Weih2018)Footnote w and
 $\lesssim $
60–
$\lesssim $
60–
 $80\,\textrm{M}_{\odot}$
from the collapse of massive stars estimated from evolutionary models (Belczynski et al. Reference Belczynski, Bulik, Fryer, Ruiter, Valsecchi, Vink and Hurley2010; Woosley Reference Woosley2017; Spera & Mapelli Reference Spera and Mapelli2017). Recent observations have found the least massive known black hole (
$80\,\textrm{M}_{\odot}$
from the collapse of massive stars estimated from evolutionary models (Belczynski et al. Reference Belczynski, Bulik, Fryer, Ruiter, Valsecchi, Vink and Hurley2010; Woosley Reference Woosley2017; Spera & Mapelli Reference Spera and Mapelli2017). Recent observations have found the least massive known black hole (
 $\approx$
 $3.3\,\textrm{M}_{\odot}$
; Thompson et al. Reference Thompson2019).Footnote x Over the past couple of years, black holes have been discovered that begin to surpass the low-mass definition of IMBHs:
$3.3\,\textrm{M}_{\odot}$
; Thompson et al. Reference Thompson2019).Footnote x Over the past couple of years, black holes have been discovered that begin to surpass the low-mass definition of IMBHs:
 $84.4^{+15.8}_{-11.1}\,\textrm{M}_{\odot}$
(Abbott et al. Reference Abbott2019a) and
$84.4^{+15.8}_{-11.1}\,\textrm{M}_{\odot}$
(Abbott et al. Reference Abbott2019a) and
 $98^{+17}_{-11}$
M
$98^{+17}_{-11}$
M
 $_\odot$
(Zackay et al. Reference Zackay, Dai, Venumadhav, Roulet and Zaldarriaga2019). The gravitational-wave signal GW190521 (Abbott et al. Reference Abbott2020b) is consistent with the BH-collisional-creation of a
$_\odot$
(Zackay et al. Reference Zackay, Dai, Venumadhav, Roulet and Zaldarriaga2019). The gravitational-wave signal GW190521 (Abbott et al. Reference Abbott2020b) is consistent with the BH-collisional-creation of a
 $142^{+28}_{-16}$
M
$142^{+28}_{-16}$
M
 $_\odot$
IMBH.Footnote y Its properties and astrophysical implications (Abbott et al. Reference Abbott2020d) are further remarkable given the high confidence that at least one of its progenitors lay in the mass gap predicted by pair-instability supernova theory (Woosley Reference Woosley2017).Footnote z
$_\odot$
IMBH.Footnote y Its properties and astrophysical implications (Abbott et al. Reference Abbott2020d) are further remarkable given the high confidence that at least one of its progenitors lay in the mass gap predicted by pair-instability supernova theory (Woosley Reference Woosley2017).Footnote z
The dwarf elliptical galaxy NGC 205 (M110), which is a satellite of the Andromeda Galaxy (M31), is presently the least massive nuclear black hole measured via direct methods. Nguyen et al. (Reference Nguyen2019) estimated a black hole mass of
 $\mathcal{M}_\bullet=3.83_{-0.60}^{+0.43}$
via stellar dynamical modelling. Furthermore, this galaxy seemingly confirms the extrapolation of scaling relations into the IMBH regime. Explicitly, its black hole mass is consistent with the prediction,
$\mathcal{M}_\bullet=3.83_{-0.60}^{+0.43}$
via stellar dynamical modelling. Furthermore, this galaxy seemingly confirms the extrapolation of scaling relations into the IMBH regime. Explicitly, its black hole mass is consistent with the prediction,
 $\mathcal{M}_\bullet(\sigma_0)=3.86\pm 0.55$
, of the
$\mathcal{M}_\bullet(\sigma_0)=3.86\pm 0.55$
, of the
 $M_\bullet$
–
$M_\bullet$
–
 $\sigma_0$
relation (Sahu et al. Reference Sahu, Graham and Davis2019b, Equation (1)) with
$\sigma_0$
relation (Sahu et al. Reference Sahu, Graham and Davis2019b, Equation (1)) with
 $\sigma_0=33.1\pm 4.8\,{\textrm{km}\,{\text s}}^{-1}$
from HyperLeda.
$\sigma_0=33.1\pm 4.8\,{\textrm{km}\,{\text s}}^{-1}$
from HyperLeda.
In order to dynamically estimate the mass of NGC 3319*, it is necessary to resolve motions within its sphere of influence (SOI). According to Peebles (Reference Peebles1972), the gravitational SOI of a black hole residing at the centre of a galaxy has a radius,
 \begin{equation}r_h \equiv \frac{GM_\bullet}{{\sigma_0}^2}.\end{equation}
Based on its (questionably high) velocity dispersion (Equation (13)), its
 $\mathcal{\widehat{M}}_\bullet$
black hole mass estimate (Equation (20)), and distance, we obtain
$\mathcal{\widehat{M}}_\bullet$
black hole mass estimate (Equation (20)), and distance, we obtain
 $r_h = 17.7_{-12.2}^{+40.8}\,{\textrm{mpc}} = 255_{-176}^{+591}\,\mu{\textrm{as}}$
for NGC 3319*.Footnote aa
$r_h = 17.7_{-12.2}^{+40.8}\,{\textrm{mpc}} = 255_{-176}^{+591}\,\mu{\textrm{as}}$
for NGC 3319*.Footnote aa
The Atacama Large Millimeter Array (ALMA) is useful for probing the gaseous cores of galaxies including the rotating, torus-shaped, circumnuclear rings of molecular gas that enable measurements of the central black hole mass (e.g. García-Burillo et al. Reference García-Burillo2014; Yoon Reference Yoon2017; Combes et al. Reference Combes2019; Davis et al. Reference Davis2020). ALMA currently has an impressive FWHM spatial resolution of 20 mas at 230 GHz. The East Asian VLBI Network (EAVN; see Wajima et al. Reference Wajima2016; Hada et al. Reference Hada2017; An, Sohn, & Imai Reference An, Sohn and Imai2018) has achieved a spatial resolution of 0.55 mas (550
 $\mu$
as) at 22 GHz. Similar milliarcsecond-scale resolution can be expected from the Long Baseline Array (LBA; Edwards & Phillips Reference Edwards and Phillips2015) and the European VLBI Network (EVN; e.g. Radcliffe et al. Reference Radcliffe2018). The Very Long Baseline Array (VLBA) could likely resolve the SOI of NGC 3319*, with its spatial resolution of 0.12 mas (120
$\mu$
as) at 22 GHz. Similar milliarcsecond-scale resolution can be expected from the Long Baseline Array (LBA; Edwards & Phillips Reference Edwards and Phillips2015) and the European VLBI Network (EVN; e.g. Radcliffe et al. Reference Radcliffe2018). The Very Long Baseline Array (VLBA) could likely resolve the SOI of NGC 3319*, with its spatial resolution of 0.12 mas (120
 $${\rm{\mu }}$$
as) by utilising its longest baseline at 3 mm, currently between Mauna Kea, Hawaii and North Liberty, Iowa.Footnote ab The Event Horizon Telescope (EHT) can also resolve the SOI of NGC 3319*, with its PSF FWHM of 20
$${\rm{\mu }}$$
as) by utilising its longest baseline at 3 mm, currently between Mauna Kea, Hawaii and North Liberty, Iowa.Footnote ab The Event Horizon Telescope (EHT) can also resolve the SOI of NGC 3319*, with its PSF FWHM of 20
 $${\rm{\mu }}$$
as. The EHT was able to resolve the emission ring, showing the event horizon, surrounding the SMBH M87* with a diameter of
$${\rm{\mu }}$$
as. The EHT was able to resolve the emission ring, showing the event horizon, surrounding the SMBH M87* with a diameter of
 $42\pm 3\,{\rm \mu}\,{\textrm{as}}$
(Event Horizon Telescope Collaboration et al. 2019).
$42\pm 3\,{\rm \mu}\,{\textrm{as}}$
(Event Horizon Telescope Collaboration et al. 2019).
Due to the difficulty of obtaining a direct measurement of the mass of NGC 3319*, it would be prudent to first study the AGN in NGC 3319 via reverberation mapping (RM) methods. In this respect, the bulgeless spiral galaxy NGC 4395 is the prototype. NGC 4395 possesses one of the least massive nuclear black holes that has ever been measured via direct methods. den Brok et al. (Reference den Brok2015) obtained a black hole mass estimate of
 $4.0_{-1.0}^{+2.7}\times10^5\,\textrm{M}_{\odot}$
via gas dynamical modelling; Brum et al. (Reference Brum2019) similarly obtained
$4.0_{-1.0}^{+2.7}\times10^5\,\textrm{M}_{\odot}$
via gas dynamical modelling; Brum et al. (Reference Brum2019) similarly obtained
 $2.5_{-0.8}^{+1.0}\times10^5\,\textrm{M}_{\odot}$
via gas kinematics. These direct measurements were preceded by informative RM black hole mass estimates of
$2.5_{-0.8}^{+1.0}\times10^5\,\textrm{M}_{\odot}$
via gas kinematics. These direct measurements were preceded by informative RM black hole mass estimates of
 $(3.6\pm 1.1)\times10^5\,\textrm{M}_{\odot}$
(Peterson et al. Reference Peterson2005) and
$(3.6\pm 1.1)\times10^5\,\textrm{M}_{\odot}$
(Peterson et al. Reference Peterson2005) and
 $(4.9\pm 2.6)\times10^4\,\textrm{M}_{\odot}$
(Edri et al. Reference Edri, Rafter, Chelouche, Kaspi and Behar2012, see also Cho et al. Reference Cho2020 and Burke et al. Reference Burke, Shen, Chen, Scaringi, Faucher-Giguere, Liu and Yang2020). Likewise, NGC 3319* could greatly benefit from further study by RM campaigns, or at least single-epoch spectra mass estimates.
$(4.9\pm 2.6)\times10^4\,\textrm{M}_{\odot}$
(Edri et al. Reference Edri, Rafter, Chelouche, Kaspi and Behar2012, see also Cho et al. Reference Cho2020 and Burke et al. Reference Burke, Shen, Chen, Scaringi, Faucher-Giguere, Liu and Yang2020). Likewise, NGC 3319* could greatly benefit from further study by RM campaigns, or at least single-epoch spectra mass estimates.
3.4. Implications
The abundance, or scarcity, of black holes in this new mass domain of IMBHs, has a broad array of implications. These include:
-
Using low-mass AGN to extend the black hole scaling relations for predicting black hole masses in galaxies with quiescent low-mass black holes.
-
IMBHs will enable further refinement of the
$M_\bullet$
–
$M_{\textrm{bulge},\star}$
and
$M_\bullet$
–
$M_{\textrm{gal},\star}$
diagrams (e.g. Davis et al. Reference Davis, Graham and Cameron2018, Reference Davis, Graham and Cameron2019a; Sahu et al. Reference Sahu, Graham and Davis2019a), further facilitating the advancement of BH/galaxy coevolution theories (e.g. Kauffmann & Haehnelt Reference Kauffmann and Haehnelt2000; Croton et al. Reference Croton2006; Schaye et al. Reference Schaye2015). -
Establishing the black hole mass function from stellar to SMBHs, and then revising the black hole mass density of the Universe should IMBHs prove abundant (Aller & Richstone Reference Aller and Richstone2002; Graham et al. Reference Graham, Driver, Allen and Liske2007; Shankar, Weinberg, & Miralda-Escudé Reference Shankar, Weinberg and Miralda-Escudé2009; Davis et al. Reference Davis2014; Mutlu-Pakdil, Seigar, & Davis Reference Mutlu-Pakdil, Seigar and Davis2016).
-
Increased understanding of the build-up of galaxies in our hierarchical Universe via merger events, including IMBH mergers; searches for and constraints of merger rate densities for IMBH binaries (Abbott et al. Reference Abbott2019b; Jani, Shoemaker, & Cutler Reference Jani, Shoemaker and Cutler2019).
-
Connections with nuclear star clusters and ultra-compact dwarf galaxies (Graham & Spitler Reference Graham and Spitler2009; Neumayer & Walcher Reference Neumayer and Walcher2012; Georgiev et al. Reference Georgiev, Böker, Leigh, Lützgendorf and Neumayer2016; Nguyen et al. Reference Nguyen2018; Graham Reference Graham2020; Neumayer, Seth, & Böker Reference Neumayer, Seth and Böker2020) and predictions for space-based gravitational wave detections involving longer wavelength gravitational radiation than ground-based interferometers can detect (Portegies Zwart Reference Portegies Zwart2007; Mapelli et al. Reference Mapelli, Ripamonti, Vecchio, Graham and Gualandris2012; Fragione & Silk Reference Fragione and Silk2020). The much-anticipated Laser Interferometer Space Antenna (LISA; Amaro-Seoane et al. Reference Amaro-Seoane2017) will have a designed observational requirement of detecting the coalescence of unequal mass black hole binaries of total intrinsic mass
$10^4$
–
$10^6\,\textrm{M}_{\odot}$
at
$z<3$
. The merging of such black holes (similar to NGC 3319*), each embedded in their nuclear star cluster, should coalesce within a Hubble time due to dynamical friction (Ogiya et al. Reference Ogiya, Hahn, Mingarelli and Volonteri2020). LISA and the next generation of gravitational wave observatories should also be able to find IMBHs in Milky Way globular clusters and the Local Volume (Arca-Sedda, Amaro-Seoane, & Chen Reference Arca-Sedda, Amaro-Seoane and Chen2020). -
The violent tidal disruption of white dwarf stars by IMBHs can trigger calcium-rich supernovae, spurring the nucleosynthesis of iron-group elements, and are capable of generating observable electromagnetic and gravitational-wave energies (Rees Reference Rees1988; Haas et al. Reference Haas, Shcherbakov, Bode and Laguna2012; MacLeod et al. Reference MacLeod, Guillochon, Ramirez-Ruiz, Kasen and Rosswog2016; Andreoni et al. Reference Andreoni, Jacobs, Hegarty, Pritchard, Cooke and Ryder2017, Reference Andreoni2020; Kuns et al. Reference Kuns, Yu, Chen and Adhikari2020; Anninos et al. Reference Anninos, Hoffman, Grewal, Lavell and Fragile2019; Malyali, Rau, & Nandra Reference Malyali, Rau and Nandra2019).


IMBHs represent the grail lemma, needed to fill the void in our demographic knowledge of black holes, and tie up our inadequate theoretical understanding of BH/galaxy coevolution, feedback, and the growth of the Universe’s most massive black holes. Increased future study of NGC 3319* promises to yield direct confirmation of the existence of an IMBH in AGN mode and offer immediate and lasting scientific advancement.
Acknowledgements
The authors are grateful to Jonah Gannon, who provided valuable expertise with the spectroscopic analysis. We appreciate the useful feedback from Nathan Leigh and we thank Roberto Soria for valuable discussion and insights about the X-ray properties of
 $\text{NGC}\ 3319^{\ast}$
. BLD thanks David Nelson for the use of his secluded office space during the COVID-19 pandemic. This research was supported by the Australian Research Council’s funding scheme DP17012923. Parts of this research were conducted by the Australian Research Council Centre of Excellence for Gravitational Wave Discovery (OzGrav), through project number CE170100004. This material is based upon work supported by Tamkeen under the NYU Abu Dhabi Research Institute grant CAP
$\text{NGC}\ 3319^{\ast}$
. BLD thanks David Nelson for the use of his secluded office space during the COVID-19 pandemic. This research was supported by the Australian Research Council’s funding scheme DP17012923. Parts of this research were conducted by the Australian Research Council Centre of Excellence for Gravitational Wave Discovery (OzGrav), through project number CE170100004. This material is based upon work supported by Tamkeen under the NYU Abu Dhabi Research Institute grant CAP
 $^3$
. This research has made use of NASA’s Astrophysics Data System, and the NASA/IPAC Extragalactic Database (NED) and Infrared Science Archive (IRSA). We acknowledge the use of the HyperLeda database (http://leda.univ-lyon1.fr). We made use of the DS9 visualisation tool (Joye & Mandel Reference Joye and Mandel2003), part of NASA’s High Energy Astrophysics Science Archive Research Center (HEASARC) software.
$^3$
. This research has made use of NASA’s Astrophysics Data System, and the NASA/IPAC Extragalactic Database (NED) and Infrared Science Archive (IRSA). We acknowledge the use of the HyperLeda database (http://leda.univ-lyon1.fr). We made use of the DS9 visualisation tool (Joye & Mandel Reference Joye and Mandel2003), part of NASA’s High Energy Astrophysics Science Archive Research Center (HEASARC) software.