

Rare earth elements (REEs) provide useful petrological information for determining the nature of geological events such as the origin of rocks and their contamination–differentiation processes (Hanson, Reference Hanson1989; Bau & Knittel, Reference Bau and Knittel1993). A large amount of REE data has been obtained, representing the differentiation between various minerals and melts (Rollinson, Reference Rollinson1993), as well as changes occurring in hydrothermal systems at temperatures <350°C (Hermann et al., Reference Hermann, Potts and Knake1974; Michard & Albarede, Reference Michard and Albarede1986; Wood, Reference Wood1990; Jochum & Verma, Reference Jochum and Verma1996), under metamorphic conditions (Konrad-Schmolke et al., Reference Konrad-Schmolke, Zack, O'Brien and Bart2011) and during weathering (Pérez-López et al., Reference Pérez-López, Joaquín Delgado, Nieto and Márquez-García2010).
REEs are also useful for assessing geochemical processes during the evolution of sediments in various environments (Chen & Zhao, Reference Chen and Zhao1997; Censi et al., Reference Censi, Sprovieri, Saiano, Di Geronimo, Larocca and Placenti2007; Karadağ et al., Reference Karadağ, Kupeli, Aryk, Ayhan, Zedef and Doyen2009; Hannigan et al., Reference Hannigan, Dorval and Jones2010; Mongelli et al., Reference Mongelli, Buccione, Gueguen, Langone and Sinisi2016; Abedini et al., Reference Abedini and Calagari2018). The distribution and differentiation of REEs have also been well studied in seawaters, marine sediments and weathering environments (Abedini & Calagari, Reference Abedini and Calagari2013; Mongelli et al., Reference Mongelli, Boni, Buccione and Sinisi2014; Buccione et al., Reference Buccione, Mongelli, Sinisi and Boni2016; Liu et al., Reference Liu, Wang, Zhang, Zhang and Li2016; Long et al., Reference Long, Chi, Liu, Jin and Dai2017; Torr et al., Reference Torr, Proenza, Aiglsperger, Bover-Arnal, Villanova-de-Benavent and Rodrguez-Garca2017; Chen et al., Reference Chen, Wang, Zhang, Carranza and Wang2018). In these cases, the distribution patterns of REEs are generally controlled by weathering of terrestrial material, hydrothermal activities, scavenging, oxygen fugacity, proximity to source lithologies, deposition due to biogenic conditions, diagenesis (Murphy & Dymond, Reference Murphy and Dymond1984; Liu et al., Reference Liu, Miah and Schmitt1988; Murray et al., Reference Murray, Ten Brink, Gerlach, Russ and Jones1991), changes in fluid pH and precipitation reactions due to the presence of organic and inorganic ligands and complexes (Buccione et al., Reference Buccione, Mongelli, Sinisi and Boni2016; Liu et al., Reference Liu, Wang, Zhang, Zhang and Li2016; Long et al., Reference Long, Chi, Liu, Jin and Dai2017; Torr et al., Reference Torr, Proenza, Aiglsperger, Bover-Arnal, Villanova-de-Benavent and Rodrguez-Garca2017; Chen et al., Reference Chen, Wang, Zhang, Carranza and Wang2018).
The main aim of this study was to evaluate the behaviour of REEs (including Y) during water–rock interaction in altered rocks and their volcanic precursors in the Hashtjin area, north-west Iran, and to investigate the origin of tetrad effects and non-chondritic Y/Ho ratios in these samples. The study area includes the western part of the Alborz Tertiary magmatic belt and Pliocene volcanic activity, which was associated with tectonic activity and the formation of numerous faults (Eftekhar Nejad, Reference Eftekhar Nejad1980). The main lithological units of the area consist of volcanic rocks and Quaternary alluvial sediments that have undergone silicic and argillic hydrothermal alterations. These alterations are associated with vein, veinlet and disseminated Cu-, Pb-, Zn-sulfide deposits and magnetite, goethite and hematite mineralizations (Hajalilou, Reference Hajalilou1999). They include extensive argillic alteration and the accumulation of SiO2 deposits in the form of cryptocrystalline quartz in the Tarom–Hashtjin zone. Previous studies have highlighted the role of both the hydrothermal processes and supergene alteration formation of these sequences in the circulation of acid sulfate solutions (Masoumi, Reference Masoumi2010; Abedini et al., Reference Abedini, Masoumi and Calagari2011; Nouri & Mohammady Oskouei, Reference Nouri and Mohammady Oskouei2016; Nouri & Masoumi, Reference Nouri and Masoumi2020).
The tetrad effect in REE patterns and non-chondritic Y/Ho ratios
Normalized REE distribution diagrams produce smooth curves that remove variation due to lanthanide contraction, the Oddo–Harkins rule (Cantrell & Byrne, Reference Cantrell and Byrne1987) and charge radius control (CHARAC) behaviour (Lottermoser, Reference Lottermoser1992; Bau, Reference Bau1996). Any remaining irregularities in normalized distribution patterns, such as the lanthanide tetrad effect, relate to the non-CHARAC behaviour of REEs and have been reported from various depositional environments (Censi et al., Reference Censi, Sprovieri, Saiano, Di Geronimo, Larocca and Placenti2007; Feng et al., Reference Feng, Gao and Zhang2011; Nardi et al., Reference Nardi, Formoso, Jarvis, Oliveira, Bastos Neto and Fontana2012; Abedini et al., Reference Abedini and Calagari2018). Such effects can be detected using index parameters, namely Y/Ho, Zr/Hf, Ce/Ce* and Eu/Eu* ratios (Kawabe, Reference Kawabe1995).
The study of REEs (lanthanides) reveals the different reactive behaviours of these elements in various geological environments, which result from differences in the ionic radius (i.e. increase in the contraction of 5s and 5p shells towards higher atomic numbers) and, in some cases, in the ionic valence redox state (Ce3+ vs Ce4+ and Eu2+ vs Eu3+) (Monecke et al., Reference Monecke, Kempe, Monecke, Sala and Wolf2002). The tetrad effect is not related to the ionic radius and ionic charge, but it is directly controlled by electrons of the f4 shell across the lanthanide series (Nugent, Reference Nugent1970; Siekierski, Reference Siekierski1971).
The tetrad effect was observed for the first time during experiments on liquid–liquid chemical systems in which the distribution coefficient of lanthanides in chondrite-normalized REE patterns varied according to changes in atomic number (Fidelis & Siekierski, Reference Fidelis and Siekierski1966; Peppard et al., Reference Peppard, Mason and Lewey1969). These variations yielded zigzag patterns, which created four separate components referred to as tetrads, defined by a first tetrad (T1): La–Ce–Pr–Nd; a second tetrad (T2): (Pm)–Sm–Eu–Gd; a third tetrad (T3): Gd–Tb–Dy–Ho; and a fourth tetrad (T4): Er–Tm–Yb–Lu. The four segments are separated by discontinuities located at the Pm–Nd, Gd and Er–Ho points, whereby Gd is a joint element between the second and third tetrads. The components of the chondrite-normalized patterns show four convex and concave segments and, in accordance with variations in the electron configuration, the REEs display either M-shaped or W-shaped patterns (Fig. 1) (Masuda et al., Reference Masuda, Kawakami, Dohmoto and Takenaka1987).
Binary diagram representing W- and M-type tetrad effects observed in the REE patterns of seawater and evolved granite. (a) Seawater values are from De Baar et al. (Reference De Baar, Bacon, Brewer and Bruland1985) and (b) Piepgras & Jacobsen (Reference Piepgras and BJacobsen1992). Kawabe et al. (Reference Kawabe, Toriumi, Ohta and Miura1998) show that W-type tetrad effects appear in the REE patterns of seawater. (c) REE values for the evolved granite are from Irber (Reference Irber1999).
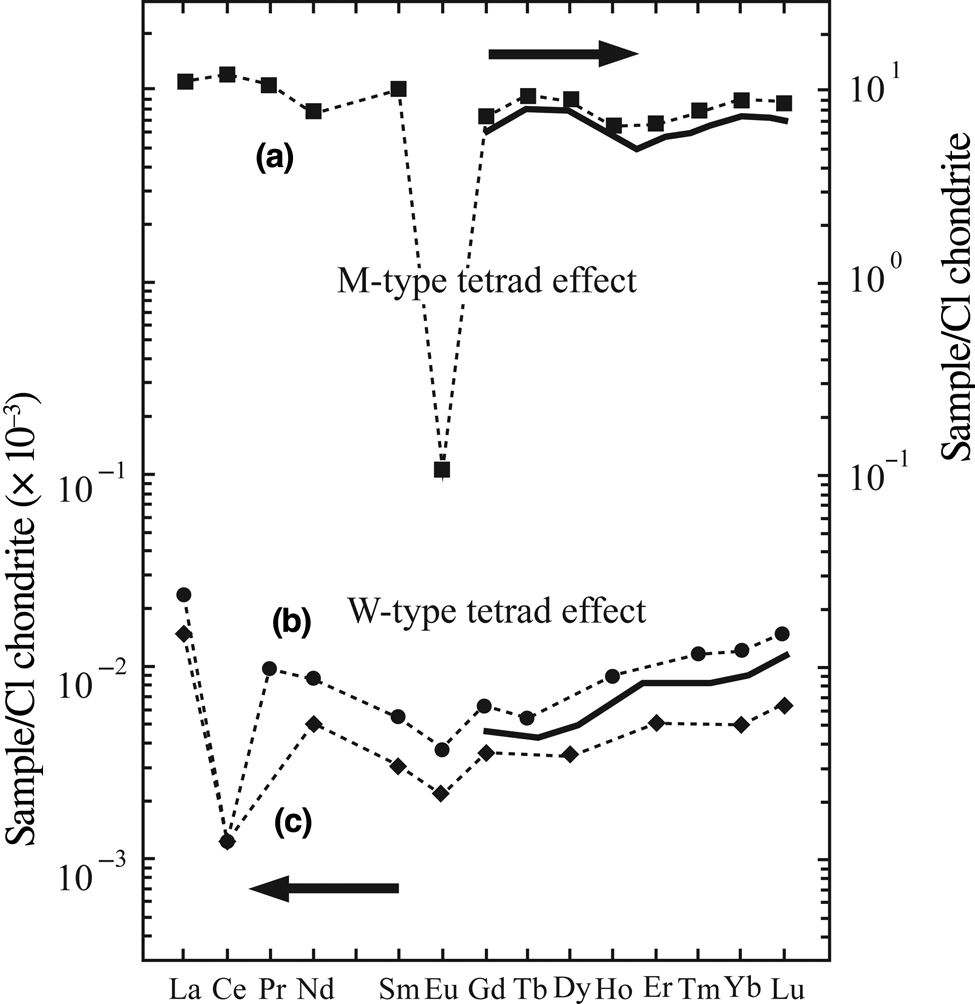
The M-shaped tetrad effect was first recognized in the evolved granitic systems in the south of China (Masuda et al., Reference Masuda, Kawakami, Dohmoto and Takenaka1987) and the W-shaped tetrad effect was identified in constituents of the marine environment such as seawater, algae, shells and limestones (Masuda & Ikeuchi, Reference Masuda and Ikeuchi1979). In the W-type tetrad, Yb and Dy appear in an ascending trend and Er defines a descending segment (Fig. 1). Tetrad effects were also identified in magmatic rocks and hydrothermal ore deposits (Masuda & Akagi, Reference Masuda and Akagi1989; Akagi et al., Reference Akagi, Shabani and Masuda1993, Reference Akagi, Nakai, Shimiuzu and Masuda1996; Lee et al., Reference Lee, Masuda and Kim1994; Kawabe, Reference Kawabe1995; Bau, Reference Bau1996; Lee et al., Reference Lee, Asahara, Tanaka, Kim, Kim and Yi2010), as well as in weathering and hydrothermal alterations (Masuda & Akagi, Reference Masuda and Akagi1989; Takahashi et al., Reference Takahashi, Yoshida, Sato, Hama, Yusa and Shimizu2002; Monecke et al., Reference Monecke, Dulski and Kempe2007; Abedini et al., Reference Abedini and Calagari2018; Li et al., Reference Li, Palinkaš, Evans and Watanabe2020).
The related geochemical properties of Hf–Zr and Y–Ho pairs result from the similar charge and radius of the ions, known as the CHARAC behaviour (Bau, Reference Bau1996), as testified by close to equivalent Y/Ho and Zr/Hf ratios in intermediate to basic igneous rocks and chondrites. Otherwise, these elements show significant departures from the non-chondrite state and display tetrad effect patterns, such as the zigzag REE patterns documented for evolved granite systems (Irber, Reference Irber1999). The Y/Ho ratio of chondrite is 28.1 (Anders & Grevesse, Reference Anders and Grevesse1989), and the rocks with a tetrad effect show either higher or lower non-chondrite Y/Ho ratios (Bau, Reference Bau1996). The non-chondrite behaviour in the aqueous systems may be controlled by the adsorption of Ho by Fe and Mn oxides and hydroxides (Bau et al., Reference Bau, Koschinsky, Dulski and Hein1996). In addition, the fractionation of Y and Ho during weathering may also result in non-chondrite behaviour (Feng et al., Reference Feng, Gao and Zhang2011).
Although previous studies have proposed alternative models for explaining the formation of tetrad effects, the exact origin and geochemical process giving rise to this type of alteration in granites and other rocks, as well as in individual minerals, is not well understood (Veksler et al., Reference Veksler, Dorfman, Kamenetsky, Dulski and Dingwell2005; Censi et al., Reference Censi, Sprovieri, Saiano, Di Geronimo, Larocca and Placenti2007; Monecke et al., Reference Monecke, Dulski and Kempe2007; Inoue et al., Reference Inoue, Nakamura and Kimura2009). The tetrad effect in the evolved granitic systems has been attributed to: (1) fractional crystallization of the melt (Yurimoto et al., Reference Yurimoto, Duke, Papike and Shearer1990; Zhao & Cooper, Reference Zhao and Cooper1993; McLennan, Reference McLennan1994; Pan, Reference Pan1997; Pan & Breaks, Reference Pan and Breaks1997); (2) interaction of the melt phase and hydrothermal fluids during the crystallization of the silicate melt (Lee et al., Reference Lee, Masuda and Kim1994; Kawabe, Reference Kawabe1995; Kempe & Goldstein, Reference Kempe and Goldstein1997; Irber, Reference Irber1999; Wu et al., Reference Wu, Sun, Jahn and Wilde2004; Boulvais et al., Reference Boulvais, Ruffet, Cornichet and Mermet2007; Lee et al., Reference Lee, Asahara, Tanaka, Kim, Kim and Yi2010; Zhao et al., Reference Zhao, Bao and Qiao2010); (3) hydrothermal alteration during water–rock interactions (Monecke et al., Reference Monecke, Dulski and Kempe2007); and (4) weathering following exhumation and erosion of granites (Masuda & Akagi, Reference Masuda and Akagi1989; Takahashi et al., Reference Takahashi, Yoshida, Sato, Hama, Yusa and Shimizu2002). The latter mechanism has been considered to develop M-type tetrads in granitic rocks caused by the circulation of groundwater, whereby the magnitude of alteration increases with the degree of fluid–rock interaction (Masuda & Akagi, Reference Masuda and Akagi1989; Takahashi et al., Reference Takahashi, Yoshida, Sato, Hama, Yusa and Shimizu2002).
The fractionation of Y–Ho and various lanthanides also occurs in aqueous systems (Kawabe et al., Reference Kawabe, Kitahara and Naito1991; Feng et al., Reference Feng, Gao and Zhang2011), and the tetrad effect has been observed in seawater and deposited sediments. A positive Y anomaly is a feature associated with a W-type tetrad effect (Kawabe et al., Reference Kawabe, Kitahara and Naito1991).
Several methods have been proposed to quantify the tetrad effect (Iber, Reference Irber1999; Monecke et al., Reference Monecke, Kempe, Monecke, Sala and Wolf2002). In this study, we use Eq. (1) (from Monecke et al., Reference Monecke, Kempe, Monecke, Sala and Wolf2002), which utilizes only the third and fourth tetrads for quantification. In the calculation, T1 (La–Nd) is not computed if Ce behaves anomalously (Monecke et al., Reference Monecke, Kempe, Monecke, Sala and Wolf2002; Feng et al., Reference Feng, Gao and Zhang2011) and T2 (Pm–Gd) is not included due to a lack of Pm in natural geological systems (McLennan, Reference McLennan1994).
 $$Ti = \sqrt {\displaystyle{1 \over 2} \times \lpar {\lsqb \displaystyle{{C_{Bi}} \over {^3 \sqrt {C_{Ai{^2}} \times C_{Di}} }}-1\rsqb }^2 + {\lsqb \displaystyle{{C_{Ci}} \over {^3 \sqrt {C_{Di^2 } \times C_{Ai}} }}-1\rsqb }^2\rpar } $$
Ti represents the type of tetrad (i denotes the group of the tetrad). When Ti = 0, this represents no tetrad effect and all of the elements of the group are located on a straight line. Ti > 0 indicates the tetrad effect in the elements of a group (Monecke et al., Reference Monecke, Kempe, Monecke, Sala and Wolf2002).
Geological setting
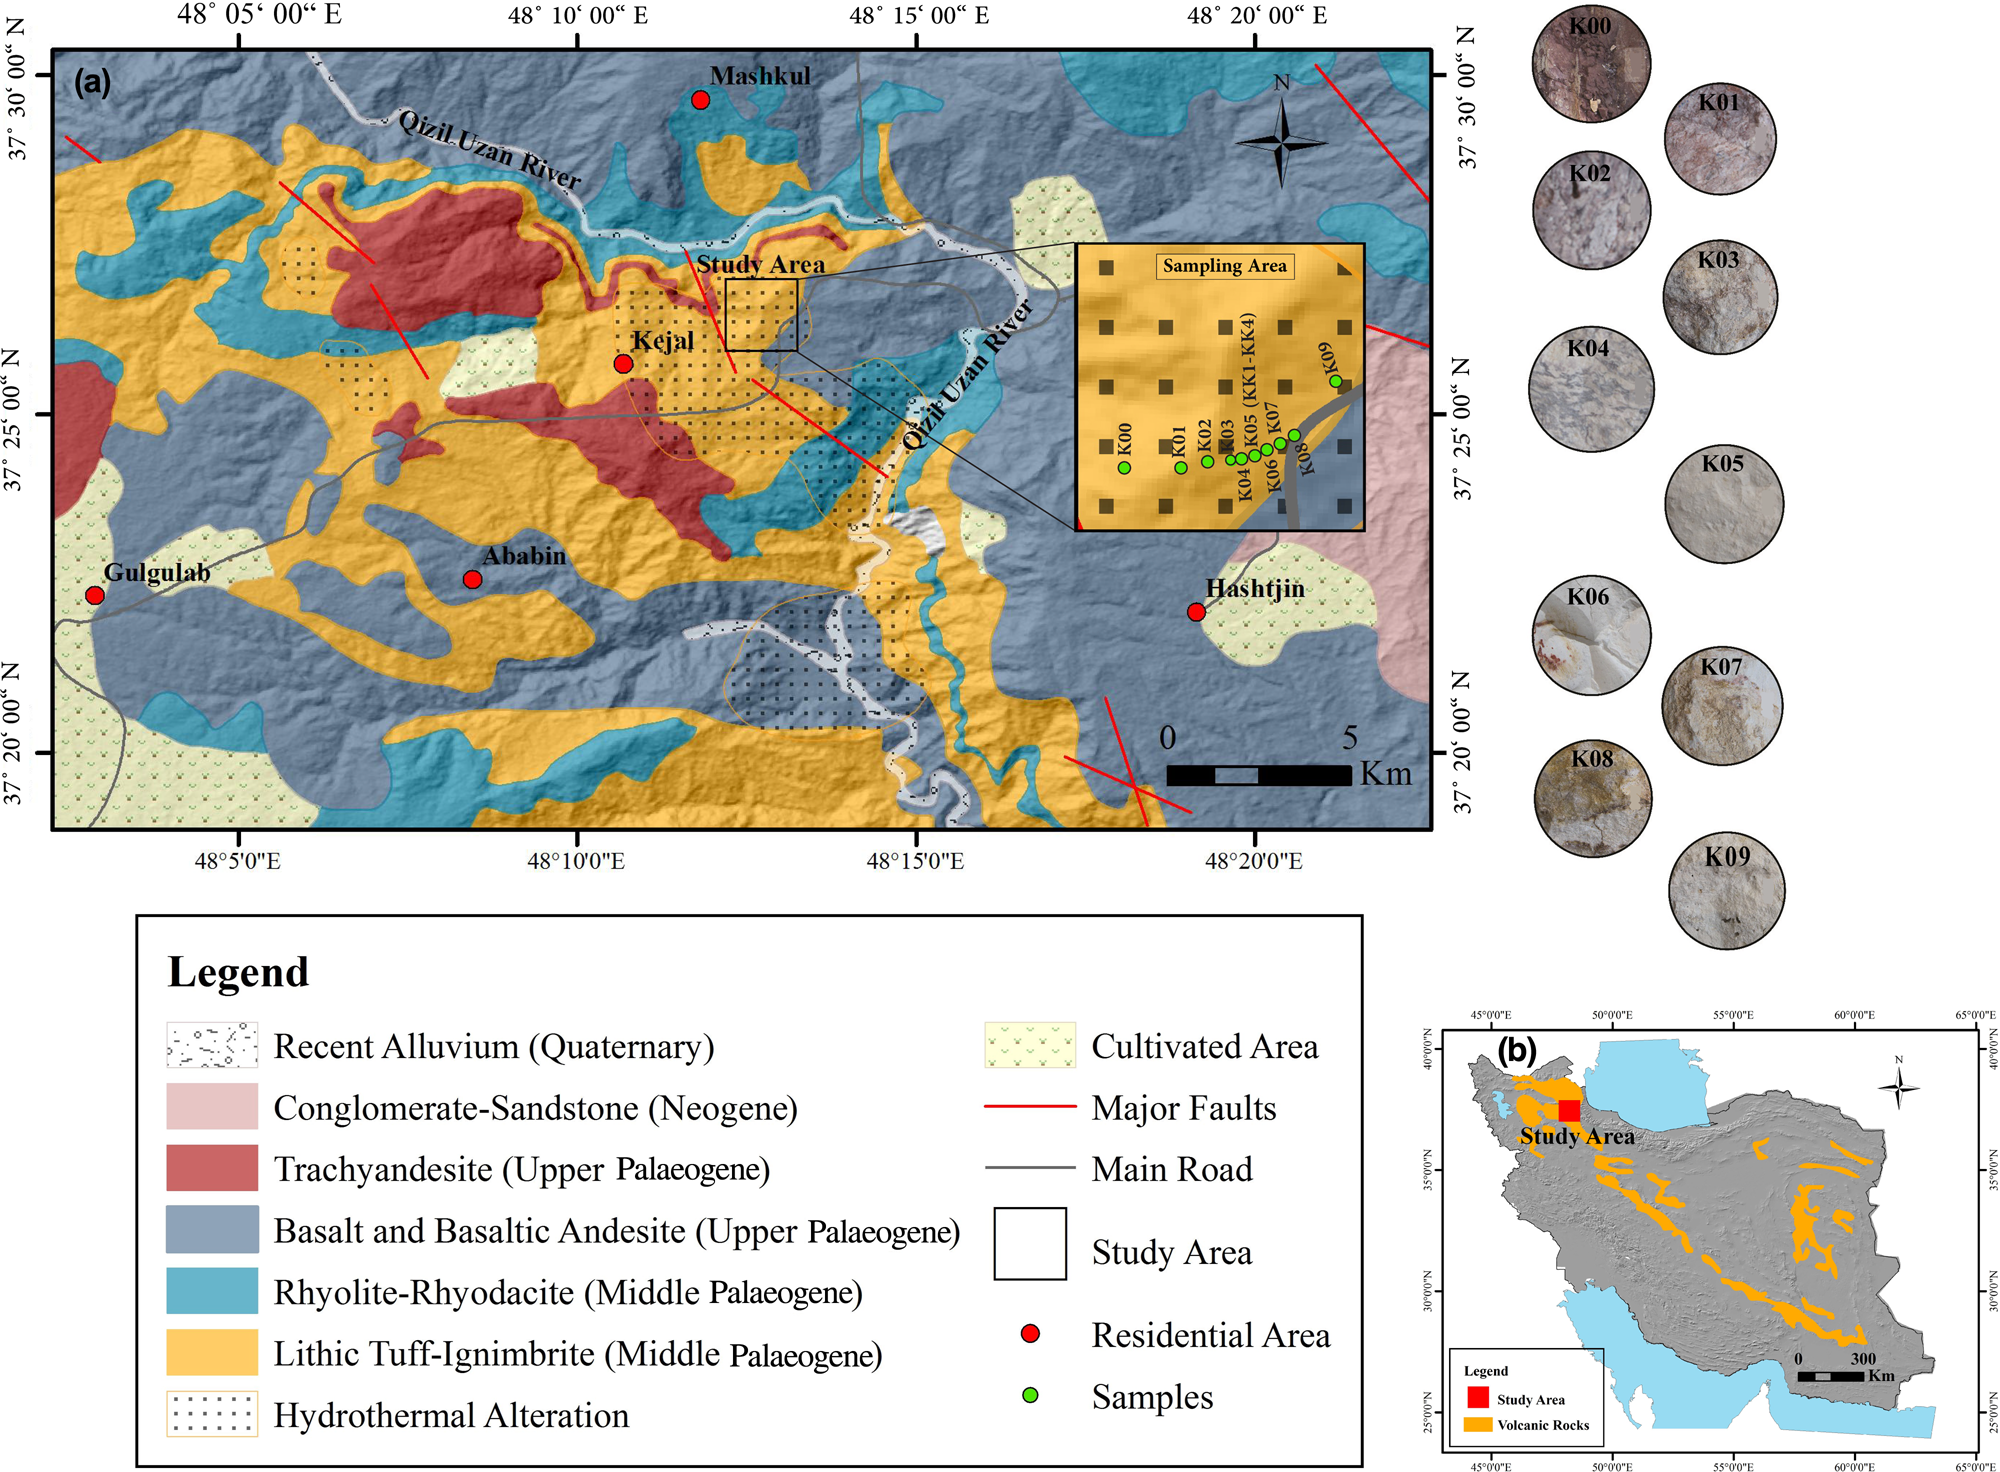
The study area is located 20 km north-west of Hashtjin, north-west Iran (Fig. 2a). The Iranian plateau is considered to form part of the Tertiary magmatic zone of Alborz–Azerbaijan (Stocklin, Reference Stocklin1977; Alavi, Reference Alavi1996). The oldest and youngest lithological units are Carboniferous limestones and Quaternary sediments, respectively. The red Lower Permian sandstones, as well as the Upper Jurassic and Cretaceous deposits, crop out to the north-east of Hashtjin. The Cenozoic deposits occur above an angular unconformity lying over the Palaeozoic and Mesozoic sequences. Eocene volcanics and volcanoclastics were also emplaced discordantly across the underlying rock sequence and formed during the main stage of Cenozoic hydrothermal activity in the area. Oligocene volcanics and volcanoclastics were also deposited discordantly across the area (Fig. 2b).
(a) Location map showing the distribution of volcanic rocks throughout the Iranian plateau and the position of the study area. (b) Geological map of the Hashtjin area showing the main lithological units of the area, geological features and the selected samples of the study area for chemical analyses.
Ignimbrite, trachyandesite and volcanoclastic deposits of Eocene age have been severely altered and kaolin deposits occur in some parts of the study area (Fig. 3a,b). Based on mineralogical and field evidence, the rocks have been affected by argillic alteration with clay mineral assemblages consisting of kaolinite, montmorillonite and palygorskite. The lack of pyrophyllite in this unit indicates that advanced-stage argillic alteration was not reached (Guilbert & Park, Reference Guilbert and Park1986; Barnes, Reference Barnes1997; Hedenquist et al., Reference Hedenquist, Arribas and Gonzalez Urien2000). The massive silicified bodies are present in argillic zones (Fig. 3b), breccia zones (Fig. 3a) and pyroclastic units. The kaolin deposit occurs in massive (Fig. 3a) and vein (Fig. 3c) forms.
Field photographs representing (a) a kaolin body with coatings of iron oxide; (b) a silica layer formed within a band of argillic alteration along a zone of hydrothermal breccia; (c) kaolin formed in fractures and fault zones; and (d) Leisegang structure in the alteration zone representing rhythmic precipitations controlled by fissures and cracks.
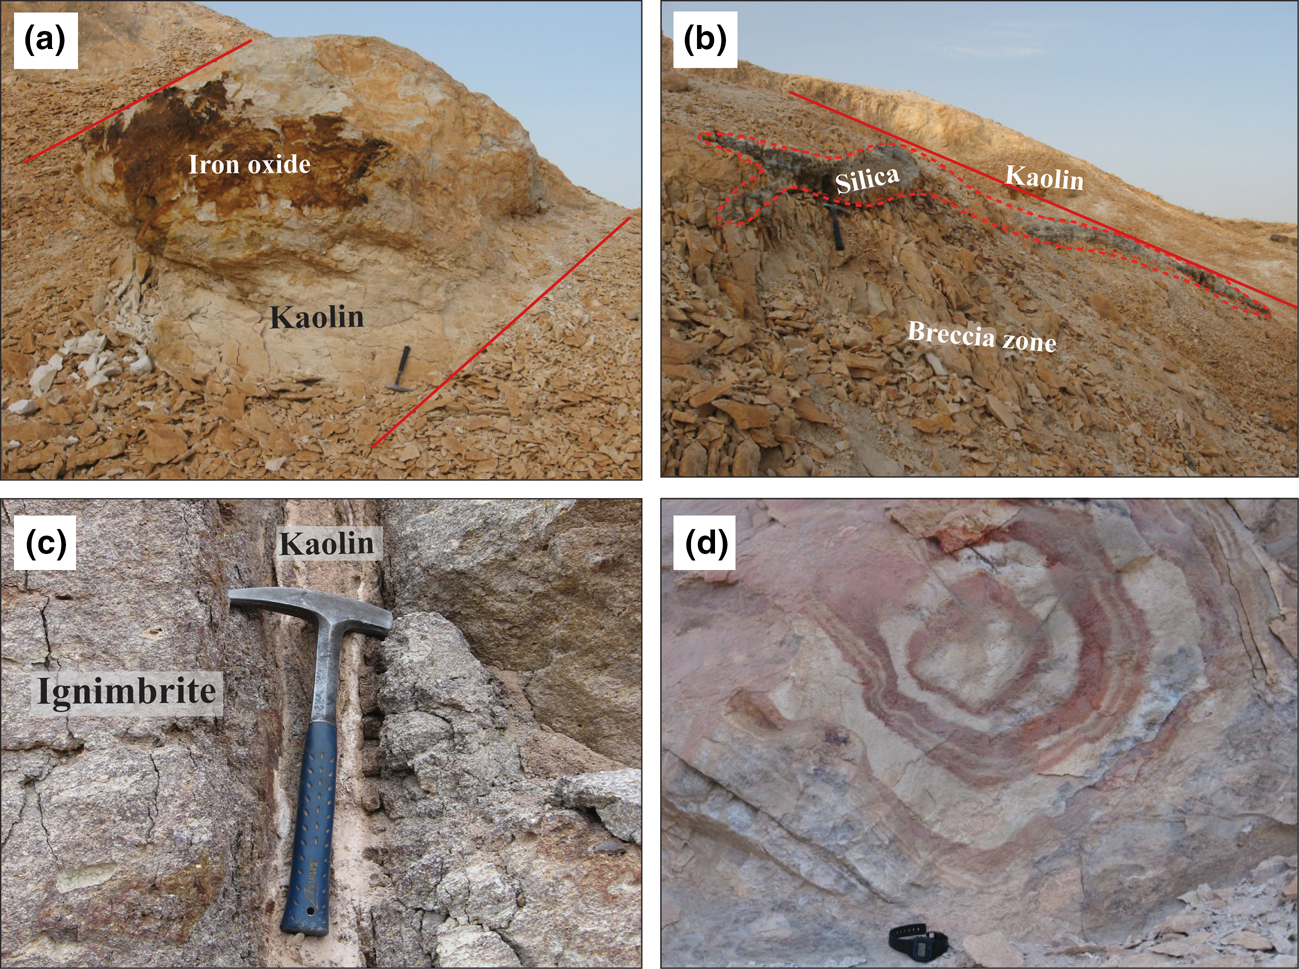
In surface outcrops, iron oxides (Fig. 3a), Leisegang rings (Fig. 3d) and abundant sulfides in some kaolin samples are common geological characteristics of these mineralizations. The occurrence of kaolin veins and the intense alteration of ignimbrite, tuff and trachyandesite along fault and fractured zones (Fig. 3a,c) are suggestive of a hydrothermal origin. There is a lack of any sedimentary ore-related textures such as residual, massive and concretion textures. However, the presence of secondary iron oxides and hydroxides reveals the occurrence of supergene processes in the area.
Due to the presence of pyrite in the volcanic parent rock and the downward flow of fluids, strongly altered units contain extensive Fe-oxide and oxy-hydroxide (goethite and hematite) precipitations.
Materials and methods
Extensive fieldwork, which included field observations, sampling and geological mapping, was carried out in the study area. Representative samples were selected for optical microscopy (OM), X-ray diffraction (XRD), scanning electron microscopy (SEM) and inductively coupled plasma atomic emission and mass spectrometry (ICP-AES and ICP-MS, respectively) analysis. The mineralogy of the samples for partially altered and well-kaolinized samples was determined by XRD with a Philips PW1800 diffractometer (Cu-Kα radiation, 40 kV, 30 mA) in the Kansaran Binaloud Laboratory. Representative samples were analysed in the ALS Chemex Laboratory, Canada, with ICP-AES and ICP-MS used to determine the main, minor and trace elements, as well as the REEs. Loss on ignition (LOI) values were determined from the weight changes before and after the heating of samples at 1000°C for 1 h. Mineral textures were observed by SEM using a VEGA TESCAN-LMU and a FESEM MIRA3 TESCAN-XMU instrument in the Razi Metallurgical Research Center, Iran.
Results and interpretations
Mineralogy
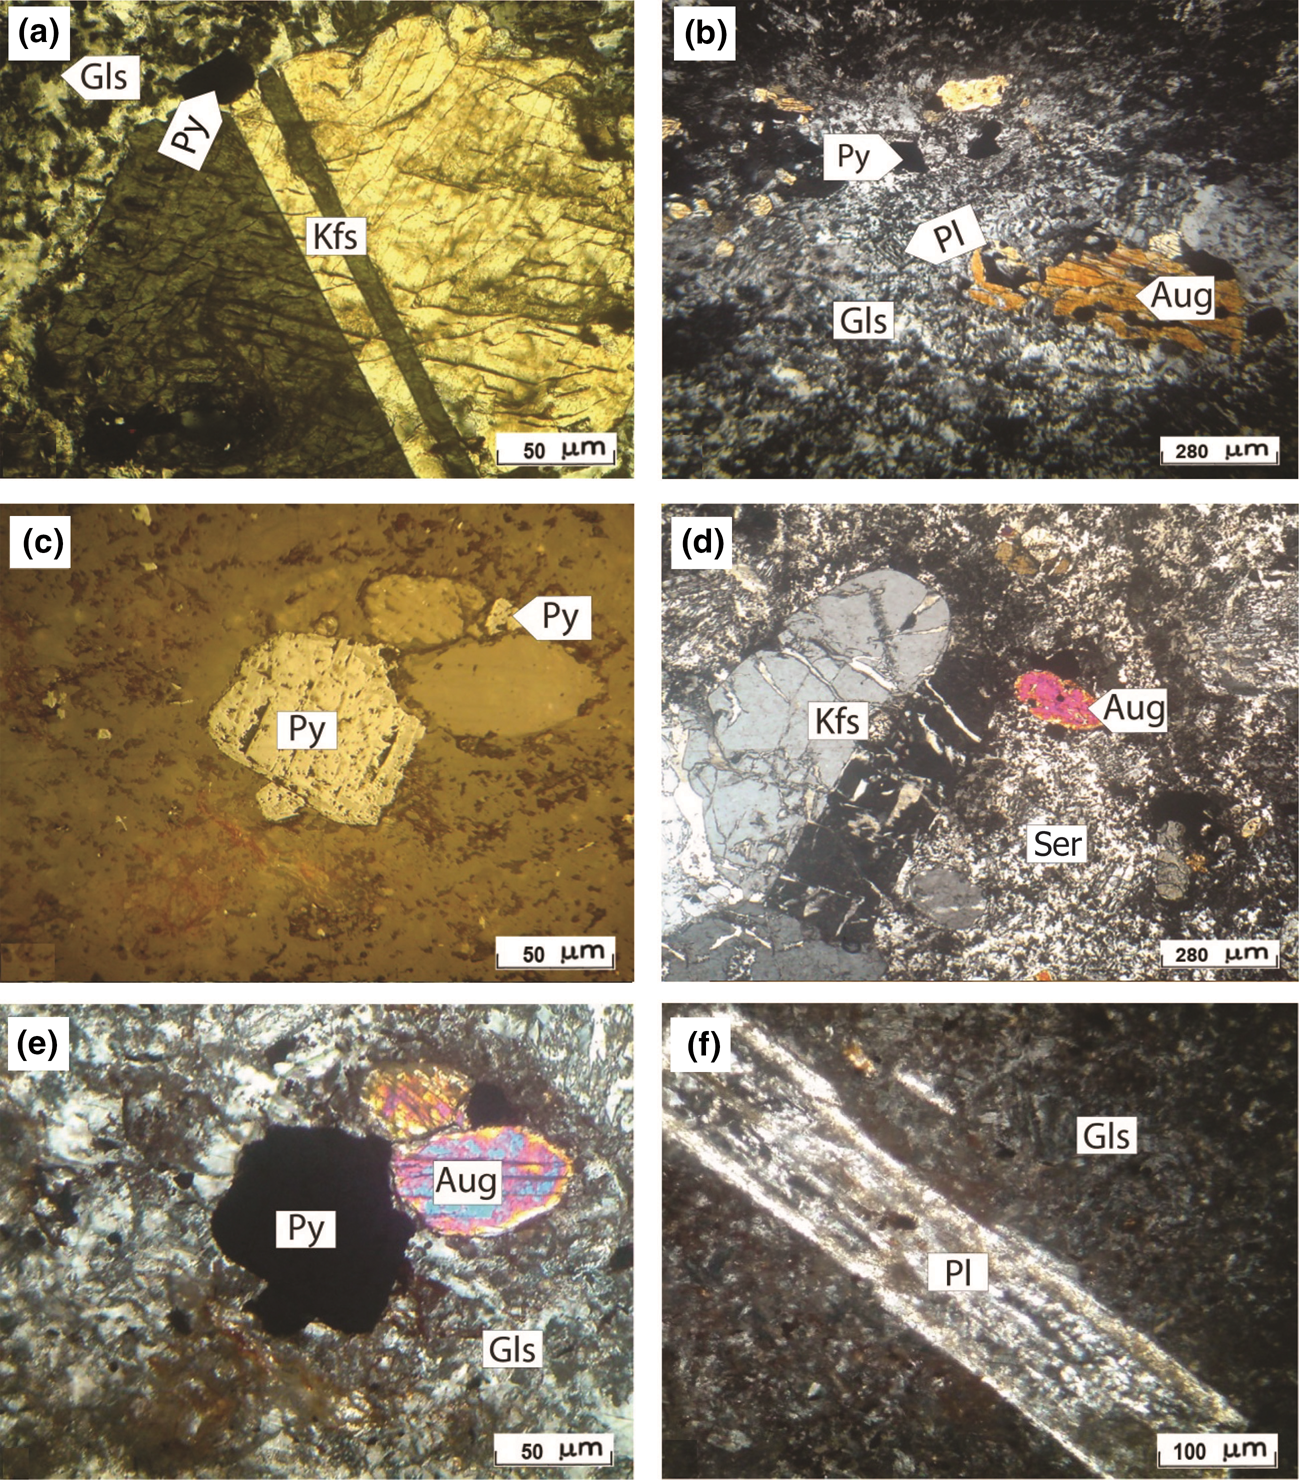
The mineralogy of the volcanic rocks in the study area typically consist of K-feldspar phenocrysts set in a glass matrix (Fig. 4a) that were altered to sericite (Fig. 4d,f). Needle-shaped plagioclase, augite, pyrite, zircon and apatite are also present (Fig. 4b–e). Textures and elemental analyses indicate that the rocks are ignimbrites with a trachyandesitic composition (Masoumi, Reference Masoumi2010). SiO2 polymorphs (quartz and cristobalite) and kaolinite are the main mineral phases of alteration with minor amounts of anatase as a common accessory phase (Fig. 5a,b). Kaolinite occurs as well-crystallized pseudo-hexagonal crystals often forming booklets (Fig. 5c–e). Spherical grains of cristobalite also occur on kaolinite crystal surfaces (Fig. 5f).
Photomicrographs of volcanic rocks from the north-west Hashtjin area. (a) K-feldspar (Kfs) set in a glass matrix (Gls) (ppl). (b) Augite (Aug), plagioclase (Pl) and pyrite (Py) crystals set in glass (xpl). (c) Py crystals in ignimbrite (reflected light). (d) Aug, Kfs and sericite (Ser), the latter of which formed from the decomposition of the Kfs (xpl). (e) Aug and opaque mineral (Py) set in glass. (f) Altered Pl phenocrysts embedded in a glass matrix (xpl). ppl = plane-polarized light; xpl = cross-polarized light)
(a,b) XRD traces of selected samples from fully altered ignimbrites (kaolin) from the study area; kaolinite (Kln), quartz (Qtz), cristobalite (Crs) and anatase (Ant). (c–f) SEM photomicrographs representing the existing minerals: (c,d) pseudohexagonal crystals of Kln forming booklets; (e,f) Kln and Si polymorphs, probably cristobalite (Crs).

Alteration
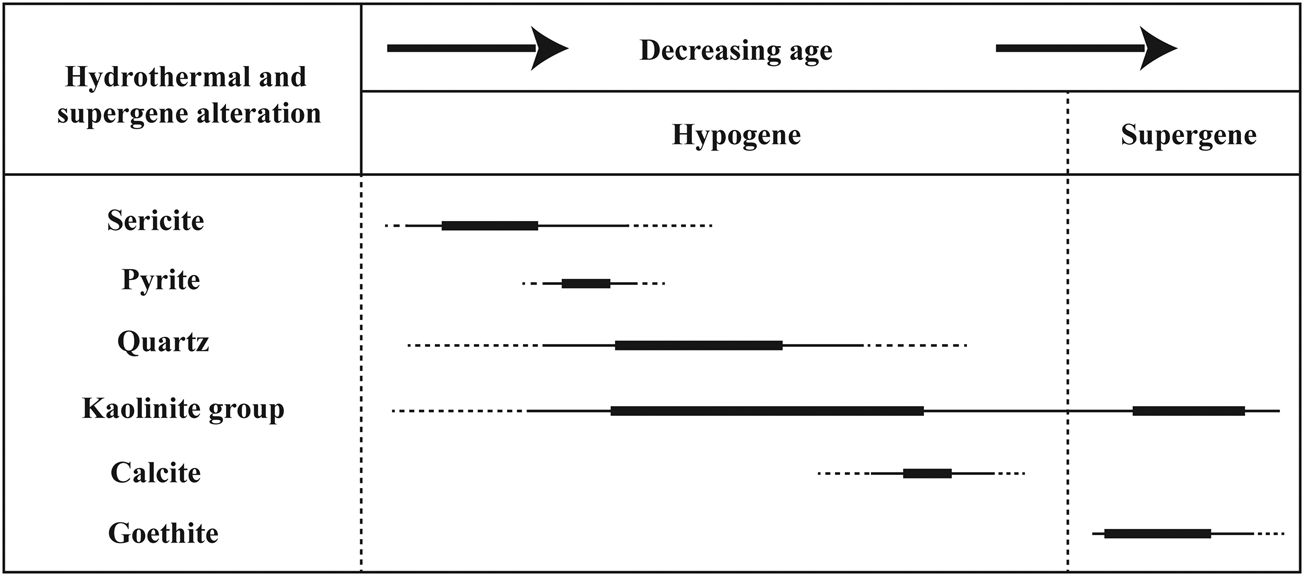
Based on field observations, petrographic examination and XRD analyses, the volcanic rocks suffered two distinct episodes of alteration: (1) hypogene and (2) supergene (Fig. 6). The hypogene alteration may be divided into two stages: (1) early and (2) late. The early stage involved sericitic or hydrolytic alterations accompanied by the formation of pyrite ± sericite ± quartz assemblages disseminated within the host rocks (Fig. 4c,d,f). The late stage comprised argillic alteration accompanied by the formation of a kaolin ± quartz assemblage occurring as veins/veinlets within the host rocks. During hydrolytic alteration, fine-grained sericite originated from the dissolution of K-feldspars in the parent rocks during the circulation of hydrothermal fluids. These acidic fluids leached K+, Na+, Ca2+ and SiO42– from the feldspar minerals, which led to the formation of sericite and secondary quartz. Pyrite also occurs as fine to medium euhedral and subhedral grains, together with primary quartz crystals.
Paragenetic sequences of the ore and gangue minerals in the Hashtjin area.
Argillic alterations accompanied by silicification reactions are common in the Hashtjin area. The argillic units were formed from the decomposition of feldspars to produce clay minerals. Even though there are no boreholes in the area, the outcrops of argillic alteration are exposed in deep valley cuts down to 500 m in depth in the northern part of the study area. The presence of kaolinite in the deeper parts of the hypogene section is accompanied by iron oxides and oxyhydroxides (goethite), which are not present in more surficial parts of the alteration zone.
Silicification occurred in the form of veins, veinlets and massive silica precipitations. Silica veins were formed within pyroclastic units and included pyrite mineralization. In contrast, massive silica bodies, referred to as silica ledges, formed by silicification of the rock and are observed in various parts of the area (Fig. 3b).
The XRD analyses of argillic alterations show kaolinite as the main mineralogical phase, together with quartz, cristobalite and anatase as minor constituents. The formation of kaolin from the hydrolysis of aluminosilicates reflects the acidic nature of the hydrothermal fluid (Montoya & Hemley, Reference Montoya and Hemley1975). From a geochemical point of view, the argillic alteration occurs at relatively low pH levels, high water/rock ratios and when the fluid pH is not in the range of Al mobility (Titley & Beane, Reference Titley and Beane1981).
Progressive argillic alteration under acidic conditions is known to form kaolinite–dickite–alunite assemblages, which result from acid-sulfate waters due to the conversion of H2S into H2SO4 in the vadose zone (Ece et al., Reference Ece, Schroeder, Smilley and Wampler2008; Pirajno, Reference Pirajno2009). However, the lack of alunite and dickite in the study area can be attributed to the low H2S content of the hydrothermal fluid in the environment and the relatively low formation temperature.
The presence of pseudomorphic goethite produced after pyrite in surficial parts of the study area shows the occurrence of a partial supergene zone overprinting the hydrothermal alteration. During the supergene stage, Fe-sulfide minerals such as pyrite reacted with oxygenated waters to produce reactive acid-sulfate waters (Bigham & Nordstrom, Reference Bigham and Nordstrom2000) that played an important role in the alteration of the parent rocks. These supergene acidic fluids led to further alteration and intensified the grade of kaolinization in the parent rock.
Geochemistry
Major and minor elements
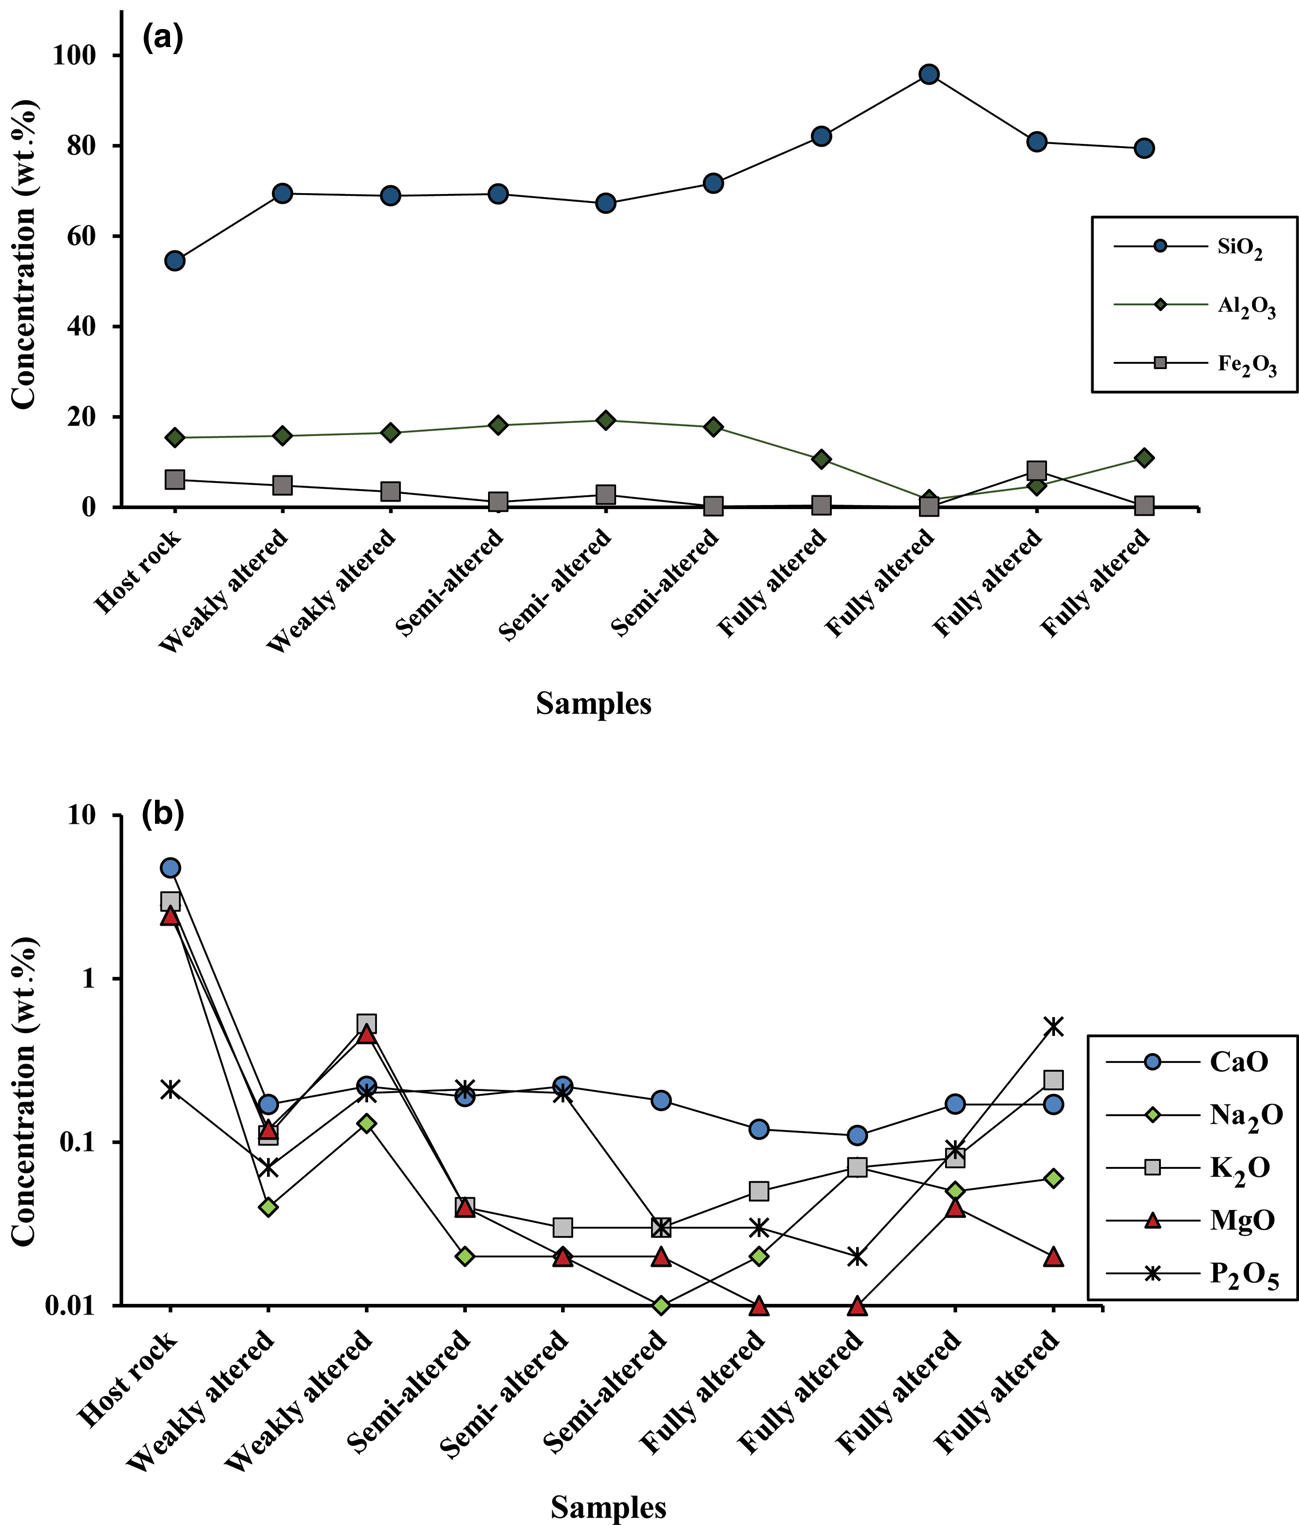
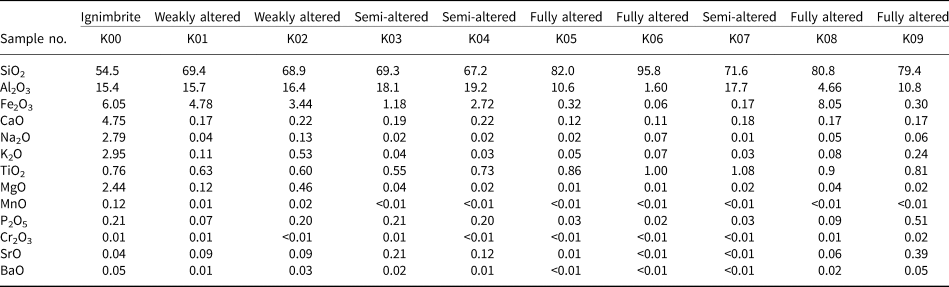
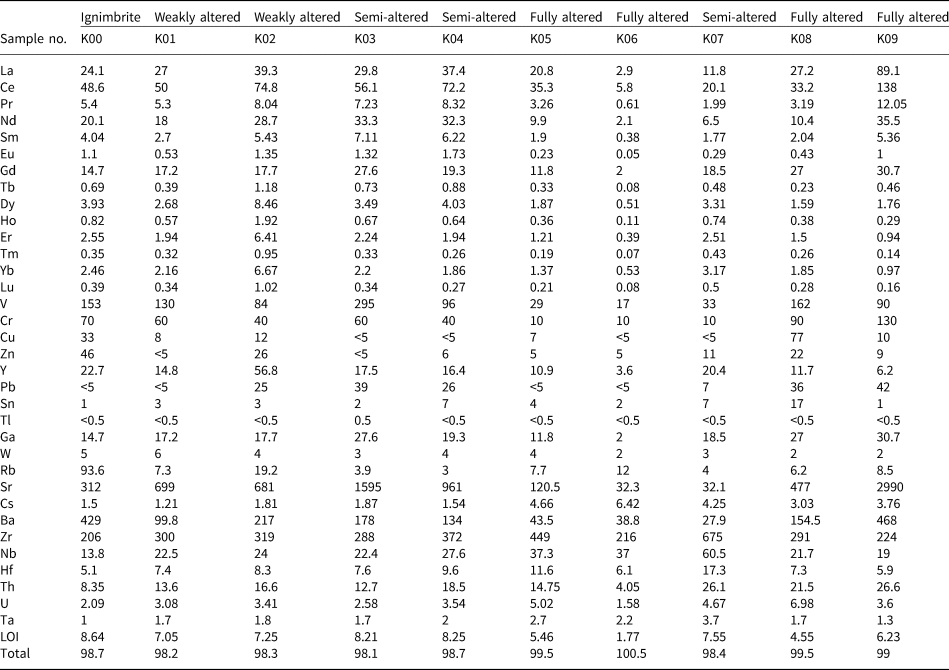
Based on the varying degree of alteration and changes in colour, a range of samples were selected for geochemical study. The intensity of alteration was also determined based on XRD analysis and petrographic evaluations. The pyroclastic host rock consists mainly of SiO2, Al2O3 and Fe2O3 (54.5, 15.0 and 6.05 wt.%, respectively; Table 1). The altered samples are enriched in SiO2 and depleted in Al2O3 and Fe2O3 compared to the parent rocks (73.9, 13.0 and 2.71 wt.% for SiO2, Al2O3 and Fe2O3 respectively; Table 1, Fig. 7a). Alkali and alkaline earth element oxides (CaO, Na2O, MgO and K2O) have been depleted in the altered rocks compared to the host rock (Fig. 7b). The sum of TiO2, P2O5 and MnO in the host rock and argillic unit is ~1 wt.% of the total major oxides (Table 1). The abundances of lithophile and trace elements except for Sr, Zr, Ba and V in the studied samples are <100 ppm (Table 2). Sr, Zr, Ba and V show higher concentrations and are significantly enriched in the argillic zones compared to the rock (Fig. 8a–c). The highly altered samples (K03 and K09) have the highest concentrations of Sr. The Zr/Hf ratio range of 35.4–40.5 is comparable with that of the unaltered ignimbrite. In addition, the Nb/Ta ratio ranges between 12.8 and 16.8.
The concentration values of major oxides in the argillic units of north-west Hashtjin: (a) Al2O3, SiO2 and Fe2O3; (b) CaO, Na2O, MgO, K2O and P2O5.
The concentration values of trace elements in the argillic units of north-west Hashtjin: (a) V and Ba; (b) Zr and Sr; (c) Rb, Th, U, Ga, Nb and Hf.

Major oxide contents (wt.%) of the ignimbritic parent rock and the argillic samples of the north-west Hashtjin area using the ICP-MS method.
The REE and trace element concentrations (ppm) of the ignimbritic parent rock and the argillic samples of the north-west Hashtjin area using the ICP-MS method.
REEs and Y
In the argillic samples, the total REE (ΣREE) values range between 15.6 and 316 ppm, and the highest values correspond to the intensely altered samples (K06 and K09) (Table 2). The light REEs (LREEs; La, Ce, Pr, Nd, Sm, Eu and Gd) are significantly enriched compared to their heavy REE (HREE) counterparts (T, Dy, Ho, Er, Tm, Yb and Lu) (Fig. 9a,b). The ΣREE in the ignimbritic parent rock is 129 ppm, whereas the averages of the LREEs and HREEs in this unit are 11.2 and 119 ppm, respectively.
Chondrite-normalized REE patterns (Anders & Grevesse, Reference Anders and Grevesse1989): (a) from the parent rock of north-west Hashtjin argillic alterations; (b) from argillic alterations of north-west Hashtjin.
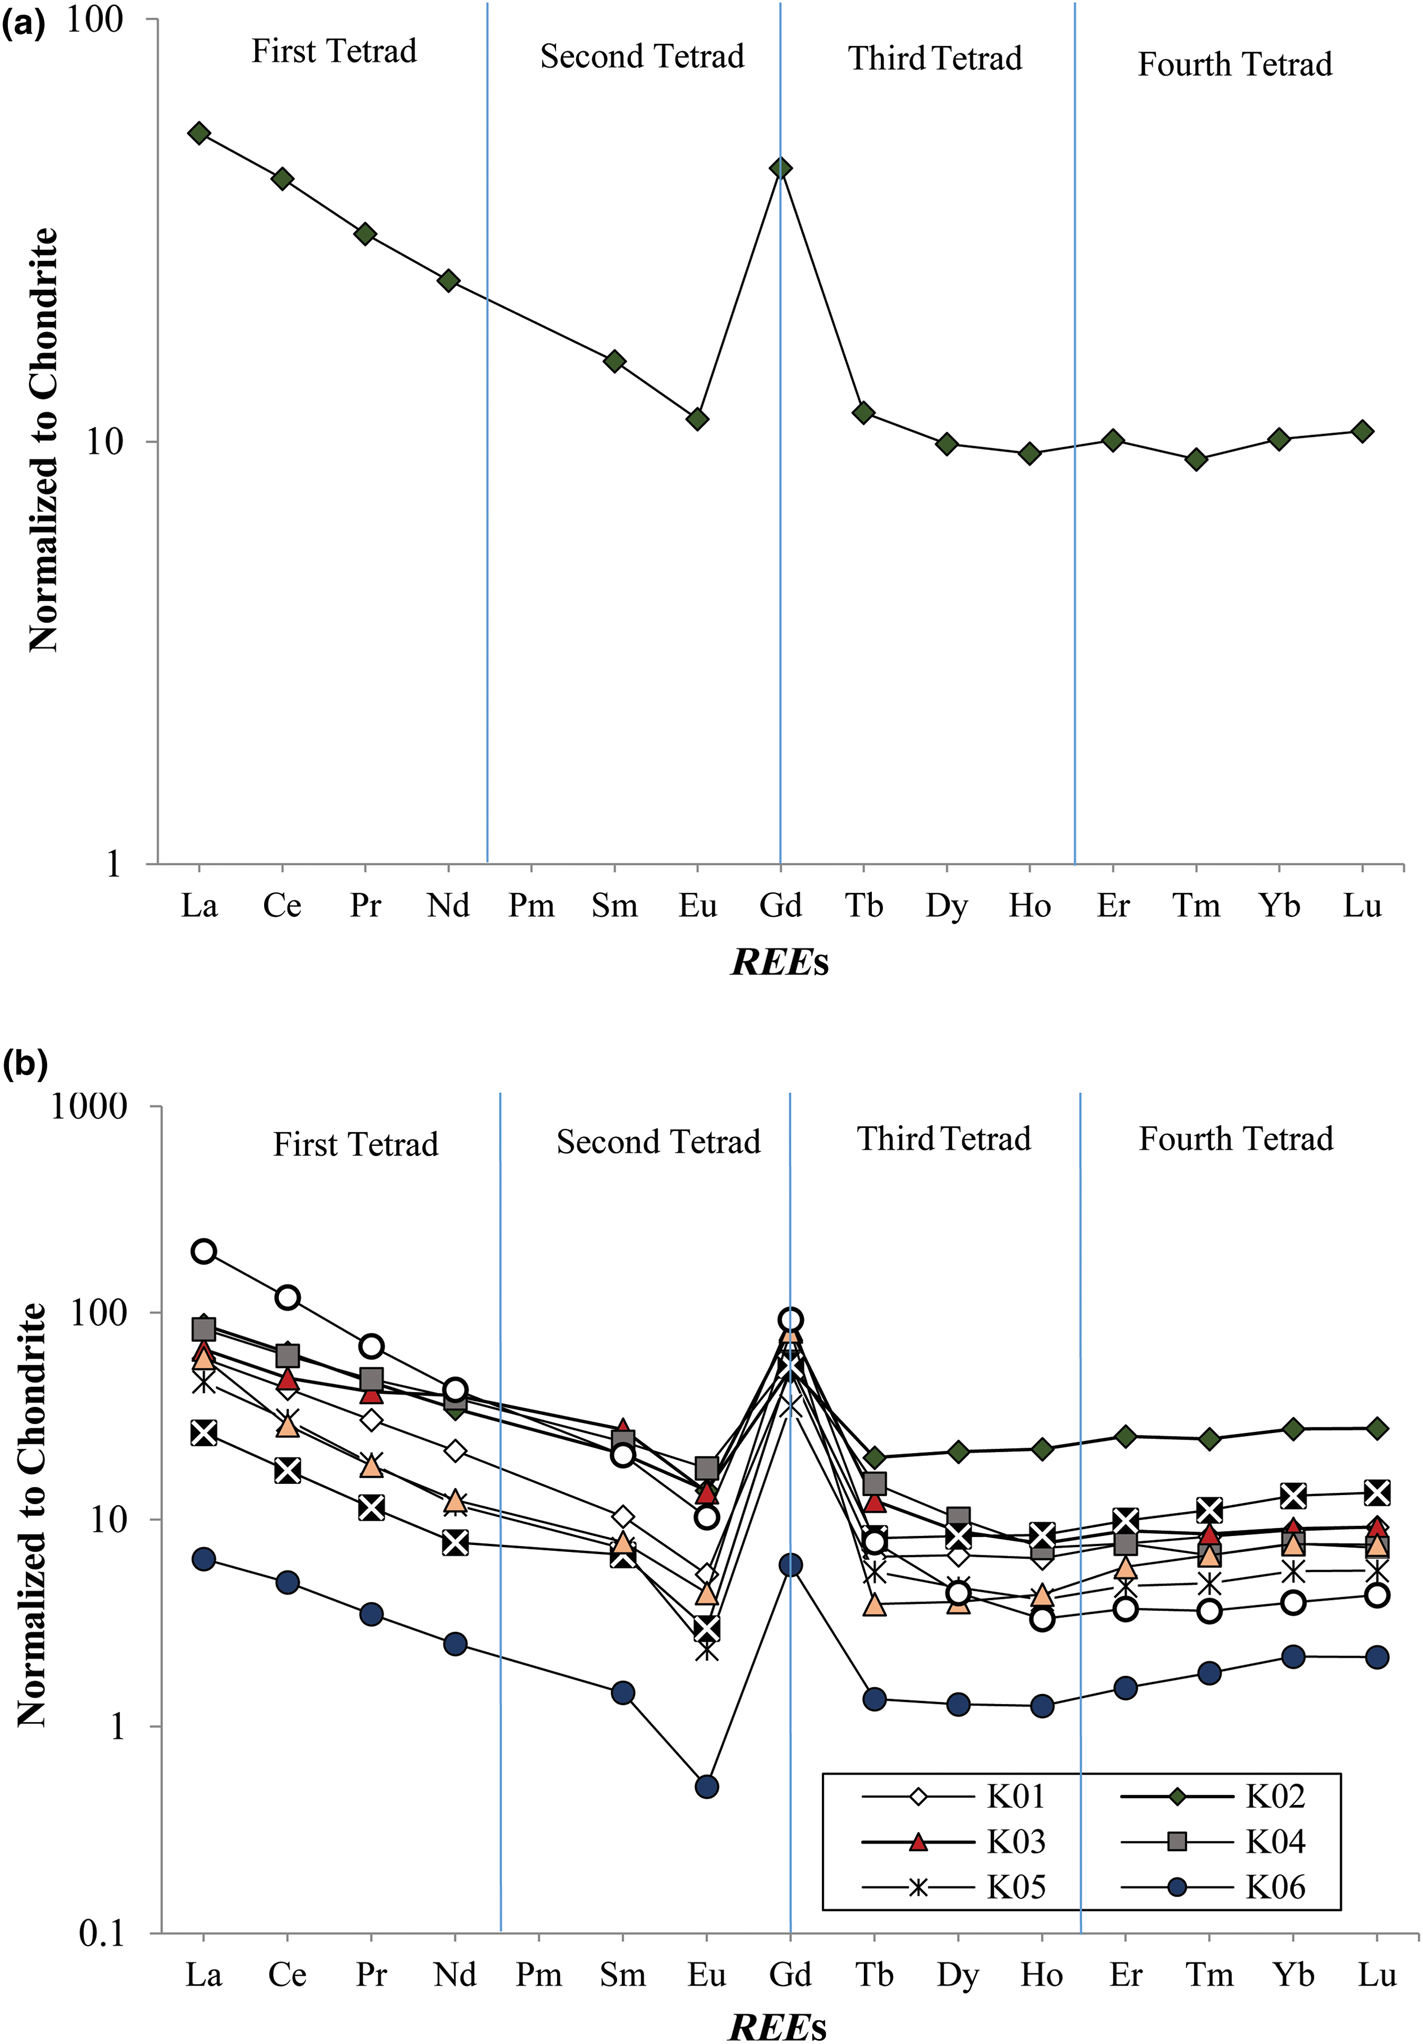
The chondrite-normalized REE patterns of the altered samples and pyroclastic parent rock display fractionation of LREEs over the HREEs and a negative Eu anomaly (Fig. 9a,b). The parameters used to evaluate REE fractionation are (Rollinson, Reference Rollinson1993):
 $$\lpar {{\rm La}/{\rm Yb}} \rpar _{\rm N} = \lpar {\lpar {{\rm L}{\rm a}_{{\rm Sample}}/{\rm L}{\rm a}_{{\rm Chondrite}}} \rpar /\lpar {{\rm Y}{\rm b}_{{\rm Sample}}/{\rm Y}{\rm b}_{{\rm Chondrite}}} \rpar } \rpar $$
 $$\eqalign{ & \lpar {LREE/HREE} \rpar _{\rm N} \cr & \quad = \lpar {{\lpar {LREE/HREE} \rpar }_{{\rm Sample}}} \rpar /\lpar {\lpar {LREE/HREE_{{\rm Chondrite}}} \rpar } \rpar $$
The (La/Yb)N in the altered samples ranges from 2.5 to 62.1 (6.6 in the parent rock) and the (LREE/HREE)N values range between 2.0 and 20.8 (3.6 in the parent rock). In addition, the La/Lu values of the altered samples increase considerably relative to the parent rock (Fig. 9b), suggesting that the LREE content increases in the fully altered samples, while the HREE content remains constant in these samples. Finally, the Y/Ho ratio in the argillic samples varies between 21.4 and 32.7 (28.0 in the host ignimbrite) (Fig. 10), with the lowest values of this ratio corresponding to the intensely altered samples. The Ce and Eu anomalies were estimated using the approaches of Taylor & McLenan (Reference Taylor and McLennan1985) and Bau & Dulski (Reference Bau and Dulski1996).
 $${\rm Eu}/{\rm Eu}^\ast{ }= \lpar {{\rm E}{\rm u}_{\rm N}} \rpar /\surd \lpar {\lpar {{\rm S}{\rm m}_{\rm N}} \rpar \times \lpar {{\rm G}{\rm d}_{\rm N}} \rpar } \rpar \,\,\,\lpar {{\rm Taylor}\ \& \ {\rm McLenan}\comma \;1985} \rpar $$
 $${\rm Ce}/{\rm Ce}^\ast{ } = \lpar {{\rm Ce}/\lpar {0.5{\rm La} + 0.5{\rm Pr}} \rpar } \rpar _{\rm N}\,\,\,\lpar {\rm Bau} \ \& \ {\rm Dulski}\comma \;1996\rpar $$
The variation in the Zr/Hf, Y/Ho and Nb/Ta ratios in north-west Hashtjin argillic alterations and their ignimbritic host rock.

The Ce anomaly in the altered samples varies between 0.71 and 0.98 (0.96 in the host ignimbrites), and the Eu anomaly ranges from 0.15 to 0.48 (0.43 in the host ignimbrites).
Discussion
Types of alteration contributing to kaolinization
Three main indicators have been used to determine the type of alteration responsible for kaolinization of the lithological units of the study area. TiO2 was considered as the first geochemical indicator to estimate the origin of the fluids. The investigations conducted revealed that TiO2 contents of <1 wt.% represent the hypogene kaolin and TiO2 contents of >1 wt.% represent a supergene origin of the fluids (Maiza et al., Reference Maiza, Pieroni, Marfil, Dominguez, Mas and Cravero2003). With respect to the TiO2 values of the studied samples obtained (0.55–1.10 wt.%) (Table 1), both hypogene and supergene fluids have clearly affected the kaolinization of the ignimbritic parent rock in the area.
Br + Sr and Ce + Y + La concentrations also provide information on the nature of the fluid–rock interactions giving rise to the studied kaolin deposits. The binary plot of Br + Sr vs Ce + Y + La for the analysed samples reveals the effects of both supergene and hypogene fluids in the formation of the studied kaolins (Fig. 11a). The high values of Br + Sr are related to hypogene kaolin deposits, whereas Ce + Y + La contents indicate a supergene origin (Dill et al., Reference Dill, Bosse, Henning, Fricke and Ahrendt1997).
The position of the studied samples in the binary diagram: (a) Br + Sr vs Ce + Y + La; (b) Ti + Fe vs Ce + Nb (Dill et al., Reference Dill, Bosse, Henning, Fricke and Ahrendt1997).
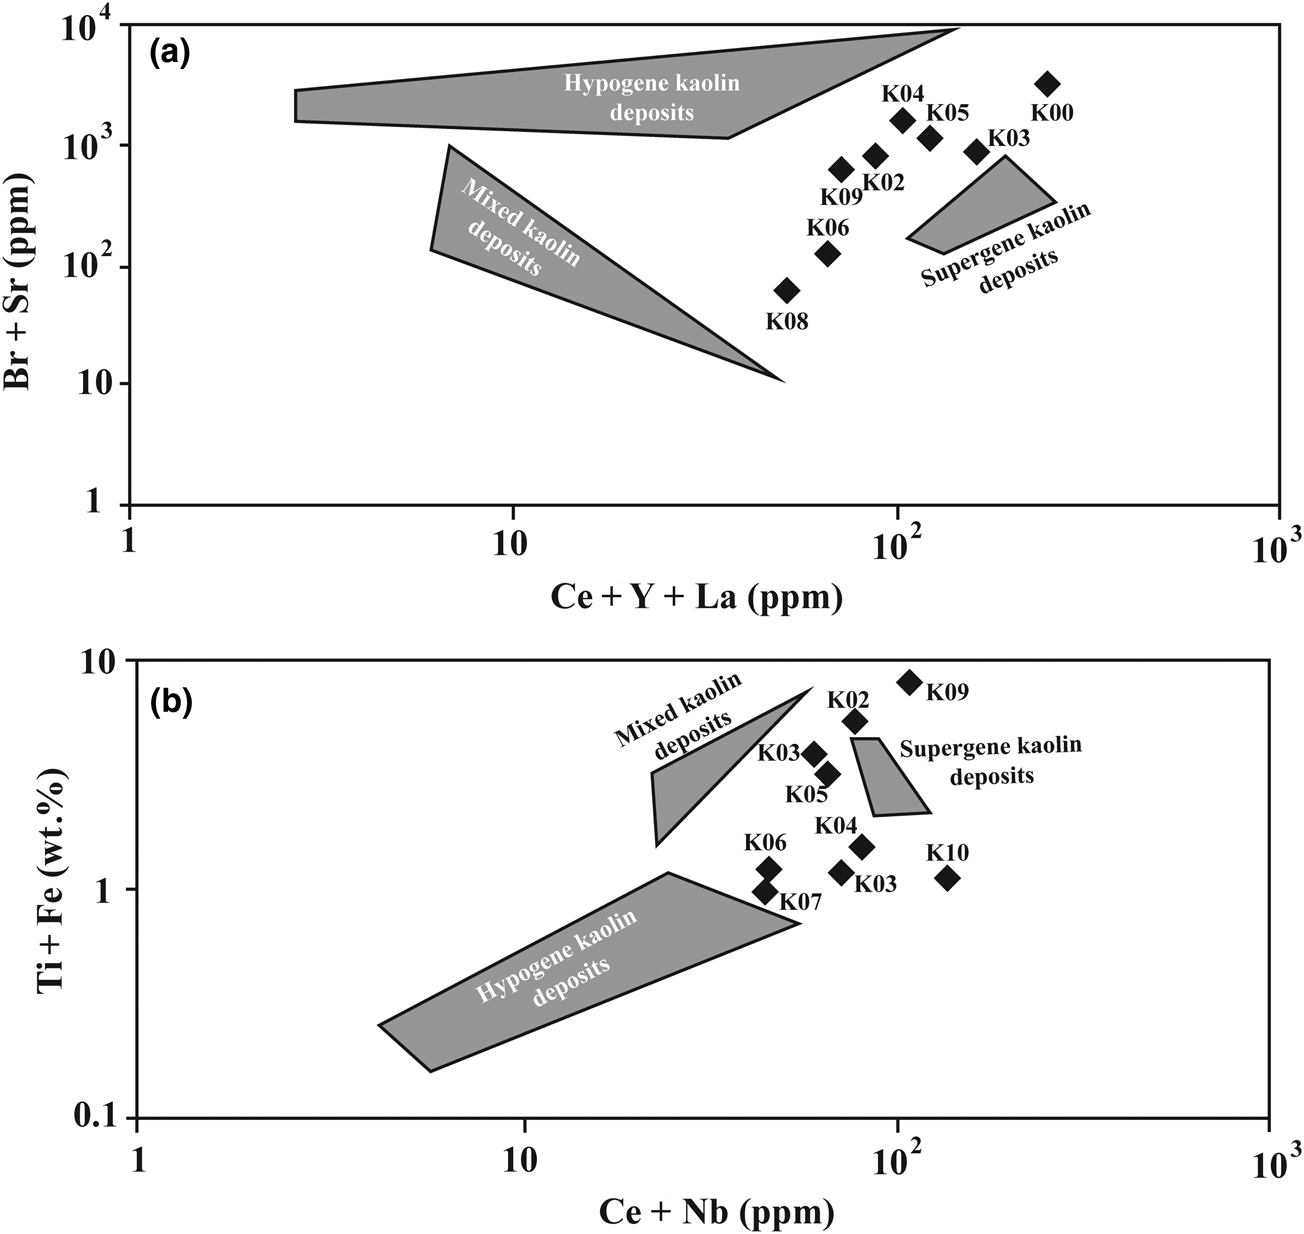
The third characteristic used in this study is represented by the concentrations of Ti + Fe and Ce + Nb, whereby high contents also support a supergene origin (Dill et al., Reference Dill, Bosse, Henning, Fricke and Ahrendt1997). The Ti + Fe vs Ce + Nb plot for the studied samples also confirms the role of both hypogene and supergene fluids in the formation of the studied kaolin samples (Fig. 11b).
Fluid–rock interactions and REE patterns
Figure 9 displays the REE patterns of argillic samples and the host rock of the study area normalized to the chondrite composition (Anders & Grevesse, Reference Anders and Grevesse1989). The parent pyroclastic rock is enriched in LREEs and has a La/Lu ratio of 5.1, whereas, in the argillic unit, an enrichment of LREEs relative to HREEs is observed, with a La/Lu ratio of 2.2–27.6 and a tetrad effect of T3 and T4.
The fractionation of LREEs from HREEs in the altered samples is known to occur in acidic pH, especially at the pH ranges below 5.1 (Leybourne et al., Reference Leybourne, Peter, Layton-Matthews, Volsky and Boyle2006). In general, REEs form complexes with SO42– at low pH. The (La/Yb)N and (LREE/HREE)N values of the pyroclastics in the study area suggest that the pH of the hydrothermal fluids varied due to the presence of SO42– produced by hypogene processes, and these changes might be considered as a reason for the fractionation of the REEs. The REE ions, except for Ce and Eu, are stable in their trivalent states, and thus they have similar physicochemical characteristics. Additional oxidation states are possible for Ce and Eu (Rollinson, Reference Rollinson1993), which may affect their fractionation ratios. Eu can appear as Eu2+, which replaces Ca2+ in plagioclase or can be oxidized to Eu3+ during alteration at low temperatures (e.g. ~100°C) in an oxidizing environment (Sverjensky, Reference Sverjensky1984). In addition, the relatively negative Eu anomaly (0.15–0.48) in the altered pyroclastics of the Hashtjin area may represent fractional crystallization of the magma and separation of plagioclase (Lackschewitz et al., Reference Lackschewitz, Singer, Botz, Garbe-Schobnberg and Stoffers2000). Cerium may also appear as Ce4+, and the fractionation of this element depends on the redox conditions. Ce4+ is less mobile than the remaining REE 3+, causing a Ce anomaly during the REE 3+ partitioning between fluid and solid. A negative Ce anomaly has been observed in authigenic clays, hydrothermal deposits, nanofossil ooze and fish debris (Plank & Langmuir, Reference Plank and Langmuir1998; Picard et al., Reference Picard, Lécuyer, Barrat, Garcia, Dromart and Sheppard2002; Moiroud et al., Reference Moiroud, Pucéat, Donnadieu, Bayon, Guiraud and Voigt2016). In the present study, the weak negative Ce anomaly (0.72–1.00) in the argillic samples of the Hashtjin area is probably related to supergene alteration. The high coefficient of determination between Eu/Eu* and Mn and between Ce/Ce* and Mn (r 2 = 1) suggests that these elements are controlled by Mn-oxide minerals formed under oxidizing conditions (Amakawa, Reference Amakawa1991; Bau et al., Reference Bau, Schmidt, Koschinsky, Hein, Kuhn and Usui2014).
The parent volcanic rocks of the Hashtjin area have Y/Ho ratios that are comparable to chondrite and show CHARAC behaviour. In contrast, the Y/Ho ratios of samples affected by argillic alteration show weak non-chondrite behaviour of REEs (Fig. 12). The altered samples plot out of the CHARAC area and towards the field of hydrothermal fluids in the plot of Y/Ho vs Zr/Hf (Fig. 12), suggesting the interaction of fluids and volcanic rocks. The adsorption of Ho by Mn-oxides and the fractionation of Y and Ho during the alteration probably caused the weak non-chondrite behaviour of the Y/Ho ratio. This behaviour is consistent with the high coefficient of determination of Ho with MnO (r 2 = 0.96) in ten of the samples.
The Zr/Hf–Y/Ho diagram (Bau, Reference Bau1996) representing the plot of altered units and their pyroclastic parent rock of the north-west Hashtjin area.

The tetrad effect
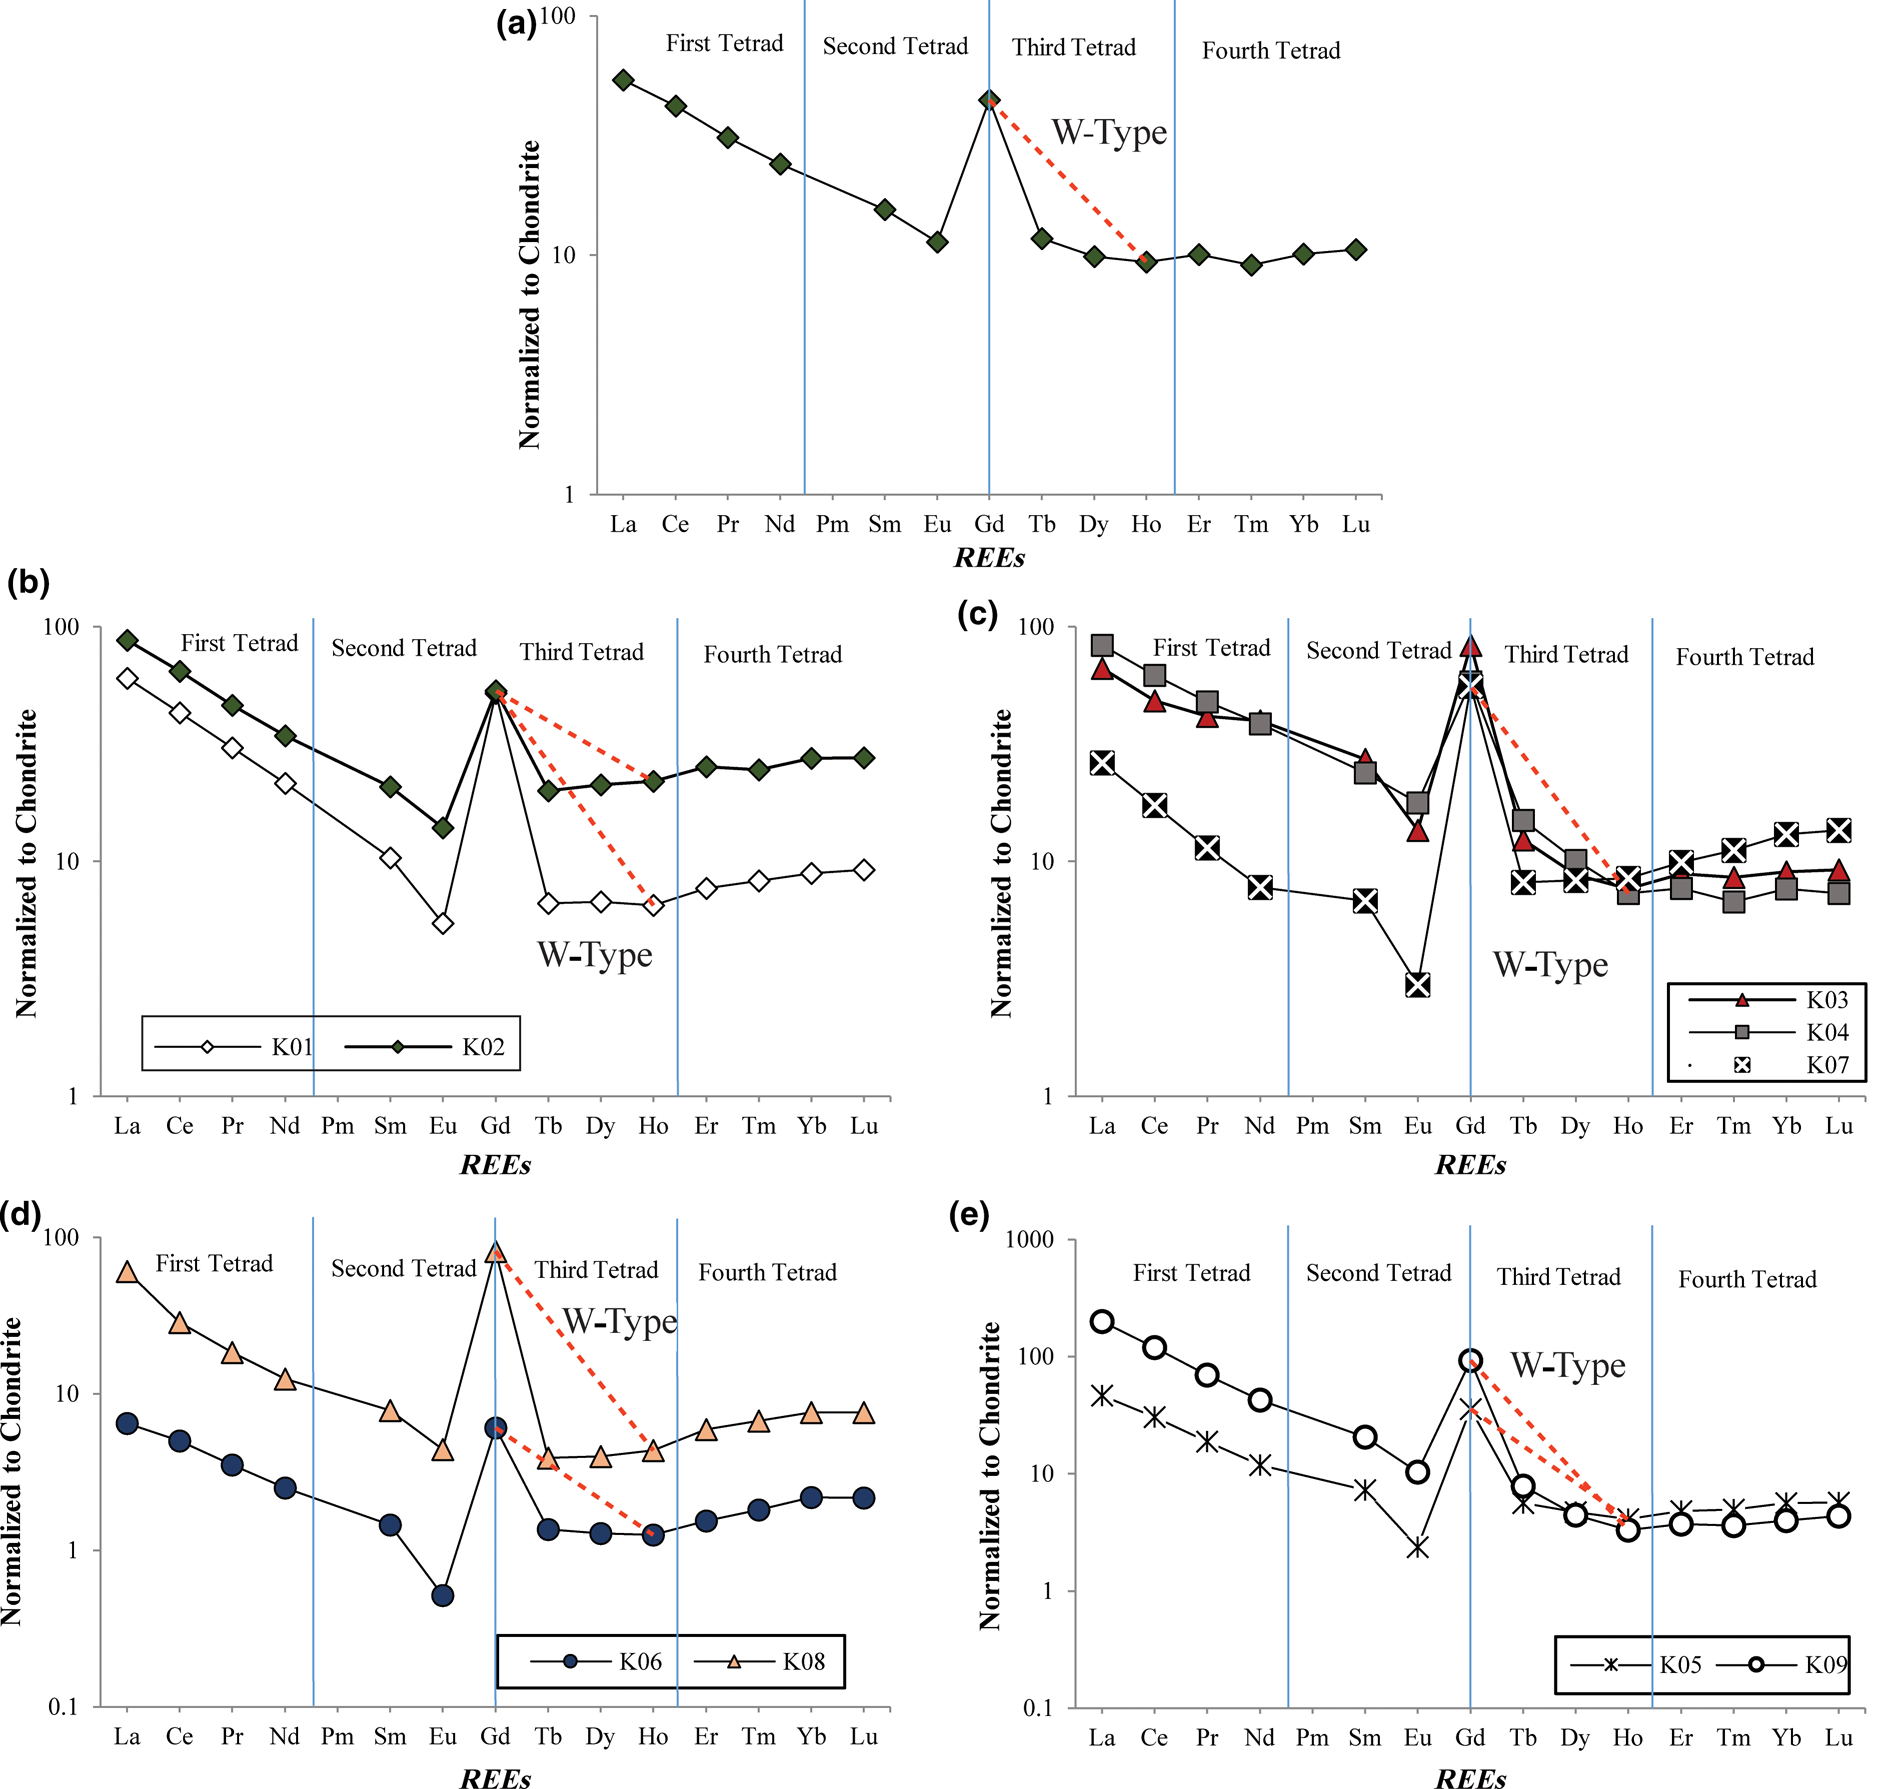
Table 3 displays the calculated values of T3 and T4 for the parent rock and the altered samples in the study area. Figure 13a–e shows chondrite-normalized REE diagrams for the volcanoclastic parent rock and the semi-altered and fully altered argillic (kaolin) samples. The third and fourth tetrad effects are observable in the parent rock and the third tetrad has the form of a W-type tetrad (Fig. 14a), which is attributed to a positive Gd anomaly. Gd and Tb positive anomalies are commonly observed in seawaters (De Baar et al., Reference De Baar, Bacon, Brewer and Bruland1985) and are related to the fractionation of Gd/Tb due to the change of the f4 half-filled electron shell (De Baar et al., Reference De Baar, Bacon, Brewer and Bruland1985). It is probable that the emplacement of pyroclastics in a marine environment and the interaction with seawater gave rise to the Gd anomaly. This explains the occurrence of the tetrad effect in the ignimbritic parent rock, which was subsequently enhanced by hypogene hydrothermal alteration.
REE patterns of the studied samples normalized to chondrite (Anders & Grevesse, Reference Anders and Grevesse1989) and separated based on the degree of alteration, showing the type of tetrad effect: (a) ignimbritic precursor rock; (b) weakly altered ignimbrite; (c) semi-altered ignimbrite; (d) altered ignimbrite; (e) fully altered ignimbrite (kaolin).
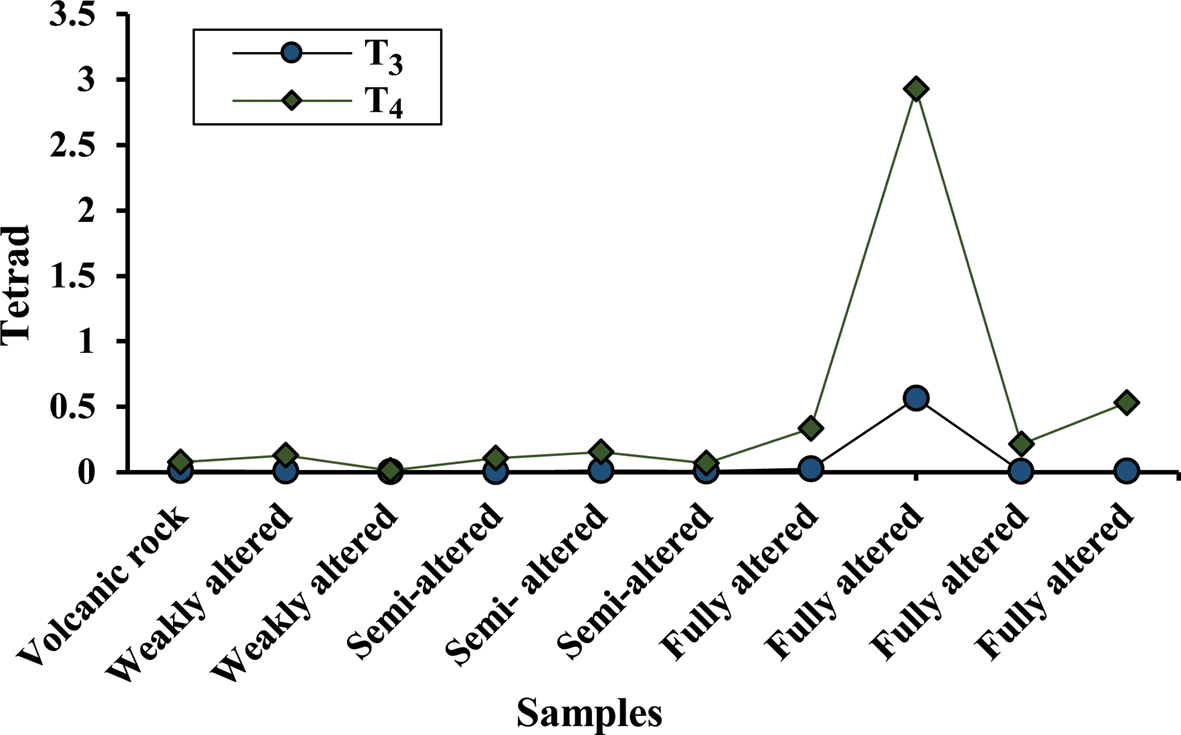
T3 and T4 distribution patterns in the studied samples.
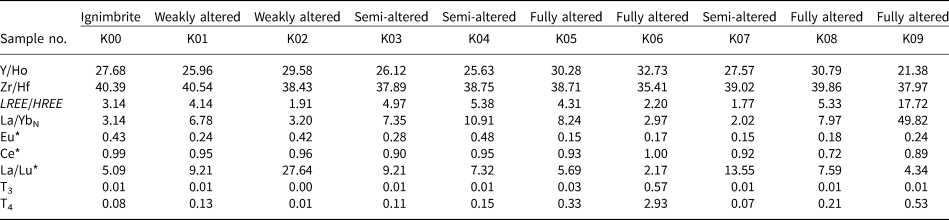
The calculated values of Y/Ho, Zr/Hf, LREE/HREE, La/YbN, Eu*, Ce*, La/Lu*, T3 and T4 for the studied samples.
The altered samples show a W-type effect in the third tetrad (Fig 13b–e). In the W-type tetrad, the Dy and Yb appear in descending order, whereas Er appears in the ascending trend (Masuda et al., Reference Masuda, Kawakami, Dohmoto and Takenaka1987). The values of the third and fourth tetrads are 0.01–0.50 and 0.01–2.90, respectively. Comparing the tetrad effects between the fully altered sample (K06) and parent ignimbrite (Fig. 14) indicates that the hydrothermal alteration of the parent rock gives rise to more pronounced fourth tetrad effects. The wide range of tetrad effects may result from surface weathering (Masuda & Akagi, Reference Masuda and Akagi1989; Mioduski, Reference Mioduski1997). The presence of good correlation between the sizes of the tetrads and the intensity of alteration (Fig. 14) also suggests that this may have occurred due to the interaction of hydrothermal fluids with the parent rock.
The origin of the tetrad effect in the argillic pyroclastics of the Hashtjin area
The extensive argillic alteration zones in the pyroclastics of the Hashtjin area are attributed to the circulation of acid sulfate-rich fluids, which originated as hydrothermal fluids in the hypogene zone and were subsequently overprinted with the oxidation of pyrite in the supergene zone. From a geochemical point of view, the argillic alteration occurred under relatively low-pH conditions and high water/rock ratios (Titley & Beane, Reference Titley and Beane1981). Such alteration is usually developed when the fluid pH is not in the range of Al mobility, with kaolinite precipitation in the argillic zone indicating that the pH decreased to ~4.5 under supergene conditions (Dill et al., Reference Dill, Dohrmann, Kaufhold and Cicek2015).
These acid fluids altered the aluminosilicate minerals of the precursor rocks. In brittle and fractured zones, the advanced argillic alteration formed white kaolin bodies (Fig. 3c). The weak W-type tetrad effect in the chondrite-normalized samples probably resulted from posterior hydrothermal activity (Monecke et al., Reference Monecke, Dulski and Kempe2007). The intensity of the T4 effect was enhanced with the increasing degree of alteration at higher water/rock ratios in the supergene zone.
The weak non-chondrite behaviour of Y and Ho in the altered samples and the lack of a good correlation between T3 and T4, as well as the low Y/Ho ratio, imply that the weak fractionation of Y from Ho probably occurred under supergene conditions. The variation in the Y/Ho ratio (21.4–32.7) in the alteration zone indicates that this ratio lies near the CHARAC field (Bau, Reference Bau1996).
The evaluation of chondrite-normalized patterns indicates a weak tetrad effect in the logarithmic diagram (Fig. 12). Geochemical processes such as adsorption, fractionation of mineral phases, fluid–rock interactions and REE complexation are the most important factors controlling the tetrad effects in geochemical systems (Bau, Reference Bau1996; Censi et al., Reference Censi, Sprovieri, Saiano, Di Geronimo, Larocca and Placenti2007). During hydrothermal alteration, HREEs may be leached and removed by acidic fluids due to the decomposition of HREE-bearing mineral phases (Takahashi et al., Reference Takahashi, Tada and Shimizu2004). During the interaction of acidic solutions with the host rock, ligands such as SO42– and Cl– are consumed because of the increase in the pH of the solution. Hence, highly acidic hydrothermal fluids are considered to generate large tetrad effect values (Abedini et al., Reference Abedini, Rezaei Azizi and Dill2020). Such solutions probably produced the intermediate argillic alterations observed in the Hashtjin area, as is supported by the formation of kaolinite and goethite-bearing assemblages (Dill et al., Reference Dill, Dohrmann, Kaufhold and Cicek2015).
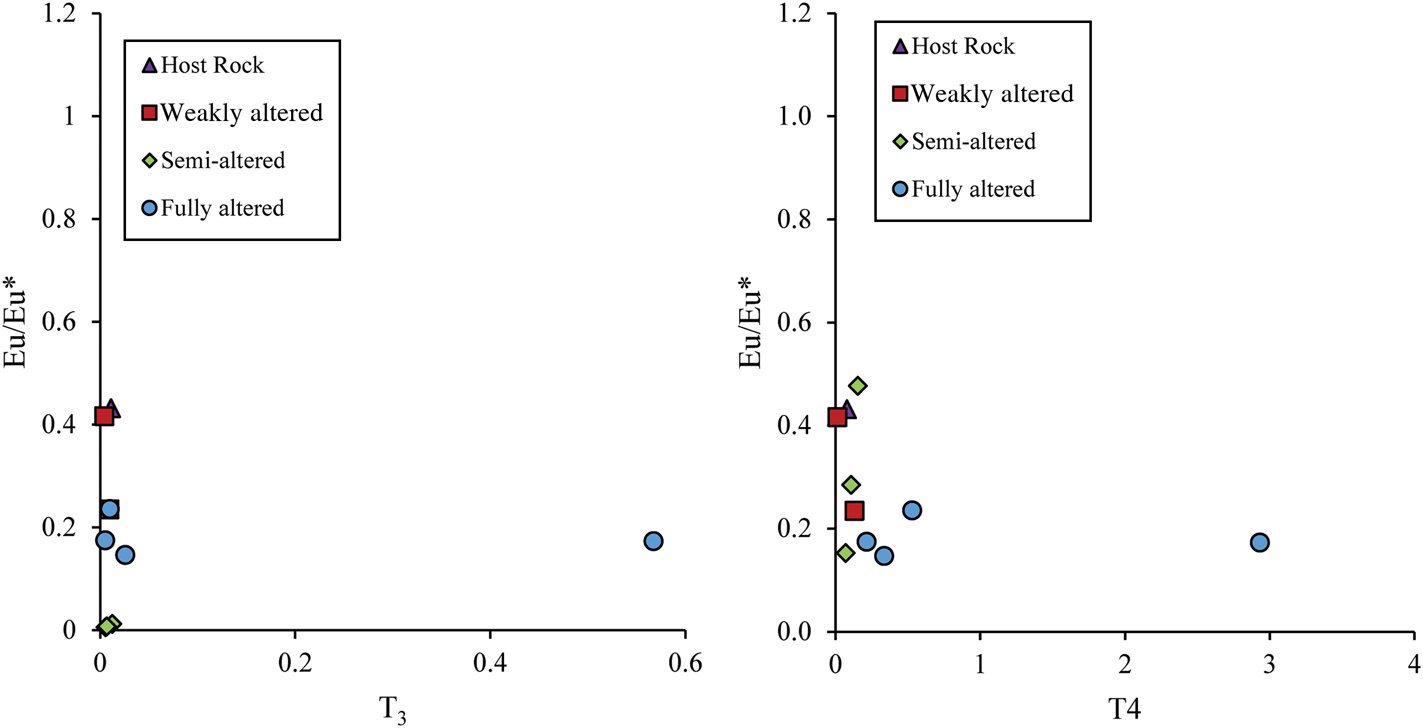
The fractionation of Eu with a tetrad effect from the remaining elements of the group (Sm and Gd) would lead to the reduction of any Eu anomalies (Feng, Reference Feng2010), and the projection of T3 and T4 vs Eu/Eu* (Fig. 15a,b) shows that this ratio increased only slightly with the increase of the tetrad effect. On the other hand, the weak correlation between T3 and Ce/Ce* in the altered samples is associated with the behaviour of Ce, with a weak anomaly reflecting the redox conditions of hypogene fluids during formation that can be attributed to relatively low oxygen fugacity conditions (Cravero et al., Reference Cravero, Cravero and Iglesias2001).
Binary plots showing Eu/Eu* vs (a) T3 and (b) T4.
Conclusions
This study of the argillic alteration in the north-west Hashtjin area in north-west Iran led to the following conclusions:
• The pyroclastic precursor rocks (ignimbrites) have been affected by intense hydrothermal and supergene alterations, which have caused noticeable variation in the concentrations of chemical elements. The high SiO2 contents in the altered units represent secondary silicification processes that occurred after argillic alteration and kaolinization.
• The CaO, Na2O, MgO and K2O were considerably depleted during alteration and therefore are considered to have been mobile. In contrast, Sr, Zr and Ba were significantly less mobile and enriched compared with the ignimbritic parent rock.
• The chondrite-normalized REE patterns show an enrichment of LREEs over HREEs. The (La/Yb)N values and LREE/HREE ratios of the altered samples are considerably higher compared to the original ignimbrites, suggesting fractionation between LREEs and HREEs.
• The values obtained for Eu/Eu* and Ce/Ce* in the argillic units indicate a weak negative Ce anomaly, attributed to the circulation of oxidizing acidic hydrothermal fluids and a negative Eu anomaly probably related to leaching of Eu from plagioclase during the hydrothermal alteration.
• The kaolinized samples have similar Y/Ho variation patterns, whereas the parent rock shows various ratios and only weak non-CHARAC behaviour. On the other hand, the Y/Ho and Zr/Hf ratios of the kaolinized samples plot towards the hydrothermal fluid area of the Y/Ho–Zr/Hf discrimination diagram. The weak non-chondrite behaviour of the Y/Ho ratio is probably related to the fractionation of Y and Ho during the supergene process and adsorption of Ho by Mn-oxides.
• Type T3 and T4 tetrads are present in the studied samples. The observed fourth tetrad might represent a W-type third tetrad. The generated tetrad in T3 might be due to the high positive anomaly of Gd in the studied samples.
• The W-type tetrad effect produced is attributed to water–rock interactions under the influence of hydrothermal activity.
Acknowledgements
The authors express their appreciation to the reviewers for their technical comments which enhanced the quality of the paper.
Financial support
Thanks go to the authorities of the Research Bureau of the University of Tabriz for providing financial support for this research project.


