


1. Introduction
1.1 Recent New Zealand glacier monitoring
Glaciers are a key part of the global climate monitoring network (Zemp and others, Reference Zemp2013) and they provide one type of essential climate variable as defined by the World Meteorological Organization. Yet glaciers are difficult and expensive to measure directly because they tend to cover broad areas within inhospitable and remote alpine terrain. As a result, only a relatively small number (~100 annual observations) of directly measured mass-balance records in the world are reported (WGMS, 2020, 2021), and only two in New Zealand (Purdie and others, Reference Purdie2015; Cullen and others, Reference Cullen2017). One of few glacier variables that can be captured remotely is the equilibrium line altitude (ELA), which on temperate alpine glaciers can be approximated by the elevation of the snowline measured at the end of summer.
A low-altitude (~3000 m a.s.l.) aerial photograph survey of Southern Alps/Kā Tiritiri o te Moana (referred to as Southern Alps in this work) was initiated by Trevor J.H. Chinn (1937–2018) during the late 1970s to document the interannual variability of Aotearoa New Zealand's snowline and glaciers (Chinn and Whitehouse, Reference Chinn and Whitehouse1980; Chinn, Reference Chinn1999, Reference Chinn2001; Chinn and others, Reference Chinn, Fitzharris, Willsman and Salinger2012). Termed the end of summer snowline (EOSS) survey, the aerial photography programme has captured the history of more than 50 glaciers spanning >400 km length of the Southern Alps (Fig. 1). This initiative has continued for more than four decades and it now forms a fundamental long-term cryosphere observation dataset for New Zealand. The snowline survey was also launched in conjunction with a comprehensive inventory of New Zealand's glaciers (Chinn and others, Reference Chinn, Kargel, Leonard, Haritashya and Pleasants2014), with the aim to catalogue and understand the scale of frozen water resources and the role that ice plays in hydrology and the water cycle (Chinn, Reference Chinn2001).
South Island of New Zealand showing locations of the EOSS index glaciers by region (black-filled circles are index glaciers that did not qualify for inclusion in this study based on data completeness thresholds). The geopolitical regions each index glacier is associated with and some of their basic information are ascribed in Table 1. Airports: ZQN – Queenstown; CHC – Christchurch; WEL – Wellington. Locations of climate data: MIL – Milford Sound; REF – Reefton; HOK – Hokitika; ARP – Arthur's Pass. Base map materials are courtesy of Land Information New Zealand.

Snowline and glacier observations gathered during the annual EOSS survey are obtained in March over a multi-day weather window typified by strong high-pressure synoptic systems. The EOSS photographs are analysed and synthesised into a summary report (e.g. Willsman and Macara, Reference Willsman and Macara2019) that describes essential statistics for specific index glaciers and commentary about the seasonal climate conditions that occurred during the austral glacier hydrological year (April to March).
Index glacier snowline elevations, glacier length and glacier area are documented during the EOSS survey, with some metrics from selected index glaciers reported to the World Glacier Monitoring Service (Ohmura, Reference Ohmura2009). These observations provide an independent dataset that contrasts in perspective and spatial resolution from more common remotely sensed glacier observations (e.g. Global Land Ice Measurements from Space; Kargel and others, Reference Kargel, Leonard, Bishop, Kääb and Raup2014), and help to fulfil national and international reporting for New Zealand's snow and ice (Zemp and others, Reference Zemp2020; Griffiths and others, Reference Griffiths2021). Several researchers have utilised the EOSS photograph dataset for glaciology, climatology, ecology and palaeoclimate research (Lorrey and others, Reference Lorrey2014; Sirguey and others, Reference Sirguey2016; Salinger and others, Reference Salinger2019; Chinn and Chinn, Reference Chinn and Chinn2020).
1.2 Previous interpretations and applications of the EOSS record
Glaciers integrate annual mass-balance variations over periods spanning years to decades (Haeberli and others, Reference Haeberli, Frauenfelder, Hoelzle and Maisch1999; Braithwaite, Reference Braithwaite2002; Zemp and others, Reference Zemp, Hoelzle and Haeberli2009; WGMS, 2013). Temperate mid-latitude end of summer snowline elevations provide a proxy for the ELA (Meier, Reference Meier1962; Braithwaite, Reference Braithwaite1984; Chinn and others, Reference Chinn, Heydenrych and Salinger2005; Rabatel and others, Reference Rabatel2017) that separates negative and positive mass-balance zones on a glacier. Systematic changes in mass balance for an individual glacier or network of glaciers can be reflected by a change in the mean ELA position (WGMS, 2021). Thus, a change in the long-term ELA from a historic datum captured by EOSS photographs can be used to inform on climatic processes that also impact glaciers.
New Zealand climate–glacier relationships, including a particular focus on terminus positions and the seasonal sensitivity of glaciers to climate, have been long debated (Suggate, Reference Suggate1950; Soons, Reference Soons1971; Hessell, Reference Hessell1983; Salinger and others, Reference Salinger, Heine and Burrows1983; Gellatly and Norton, Reference Gellatly and Norton1984; Brazier and others, Reference Brazier, Owens, Soons and Sturman1992; Anderson and Mackintosh, Reference Anderson and Mackintosh2006). The EOSS survey captures a snapshot of the conditions that influence mass-balance gains or losses (Chinn and others, Reference Chinn, Fitzharris, Willsman and Salinger2012). Recent investigations using glacier energy-balance model simulations reinforce this assertion, and affirm strong connections exist between the ELA, mass balance and surface climate (Mackintosh and others, Reference Mackintosh2017).
1.3 Aims
In this study, EOSS photographs spanning four decades are used to generate a representative record of Southern Alps snowline variability. That record is then used to clarify understanding of the relationship between climate and New Zealand glacier change. By developing a new reference snowline series, we set the stage to combine EOSS data with contemporary in situ and remotely sensed mass-balance observations as a way to estimate ice volume changes through time. The ongoing value of the contemporary EOSS survey of glaciers and snowlines will be demonstrated in this investigation, and commentary is provided about the value of this resource for evaluating interannual and long-term cryosphere changes in the discussion.
2. Data
2.1 Southern Alps snowline elevations
Data for Southern Alps index glaciers, which have been monitored since 1977, were obtained from the most recently published NIWA EOSS report (1977–2020; Willsman and Macara, Reference Willsman and Macara2022). The EOSS index glacier dataset formerly extended from Kaikōura (in southeast Marlborough) to southern Fiordland, but the survey flight is now restricted to sites between northern Fiordland and north Canterbury due to ice loss at northern and southern sites in recent years. Monitoring glacier snowlines captures an index glacier set (Chinn, Reference Chinn2001; Chinn and others, Reference Chinn, Fitzharris, Willsman and Salinger2012), resulting in an inventory that also includes changes in area and terminus position. EOSS glaciers range from very small, single-catchment glaciers with short response times (see Chinn, Reference Chinn2001) to large glaciers with feeder tributaries and debris-covered ice that terminate in a proglacial lake (e.g. Haupapa/Tasman Glacier).
The EOSS survey uses aerial photography to quantify the mean elevation of the austral summer snowline for each index glacier at the end of each mass-balance year (Fig. 2). Most of the EOSS survey dataset has achieved 80% or greater temporal coverage for each index glacier since 1977 (Table 1). The previously established Southern Alps historic snowline datum, termed ELA0, is a specific elevation that has been calculated for each index glacier in the EOSS dataset based on a majority of measurements since 1977. This multi-year average position was defined by Clare and others (Reference Clare, Fitzharris, Chinn and Salinger2002) as a steady-state variable relative to which snowline elevation variability could be compared each year. Chinn and others (Reference Chinn, Heydenrych and Salinger2005) refined the calculation of ELA0 for each index glacier based on correlation analysis and linear regression adjustments with the regional mean snowline elevation, termed ELAAlps. That method relies on the assumption that ELA changes throughout the Southern Alps behave as a single climatic unit (Clare and others, Reference Clare, Fitzharris, Chinn and Salinger2002; Chinn and others, Reference Chinn, Heydenrych and Salinger2005), which has been recently challenged by Dowson and others, (Reference Dowson, Sirguey and Cullen2020). As the EOSS survey observations have grown beyond a 30 year climatological period, it is apparent that the steady-state assumption for the historical ELA0 is no longer applicable. Therefore, in this study we introduce a new snowline datum defined as a climatological ELA (termed ELAm) that is calculated over a fixed 30 year interval when snowline observation density is highest across all sites in the index glacier dataset. The method for ascribing absolute snowline elevations from photographs (previously described in Chinn and others, Reference Chinn, Fitzharris, Willsman and Salinger2012) is outlined in the NIWA EOSS reports and discussed in more detail in Dowson and others (Reference Dowson, Sirguey and Cullen2020). We have not re-evaluated the previously established snowline elevation data in this study, but revisit this aspect in a discussion of future work.
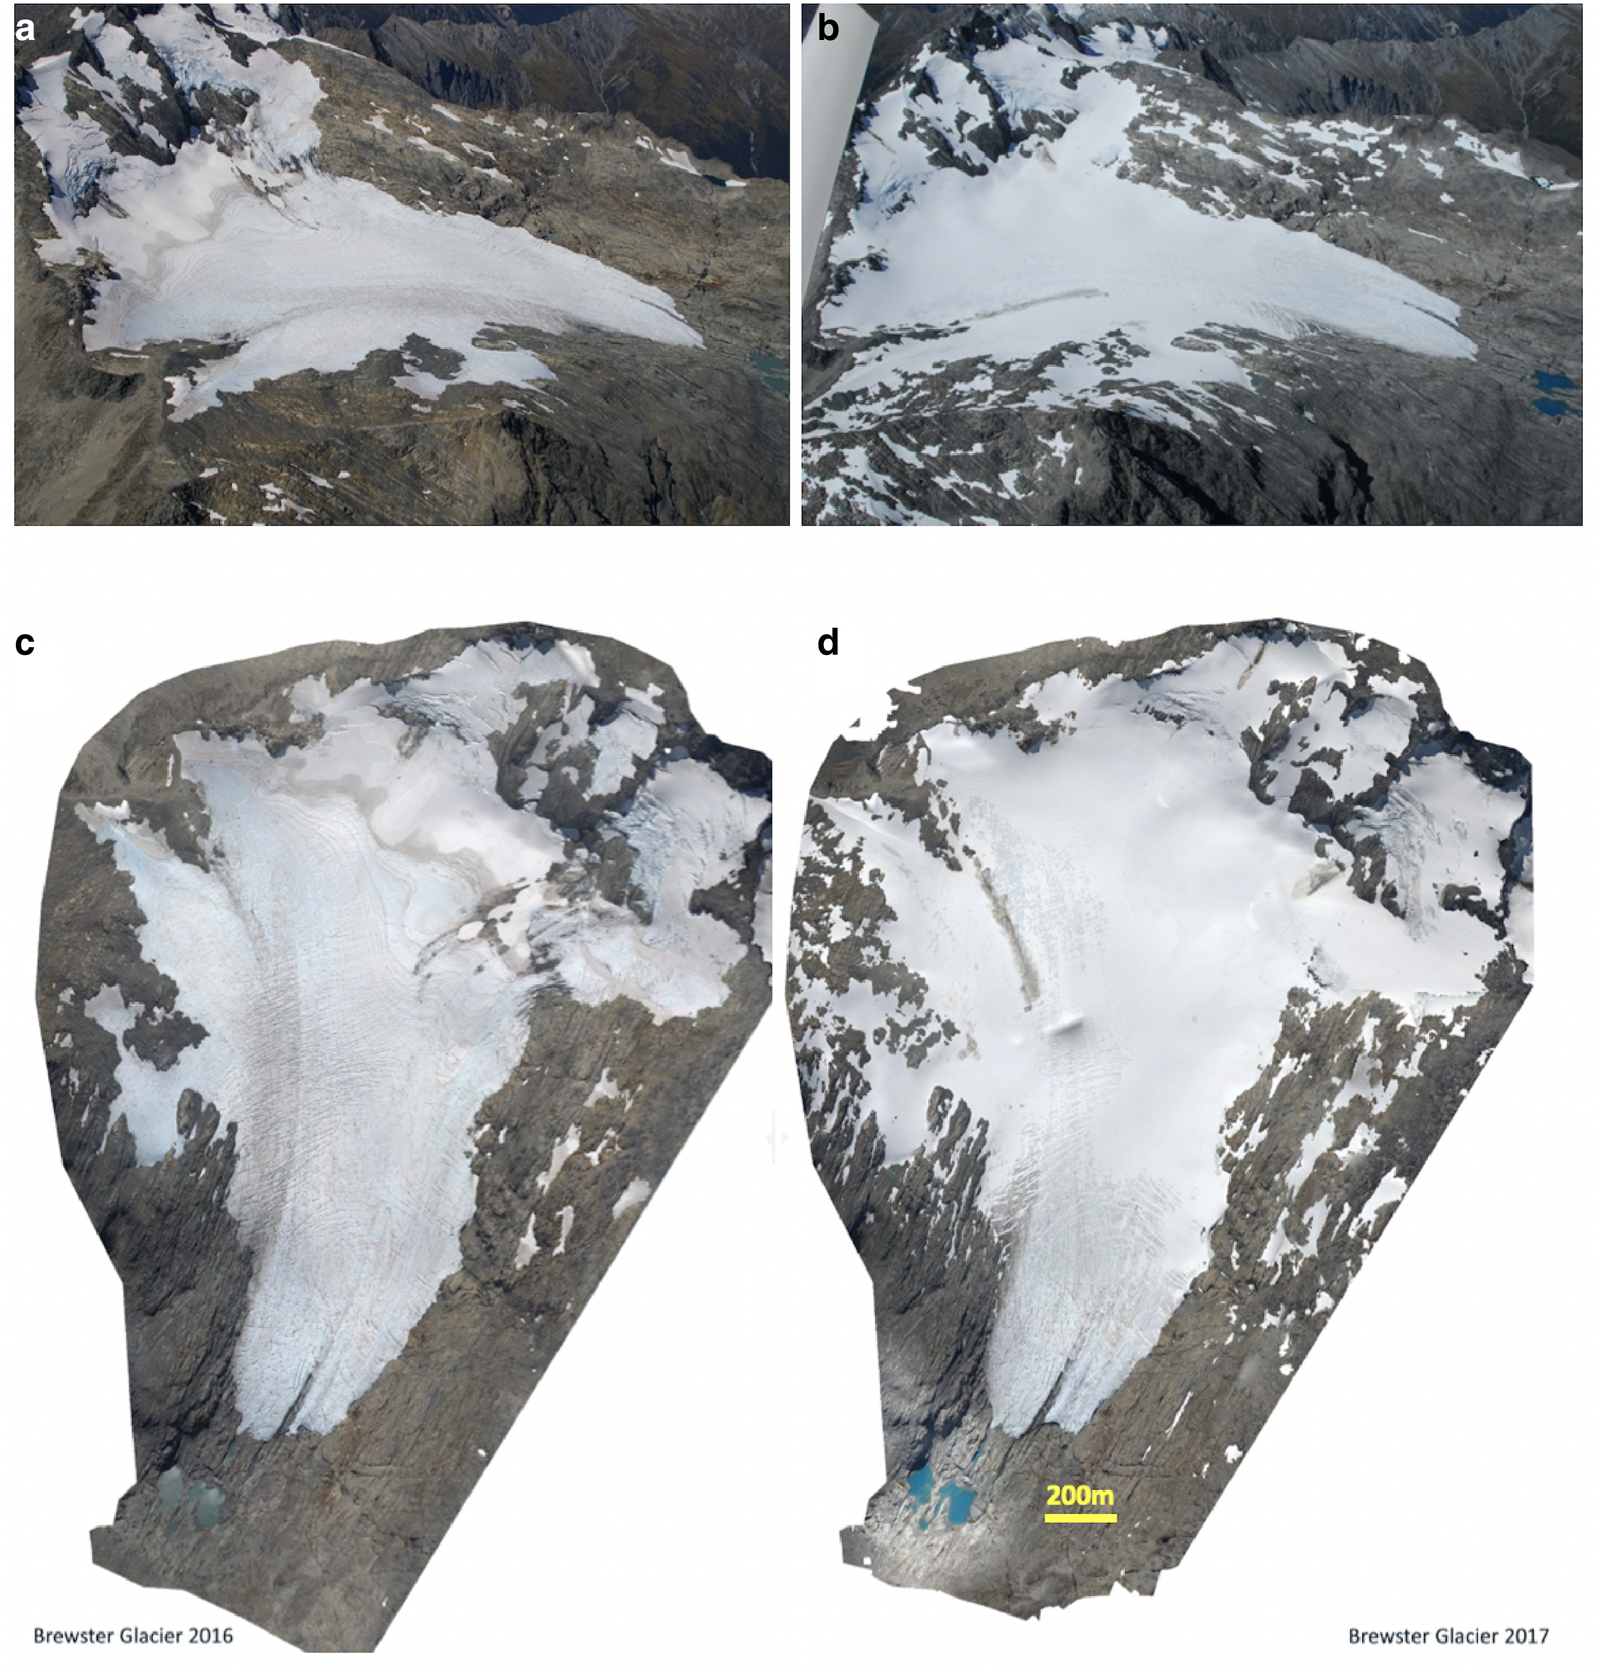
Contrasting snowlines for Brewster Glacier, Mount Aspiring National Park, from oblique aerial photos (a, b) and orthophotos (c, d) that were generated using EOSS survey oblique aerial photography and structure from motion photogrammetry. Images for 2016 are shown on the left (with a relatively high snowline) and 2017 on the right (with a relatively low snowline).
Selected index glaciers (n = 41) from the NIWA EOSS survey (listed by increasing latitude) used to calculate snowline elevations that were included in this study (# not included in RGI6.0 inventory)

Brewster Glacier and Rolleston Glacier (italicised) are index glacier sites have ongoing direct mass-balance measurements. Maximum ice elevation is from the 2018 EOSS report (Willsman and Macara, Reference Willsman and Macara2019). The ‘*’ indicates an estimated near-future position of the ELA at or above the maximum ice elevation, while ‘**’ indicates an estimated near-future position <50 m below ELAm based on a 2 std dev. upward shift for the summer snowline (see Section 5.3).
2.2 Climate observations
Climate data from long-term observing stations flanking the central Southern Alps (Hokitika, Mount Cook Village, Reefton, Milford Sound, Arthur's Pass; Fig. 1) were obtained from the National Institute of Water and Atmospheric Research and aggregated into monthly mean values. Marine surface temperature data for the Tasman Sea were drawn from OISSTv2 (Reynolds and others, Reference Reynolds2007), obtained through the NOAA Physical Sciences Laboratory (https://psl.noaa.gov/data/gridded/data.noaa.oisst.v2.highres.html) and aggregated into regionally coherent areas (north, central, south) in the same manner as land-based climate observations, with additional time series for Tasman Sea sub-regions based on empirical orthogonal function analysis (Fig. 3). Relationships between the snowline observations and modes of variability, regional circulation and synoptic types previously discussed in the context of ELA (Clare and others, Reference Clare, Fitzharris, Chinn and Salinger2002) and glacier energy-balance modelling (Mackintosh and others, Reference Mackintosh2017) are not re-assessed in this study.
(a) Principal component (PC) analysis using daily gridded OISSTv2 sea surface temperature (SST) covering the northern to southern Tasman Sea. (b) Central-southern Tasman Sea domain. (c) PC1 SST anomaly time series (October–March average values for 1981/82–2019/20 are shown with respect to the 1981–2010 climatology) that was employed in correlation function analyses.

3. Methods
3.1 Normalised EOSS observations
Index glacier EOSS observations that have at least 70% coverage for the 1981–2010 interval (Table 1) are included in a Southern Alps master snowline series, which we term NZ-ELAmaster. Unlike previous work (Clare and others, Reference Clare, Fitzharris, Chinn and Salinger2002) we make no substitutions in any of the index glacier series for missing snowline observations, and any observations collected outside the official EOSS flight were rejected. The steps for creating NZ-ELAmaster are described here. First, a 30 year (1981–2010) climatological average snowline elevation, also known as the modern equilibrium line altitude (ELAm), and std dev. for that interval were calculated for each index glacier time series where a majority of index glaciers meet the threshold for a robust climatological series. Next, normalised ELAs as proxy for the departure from ELAm were obtained by taking each raw snowline elevation estimate (see Supplementary materials) and computing a standard z-score to produce a summer snowline value (ELAs) and time series expressed in std dev. units relative to climatology. The spread of z-scores for all sites also provides a measure of within-year variability across the index glacier dataset when calculating the overall average ELA departure from climatology.
3.2 ELA intersite relationships and regional climate correlations
All ELAs series from the index glacier sites that met the 70% temporal coverage threshold for the climatological interval were run through intersite correlations, with significance levels established using a Pearson's correlation coefficient, r, and associated p-value. All sites with mean intersite correlations that achieved significance at 95% confidence interval were retained for constructing both NZ-ELAmaster and sub-regional snowline master series. We discuss issues related to high interseries correlations arising from potential autocorrelation in the raw dataset raised by Dowson and others (Reference Dowson, Sirguey and Cullen2020) in the Discussion. The ELAs values for all glaciers in the retained snowline series dataset were combined using an arithmetic mean, and the spread of all ELAs values available in any given year were calculated to indicate the variability of the average seasonal snowline departure from climatology. Linear regressions between monthly, multi-month, seasonal and multi-seasonal aggregated climate observations were undertaken in conjunction with NZ-ELAmaster.
4. Results
4.1 Southern Alps index glacier snowline relationships
Of the original 50 index glaciers, 41 qualified for inclusion in this study based on having a minimum of 70% EOSS observations between 1981 and 2010. Only four of those selected glaciers fall below an 80% completeness threshold that is typical for a climatological assessment (WMO, 2018) (essentially those four have only 22 years of observations across the 30 year interval; Table 1). We have opted to include these four glaciers in the master record (the result of excluding them is negligible in terms of the variability expressed in composite series, and increases the replication for the extreme northern and southern ends of the EOSS survey). The average elevation for the selected EOSS glaciers using the 1981–2010 interval is 1821 m. This is 21 ± 12 m lower than ELA0 used as the snowline datum for NIWA's annual EOSS reports (Willsman and Macara, Reference Willsman and Macara2022), likely related to the different interval used to calculate a long-term average snowline elevation. Intersite glacier snowline correlations for this interval show a common signal, and all of the sites included in NZ-ELAmaster have strong mean interglacier snowline correlations (average r = 0.83 ± 0.06; average correlation p < 0.05; Table 2). The collective strength of these correlations is revisited in the Discussion with respect to caveats inherent to the underlying EOSS measurements (Dowson and others, Reference Dowson, Sirguey and Cullen2020).
Intersite correlations for Southern Alps index glaciers used to monitor the end of summer snowline for the 30 year climatology period between 1981 and 2010

N, number of observations for each glacier during the climatology period.
4.2 Regional and NZ-ELAmaster records
Regional snowline series were constructed for Canterbury, West Coast, Otago and Southland, which are primary South Island areas of interest for water accountancy that are regularly reviewed in national hydrology reports (Griffiths and others, Reference Griffiths2021) and for most years there was replicated coverage from available observation sample depths for each New Zealand region (see glacier location in Table 1). The correlations for regional series composed of mutually independent glacier snowline records (Fig. 4, top) range between r = 0.93 and 0.97. This finding, along with strong intersite correlations (Table 2), indicates a master record that pools all available qualifying data can highlight a common signal from all sites (Fig. 4, bottom). The regional master snowline records also correlate strongly to the NZ-ELAmaster with a range between r = 0.95 and 0.99 (but noting interdependency with the construction of that series). A composite normalised snowline series for Brewster and Rolleston glaciers correlate well with the NZ-ELAmaster (r = 0.97) where contemporary in situ mass-balance measurements are conducted in New Zealand (Anderson and others, Reference Anderson2010; Purdie and others, Reference Purdie2015; Cullen and others, Reference Cullen2017).
(a) Regional ELA composite series for 1977–2020. Index glaciers in each of the regional masters are indicated in Table 1. (b) NZ-ELAmaster (solid line) plotted with Brewster/Rolleston composite snowline series (dashed line). The Brewster/Rolleston series (dashed line, bottom plot) is constructed in the same way as the regional series, but just for these two glaciers. They are depicted separately as they are the two index glacier sites with independent mass-balance measurements. The uncertainties are the spread (1 std dev.) for all sites that contributed to the mean normalised value for a given year.

There are clear differences for the average snowline elevation and variability of those elevations for each index glacier (Table 1; Supplementary materials). Aside from North Island glaciers on Mount Ruapehu, Canterbury (most notably central and northern parts of that province) has the highest snowline elevations while Southland has the lowest snowline elevations. Some of the glaciers within a region (e.g. Haupapa/Tasman Glacier in Canterbury) exhibit an exceptionally wide interannual range of snowline variability (Fig. 5). This range is specific to each glacier, and is one reason why intercomparisons using normalised ELA values is preferred for evaluating coherency of snowline change through time.
Normalised snowline elevation of selected index glaciers, 1977–2020. Normalised snowline elevation data are relative to the 1981–2010 average for individual glaciers. EOSS data are unavailable for 1990 and 1991 as survey flights were not carried out these years. Large blue triangles are Haupapa/Tasman Glacier. Symbols show glaciers in different regions. Triangles, Canterbury; diamonds, West Coast; Plus, Otago; X, Southland. Raw data used for this plot can be found in the Supplementary materials.

4.3 ELA variability and change
One std dev. for the NZ-ELAmaster is equivalent to ~100 m (based on statistical analysis of the average spread for 41 glaciers included in the series). The 1994/95 glacier year (lowest recorded snowline elevation since the survey began in 1977) had an average normalised snowline elevation equivalent to ~126 m below the 1981–2010 climatological position, while the 2017/18 glacier year (highest recorded snowline elevation) had an average normalised snowline elevation equivalent to ~264 m above the 1981–2010 climatology. The majority of contemporary change characterised by rising snowlines has taken place since the late 1990s, and especially since 2010. We note that Haupapa/Tasman Glacier has very high normalised snowline anomalies compared to the wider index glacier population during higher-than-normal snowline years (especially during the last decade; Fig. 5). This suggests Haupapa/Tasman Glacier in isolation may overestimate the average Southern Alps snowline departure from climatology during positive (high snowline) years (which requires further investigation).
The overall ELA trend based on all years 1977–2020 reflects a rate of snowline elevation increase of+3.84 m a−1, but there is a noticeable split in the NZ-ELAmaster time series trend. A subtle (or perhaps nominal) downward trend occurs until the mid-to-late 1990s during a time when the overall snowline elevation lowered (or remained relatively stable), followed by a more prominent and steeper upward trend to the present that reflects a rising snowline elevation. The NZ-ELAmaster trend changes allow us to assess how the rate of snowline rise has increased in recent years. When average ELA departures from normal are evaluated as stepwise decadal snapshots that mutually overlap by 5 years, the majority of the positive multi-decadal snowline rise observed over the length of the EOSS record has been strongly influenced by the most recent three decades. All of the overlapping decadal steps since 1995 (1995–2004, 2000–09, 2005–14, 2010–19) show a progressive increase in the average snowline departure from climatology (0.09, 0.32, 0.63, 1.14 std dev. units, which equates to an average shift of ~9, ~32, ~63 and ~114 m, respectively). The overall NZ-ELAmaster trend shows a decadal-average snowline position that spans 163 m based on the lowest decade (1985–94) and highest decade (2010–19). Based on the decadal positions of ELA displacement, the associated rate of annual snowline rise for the most recent decade (2010–19) with respect to the 1981–2010 average was +11.4 m a−1, almost three times greater than the average rate for the whole record.
4.4 Correlations of the NZ-ELAmaster to climate
Surface and atmospheric climate observations from land stations and from global reanalysis datasets were compared to the NZ-ELAmaster (Table 3; Fig. 6). April–December correlations are from the start of the glacier hydrological year to the end of the same calendar year (e.g. relative to a snowline value established in March 2019, the correlations to climate include the April 2018–December 2018 span, while January–March correlations are from months in the same year (2019) as the snowline measurement). Monthly correlations were used as a guide to generate r max values, which equate to the maximum correlation that could be achieved by making seasonal and multi-seasonal averages from monthly climate time series (Table 3).
(a) Climate response function plot showing NZ-ELAmaster monthly correlations against Hokitika mean temperatures (solid black line, all months shown). Significant bi-monthly (heavy dashed line), seasonal (dotted line) and quasi-seasonal correlations (light dashed and open core lines) are also shown for 1977–2020, illustrating stronger relationships over monthly values. See Table 3 for more details related to individual monthly correlations and strongest seasonally aggregated correlations for land stations. Notes about general mass-balance response aligned to different seasons (s − n; s + n) that coincide with and occur before the EOSS observations (made at the end of seasons) are indicated below the monthly correlations. (b) October–February average temperature anomalies plotted for series with significant relationships to NZ-ELAmaster (black). The average anomalies from land-based stations (Southern Alps terrestrial region), PC1 from Central Southern Tasman Sea SSTs (see Fig. 2, panel b for domain) and a composite land and ocean temperature record (Central Southern Tasman Sea SST record averaged with the Southern Alps Terrestrial region record) are shown. Comparison restricted to 1982–2020 based on limitations of OISSTv2 back in time.

Monthly correlations between NZ-ELAmaster and climate variables for the months prior and up to the Snowline survey (April–March)

Bold values are significant (p < 0.05; n = 42). Using the monthly correlations as a guide, r max was the maximum correlation that could be achieved by making seasonal and multi-seasonal climate averages from monthly climate values during the glacier hydrology year (April–March). r max values are not shown for sites where multi-monthly correlations did not improve results relative to individual monthly values. Milford MSLP correlations and all relative humidity correlations (except Hokitika) are calculated for 1978–2019 to retain data homogeneity. A climate response function diagram, which plots monthly correlations and maximum correlations like those shown in this table, is shown in Figure 6 (top) for NZ-ELAmaster regressed against mean temperatures at Hokitika
There are strong and statistically significant relationships between NZ-ELAmaster and both land and ocean temperatures, with the strongest correlations observed to land between October and March and sea surface temperatures between October and February (i.e. during the Austral warm season). Detrended analyses using residuals (not shown) remain statistically significant for temperature during the austral warm season. This indicates warm-season air temperature is an important climatic control of the snowline long-term trend and interannual variability. Rainfall correlations for the same stations (Table 3) indicate only one significant, positive correlation to the NZ-ELAmaster for only 1 month, indicating a lack of a consistent signal between the snowline and precipitation. A composite land and ocean temperature series for October–February (termed composite temperature anomaly land/ocean; Fig. 6) had the strongest relationship to the NZ-ELAmaster (r = 0.85, n = 37 analysed for 1982–2020; see Table 3).
5. Discussion
5.1 Systematic Southern Alps cryosphere observations still remain a challenge
In 1950, the eminent New Zealand geologist Pat Suggate (b. 1922–d. 2016) stated the following in one of the first modern glacier–climate analyses for the Southern Alps (Suggate, Reference Suggate1950):
The New Zealand glaciers are easily accessible. It should, therefore, not be difficult to carry out regular observations of the rates of movement and of the advance and retreat of the glaciers on both sides of the Southern Alps. Many of these observations could conveniently be made by frequent photographs from fixed points, especially in view of the great difference in gradient, speeds and the phenomena of advance and retreat. Such observations would be of much value.
While the last statement is true – exemplified by our ability to undertake this study using observations that were initiated more than four decades ago – the remaining sentiment is not well-grounded in a reality where time, money and logistics are relevant. There are ~2900 glaciers in New Zealand as of the last national ice inventory update (Baumann and others, Reference Baumann2020) that are spread across a vast and increasingly inaccessible alpine terrain (Chinn, Reference Chinn2001). Direct and regular monitoring of Southern Alps glaciers using low-angle photography, in addition to in situ mass-balance surveys, remains difficult, time consuming and expensive work (Anderson and others, Reference Anderson2010; Stumm, Reference Stumm2011; Purdie and others, Reference Purdie2015; Cullen and others, Reference Cullen2017, Reference Cullen2019). This was the primary reason why an annual aerial survey was initiated as a way to capture meaningful information about many glaciers and snowlines at a critical time of the year. Fixed-location snow and ice monitoring using time lapse cameras and instrumentation also remains fraught with problems related to technology reliability (consistency of capture and telemetry), weather variability and regular access for maintenance and data retrieval (Conway and Cullen, Reference Conway and Cullen2013, Reference Conway and Cullen2016; Conway and others, Reference Conway, Cullen, Spronken-Smith and Fitzsimons2015).
Satellite observations over New Zealand are ever improving and, by way of association, remotely sensed measurements of Southern Alps glaciers are growing and show potential for tracking snowline and mass-balance changes (Sirguey and others, Reference Sirguey2016; Dowson and others, Reference Dowson, Sirguey and Cullen2020). A wide array of approaches can also be used to evaluate and help to refine remotely sensed monitoring of snowline and glacier changes. New Zealand has many glaciers located on opposite sides of the Southern Alps main divide, which is a key topographic barrier to the prevailing atmospheric circulation (westerlies). As a consequence, there is high cloud cover especially west of the main divide (Dowson and others, Reference Dowson, Sirguey and Cullen2020) and variable atmospheric conditions for the full range of Southern Alps glacier environments (Macara, Reference Macara2018). Some prominent issues will always remain with regards to ascribing the ELA from snowlines from photographs, including misalignments between the moment the photographs are taken and the timing of maximum ablation during the glacier hydrology year (which may occur later). In addition, the occurrence of late season snowfall can obscure the true snowline elevation (Sirguey and others, Reference Sirguey2016; Dowson and others, Reference Dowson, Sirguey and Cullen2020). Nevertheless, the current method of EOSS data collection using light aircraft (with occasional supplementary flights, as in 2014 when two were conducted in early and late March) attends to some well-known idiosyncrasies, highlighting both the practicality and utility of the ongoing end of summer snowline survey as an independent and complementary line of information relative to satellite observations.
5.2 NZ-ELAmaster captures common Southern Alps snowline changes
Most of the Southern Alps EOSS index glaciers that have been monitored since 1977 now meet the minimum requirements for climatological observations (including length of time, degree of completeness). The EOSS index glacier dataset spans both sides of the Southern Alps main divide (Table 1) and these sites capture a representative view of the main glacierised region of New Zealand. Each EOSS index glacier time series shows variability and long-term change, and most of the sites for which a 1981–2010 climatology can be calculated are strongly correlated (Table 2). The similarity of the common signal observed for individual snowline records across the Southern Alps (Table 2) suggests a master series pooling all data is warranted. The similarity in the records from different index glacier sites suggests there may be a set of common climatic conditions that Southern Alps snowlines are collectively responding to on interannual and longer timescales. An argument could be made that such a high level of similarity in a natural system is unrealistic; however strong correlations between glaciers has been observed in other regions where mass balance is measured (Rabatel and others, Reference Rabatel, Letréguilly, Dedieu and Eckert2013; Pelto, Reference Pelto2018; Davaze and others, Reference Davaze, Rabatel, Dufour, Hugonnet and Arnaud2020). It is possible that aspects of temporal and spatial autocorrelation have influenced these results because of the way seasonal ELA elevation estimates are generated (Dowson and others, Reference Dowson, Sirguey and Cullen2020). Nevertheless, the fact that the similar first-order trends and the common interannual variability observed across all sites are similarly reflected in independent temperature data partly tempers that concern.
Assertions that a combined ELA time series captures coherent changes in the ELA (Clare and others, Reference Clare, Fitzharris, Chinn and Salinger2002) are well-supported by our study. However, previous efforts have relied on adopting nearby EOSS observations when years are missing (Clare and others, Reference Clare, Fitzharris, Chinn and Salinger2002) or relying on ELA (snowline) values from one glacier (the default commonly being Haupapa/Tasman Glacier; Salinger and others, Reference Salinger2019). That practice, while beneficial for first-order examination of changes, does not take individual glacier snowline sensitivities into account, or any potential biases in observations at any given site. Thus, the reliance on a single site disregards any uncertainty in the estimate of a summer snowline elevation. The NZ-ELAmaster presented in this study (Fig. 4) differs from previous work by presenting a normalised snowline record that accounts for the spread of different index glacier snowline elevation, and different glacier ELA ranges and interannual sensitivities. In addition, transforming the snowline data into a normalised series with a spread based on all available observations for each year lends to a measure of intersite variability (and is advantageous as a proxy for average snowline position uncertainty) in the NZ-ELAmaster for times when past observations are limited.
On review of the extant EOSS observations during our data prescreening, we have opted to not define the snowline elevation for years when the official EOSS survey did not take place. We also chose to not interpolate any missing data for any of the index glaciers. For the former choice, we excluded unreplicated observations for Haupapa/Tasman Glacier that were based on limited low-angle photographs and personal descriptions for 1990 and 1991, respectively (Willsman and Macara, Reference Willsman and Macara2019). For 1990, we note that limited photographs independent of the EOSS programme were taken later than previous years, possibly leading to a situation where a higher-than-normal snowline estimate for that season would result from using that evidence. As such, there is a break in NZ-ELAmaster for two seasons where no data or solid replication of observations exist. Our choices have meant NZ-ELAmaster does not contain any inferences using data gathered outside of the official EOSS survey, and also provides data integrity for the series in a situation where gap filling could be attempted. In the future, infilling New Zealand snowline data gaps might be possible with additional data rescue investigations (including a citizen science campaign) in collaboration with the New Zealand alpine recreation community. There may also be additional satellite imagery (e.g. classified, yet-to-be released) that could be helpful when it is eventually made available.
5.3 Southern Alps snowline elevation is increasing
The NZ-ELAmaster illustrates an overall rise for the average snowline elevation and a possible acceleration in recent years (Fig. 7). The most significant shift for both the ELA position and interdecadal ELA rate of rise has occurred in the most recent decade (2010–2019). If the average interdecadal increase of snowline displacement observed since 1990 occurs in the near future, then by 2025–2034 the Southern Alps average summer snowline will be positioned at an average elevation more than 2 std dev. above the 1981–2010 climatological position. That equates to an average ELA that is +200 m higher than climatology, based on the average std dev. of snowline elevations for the index glacier climatology produced in this study and the average rate of interdecadal snowline increase observed for 1990–2014. When applied to specific glaciers in this study, a snowline rise of 2 std dev. above the 1981–2010 climatological position would eliminate 11 of the 41 index glaciers in the EOSS survey (27% of the subset we examined), along with an additional ten index glaciers (24% of the subset we examined) with average snowline positions located <50 m from the highest ice elevation (see glaciers with ELAm values shown by asterisks in Table 1). When interannual variability is considered, those ten glaciers would deteriorate significantly in anomalously warm years. However, a future snowline rise estimate of 2 std dev. from climatology is probably conservative, given projections of continued temperature increase in New Zealand due to climate change (Mullan and others, Reference Mullan, Sood, Stuart and Carey-Smith2018). If the interdecadal snowline increase follows what has occurred for the most recent decade (2010–2019) compared to the one just prior (2005–2014), then an average snowline elevation of more than 2.5 std dev. (on average >250 m above the 1981–2010 climatology) will occur regularly by the 2025–2034 decade, placing many more index glaciers (and Southern Alps glaciers as a whole) in jeopardy of extinction. The specific summer snowline change for individual glaciers will depend on their location, mean elevation, their catchment geometry and aspect, as well as the elevation span of snow and ice. Regardless of individual glacier traits, the anticipated snowline rise (either conservative or aggressive) for the near future is expected to have significant impacts on reducing the glacierised area of Aotearoa New Zealand.
Average interdecadal position changes (overlapping by 5 years) for the end of summer snowline elevation spanning 1977–2020. Note, data are missing for bin averages that include 1975, 1976, 1990 and 1991. The conversion of NZ-ELAmaster into an average elevation of departure relative to climatology was achieved after annual normalised ELA values were grouped into decadal bins, and using the assumption that 1 std dev. unit is equivalent to ~100 m elevation (based on the statistical analysis of 41 index glaciers used in this study). The errors bars for the last three interdecadal snowline positions are projections that use the average interdecadal snowline displacement increases seen for the overlapping decades within the 1990–2019 period (lower error bound), the three overlapping decades for 2000–19 period (orange circles) and the most recent two overlapping decades in the 2005–19 period (upper error bound).

5.4 Glacier–climate relationships
5.4.1 Early studies showed inconclusive contemporary glacier–climate relationships
Initial modern glacier–climate comparisons utilised Franz Josef/Kā Roimata o Hine Hukatere terminus observations (rates of movement and position) that were compared to systematic Hokitika rainfall, temperature and sunshine measurements spanning 1894–1949 (Suggate, Reference Suggate1950). This effort presented the a priori assumption that precipitation contributed to winter mass balance, which drove ice responses at the terminus via a time lag. However, no formal statistical analyses in the comparison of Franz Josef terminus activity and climate were made in that study. An alternative view from the early 1950s made a link between rising snowlines and temperature connected to atmospheric circulation (Harrington, Reference Harrington1952). Shortly afterwards, work on ice flow rates at Te Moeka o Tuawe/Fox Glacier and Kā Roimata o Hine Hukatere/Franz Josef Glacier also assumed no appreciable local temperature change occurred in the mid-1900s (McSaveney and Gage, Reference McSaveney and Gage1968), and simultaneous work that updated glacier terminus observations for 1951–67 indicated there was no consistent relationship between precipitation trends and terminal advances (Sara, Reference Sara1968). A more cautious view about the role of temperature and precipitation for driving New Zealand glaciers advance and retreat followed (Soons, Reference Soons1971), and suggested there was no significant and/or direct relationship between precipitation and glacier terminus behaviour without invoking inconsistent lag responses for correlations with winter precipitation. This left unsettled questions about what was driving interannual to decadal-scale advances and retreats of Southern Alps ice in the 20th century.
The first climate response function analysis using statistics was undertaken in conjunction with the photographic history of Te Waewae/Stocking Glacier terminus fluctuations (Salinger and others, Reference Salinger, Heine and Burrows1983). However, that dataset contained only 18 sporadic observations through time, and reference climatic series needed to be low-pass filtered in order to be comparable. On review, the correlations that were obtained for the Stocking terminus were only significant for temperature in August when aligned to their entire observation period (1914–74) and for temperature in August, November and December when aligned to their full calibration period of 1931–74 (Salinger and others, Reference Salinger, Heine and Burrows1983). Statistically weak (or even anticorrelations) were shown for rainfall using Otira (in Arthur's Pass) as the representative rainfall station, and lag relationships were still invoked. When the Stocking Glacier study (Salinger and others, Reference Salinger, Heine and Burrows1983) was independently scrutinised, it was deemed invalid because of time series autocorrelation issues and application of inappropriate statistical approaches (Gellatly and Norton, Reference Gellatly and Norton1984). Complications of evaluating glacier (and mass balance) relationships using limited climate data in the absence of accumulation area (and snowline) observations was also lamented (Brazier and others, Reference Brazier, Owens, Soons and Sturman1992). This led to an opinion by the early 1990s that understanding the contemporary New Zealand glacier mass-balance response to climate required suitable data, including more finely resolved, long-term observations from the accumulation zone and longer (and homogeneous) climatic time series (Gellatly and Norton, Reference Gellatly and Norton1984; Brazier and others, Reference Brazier, Owens, Soons and Sturman1992). The Southern Alps EOSS record, which now exceeds four decades of coverage, provides that opportunity.
5.4.2 Austral warm-season temperatures drive the Southern Alps snowline elevation
Re-evaluating the New Zealand climate-glacier response relies on the NZ-ELAmaster compared to climate records from the Southern Alps and for the Tasman Sea (Table 3; Figs 3, 6). The premise of undertaking this analysis is that glaciers respond primarily to their local environment, and that the relationship of a glacier and snowline to local conditions remains stable through time. Those relationships need to be accurately established before investigating how modes of variability and other remotely teleconnected processes influence local glacier environmental conditions and wider Southern Alps glacier activity (i.e. advance and retreat). Use of the NZ-ELAmaster for climate response function analyses relies on strong interseries correlations observed for the individual EOSS survey sites (Table 2).
Correlation functions for the NZ-ELAmaster indicate significant and coherent glacier–climate relationships to monthly sea surface temperature, air temperature and atmospheric pressure (Table 3). Seasonal averages for some of the climate variables that were investigated improved correlations with the NZ-ELAmaster. Both land and ocean temperatures west of the Southern Alps main divide have the strongest correlations to the NZ-ELAmaster. Climate records from the central Southern Alps at Mount Cook Village have poor correlations to NZ-ELAmaster (Table 3) and do not appear to accurately capture the ambient environmental conditions that Southern Alps glaciers respond to. The strongest correlation for NZ-ELAmaster is to a composite land/ocean temperature series for October–March (r = 0.85), indicating a strong relationship between glaciers and regional temperatures.
The influence of low-frequency trends in the NZ-ELAmaster, air temperatures, marine temperatures and atmospheric pressure were further investigated by undertaking response function analysis on residual series (not shown). That analysis is consistent with the strong correlations observed between the NZ-ELAmaster and austral warm-season temperatures (Table 3). Consistently poor correlations to precipitation existed for both the nondetrended and detrended analyses. The indication from these findings reinforce previous work that has demonstrated that warm-season air temperature and not annual or winter precipitation is the main driver of Southern Alps glacier changes (Anderson and Mackintosh, Reference Anderson and Mackintosh2006; Mackintosh and others, Reference Mackintosh2017). Primary ablation season temperatures (October–March), particularly during summer, rather than average temperatures for the entire glacier hydrological year (April–March), drive the Southern Alps snowline climatic response. By association, the predominant control on Southern Alps alpine climate during the ablation season dictates the volume of accumulated snow remaining in the latter half of the glacier hydrological year. From this position, we can assert austral warm-season climate plays a heavy role in guiding overall glacier mass balance, as would be expected in this maritime environment (Oerlemans and Reichert, Reference Oerlemans and Reichert2000).
Four of the five highest snowlines in the EOSS record also occurred in the most recent decade (2010/11, 2015/16, 2017/18, 2018/19), and most of those seasons are associated with significant Tasman Sea marine heatwaves (Oliver and others, Reference Oliver2017; Salinger and others, Reference Salinger2019, Reference Salinger2020; Vargo and others, Reference Vargo2020). Marine heatwaves have also been associated in other regions with anomalously high snowlines (Maussion and others, Reference Maussion, Gurgiser, Großhauser, Kaser and Marzeion2015; Pelto, Reference Pelto2018). Our collective findings support the connection between the air temperature source region directly upwind of the Southern Alps (Purdie and others, Reference Purdie2011; Mackintosh and others, Reference Mackintosh2017) as being vitally important for New Zealand glaciers. In New Zealand's isolated maritime setting, the Southern Alps airmass source region reflects surface climate traits of the last few thousand kilometres of fetch for the prevailing atmospheric flow (Lorrey and others, Reference Lorrey, Fowler and Salinger2007), which predominantly passes over the central Southern Tasman Sea before reaching land.
The rising NZ-ELAmaster trend, including a sustained upward displacement of the snowline since the 1990s, is consistent with observed worldwide trends in surface mass balance on glaciers (Zemp and others, Reference Zemp2015; WGMS, 2020, 2021; Dunn and others, Reference Dunn2021; Hugonnet and others, Reference Hugonnet2021). This worldwide trend is very likely linked to human greenhouse gas emissions (Marzeion and others, Reference Marzeion, Cogley, Richter and Parkes2014; Roe and others, Reference Roe, Christian and Marzeion2021). In New Zealand, the overall snowline trend is consistent with decadal-scale attribution of human influences on climate. In addition, individual years with extremely high snowlines (see Brewster Glacier in 2016 in Fig. 2) show a clear link to human greenhouse gas emissions (Vargo and others, Reference Vargo2020). Collectively, we can assert from our findings that both the long-term snowline trend and extreme snowline positions that are much higher-than-average for New Zealand are connected to rising surface temperatures in response to human activity.
5.5 Limitations, assumptions and uncertainties
More evidence for 1990 and 1991 that can supplement the limited photographs of Haupapa/Tasman Glacier, when the EOSS survey did not officially run, are required to bridge a gap in NZ-ELAmaster. Adding more data for those two years is not likely to change results for the overall snowline trends, but any net mass balance reconstructed since 1978 that is reliant on NZ-ELAmaster (via a transfer function) could become more positive or more negative depending on what those two missing years were like. The climatic conditions during those two missing years were close to average (and potentially counterbalance), and so transformations of an ELA-based cumulative mass-balance proxy into remnant ice volume and patterns of overall change could be unaffected. Improvements to address this particular shortcoming could be achieved by recovering historic glacier photographs taken by the New Zealand alpine recreation community with timing that is better aligned to when the EOSS survey typically occurs, or other gap-filling approaches.
There is also an indication that during some years the NZ-ELAmaster does not match the pattern of interannual temperature variability (Fig. 6), which was also raised in initial comparisons with results from glacier energy-balance modelling (Mackintosh and others, Reference Mackintosh2017). A different climate variable (e.g. MSLP; Table 3) or other factors (such as clouds and moisture flux; Conway and Cullen, Reference Conway and Cullen2016; Abrahim and others, Reference Abrahim, Cullen and Conway2022) likely play a more important role for guiding local snowline elevations in years such as 1999 (e.g. higher pressures than normal) and 2020 (with bushfire dust/carbon on the surface of snow and ice), where net mass-balance change diverges from local temperature anomalies. Future work to establish the reasons that can explain more of the observed variability will require a better understanding of meteorology and climate in glacier environments, the NZ-ELAmaster uncertainties and better controls on how individual index glacier ELAs are generated as identified in Dowson and others (Reference Dowson, Sirguey and Cullen2020).
6. Conclusions and future work
The Southern Alps EOSS survey has captured low altitude oblique aerial photographs for more than 50 index glaciers since 1977. It provides a near-continuous record that is a representative cross section of snowline variability and change for the largest part of New Zealand's cryosphere. Our analysis of the historic New Zealand EOSS data has shown the potential to create a climatological reference series, termed NZ-ELAmaster, that accounts for idiosyncrasies of mean snowline elevations and interannual snowline variations over large and small glaciers that are located in different parts of the Southern Alps. Our screening of the historic EOSS dataset has identified and excluded arbitrary, unreplicated and inconsistent observations for years when the EOSS survey did not occur. Further efforts are warranted to re-evaluate sparse photographic evidence that can in-fill and extend the EOSS dataset back in time.
The newly created NZ-ELAmaster record was used in a correlation response function analysis at monthly to multi-seasonal resolution to determine the climatic significance of the end of summer snowline. We have shown NZ-ELAmaster is strongly correlated to land and ocean temperature anomalies during the austral warm season (October–March), which corresponds to the ablation period in the glacier hydrological year. The mean Southern Alps snowline elevation shows a consistent rising trend from the late 20th century to present, with the possibility that the ELA increase has begun to accelerate recently along with more frequent, exceptionally high snowline positions. An example of exceptionally high snowlines occurred during the 2018 snowline survey, when 12 of 50 index glaciers had an estimated snowline elevation either above the mountain or higher than the glacier (resulting in no recorded snowline elevation; see Supplementary materials). All of the snowline observations for the EOSS glaciers reflect the long-term temperature changes and the occurrence of temperature extremes in the New Zealand region that are captured by station-based instrumental observations and reanalysis data. The observed differences between the interannual variability of the NZ-ELAmaster record and temperature variability are likely linked to secondary climate variables (Abrahim and others, Reference Abrahim, Cullen and Conway2022) and/or to extraneous factors that have an impact on seasonal snow and ice retention (e.g. bush fire ash covering snow and ice in early 2020).
Strengthening EOSS observations in the future with a more diverse index glacier set, re-evaluating methods for obtaining snowline elevations from photographs and quantifying snowline uncertainties will complement remotely sensed satellite observations as they become more important in monitoring New Zealand cryosphere changes. With expectations of rising temperatures from climate change projections (Mullan and others, Reference Mullan, Sood, Stuart and Carey-Smith2018) we anticipate higher snowlines will occur. This will result in reduced areal coverage of ice (Anderson and others, Reference Anderson2021) and increased frequency of large interannual ice losses from extreme seasons (such as 2018 and 2019; Vargo and others, Reference Vargo2020) in the future. We are currently assessing alternative glaciers to support the transfer of local long-term snowline elevation measurements in light of the likely future loss of some original index glaciers suggested by this study. These adaptations will ensure the EOSS survey continues to have utility for measuring the snowline elevation and for detection and attribution of the effects of climate variability and change on New Zealand glaciers.
Supplementary material
The supplementary material for this article can be found at https://doi.org/10.1017/jog.2022.27
Acknowledgements
We are indebted to Dr Trevor Chinn for initiating the Southern Alps EOSS programme. This research and the ongoing EOSS survey were funded by the NIWA Strategic Science Investment Fund (SSIF) contract for ‘Climate Present and Past’ CAOA2101 awarded to AML. Dr Nicolas Fauchereau is thanked for providing OISST data and components of Figure 3. We also thank Dr Christian Zammit for additional support via the NIWA SSIF contract CACV2003 ‘Regional Hydrological Modelling’. Andy Woods is greatly thanked for his expertise on piloting the aircraft during snowline flights over the years.


 Open access