


Introduction
Depression, the most widespread mental disorder worldwide, has emerged as the primary cause of disability among all mental health conditions (GBD 2019 Mental Disorders Collaborators, 2022). According to the most recent Global Burden of Disease study published in 2025, ~332 million people worldwide suffered from depression in 2021 (Rong, Wang, Cheng, Li, & Zhao, Reference Rong, Wang, Cheng, Li and Zhao2025). This alarming and continually increasing figure highlights that depression has emerged as a global public health crisis that demands urgent attention (Herrman et al., Reference Herrman, Patel, Kieling, Berk, Buchweitz, Cuijpers and Wolpert2022). A mounting number of studies have demonstrated that depression is strongly associated with elevated risks of all-cause and cause-specific mortality (Machado et al., Reference Machado, Veronese, Sanches, Stubbs, Koyanagi, Thompson and Carvalho2018). Considering the surging disease burden, it is vital to pinpoint affordable and modifiable risk factors of depression.
Due to shared biological mechanisms, such as dysregulation of the hypothalamic–pituitary–adrenal axis, the link between type 2 diabetes mellitus (T2DM) and depression has been widely explored (Moulton, Pickup, & Ismail, Reference Moulton, Pickup and Ismail2015). Insulin resistance (IR), a key feature of T2DM, has also been independently linked to depression (Fernandes et al., Reference Fernandes, Salagre, Enduru, Grande, Vieta and Zhao2022). Recently, the triglyceride–glucose (TyG) index, calculated as ln (fasting triglycerides [mg/dL] × fasting glucose [mg/dL]/2), has been well-established as a reliable alternative marker of IR (Du et al., Reference Du, Yuan, Zhang, Zhou, Sun and Yu2014; Gastaldelli, Reference Gastaldelli2022; Guerrero-Romero et al., Reference Guerrero-Romero, Simental-Mendía, González-Ortiz, Martínez-Abundis, Ramos-Zavala, Hernández-González and Rodríguez-Morán2010). The TyG index combines two routinely measured blood biomarkers and reflects metabolic dysfunction, particularly related to lipid and glucose metabolism. Compared to traditional IR measures, the easily accessible TyG index has been reported to exhibit higher sensitivity and specificity (Guerrero-Romero et al., Reference Guerrero-Romero, Simental-Mendía, González-Ortiz, Martínez-Abundis, Ramos-Zavala, Hernández-González and Rodríguez-Morán2010), making it more suitable for large-scale investigations. Prior studies on the TyG index mainly focused on cardiovascular diseases (CVDs) (Che et al., Reference Che, Zhong, Zhang, Pu, Zhao, Zhang and Han2023; Liang et al., Reference Liang, Wang, Zhang, Liu, Bai, Chen and He2023), with little attention to mental disorders such as depression. A recent systematic review emphasized the potential importance of evaluating the TyG index in relation to depression (Behnoush et al., Reference Behnoush, Mousavi, Ghondaghsaz, Shojaei, Cannavo and Khalaji2024). However, the handful of studies exploring the relationship have primarily utilized cross-sectional designs, relied on symptom-based rather than diagnostic outcomes, and yielded inconsistent results (Jin et al., Reference Jin, Lv, Liang, Teng, Gao, Zhang and Li2023; Shi, Zheng, Cai, & Qian, Reference Shi, Zheng, Cai and Qian2021; Wang et al., Reference Wang, Zhang, Li, Gui, Mei, Yang and Zhang2023; Zhang et al., Reference Zhang, Hou, Fei, Zhang, Gao, Liu and Lv2023; Zhang, Zhao, Guo, Yang, & Liu, Reference Zhang, Zhao, Guo, Yang and Liu2024; Zheng et al., Reference Zheng, Cui, Yue, Yan, Zhang, Ding and Ren2023). To date, only one longitudinal study has examined this relationship, but it focused on symptom progression rather than new-onset depression (Zheng et al., Reference Zheng, Cui, Yue, Yan, Zhang, Ding and Ren2023). Therefore, prospective studies investigating whether the TyG index is associated with incident depression are still lacking.
Genetic factors also contribute to depression risk (Sullivan, Neale, & Kendler, Reference Sullivan, Neale and Kendler2000). A large meta-analysis estimated the heritability of depression at ~37% (Sullivan et al., Reference Sullivan, Neale and Kendler2000). Studies have evidenced that genetic predisposition for depression may interact with environmental risk factors (Fu et al., Reference Fu, Liu, Liang, Weng, Li, Xu and Gu2022; Lin et al., Reference Lin, Yang, Zhang, Cao, Li, Sun and Wang2023). However, it remains unknown whether the impact of the TyG index on depression incidence is independent of genetic risk. Moreover, epidemiologic studies have proposed links between the TyG index or IR and socioeconomic status (SES, e.g. education) (Lawlor et al., Reference Lawlor, Harro, Wedderkopp, Andersen, Sardinha, Riddoch and Davey Smith2005), lifestyle factors (e.g. smoking and sleep) (Jeong, Joo, Kwon, & Park, Reference Jeong, Joo, Kwon and Park2021; Pei et al., Reference Pei, Li, Su, Lu, Wang and Wu2023), biological factors (e.g. body mass index [BMI]) (Kim et al., Reference Kim, Kim, Lee, Taniguchi, Isobe and Oh2023), and health conditions (e.g. hypertension and CVD) (Che et al., Reference Che, Zhong, Zhang, Pu, Zhao, Zhang and Han2023; Gao, Song, & Guo, Reference Gao, Song and Guo2023). All of these factors have been reported to be associated with depression (Remes, Mendes, & Templeton, Reference Remes, Mendes and Templeton2021). Nevertheless, it remains unclear whether the association between the TyG index and depression could be explained by these risk factors.
Utilizing the UK Biobank cohort, the primary aim of this study was to investigate the prospective association between baseline TyG index and incident depression. Moreover, we examined whether this TyG–depression association is modulated by genetic predisposition to depression. Furthermore, this study quantified the contribution of a range of potential risk factors to this association.
Methods
Study design and participants
Data for this study were sourced from the UK Biobank, an extensive prospective cohort that enrolled more than 500,000 participants from England, Scotland, and Wales between 2006 and 2010. Participants completed touchscreen questionnaires, underwent physical examinations, and provided biological samples, with a detailed description of the cohort available elsewhere (Sudlow et al., Reference Sudlow, Gallacher, Allen, Beral, Burton, Danesh and Collins2015). The Northwest Multi-center Research Ethics Committee (MREC reference: 21/NW/0157) provided ethical approval for the UK Biobank project. All participants gave informed consent before being recruited. This study was conducted using the UK Biobank resource under Application Number 91536. This study did not have a preregistered protocol, in line with similar observational research using UK Biobank data (Fu et al., Reference Fu, Liu, Liang, Weng, Li, Xu and Gu2022; Yang, Wang, Huang, Kelly, & Li, Reference Yang, Wang, Huang, Kelly and Li2023).
First, participants who were withdrawn or lost to follow-up (n = 1,297) and those with depression (n = 42,220) or other common mental disorders (anxiety, bipolar disorder, and schizophrenia [n = 19,850]) at baseline were excluded. Second, we excluded participants with missing data on the TyG index (n = 63,654). Since the genetic instruments utilized in the study were developed based on White populations (Howard et al., Reference Howard, Adams, Clarke, Hafferty, Gibson, Shirali and McIntosh2019), participants with incomplete genetic data (n = 4,199) and non-White individuals (n = 21,945) were further excluded. Also, participants with missing covariates were excluded (n = 13,550). The final analyses included 335,586 participants (Supplementary Figure S1).
Assessment of depression
Consistent with prior research (Yang et al., Reference Yang, Wang, Huang, Kelly and Li2023), depression cases occurring during the follow-up and at baseline were identified through International Classification of Diseases, Tenth Revision (ICD-10) codes F32 and F33 (Data category: 2405) among the ‘First occurrence fields’ of the UK Biobank, which were sourced from self-reported medical conditions, primary care, hospital admission, and death registrations. The date of depression incidence was the earliest recorded date across diverse sources. The follow-up time was calculated as the time interval from the baseline recruitment date to the date of depression incidence, death, or the censoring date (31 October 2022 for England, 31 August 2022 for Scotland, and 31 May 2022 for Wales), whichever occurred first. We performed the same method to identify patients diagnosed with depression or other mental disorders at baseline.
Assessment of the TyG index
Biochemical indicators (e.g. glucose, triglycerides, and total cholesterol [TC]) were measured by peripheral blood samples from participants randomly collected by UK Biobank at baseline recruitment. Specific measurement procedures were conducted on a Beckman Coulter AU5800 professional analyzer and have been validated in previous studies (Elliott & Peakman, Reference Elliott and Peakman2008). The raw data for glucose and triglycerides, originally measured in mmol/L, were converted to mg/dL to calculate the TyG index using the following formula: ln (triglycerides [mg/dL] × glucose [mg/dL]/2) (Che et al., Reference Che, Zhong, Zhang, Pu, Zhao, Zhang and Han2023).
Assessment of genetic predisposition
As validated by previous studies (Fu et al., Reference Fu, Liu, Liang, Weng, Li, Xu and Gu2022; Howard et al., Reference Howard, Adams, Clarke, Hafferty, Gibson, Shirali and McIntosh2019), the polygenic risk score (PRS) consisting of 97 single-nucleotide polymorphisms (SNPs) significantly associated with new-onset depression was used to assess the genetic predisposition of participants to depression incidence. Detailed information on genotyping and quality control in the UK Biobank can be found elsewhere (Bycroft et al., Reference Bycroft, Freeman, Petkova, Band, Elliott, Sharp and Marchini2018). Details of all included SNPs are provided in Supplementary Table S1. A weighted method was used to calculate the PRS. First, each SNP was categorized as 0, 1, or 2 according to the number of risk alleles. Second, each SNP was weighted according to the effect sizes (β-coefficients) derived from a previous depression-related meta-analysis study (Howard et al., Reference Howard, Adams, Clarke, Hafferty, Gibson, Shirali and McIntosh2019). Finally, the calculation of the PRS followed this formula: PRS = β 1 × SNP1 + β 2 × SNP2 + … + βn × SNP n, where SNP n denotes the risk allele number of each SNP. A higher PRS is associated with an increased genetic predisposition to depression. In formal analyses, we categorized participants into low, moderate, and high genetic predisposition categories based on tertiles of the PRS.
Assessment of covariates
In addition to demographic covariates (age and sex), the other covariates associated with the TyG index and depression were regarded as potential confounders or mediators (Che et al., Reference Che, Zhong, Zhang, Pu, Zhao, Zhang and Han2023; Jin et al., Reference Jin, Lv, Liang, Teng, Gao, Zhang and Li2023; Shi et al., Reference Shi, Zheng, Cai and Qian2021; Wang et al., Reference Wang, Zhang, Li, Gui, Mei, Yang and Zhang2023; Zhang et al., Reference Zhang, Hou, Fei, Zhang, Gao, Liu and Lv2023; Zhang et al., Reference Zhang, Zhao, Guo, Yang and Liu2024; Zheng et al., Reference Zheng, Cui, Yue, Yan, Zhang, Ding and Ren2023), including SES (education [college or university versus others], employment [paid employment versus others], and Townsend Deprivation Index [TDI]), lifestyles, biological factors (BMI and TC), and health conditions. The TDI reflected deprivation, with higher scores indicating higher levels of poverty. Lifestyles included smoking (current or prior smokers versus others), drinking (daily or almost daily alcohol consumption versus others), physical activity (PA, <150 min/week of moderate-intensity PA or < 75 min/week of vigorous-intensity PA versus others), and sleep duration (<7 or > 9 hours/day versus others) (Foster et al., Reference Foster, Celis-Morales, Nicholl, Petermann-Rocha, Pell, Gill and Mair2018). BMI was classified as overweight/obese (≥25 kg/m2) and others (<25 kg/m2). Hypercholesterolemia was defined as TC > 200 mg/dL (National Cholesterol Education Program, 2002). Health conditions, including hypertension (I10-I15), diabetes (E10-E14), and CVD (I20-I25, I60-I64), were determined by ICD-10 codes in the ‘First occurrence fields’ of the UK Biobank. More information on covariates can be found in Supplementary Table S2. The percentage of missing data for covariates varied between 0.02% and 1.83% (Supplementary Table S3).
Statistical analyses
Descriptive statistics were performed for continuous variables (expressed as mean [standard deviation, SD]) and categorical variables (presented as n [%]) to depict the distribution of baseline characteristics of participants by quartiles (quartile 1–quartile 4 [Q1–Q4]) of the TyG index. The differences in the baseline characteristics of study participants were tested using ANOVA for continuous variables and Pearson chi-square tests for categorical variables. Multivariate Cox proportional hazards models with follow-up time as a timescale were conducted to examine the associations of the TyG index and PRS with risk of incident depression, with results presented as hazard ratios (HRs) and 95% confidence intervals (CIs). The Schoenfeld residual test was utilized to verify the proportional hazard assumption, and no violations were detected.
To comprehensively explore the associations, we employed multiple analytical strategies. First, the TyG index was processed as continuous variables to calculate HR per SD increment. Second, to estimate the risk of incident depression ascribed to a high TyG index, we analyzed the TyG index as quartiles with the lowest quartile (Q1) as the reference group. Third, by treating quartiles as continuous variables and using their median values as predictors, we tested the P-values for linear trends. The same analytical procedure was applied to the PRS. Furthermore, the cumulative incidence of depression across the TyG index subgroups was plotted using the Kaplan–Meier (KM) method and statistically assessed using the log-rank test. Three Cox models with stepwise adjustments for covariates were conducted: Model 1 adjusted for age, sex, and PRS/TyG index; Model 2 adjusted for SES and lifestyle factors plus Model 1; Model 3 incorporated biological factors and health conditions plus Model 2. After adjusting for covariates in Model 3, the restricted cubic spline (RCS) model was fitted to examine the dose–response relationship between continuous TyG index and depression incidence.
To gauge the contribution of covariates in explaining the TyG index–depression association, the percentage of excess risk mediated (PERM [%]) (Lin, Fleming, & De Gruttola, Reference Lin, Fleming and De Gruttola1997) was calculated by (HR(age, sex, and PRS adjusted) – HR(age, sex, PRS, and risk factors adjusted))/(HR(age, sex, and PRS adjusted) − 1) × 100 for the following groups and individual risk factors: (1) SES (education, employment, and TDI); (2) lifestyles (smoking, drinking, PA, and sleep duration); (3) biological (BMI and TC); (4) health conditions (hypertension, diabetes, and CVD); and (5) all factors. Age, sex, and PRS adjustments were applied to all the above models. The method has been validated by previous research (Elovainio et al., Reference Elovainio, Hakulinen, Pulkki-Råback, Virtanen, Josefsson, Jokela and Kivimäki2017).
Using participants with low genetic predisposition and the TyG index in Q1 as the reference group, the joint associations of the TyG index and genetic predisposition categories with the risk of incident depression were evaluated by creating 12 distinct combinations. Also, the TyG index–depression association was estimated at different genetic predisposition categories. To investigate whether genetic predisposition to depression modified the association of the TyG index with incident depression, the Cox model, adjusting for covariates in Model 3, was used to examine the multiplicative interaction by introducing an interaction term for the TyG index and genetic predisposition. The likelihood test was performed to test the significance of the multiplicative interaction. An additive interaction model was constructed and assessed by the relative excess risk due to interaction (RERI), the attributable proportion due to interaction (AP), and the synergy index (SI) (Li & Chambless, Reference Li and Chambless2007). An additive interaction was confirmed when the 95% CI for the RERI and the AP did not include 0, or when the 95% CI for the SI excluded 1(Li & Chambless, Reference Li and Chambless2007).
Several additional analyses were conducted to assess the robustness of study findings. First, to minimize the effect of residual confounders, Model 3 further adjusted for family history of depression, as well as preexisting Parkinson’s disease (PD) and dementia at baseline, which have been reported to co-occur with depression or to be associated with its onset (Goodarzi et al., Reference Goodarzi, Mrklas, Roberts, Jette, Pringsheim and Holroyd-Leduc2016; Huang, Gan, Yang, Cheng, & Yu, Reference Huang, Gan, Yang, Cheng and Yu2024). Second, to mitigate reverse causation bias, we respectively eliminated participants with CVD and cancer at baseline, and depression cases occurring within the first 2 years of follow-up. Third, given the potential bias of excluding missing data for covariates, we performed repeated analyses using imputed data for missing covariates through multiple imputation techniques using the ‘mice’ package in R. Five imputed datasets were generated with 20 iterations each to ensure convergence and stability of the imputation process. The estimates from Cox proportional hazards regression models were then pooled across the imputed datasets using Rubin’s rules (White & Royston, Reference White and Royston2009). Fourth, to minimize potential bias from pre-existing depressive symptoms, we further adjusted for baseline depressive symptoms as assessed by the Patient Health Questionnaire-2 (Harshfield et al., Reference Harshfield, Pennells, Schwartz, Willeit, Kaptoge, Bell and Davidson2020). Fifth, we reanalyzed the association between the TyG index and incident depression using a tertile classification of the TyG index. Moreover, we examined the potential modification role of sex, age, SES, smoking, drinking, PA, sleep duration, and BMI on the association between the TyG index and incident depression. The product terms combining the TyG index and these factors were incorporated into Model 3 (excluding the stratification factors). The likelihood ratio test was utilized to test the significance of the modification effect by comparing the models with and without the product terms.
Analyses were conducted with SAS 9.4 (SAS Institute, Cary, NC, USA) and R Statistical Software (version 4.0.2). Statistical significance was defined as a two-tailed P-value below 0.05.
Results
Baseline characteristics
The baseline characteristics of the included 335,586 participants (mean age [SD], 56.8 [8.0] years; 52.3% female) are displayed in Table 1. A total of 14,096 (4.2%) cases of incident depression were recorded during a mean follow-up of 13.1 years (4,379,813 person-years). The mean (SD) of the TyG index was 8.7 (0.6). Participants in higher TyG index groups, compared to those in the Q1 group, were more likely to be older, male, of lower SES (low education, unpaid employment, and high TDI), current or former smokers, physically inactive, experiencing abnormal sleep, and overweight or obese. In addition, they were more likely to suffer from hypercholesterolemia, hypertension, diabetes, and CVD at baseline and to develop depression at follow-up. When describing these characteristics by incident depression status, we achieved similar findings (Supplementary Table S4).
Descriptive statistics of participants by the TyG index

Note: Variables are expressed as N (%) unless otherwise noted; P-values (all <0.001) refer to statistical tests comparing the characteristics of participants across the quartiles of the TyG index, indicating that there are statistically significant differences in the distribution of each characteristic between the quartiles.
Abbreviations: BMI, body mass index; CVD, cardiovascular diseases; PRS, polygenic risk score; SD, standard deviation; TyG, triglyceride–glucose.
Associations of the TyG index and genetic predisposition with incident depression
KM curves showed a monotonically elevated risk of incident depression as the TyG index increased from Q1 to Q4 (log-rank P < 0.001, Supplementary Figure S2). The RCS model indicated no evidence of a nonlinear dose–response relationship between the TyG index and new-onset depression (nonlinear P = 0.482, Figure 1). Elevated TyG index at baseline significantly increased the risk of depression (Table 2). In the age-, sex-, and PRS-adjusted model (Model 1), the HR (95% CI) of incident depression for each SD increase in the TyG index was 1.156 (1.137–1.176), and the association was weakened but still present with continued adjustment for covariates. In the fully-adjusted model, compared with participants in the Q1 group of the TyG index, those in the Q2, Q3, and Q4 groups had a 5.1% (HR = 1.051; 95% CI: 1.000–1.104), 7.8% (HR = 1.078; 95% CI: 1.025–1.134), and 14.4% (HR = 1.144; 95% CI: 1.086–1.206) increased risk of depression, respectively (P for trend <0.001). Regarding the genetic predisposition analyses, similar findings were observed (Supplementary Table S5). Participants with moderate or high genetic predisposition had an approximately 15.4% (10.7–20.4%) or 31.2% (26.0–36.7%) higher risk of depression compared to those with low genetic predisposition.
Dose–response relationship between continuous TyG index and incidence risk of depression. Adjusted for age, sex, polygenic risk score, education, employment, Townsend Deprivation Index, smoking status, drinking status, physical activity, sleep duration, body mass index, hypercholesterolemia, hypertension, diabetes, and cardiovascular disease. CI, confidence interval; HR, hazards ratio; TyG, triglyceride–glucose.

Associations of the TyG index with risk of incident depression

Model 1 was adjusted for age, sex, and polygenic risk score.
Model 2 was adjusted for model 1 plus education, employment, Townsend Deprivation Index, smoking status, drinking status, physical activity, and sleep duration.
Model 3 was adjusted for model 2 plus body mass index, hypercholesterolemia, hypertension, diabetes, and cardiovascular diseases.
Abbreviations: CI, confidence interval; HR, hazards ratio; SD, standard deviation; TyG, triglyceride–glucose.
Contribution of risk factors linking the TyG–depression association
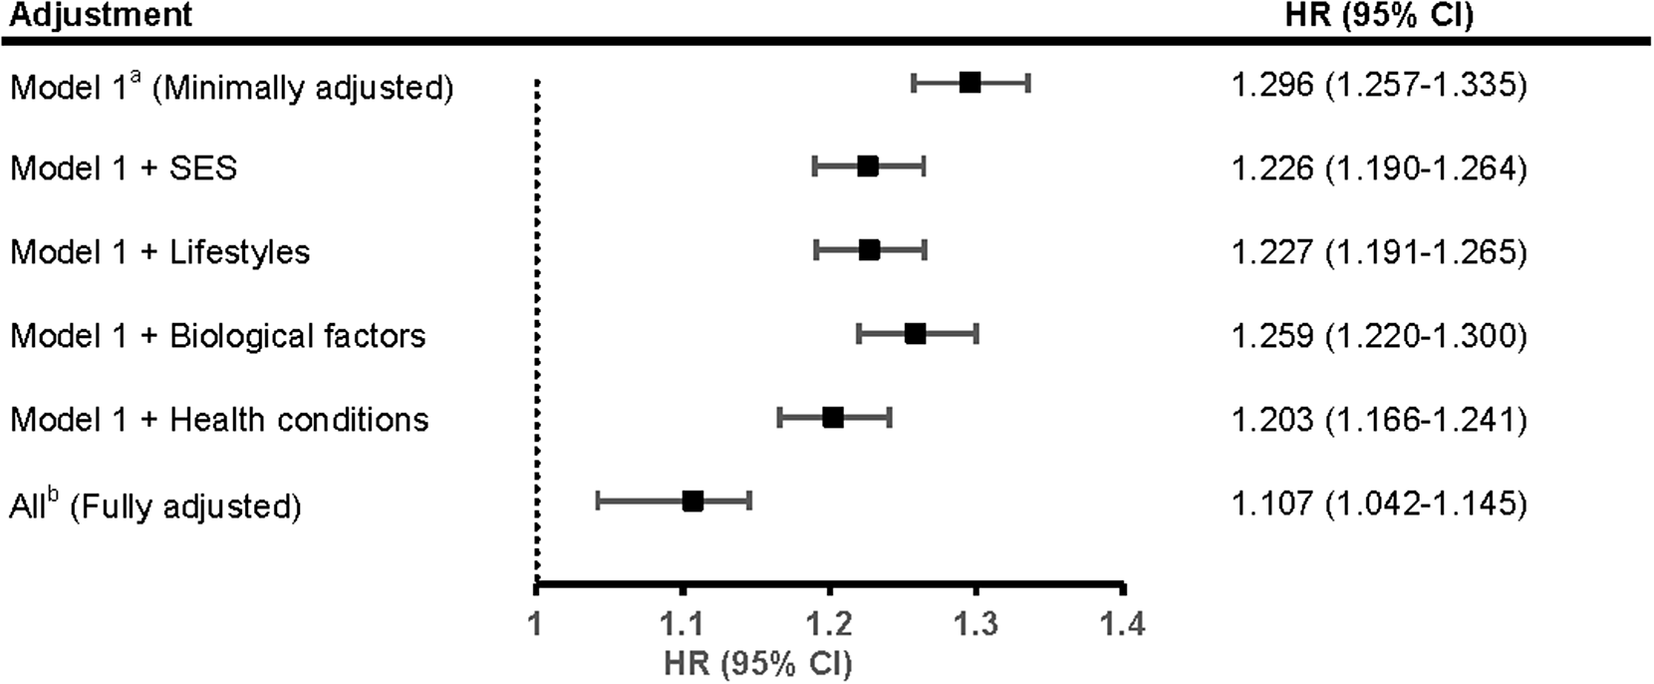
Figure 2 demonstrates the contribution of adjusted risk factors in the association of continuous TyG index with depression incidence. In the minimally adjusted model, each unit increment in the TyG index was associated with a 29.6% (HR = 1.296; 95% CI: 1.257–1.335) higher risk of depression. After adjusting for SES, lifestyles, biological factors, and health conditions, this association was diminished by 23.6% (HR = 1.226; 95% CI: 1.190–1.264), 23.3% (HR = 1.227; 95% CI: 1.191–1.265), 12.5% (HR = 1.259; 95% CI: 1.220–1.300), and 31.4% (HR = 1.203; 95% CI: 1.166–1.241), respectively. In the fully adjusted model, this association persisted (HR = 1.107; 95% CI: 1.166–1.241) but was substantially weakened (PERM = 63.9%). The association was differentially attenuated with adjustment for individual risk factors (Supplementary Table S6), with BMI being the strongest explanatory variable (PERM = 27.0%).
Proportions of the association between continuous TyG index and incident depression attributable to different risk factor sets. aModel 1 was adjusted for age, sex, and PRS. bAll adjusted included age, sex, PRS, education, employment, Townsend Deprivation Index, smoking status, drinking status, physical activity, sleep duration, body mass index, hypercholesterolemia, hypertension, diabetes, and cardiovascular disease. CI, confidence interval; HR, hazards ratio; PERM, percentage of excess risk mediated; PRS, polygenic risk score; SES, socioeconomic status; TyG, triglyceride–glucose.

Joint and interaction analyses of the TyG index and genetic predisposition with incident depression
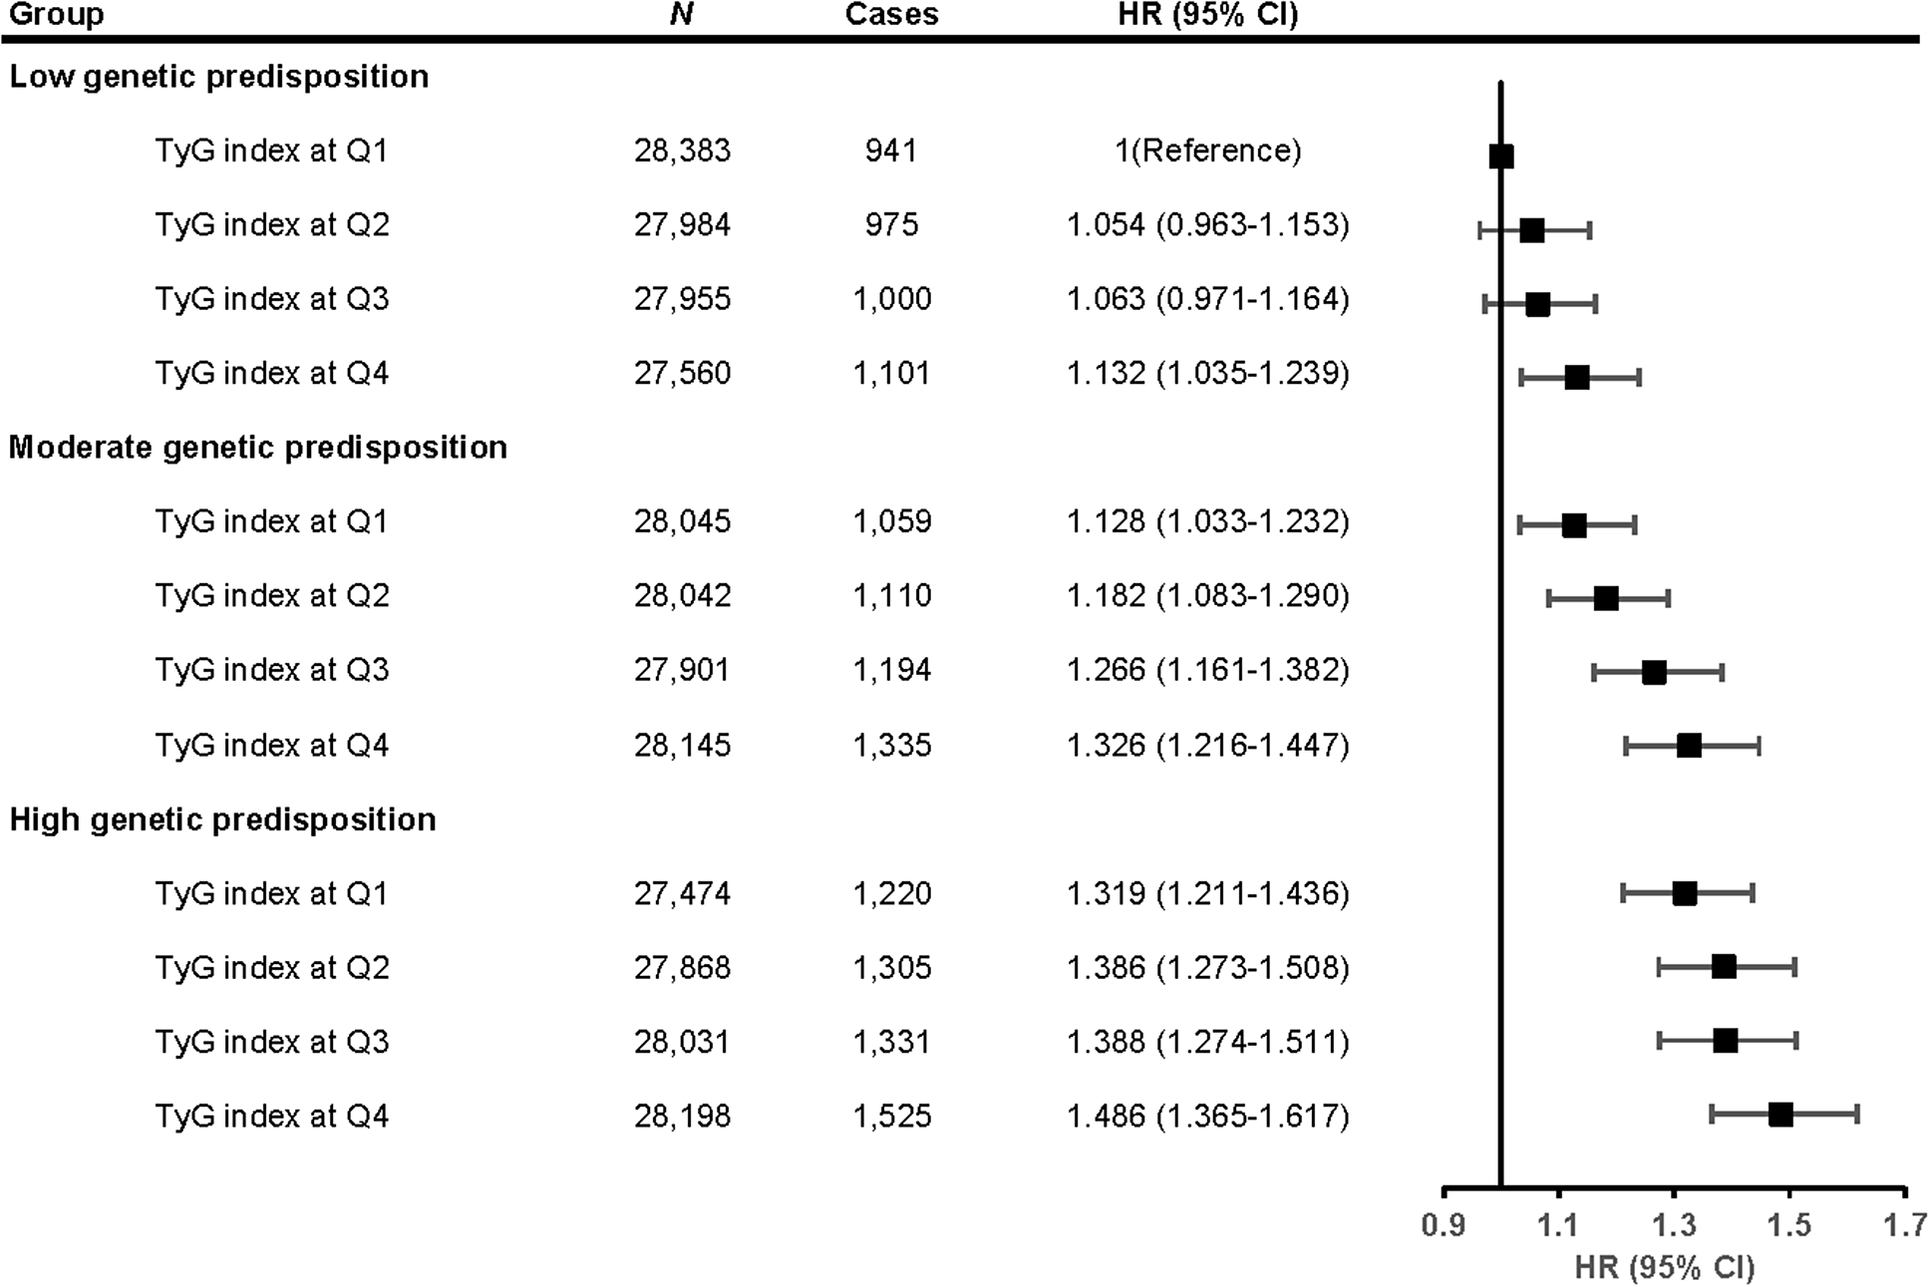
The joint effects of TyG index and genetic predisposition on depression risk were manifested in a dose–response manner (Figure 3). Specifically, compared with participants in Q1 of the TyG index and low genetic predisposition, participants in Q4 of the TyG index and high genetic susceptibility had the highest risk of incident depression (HR = 1.486; 95% CI: 1.365–1.617). The relationship between the TyG index and incident depression was similar across genetic predisposition stratum (Supplementary Figure S3). No significant multiplicative (P for interaction = 0.431) and additive interactions (the 95% CI for the RERI and AP included 0, and the 95% CI for SI contained 1) were identified between the TyG index and genetic predisposition on incident depression (Supplementary Table S7).
Joint associations of the TyG index and genetic predisposition with the risk of incident depression. HRs were adjusted for age, sex, education, employment, Townsend Deprivation Index, smoking status, drinking status, physical activity, sleep duration, body mass index, hypercholesterolemia, hypertension, diabetes, and cardiovascular disease. CI, confidence interval; HR, hazard ratio; Q, Quartile; TyG, triglyceride–glucose.

Sensitivity and subgroup analyses
After further adjustment for covariates, including baseline PD or dementia and family history of depression, the associations of the TyG index and genetic predisposition with incident depression were not substantially modified (Supplementary Table S8). Using different exclusion criteria did not materially change the associations (Supplementary Table S9). When reanalyzed using imputed covariates, the associations remained robust (Supplementary Table S10). The TyG–depression association remained materially unchanged after further adjusting for baseline depressive symptoms (Supplementary Table S11). Adopting the TyG index’s quantile classification did not alter the robustness of the association (Supplementary Table S12). The association between the TyG index and depression risk was similar across subgroups except for age (all P for interaction >0.05) (Supplementary Table S13). Specifically, the detrimental impact of high TyG index on depression was more pronounced in younger individuals compared to older participants (P for interaction <0.001).
Discussion
Using a prospective cohort with a mean follow-up of more than 13 years, we observed that an elevated TyG index was linearly associated with an increased risk of incident depression, independent of genetic factors. Per unit increase in the TyG index, the risk of depression incidence increased by 10.7%. All adjusted risk factors, including SES, lifestyle, biological factors, and health conditions, might account for 63.9% of the association. Moreover, the joint analyses unveiled that the greatest increase in depression risk was observed among those with a high TyG index and high genetic predisposition, although no significant interactions were observed.
To our knowledge, this is the first prospective study to explore the relationship between the TyG index and the incidence of clinically diagnosed depression, extending prior findings based largely on cross-sectional designs (Jin et al., Reference Jin, Lv, Liang, Teng, Gao, Zhang and Li2023; Shi et al., Reference Shi, Zheng, Cai and Qian2021; Wang et al., Reference Wang, Zhang, Li, Gui, Mei, Yang and Zhang2023; Zhang et al., Reference Zhang, Hou, Fei, Zhang, Gao, Liu and Lv2023; Zhang et al., Reference Zhang, Zhao, Guo, Yang and Liu2024; Zheng et al., Reference Zheng, Cui, Yue, Yan, Zhang, Ding and Ren2023). Previous studies have yielded mixed results. While several cross-sectional studies conducted in the United States and China suggested a positive association between TyG index and depressive symptoms (Jin et al., Reference Jin, Lv, Liang, Teng, Gao, Zhang and Li2023; Shi et al., Reference Shi, Zheng, Cai and Qian2021; Zhang et al., Reference Zhang, Hou, Fei, Zhang, Gao, Liu and Lv2023; X. Zhang et al., Reference Zhang, Zhao, Guo, Yang and Liu2024), others found no significant relationship (Wang et al., Reference Wang, Zhang, Li, Gui, Mei, Yang and Zhang2023). Importantly, these earlier studies did not distinguish between depressive symptoms and clinical diagnoses (Jin et al., Reference Jin, Lv, Liang, Teng, Gao, Zhang and Li2023; Shi et al., Reference Shi, Zheng, Cai and Qian2021; Wang et al., Reference Wang, Zhang, Li, Gui, Mei, Yang and Zhang2023; S. Zhang et al., Reference Zhang, Hou, Fei, Zhang, Gao, Liu and Lv2023; X. Zhang et al., Reference Zhang, Zhao, Guo, Yang and Liu2024; Zheng et al., Reference Zheng, Cui, Yue, Yan, Zhang, Ding and Ren2023), limiting their interpretability. Notably, the only existing longitudinal study focused on symptom change rather than incident depression and reported no baseline differences across TyG groups (Zheng et al., Reference Zheng, Cui, Yue, Yan, Zhang, Ding and Ren2023). Based on a large-scale prospective survey, our findings build on and clarify these prior observations by demonstrating that higher TyG index levels at baseline were associated with an increased risk of incident depression. Given the accessibility of the TyG index, our findings may have clinical and public health relevance, suggesting that the TyG index could be considered in future depression risk assessments. Specifically, the TyG index reflects a potentially modifiable metabolic profile and thus may represent a potentially actionable indicator rather than a fixed characteristic. Lifestyle strategies that improve insulin sensitivity and metabolic health, such as dietary improvement, increased physical activity, and weight management (Crandall, Dabelea, Knowler, Nathan, & Temprosa, Reference Crandall, Dabelea, Knowler, Nathan and Temprosa2025), may help reduce elevated TyG levels. In this context, the TyG index is best viewed primarily as a dynamic ‘state’ marker that may vary over time. Future interventional studies are warranted to determine whether sustained reductions in TyG or improvement of related metabolic pathways translate into a lower risk of incident depression.
The study also examined whether this TyG–depression association was influenced by genetic predisposition to depression. Similar to previous studies (Fu et al., Reference Fu, Liu, Liang, Weng, Li, Xu and Gu2022; J. Lin et al., Reference Lin, Yang, Zhang, Cao, Li, Sun and Wang2023), individuals with high genetic risk had an increased risk of depression. Moreover, we found that this association was independent of genetic predisposition, suggesting that reducing the TyG index may contribute to lowering depression risk, regardless of genetic predisposition. Similar to our findings, Gao et al. reported that maintaining a high Life’s Simple 7 score, an American Heart Association-proposed metric of cardiovascular health that includes seven modifiable health components (BMI, blood pressure, lipids, blood glucose, physical activity, smoking status, and diet) (Lloyd-Jones et al., Reference Lloyd-Jones, Hong, Labarthe, Mozaffarian, Appel, Van Horn and Rosamond2010), significantly reduced the risk of depression regardless of genetic factors (Gao et al., Reference Gao, Lin, Xu, Luo, Chen, Li and Nie2023). Based on 339,767 middle-aged and older participants, Cao et al. reported that maintaining a healthy lifestyle was associated with a reduced risk of depression regardless of genetic risk (Cao et al., Reference Cao, Yang, Ye, Zhang, Li, Zhao and Wang2021). Although no statistically significant interactions were observed, this study found that individuals with both high TyG index and high genetic predisposition faced the greatest risk of depression, indicating the potential value of considering both factors in risk stratification. Notably, the association between TyG index and depression was more pronounced among individuals under the age of 60 years, which aligns with prior research indicating that the TyG index may have a stronger impact on health outcomes in younger populations (Chen, Wu, Lin, Huang, & Xie, Reference Chen, Wu, Lin, Huang and Xie2023), suggesting that younger individuals may particularly benefit from interventions aimed at lowering TyG index levels.
The study quantified for the first time the contribution of a range of risk factors and confirmed that nearly two-thirds of the TyG–depression association might be explained by these factors, including SES, lifestyle, biological factors, and health conditions. In support of the potential of SES as an explanatory variable, previous studies have confirmed the association of IR with SES (Lawlor et al., Reference Lawlor, Harro, Wedderkopp, Andersen, Sardinha, Riddoch and Davey Smith2005), a significant influencing factor of depression (Elwell-Sutton et al., Reference Elwell-Sutton, Folb, Clark, Fairall, Lund and Bachmann2019). Moreover, we speculated that an elevated TyG index may be linked to increased depression risk through unhealthy lifestyle factors, as this association was weakened by over one-fifth after controlling for these factors, which could be supported by prior findings. For instance, IR has been reported to be related to unhealthy lifestyles (such as smoking and sleep disorders) (Jeong et al., Reference Jeong, Joo, Kwon and Park2021; Pei et al., Reference Pei, Li, Su, Lu, Wang and Wu2023), which are known to be significant risk factors for depression (Cao et al., Reference Cao, Yang, Ye, Zhang, Li, Zhao and Wang2021). Unsurprisingly, this association was most diminished (by 31.4%) after adjusting for common health conditions (hypertension, diabetes, and CVD), suggesting that the TyG index may influence depression risk through pathways involving systemic inflammation, metabolic dysregulation, oxidative stress, and neuroendocrine dysfunction (Luca & Luca, Reference Luca and Luca2019; Nam et al., Reference Nam, Kwon, Jeong, Park, Kwon and Jeong2020), which is in line with previous findings (Shi et al., Reference Shi, Zheng, Cai and Qian2021). Notably, adjusting for BMI accounted for the largest attenuation of the association, consistent with previous findings that link the TyG index to obesity (Kim et al., Reference Kim, Kim, Lee, Taniguchi, Isobe and Oh2023), which is a strong risk factor for depression (Milaneschi, Simmons, van Rossum, & Penninx, Reference Milaneschi, Simmons, van Rossum and Penninx2019). The identification of these modifiable explanatory factors might inform future intervention strategies to mitigate depression risk among individuals with elevated TyG index levels. Future studies are warranted to replicate these findings and further explore the biological mechanisms underlying the observed associations.
Strengths and limitations
Several strengths were evident in the study. The first prospective evidence on the TyG–depression association was provided, filling a gap left by the absence of longitudinal research in this area. The credibility of our findings was bolstered by the large sample size, extended follow-up, comprehensive adjustment for covariates (especially genetic factors), and multiple sensitivity and subgroup analyses. Moreover, the joint and interactive effects of TyG and genetic predisposition on depression risk were quantified for the first time by a prospective design. The precise identification of explanatory factors for this association could guide the formulation of targeted interventions. Yet, several limitations of this study should be mentioned. First, the TyG index is a time-varying metabolic marker; however, because repeated measurements of triglycerides and glucose were available for only a small subset of UK Biobank participants, we were unable to evaluate how changes in TyG over time relate to subsequent depression risk. Second, the generalizability of our findings may be limited due to the ‘healthy volunteer’ bias inherent in the UK Biobank cohort, as participants tend to be healthier and more health-conscious than the general population. Although previous research has demonstrated that the associations between risk factors and health outcomes observed in the UK Biobank are broadly consistent with those from more representative cohorts (Batty, Gale, Kivimäki, Deary, & Bell, Reference Batty, Gale, Kivimäki, Deary and Bell2020), this potential selection bias should still be considered when interpreting the external validity of our findings. Third, since most covariates were self-reported, recall bias was unavoidable. Fourth, as this is an observational study, causal relationships cannot be inferred, and the effects of residual confounding and reverse causality cannot be fully excluded. To partially mitigate the concern of reverse causality, which refers to the possibility that undiagnosed depression at baseline may influence baseline TyG index levels, we conducted sensitivity analyses that excluded depression cases occurring within the first 2 years of follow-up. The robust associations observed in the analysis suggested that reverse causation is unlikely to be a major contributor to our findings. Fifth, excluding missing data on covariates reduced the sample size, but the associations remained similar when replicated using the imputed complete data. Sixth, the participants involved in the study were solely White, necessitating the replication of findings across different ethnic groups. Moreover, depression diagnoses were identified using ICD-10 codes F32 and F33 based on the UK Biobank ‘first occurrence’ field, which does not differentiate between specific subcategories such as F33.4 (recurrent depressive disorder, currently in remission). As a result, some participants with a history of depression in remission might have been misclassified. However, we excluded all individuals with a diagnosis of depression at baseline, and our approach aligns with prior studies using the same dataset (Yang et al., Reference Yang, Wang, Huang, Kelly and Li2023). Finally, approximately one-third of the association remained unexplained by the risk factors identified in this study. Hence, further research is merited to examine additional mediators of the association.
Conclusion
Based on a large prospective cohort study with a mean follow-up of 13.1 years, we observed that the TyG index at baseline was positively associated with the risk of depression, independently of various risk factors, including genetic factors. Integrating TyG index screening with mental health assessments might enhance the early identification of depressed patients at population-wide levels. The excess risk of depression associated with elevated TyG could be explained by unfavorable SES, unhealthy lifestyle, and adverse health conditions.
Supplementary material
To view supplementary material for this article, please visit http://doi.org/10.1017/S0033291726103535.
Acknowledgments
The authors gratefully thank all the participants and professionals contributing to the UK Biobank. This research has been conducted using the UK Biobank Resource (Application No. 91536).
Funding statement
BPL was supported by the Shandong Provincial Natural Science Foundation (No: ZR2021QH310). The funding organizations had no role in the design and conduct of the study; collection, management, analysis, and interpretation of the data; preparation, review, or approval of the manuscript; and decision to submit the manuscript for publication.
Competing interests
The authors declare none.


 Open access