INTRODUCTION
The proportion of community-acquired pneumonia caused by infection with Legionella spp. has been estimated to be at least 2% in industrialized countries based on a study of hospitalized community-acquired pneumonia [Reference Bohte, van Furth and van den Broek1]. The true incidence of Legionnaires' disease (LD) is unknown because of limitations in both detection and reporting. In Denmark, the incidence of LD has been high and quite stable for the past 15 years with an overall incidence of about 20 cases per million [Reference Joseph2].
LD varies geographically, but internationally most of the described geographical differences are still thought to be due to differences in definitions, diagnostic methods, surveillance systems, or data presentation [Reference Bhopal3]. An indefinable part of the differences seems to be due to variability in host susceptibility, or environmental differences, including differences in Legionella strains and their varying virulence [Reference Joseph2, Reference Bhopal3]. To what extent the incidence may differ according to local sources of infection and virulence of the environmental strains is not well described. Some areas or cities report a higher incidence of LD than for the country in general, possibly with residential water systems as a source [Reference Lim4]. Domestic water systems are known to harbour Legionella and to be sources of LD, especially apartment blocks with complex hot-water systems [Reference Heudorf5].
LD has been a notifiable disease in Denmark since 1980, and throughout the years a high incidence of non-outbreak cases has been recorded. Until the present study, the surveillance system had primarily analysed the incidence in LD at the county level, where the underlying population varies between 200 000 and 650 000 inhabitants. The overall aim of the present study was to explore if the surveillance system could be improved by enhancing its capacity to detect local clusters of LD. Specifically, we used historical data from 1990 to 2005 to analyse variation in the incidence of sporadic LD in time and space in a geographical information system (GIS) by the application of a grid model and assessed the validity of this model by analysing variation according to position of the grids.
METHODS
Study population
The Danish case definition of LD includes: isolation of Legionella by culture, or a ⩾fourfold increase in antibody titre to ⩾1:128 in immunofluorescence antibody test (IFAT) to Legionella pneumophila serogroup (sg) 1, 3, or 6, or detection of L. pneumophila antigen in urine, or a combination of positive Legionella polymerase chain reaction (PCR) on respiratory secretions and a presumptive positive serological result [rise in titre to non-sg 1, 3 or 6 or positive reaction (titre ⩾1:256) for any serogroup] or a borderline positive urinary antigen test.
In the period from 1980 to May 2005, a total of 1964 cases of LD were notified to Statens Serum Institut, Copenhagen, which is the national institute for surveillance of communicable diseases in Denmark. Only sporadic confirmed cases of LD (n=673) were eligible for the present study, and the period 1980–1989 was excluded because of low numbers (n=38) (Table 1).
Number of sporadic and confirmed cases of Legionnaires' disease (LD) in Denmark, 1980–2005
* Period 2000–May 2005.
Sporadic cases were defined as patients fulfilling the case definition who had not acquired the infection during travel or at a healthcare facility, or were associated with recognized outbreaks. In the study period, no outbreaks had been identified in Denmark. However, four cases were registered as part of two possible community clusters and three subjects were each registered separately as part of a possible community cluster without further information. The seven subjects were kept in the analyses. In total, we included 606 sporadic cases of LD (1990–2005) with a known address at the time of disease.
Application of the grid model
Every person with LD was registered according to their home address at time of diagnosis linking the surveillance database with the Danish civil registry system which contains historical and current addresses of Danish residents. Almost all addresses in Denmark have been geocoded, providing all postal addresses with x and y coordinates indicating their geographic position to an accuracy of <3 m. The address code is a unique code for any address and includes the municipality code, street code and house number [Reference Hansen, Poulstrup and Briggs6]. The geographical x and y coordinates of every home address were coded in GIS software (ArcView GIS 3.3, India).
The Danish Statistical Office (Danmarks Statistik) supplied the numbers of citizens in a 100×100 m grid for 2 years (1992, 2002). The number of citizens within each cell was used to calculate the incidence of LD in each cell for the time periods 1990–1994, 1995–1999, and 2000–2005.
A grid net composed of 10×10 km cells was superimposed on a map Denmark, and the population and number of cases for each cell were calculated. The calculation was iterated 25 times, shifting the grid net systematically in x and y directions, in 2-km steps, thus resulting in 25 grids. Denmark has a population of 5·4 million (2005). The mean population density of the ~620 populated cells was ~8600. The number of populated cells and mean population density depend slightly on the position of the grid.
We defined cells of interest, representing potential clusters or outbreaks, to be cells with an incidence higher than the upper limit of the 95% and 99% confidence intervals (CI). In each period, a Poisson distribution was used to identify such cells with an excess number of cases. We assumed that the number of cases in each cell had a natural variability that could be described by a Poisson model, and that the number of cases in a cell was independent of the numbers in neighbouring cells. The null hypothesis was that the true underlying rate that generated the cases observed in a given cell was the same as the underlying rate overall in the country [Reference Olsen, Martuzzi and Elliott7].
In the analysis of the sensitivity of the random grid, coefficient of variation was used as a measure of the replicability of the different grid measurements [Reference Dawson and Trapp8]. Coefficient of variation describes the variation in number of cells with excess incidence of LD within each grid for the three time periods. In the analysis of coefficients of variation and in the overall interpretation of the results, we excluded cells with one case only to avoid significance merely because of a low population density. We assumed that only cells with more than one case of LD were of interest in the identification of possible clusters. Stata version 9.2 (StataCorp., USA) was used in the statistical analysis.
The study was approved by the Danish Data Protection Agency.
RESULTS
Geographical variation
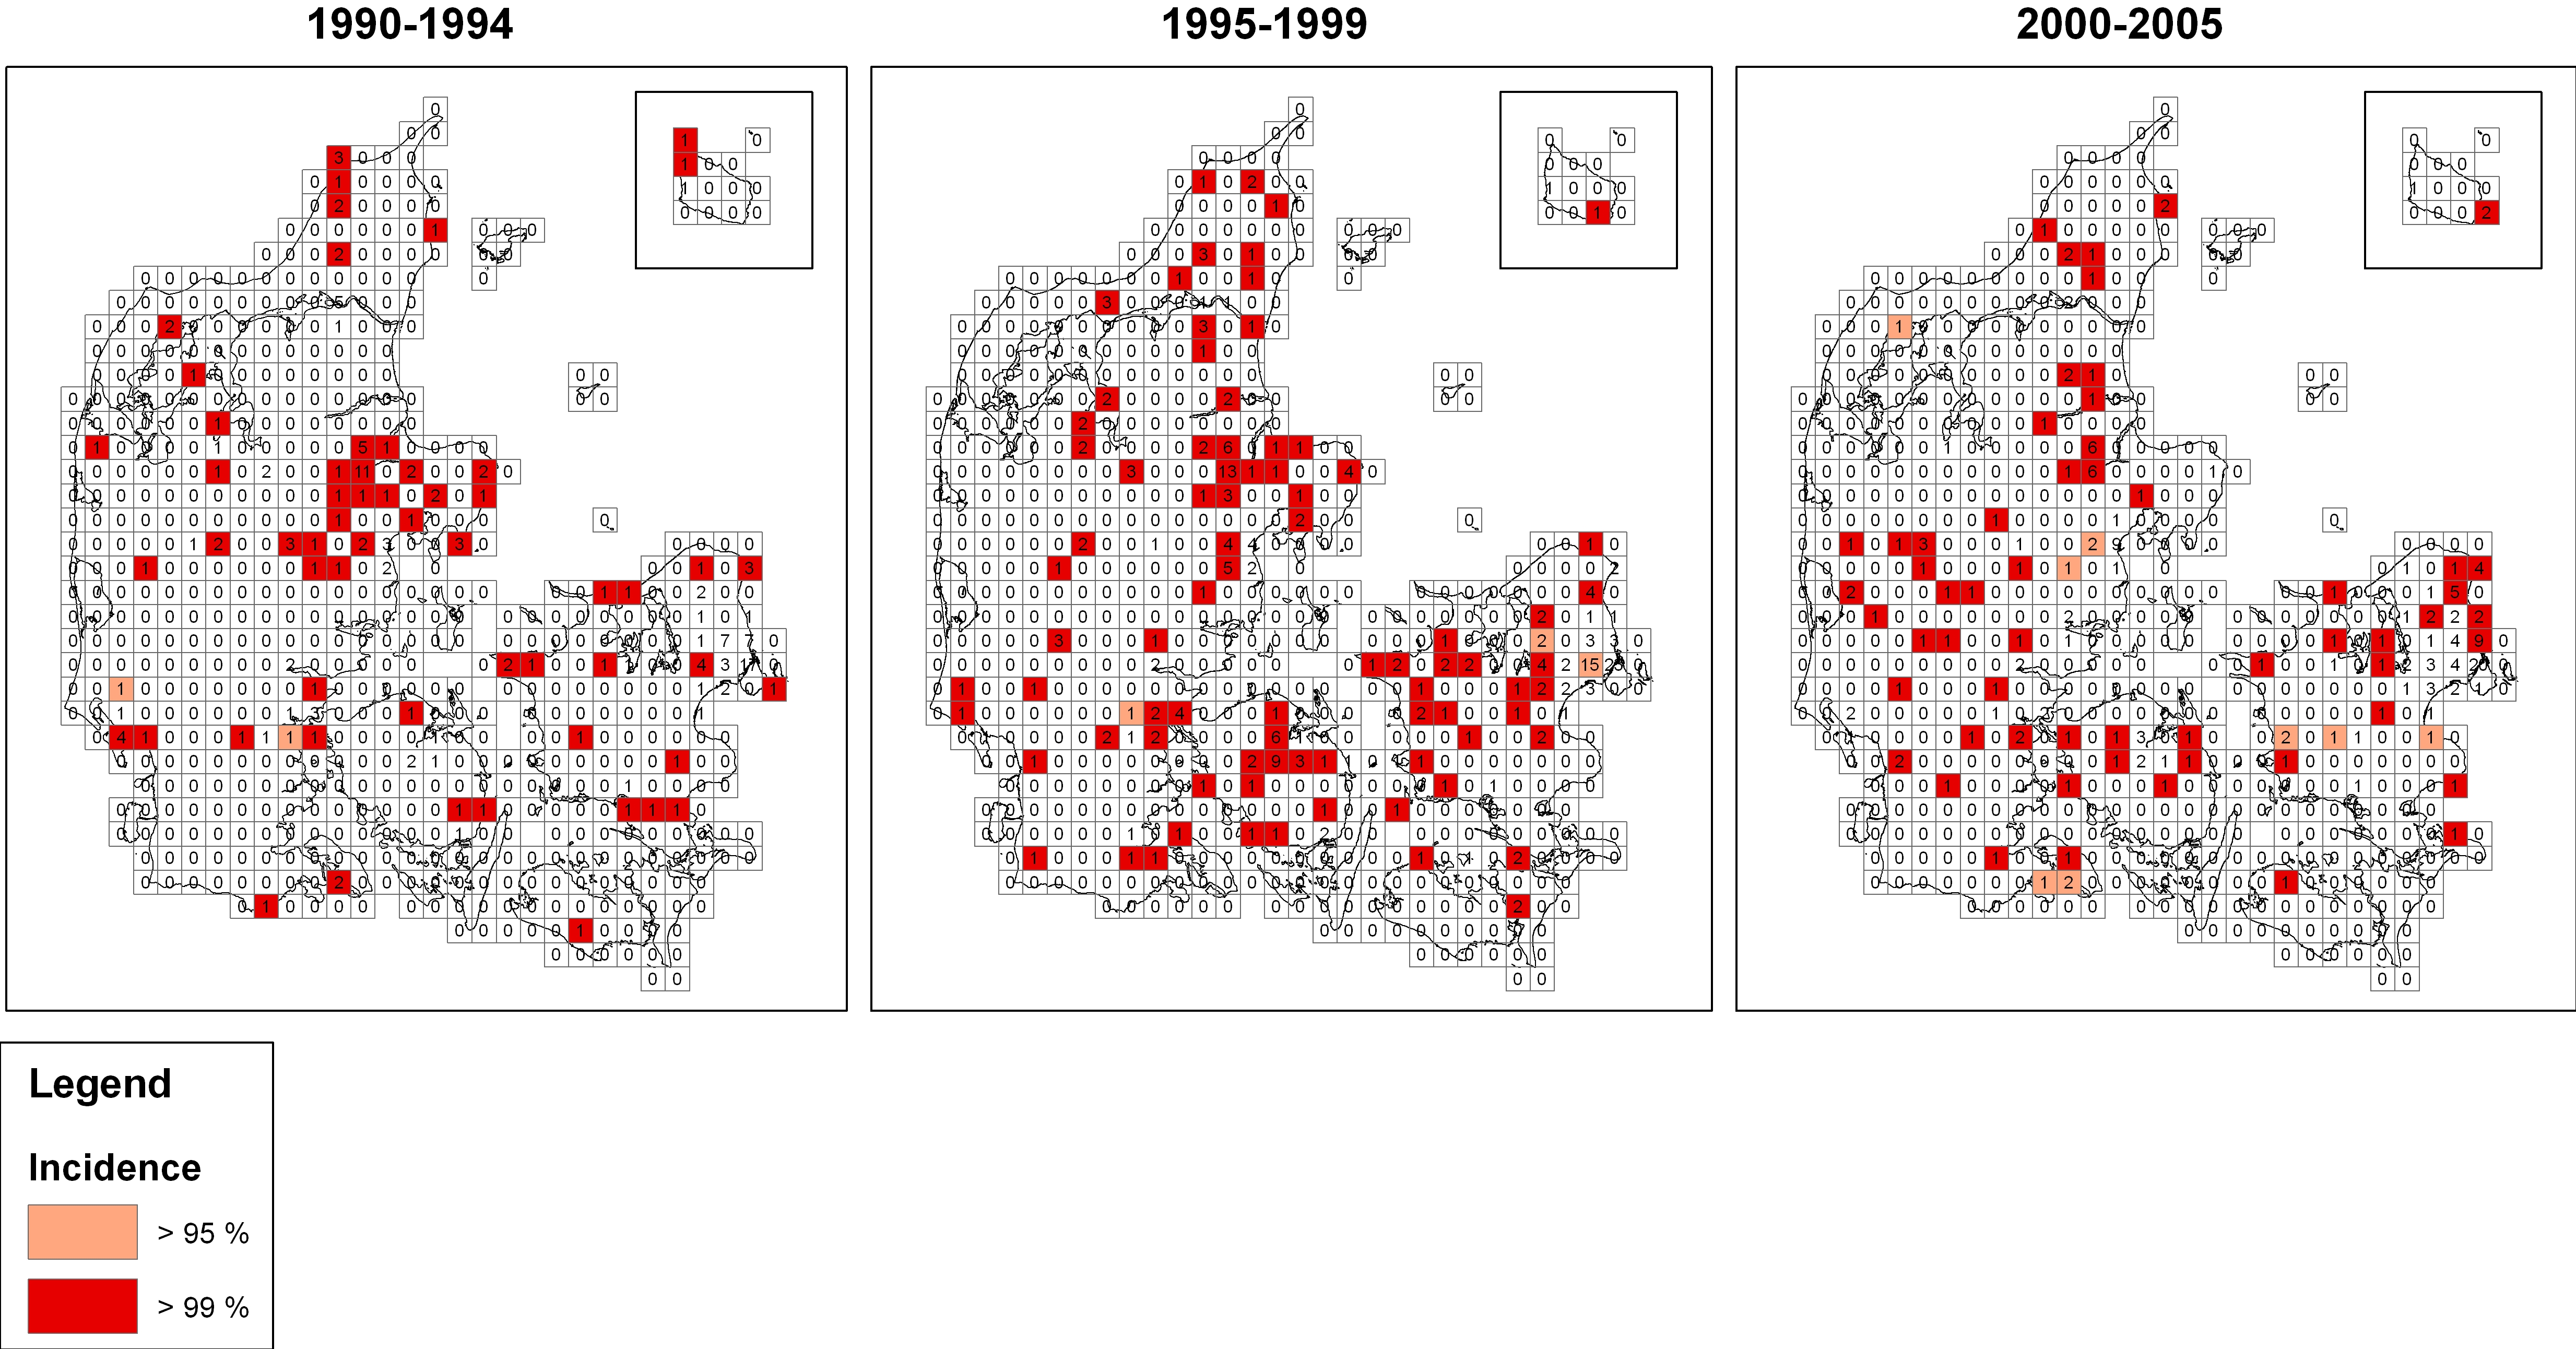
Every case of sporadic LD was included in the random grid (Fig. 1) to visually demonstrate the geographical variation in incidence.
Incidence of sporadic Legionnaires' disease in a random grid. Denmark, three periods during 1990–2005. ![]() , >97·5 incidence;
, >97·5 incidence; ![]() , >99·5 incidence. (A larger, colour version of this figure is available online.)
, >99·5 incidence. (A larger, colour version of this figure is available online.)

Three cells had excess incidence in two time periods, and four cells had excess incidence (95% CI) in all three time periods when cells with only one case were excluded.
Testing of the grid model
The grid net was shifted systematically by 2 km in x or y directions for every calculation of incidence in the cells (Fig. 2). The number of cells with excess incidence in the different grids varied from 22 to 33 cells in the three periods when the threshold of 95% CI was applied, and varied from 21 to 32 cells when the threshold of 99% CI was applied. Coefficient of variation in number of cells with excess incidence in the three periods was 0·107, 0·086, and 0·076 (95% CI). Coefficient of variation in number of cells with excess incidence in the three periods was similar when the 99% threshold was applied (0·114, 0·094, 0·077). Number of cells with excess incidence through all three periods varied from 1 to 5 with a mean of 3·2 and a coefficient of variation of 0·32 (95% CI). These cells were considered to represent areas with a probable persistently high incidence of LD.
Testing of variations in offset of the grid model by the application of 25 grids. The figure shows grid position (changes in x and y coordinates in 2-km steps) and number of cells with incidence exceeding a 97·5% threshold.

The position of cells with excess incidence was roughly similar in the different grids.
DISCUSSION
A relatively simple grid model applied on routine surveillance data could visualize a limited number of geographical areas with a high incidence of LD. Repeated excess incidence over time was of special interest to reduce the risk of chance findings. Furthermore, the finding was relatively insensitive to the offset of the grid, as illustrated by a low coefficient of variation.
The use of GIS to improve exposure assessment and assess the spatial distribution of diseases is increasing [Reference Ward and Wartenberg9]. GIS as a tool has been applied in the general registration of infectious diseases [Reference Rolfhamre, Grabowska and Ekdahl10], but to our knowledge has not been described in use in a continuous surveillance model. Examples of previous GIS applications include spatial analysis of several infectious diseases, e.g. Campylobacter infections, which are partly environmentally acquired [Reference Ethelberg11], and several studies of animal diseases [Reference Nygard12–Reference Conraths, Staubach and Tackmann15]. LD is an infectious disease that is only environmentally acquired without human-to-human transmission. LD is therefore an obvious candidate for GIS-based surveillance with the aim of describing and monitoring spatial distribution, both continuously as a tool to detect clusters and also analytically in verified outbreaks. GIS has successfully been used in outbreaks to determine possible sources [Reference Nygard16].
Description of geographical variation of LD according to residence was described in Scotland from 1978 to 1986, but geographical variations have not otherwise been described historically for a lengthy period. These space–time clusters in Scotland in town areas were described according to residential postcode [Reference Bhopal, Diggle and Rowlingson17, Reference Bhopal18]. These studies were before GIS was available. Recently, these findings were reanalysed by the use of GIS in an effort to develop point-pattern modelling regarding the spatial epidemiology of LD [Reference Dunn19]. GIS has been used in France in an ecological study to describe sporadic LD and exposure to an industrial plume of smoke in postcode areas [Reference Che20]. Postcode areas are not always the most relevant areas in geographical analysis of exposure; smaller or more specific units might be more suitable for some analysis.
The application of a simple grid model with cells of 10×10 km enabled us to identify areas with a persistently high incidence of LD over time. There was only limited variation in number of cells with excess incidence when the cells were shifted from one position of the grid to another with coefficients of variation from 0·07 to 0·11 in the different time periods. In interpretation of these observations, it is necessary to be aware of regional variations in both the diagnostic methods and the use of these methods [Reference Den Boer and Yzerman21]. Denmark is a small country with national recommendations for the use of diagnostic methods, and Statens Serum Institut is the only national institute for surveillance and follow-up of any suspected LD cases, which diminishes the risks of differences in the surveillance registration. A former study showed no differences in use of diagnostic methods in a large county of 650 000 inhabitants [Reference Rudbeck and Hansen22]. By chance, we previously detected this high-incidence area in a specific municipality (Randers) of 62 000 inhabitants, and have since performed further studies in the area with comparison to other areas [Reference Rudbeck, Mølbak and Uldum23, Reference Rudbeck, Mølbak and Uldum24]. The same high-incidence area (Randers) was identified in the present study, and it is unlikely that this area represents an artefact. The high-incidence area was not detected by the present surveillance system where routine analyses are limited to the county level.
One issue of concern is based on the fact that the offset of the cells are randomly located, and it is possible to overlook some clusters due to intersections through a possible geographical cluster. To overcome intersection problems a model with variable grids can be used. Although this concept is scientifically sound, the trade-off relates to the fact that large computer calculation capacities are demanded for such iterations. In the present study, the sensitivity analyses with variations of the offsets of the grids suggest acceptable coefficient of variation. This indicates that in some circumstances, depending on purpose, a random grid may be acceptable for description. We used a grid size of 10×10 km based on previous practical experience [Reference Rudbeck and Hansen22]. The relevant size of the cells in the grid will vary, because it depends on both numbers of LD and the population density in the areas. Further studies of interaction between cell sizes, numbers of individuals with disease, and population density are needed. It is also important to address the relevant threshold of excess incidence for detection of clusters.
Only cells with more than one case of LD are relevant in detecting clusters. In the analysis of grid offset we increased the limit to more than one case per cell for cluster definition. Our distribution of cases of LD and population density makes it unnecessary to use other calculations to overcome noise due to low numbers.
As previously mentioned, the persistent high incidence in two neighbouring cells, covering Randers, confirms a previous study [Reference Rudbeck and Hansen22]. This demonstrates to some extent the validity of the model because cells with a known high incidence were detected. Additionally, the present study included two registered community clusters of two cases each. The community cluster in 1999 was detected in our analyses, whereas the community cluster in 2000 was not detected. The cluster in 2000 was in the capital, Copenhagen, within an area with a very high population density. High-density population areas may need a grid net with smaller cells than we have used for the whole country. The cases of LD have been coded and mapped only according to residence; other addresses, e.g. workplace, could be important for mapping in GIS. The sources of a historical cluster can be difficult if not impossible to determine compared to more recent clusters. In future surveillance, it will be possible to register important individual information, and to look for further causal relations or sources. The surveillance may be further improved by including microbiological information such as serogroups and subgroups and other typing results for the causative agents, thereby increasing the possibility of detecting specific clusters, and increasing the possibility of detecting an environmental or domestic source. The intention with the model was to show that historical data in a grid model may be useful in a future surveillance model in GIS as a continuously updated background layer. To make the model practical for surveillance, we kept it simple. It was not intended to take into account any individual risk factors, or to make any formal cluster calculations [Reference Olsen, Martuzzi and Elliott7, Reference Elliott and Wartenberg25].
We have described the geographical variation of sporadic LD in a simple geographical grid model in GIS. By the application of a random grid model and the use of historical data, we have demonstrated that the surveillance of LD may be improved to enhance the ability to detect and specify small areas that need further attention; high-incidence areas not discovered by the present surveillance system of large geographical areas. Surveillance for LD and capacity for cluster detection may be improved by routine application of this tool.
ACKNOWLEDGEMENTS
We thank Den Obelske Familiefond, Aalborg, and Aarhus University Hospital, Aalborg for financial support.
NOTE
Supplementary material accompanies this paper on the Journal's website (http://journals.cambridge.org/hyg).
DECLARATION OF INTEREST
None.