


INTRODUCTION
Many diseases occur in livestock and wildlife [Reference Delahay, Smith and Hutchings1]. Bovine tuberculosis (bTB) caused by Mycobacterium bovis is such a disease. The disease occurs in many parts of the world including New Zealand where bTB occurs in cattle and in many wildlife [Reference Ryan2] such as brushtail possum (Trichosurus vulpecula) [Reference Coleman, Caley and Montague3], red deer (Cervus elaphus) [Reference Nugent4] and ferrets (Mustela furo) [Reference Caley and Hone5]. Modelling has estimated a threshold possum density for tuberculosis (TB) eradication [Reference Barlow6] implying reducing and keeping possum density below that threshold density would lead to TB eradication from possum populations.
There is evidence of association of bTB in livestock and wildlife species, such as in cattle and brushtail possum in New Zealand [Reference Barlow7, Reference Barlow8] and in cattle and badgers (Meles meles) in Britain [Reference Hone and Donnelly9, Reference Donnelly and Hone10]. In New Zealand and Britain associations between bTB in cattle and in wildlife have been used as a basis for wildlife control, in order to reduce or remove TB infection from cattle herds. Relationships between wildlife disease control and livestock disease were considered possible [Reference Bennett, Smith, Willis, Delahay, Smith and Hutchings11].
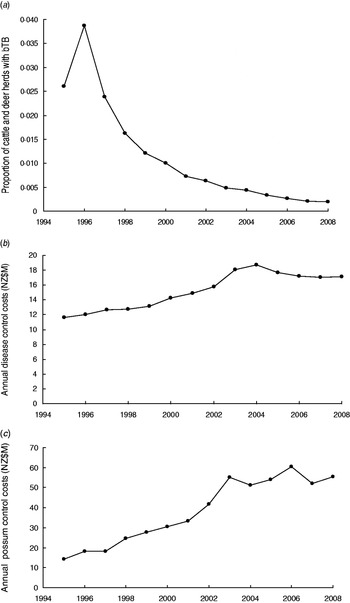
Control of TB in New Zealand is coordinated nationally [Reference Ryan2] with the then aim of reducing the period prevalence of herds with TB to less than 0·2% on an annual basis for 3 years [12] and more recently to eradicate TB from wild animals and have the period prevalence in herds below 0·4% during 2011–2026 [13]. The proportion of cattle plus farmed deer herds with TB, estimated as point prevalence, has declined in recent years (Fig. 1a). Each year money is spent on controlling TB in cattle and farmed deer herds such as by herd testing, culling of reactors, tracing of reactors and movement controls (Fig. 1b), and also on controlling wild animal vectors, especially brushtail possum populations (Fig. 1c). The possibility of re-infection of cattle herds by movement of infected livestock can occur, although movement controls reduce such a possibility. Such movement and re-infection was modelled [Reference Barlow14, Reference Cox15].
(a) Trends in the proportion of cattle and farmed deer herds infected with bovine tuberculosis (bTB) at 30 June each year (point prevalence) in New Zealand. (b) Annual costs (NZ$M) of disease control in cattle and deer herds in New Zealand. (c) Annual costs (NZ$M) of possum (vector) control in New Zealand.
In production economics the principle of diminishing returns [Reference Hardaker, Lewis and McFarlane16, Reference Gans17] states, as applied here, that for each unit increase in inputs (annual costs) there is a progressively smaller change in the response (herds with TB). Ongoing possum control in a part of New Zealand has been shown to be associated with reductions in TB in livestock [Reference Barlow8] in a manner consistent with diminishing returns. Similarly, ongoing control of TB in white-tailed deer (Odocoileus virginianus) in Michigan [Reference O'Brien18] has shown a pattern consistent with diminishing returns. The principle has implications for the long-term success of efforts at TB eradication, namely for the duration and cumulative cost. Diminishing returns with an asymptote above zero suggests that as control costs increase there may be no change in the response variable, i.e. the proportion of herds with bTB. Hence the control costs would be wasted if the aim was eradication.
The aim of this study is to evaluate evidence of diminishing returns and of an asymptotic relationship to provide guidance on whether bTB eradication is feasible relative to 1-year costs of TB control; a positive asymptote implies eradication is not feasible. The results should aid effective TB control.
METHODS
Data on the cattle and farmed deer herds classified by the Animal Health Board (AHB) as infected with bTB at 30 June each year from 1995 to 2008 inclusive were used to estimate the proportion of herds with TB. Data on annual costs of disease control in cattle and farmed deer herds are associated with herd testing, costs of movement control, investigation of cattle and deer herd breakdowns and administration. Data on the costs of each of these components of disease control were not available so the costs are pooled. Individual cattle or deer that are positive reactors on skin test are culled (removed) from a herd. Annual costs of control of wildlife, mainly brushtail possum, are associated with extensive control operations some of which use sodium monofluoroacetate (compound 1080), pest control research, pest monitoring, and pest control administration. Further details are provided in annual reports of the Animal Health Board of New Zealand [12, 13]. Unless otherwise stated, all dollars herein are in millions of New Zealand dollars (NZ$M). Aspects of the economic analysis are recognized here as simplistic, as there are no adjustments to costs associated with inflation, no discounting of future costs and no explicit lagged effects.
The analysis estimated the strength of evidence for each of six models, as alternative hypotheses [Reference Chamberlin19], of the proportion of cattle and farmed deer herds with TB relative to annual disease control costs and annual possum control costs when analysed singularly or in combination. Hence, these analyses estimated the effects of 1 year's control. The analysis used Akaike's Information Criterion corrected for sample size (AICc) and Akaike weights (ω i) for assessing relative strength of evidence [Reference Anderson20].
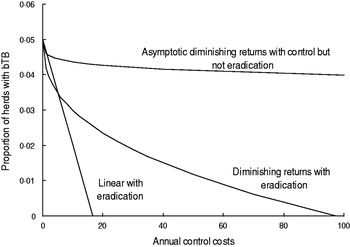
Equilibrium linear and curved models of the relationships (Fig. 2) between the proportion (P) of cattle plus farmed deer herds with TB at 30 June and annual disease (D) and possum (V) control costs were derived (Table 1). The linear model could be stated as a simple statistical model but was derived here from the cattle-possum TB model [Reference Barlow14]. That TB model described disease dynamics in two areas, with transmission from wildlife to livestock in one area. The transmission rate from wildlife to livestock was described by parameter k. In the present study the proportion (P) of herds with TB was assumed to be linearly related to the transmission rate of TB from wildlife (k); P = c + dk. If the transmission rate from wildlife hosts, k, was related to annual possum (vector) control costs (V) so that k = f + gV, then after substitution and rearrangement it can be shown that P = a + bV with b expected to be negative. This is model 1 in the present study (Table 1). Model 1 is simplistic as it does not incorporate diminishing returns or have an asymptote.
The hypothetical relationships between the proportion of cattle plus farmed deer herds with bovine tuberculosis (bTB) in New Zealand at 30 June each year and annual costs of TB control.
Models of the equilibrium relationships between the proportion (P) of cattle plus farmed deer herds with bovine TB at 30 June each year and annual possum (V) control costs and annual disease (D) control costs during the previous 12 months

Models 2, 4 and 6 assume that control costs are greater than 0 and show diminishing returns and an asymptote (a).
The curved models had to satisfy two criteria. First, the curved models must allow for diminishing returns (Fig. 2), which are an expected pattern in production economics [Reference Hardaker, Lewis and McFarlane16, Reference Gans17]. The diminishing returns could occur if disease control starts in locations that are easier and more efficient for disease control and over time control moves or extends to locations wherein control is less effective. Moreover, the sensitivity of TB testing in individual livestock is 0·67 [Reference Cox15], 0·8 [Reference Kean, Barlow and Hickling21] to 0·85 [Reference Ryan2], although it would be expected to be higher if testing occurred at the level of herds, whereas it currently occurs for all individuals in a herd being tested. As a result, it may take repeated testing and several years to remove all infected livestock from an area. The second criterion was that the curved models must allow for the possibility of an asymptote above zero (Fig. 2) which infers that TB eradication is not feasible. Such an asymptote could occur if high levels of herd re-infection from other herds occurred, and such re-infection was included in bTB models [Reference Barlow14, Reference Cox15].
Model 2 was also derived from the cattle-possum TB model [Reference Barlow14] and the badger TB model [Reference Hone and Donnelly9]. In the cattle-possum model it is assumed that the transmission rate from wildlife hosts, k, was related to annual control costs (V) in a power function so that k = gVh. The shape of the relationship is determined by the shape parameter, h. After substitution and rearrangement it can be shown that P = a + b/V when b < 0 and h = − 1. The equation shows diminishing returns to an asymptote (a) (Table 1). This is model 2 in the present study (Table 1). Other models (Table 1) were similarly derived for disease control costs (D) and the sum of vector and disease costs (V + D). The cattle-badger model was used as follows. Equations (13) and (14) in the two-host model [Reference Hone and Donnelly9] can be solved to show that the equilibrium proportion of infectious cattle is inversely proportional to both the rate of culling infectious cattle (h c) and to the rate of culling wildlife (g w badgers). Hence negative, curved (concave-up) relationships are predicted between the proportion of cattle that are infectious and each of the culling rates and these curves would demonstrate diminishing returns. It is assumed here that the annual costs of livestock control (D) are positively related to the livestock culling rate (h c) and the annual costs of possum (vector) control (V) are positively related to the wildlife culling rate (g w).
Models (Table 1, Fig. 2) showed linear (models 1, 3, 5) or curved (models 2, 4, 6) relationships between annual possum control costs (V, models 1 and 2), annual disease control costs (D, models 3 and 4), and combinations thereof (V + D, models 5, 6). Parameters were estimated by linear and nonlinear least squares regression using SAS [Reference Freund and Little22]. Examination of regression residuals occurred to assess evidence of systematic bias as can occur when data depart from the assumptions of regression analysis. Parameter estimates of power models of a curved relationship between the proportion of cattle plus deer herds with TB and curved annual possum costs and curved annual disease costs could not be estimated by the SAS software so are not discussed. The curved models evaluated in this study are recognized as simplistic as they describe monotonic, not complex, curves. The latter with points of inflection were reported in trends in bTB control in a model buffalo (Bubalus bubalis) population [Reference Bradshaw23].
RESULTS
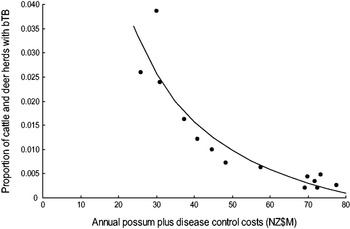
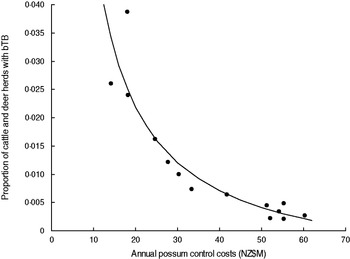
There was most support (ω 6 = 0·551, R 2 = 0·843) for model 6 which related the proportion of cattle and farmed deer herds with bTB (P) to the sum of annual possum control and annual livestock disease control costs (V + D) in a curved (concave-up) relationship (Table 2, Fig. 3). However Figure 3 shows evidence of systematic bias in regression residuals with all data points below the fitted regression line at intermediate levels ($33–70M) of costs. Model 2 regression had residuals scattered above and below the fitted line and so was accepted as the model with more support. Model 2 had a slightly lower Akaike weight (ω 2 = 0·339) and a high coefficient of determination (R 2 = 0·830) and related the proportion of cattle and deer herds with bTB to annual possum control in a curved (concave-up) relationship (Table 2, Fig. 4). The curved relationships (models 2, 4, 6) had virtually all the support (Σω i = 0·952).
The proportion of cattle plus farmed deer herds with bovine tuberculosis (bTB) at 30 June each year in New Zealand and the sum of the annual possum plus disease control costs (NZ$M) for 1995–2008 inclusive. The fitted regression is P = − 0·0139 + (1·1857/(V + D)).
The proportion of cattle plus deer herds with bovine tuberculosis (bTB) at 30 June each year in New Zealand and the annual possum control costs (NZ$M) for 1995–2008 inclusive. The fitted regression is P = − 0·0077 + (0·5906/V).
Measures of (a) model fit and (b) parameter estimates (and 95% CIs) for models of the proportion of cattle plus farmed deer herds with bovine TB (P) and annual possum control costs (V) and annual disease control costs (D)

L, Linear; C, curved relationships; RSS, residual sum of squares; K, number of parameters; ΔAICc, difference from the best model in Akaike's Information Criterion corrected for sample size; ω i, Akaike weight of model i; R 2, coefficient of determination.
The 99% CIs of parameter a of models 2, 4 and 6 are also shown in square brackets. The model with the lowest AICc is shown in bold.
Model 2 provides clear evidence of diminishing returns (Fig. 4). Each curved model (models 2, 4, 6) did not estimate an asymptote above zero (Table 2), implying TB eradication was feasible. Model 2 estimated that the proportion of cattle and deer herds with TB was zero when the annual possum control costs were $76·7M. Note this is based on solving the fitted equation for the intercept on the x axis (i.e. when P = zero); technically eradication in the long term would occur when the proportion of herds was equivalent to less than one herd (and remained less than one herd) in the total number of herds and so the costs would be slightly lower.
DISCUSSION
The ongoing control of bTB in livestock in New Zealand is considered to require disease control in livestock and wildlife [Reference Ryan2]. The strength of evidence analysis presented here suggests the proportion of herds with TB is related more to annual costs of possum control than annual livestock disease control. Model selection analysis of the 1-year possum control costs estimated $77M for TB eradication. The results and their interpretation are tentative as it is recognized they are from an observational, not experimental, study over years and involve some extrapolation. The estimated costs are preliminary as they do not correct for inflation or discounting of future costs, and do not explicitly include any lagged effects. A modelling evaluation of TB control discounted future costs at 10% per year [Reference Ramsey and Efford24].
Diminishing returns [Reference Hardaker, Lewis and McFarlane16, Reference Gans17] was demonstrated by the curved model between a measure of herds with TB and annual control costs (Fig. 4). It was demonstrated here that diminishing returns could be derived from the cattle-possum TB model [Reference Barlow14] and the cattle-badger model [Reference Hone and Donnelly9]. The results complement those of [Reference Barlow8] and [Reference O'Brien18] that imply diminishing returns in bTB control. Relationships between wildlife disease control and livestock disease were considered possible [Reference Bennett, Smith, Willis, Delahay, Smith and Hutchings11] and the present study reports such a relationship (Fig. 4). The management implication is that current TB control efforts can be expected to show progressively smaller changes in TB prevalence for each unit increase in control costs.
The national eradication of TB is possible as shown by the success achieved in Australia [Reference Carter, Delahay, Smith and Hutchings25]. Eradication of TB in New Zealand may not be possible if at least one of several things occur. (1) If control costs stay at current levels, ∼$75M, or decrease over time eradication may not occur. (2) If efficiency declines over time, as may occur with boredom (lack of concentration), resistance of possums to the poison (compound 1080), or sabotage. Implementing a ‘smart’ payment system with increasing benefits (payments) for control over time, may lessen the likelihood of declining concentration or interest. (3) Annual TB control could be disrupted by a severe earthquake, as occurs occasionally in New Zealand and this could disrupt testing and culling of animals, analogous to the disruption to TB testing and control in Britain during the foot-and-mouth disease outbreak in 2001 [Reference Woodroffe26].
The analysis recognizes uncertainty in the support for any one model. Different managers can respond differently to such uncertainty and variation in cost estimates. A risk-averse manager has a preference for safety [Reference Abelson27] so would probably choose the combination of costs that minimizes TB prevalence. The estimated costs would then be very high. A risk-neutral manager would probably use the estimates based on mean costs, and a risk-seeking manager would probably use the estimates based on the lower annual costs. The risk-seeker would assume the lowest costs because of optimism that small costs would achieve the aim of TB eradication.
The analyses reported here do not attempt to evaluate alternative possum and disease control methods. These analyses should be updated periodically to allow revision of estimated effects of livestock and vector control for TB eradication.
ACKNOWLEDGEMENTS
Thanks to P. Livingstone and P. Fairbrother of the Animal Health Board for provision of data and discussions. D. Pedersen is thanked for statistical advice and P. Livingstone and C. Donnelly for comments on a draft manuscript. The University of Canberra is thanked for support. This research received no specific grant from any funding agency, or from commercial or not-for-profit sectors. Anonymous referees are thanked for useful comments.
DECLARATION OF INTEREST
None.



