

1. INTRODUCTION
Under a changing climate the mechanisms of ice motion might be expected to change due to changes in mass balance, ice thickness, ice temperature and the presence of basal water, but there is currently considerable uncertainty concerning the direction and magnitude of these changes. Observations indicating that glaciers do not flow at constant speeds, but rather fluctuate on timescales of hours to days, were made as early as the 1930s on Himalayan glaciers (Finsterwalder and Pillewizer, Reference Finsterwalder and Pillewizer1939) and South Crillon Glacier, Alaska (Washburn and Goldthwait, Reference Washburn and Goldthwait1937). That polar glaciers could also show surface velocity fluctuations on the order of hours was first demonstrated by Battle (Reference Battle1951) at Fröya Glacier in Northeastern Greenland. The notion that meltwater delivered to the glacier bed will reduce friction, increase water pressure and thus promote sliding of the ice over the bed (basal sliding), has been used to explain the short-term (hourly to daily) fluctuations of surface velocities for many temperate glaciers (Iken and others, Reference Iken, Röthlisberger, Flotron and Haeberli1983; Kamb and others, Reference Kamb1985; Iken and Bindschadler, Reference Iken and Bindschadler1986) and polythermal glaciers at higher latitudes (Iken, Reference Iken1974; Bingham and others, Reference Bingham, Nienow and Sharp2003; Copland and others, Reference Copland, Sharp and Nienow2003a; Rippin and others, Reference Rippin, Willis, Arnold, Hodson and Brinkhaus2005).
However, there are limited measurements of multi-decadal changes in glacier velocities. One of the few studies used repeat optical feature-tracking of satellite imagery across several glacierised regions to indicate that the majority of ice masses have decelerated over periods spanning up to 50 years (Heid and Kääb, Reference Heid and Kääb2012). This observed slowdown was mainly attributed to reduced ice flux as a result of negative mass-balance conditions. Hambrey and others (Reference Hambrey2005) inferred changes in ice dynamics at Midre Lovénbreen, Svalbard, using a structural glaciology approach that indicated reduction in dynamic activity since the Neoglacial maximum, ~100 years ago. Other studies of velocity fluctuations of land-terminating glaciers over several decades show periods of acceleration and deceleration associated with corresponding increases or decreases in mass balance and ice thickness (Vincent and others, Reference Vincent, Soruco, Six and Le Meur2009; Mouginot and Rignot, Reference Mouginot and Rignot2015). However, deceleration appears to be the dominant response, particularly in the vicinity of glacier termini (Kaufmann and others, Reference Kaufmann, Kellerer-Pirklbauer, Lieb, Slupetzky, Avian, Li and Yang2015; Tedstone and others, Reference Tedstone2015; Waechter and others, Reference Waechter, Copland and Herdes2015). This paper presents the first insight into the long-term velocity response of a mostly-cold high Arctic glacier and the factors driving these changes.
In the Canadian Arctic Archipelago, which is currently responsible for the largest glacier mass losses outside of the ice sheets (Gardner and others, Reference Gardner2013; Harig and Simons, Reference Harig and Simons2016), multi-decadal changes in ice motion are relatively unknown. Recent velocity maps produced using radar-speckle tracking techniques have revealed that glacier calving is responsible for a small percentage (~7.5%) of glacier mass losses in the Canadian Arctic (Van Wychen and others, Reference Van Wychen2014). Comparison of velocity maps from 2000 and 2011–15 (Van Wychen and others, Reference Van Wychen2016) identified that out of 117 large outlet glaciers on Ellesmere and Axel Heiberg Islands, 7% had slowed by >20 m a–1, 2% had accelerated and 5% showed periods of both acceleration and deceleration. No velocity changes were detectable on the remaining 86% of glaciers, which were generally all slower moving ice masses (<50 m a–1). These previous measurements of changes in glacier velocity in the Canadian Arctic have focused on large ice caps and outlet glaciers, meaning that the long-term velocity changes of slow-moving ice masses (with mean annual velocities of <100 m a–1) remain relatively unknown. While mountain and valley glaciers comprise a minority of glacier-covered area in the Canadian Arctic Archipelago (e.g. 26% on Axel Heiberg Island), they demonstrate a greater sensitivity to climate warming both in terms of area change and mass balance (Dowdeswell and others, Reference Dowdeswell1997; Paul and others, Reference Paul, Kääb, Maisch, Kellenberger and Haeberli2004; Thomson and others, Reference Thomson, Osinski and Ommanney2011). One location where it is possible to study detailed patterns of short- and long-term changes in surface velocities is White Glacier, Axel Heiberg Island, where Almut Iken conducted her first pioneering studies showing that surface meltwater was both able to reach the glacier bed and lead to enhanced subglacial water pressures that facilitated basal sliding (Iken, Reference Iken1974; Flowers, Reference Flowers2010). These observations were corroborated by measurements of englacial ice temperature gradients that supported the existence of a temperate basal ice zone below the equilibrium line (Blatter, Reference Blatter1987). The record of ice velocities at White Glacier, dating from 1960 to 1970, is unprecedented in the Canadian Arctic and provides a unique opportunity to observe changes to the flow regime of a polythermal mountain glacier.
This study focuses on a comparison of annual and seasonal velocity observations measured on White Glacier from 1960 to 1970 (Müller and Iken, Reference Müller and Iken1973; Iken, Reference Iken1974) with contemporary measurements collected between 2012 and 2016 at the same geographic locations. Observed changes in glacier velocities are investigated in terms of the mechanical processes driving ice motion and their variability in a changing climate, including changes to glacier mass balance, ice thickness and englacial temperatures. While limited observational data are available about the subglacial conditions at White Glacier, a comparison of observed and theoretical surface velocities enables us to infer the extent of basal sliding and estimate the dynamic response time of the glacier.
2. STUDY LOCATION
White Glacier is a 40 km2 mountain glacier measuring ~14 km in length, located on Axel Heiberg Island in the Canadian Arctic Archipelago (Fig. 1). It is characterised by ~5 km wide accumulation area, which feeds into a narrow (~1 km wide, 9 km long) valley. Elevations range from 1782 m a.s.l. at the uppermost peak over the accumulation area to 100 m a.s.l. at the glacier terminus. The region experiences mean annual temperatures of ~−20°C and annual precipitation ranges from 58 mm a–1 at sea level (as measured at Eureka, 100 km to the east) to 370 mm a–1 at 2120 m a.s.l. (Cogley and others, Reference Cogley, Adams, Ecclestone, Jung-Rothenhäusler and Ommanney1996).
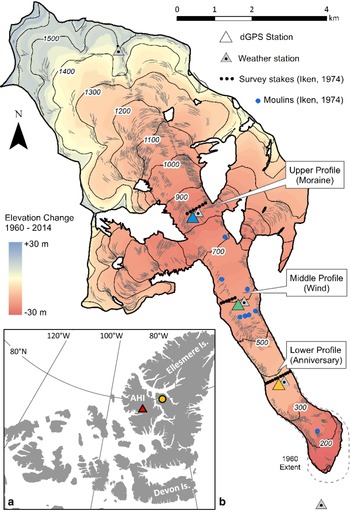
(a) Location of White Glacier on Axel Heiberg Island (red triangle) and the Eureka weather station (yellow circle). (b) Map of White Glacier showing the location of three cross-sectional profiles and the location of crevasses (light grey lines) and moulins (blue circles) identified in Iken (Reference Iken1974) that are still present as of 2014. Field observations suggest a new moulin has formed 100 m southeast of the upper profile, but it is not confirmed if it is regularly active. The colours of the GPS triangles correspond to the profile colours in Figures 2 and 3.

Between 1960 and 1980, White Glacier was the focus of numerous glaciological studies, including mapping campaigns (Haumann and Honegger, Reference Haumann and Honegger1964), englacial temperature observations (Blatter, Reference Blatter1987), deformation and structural elements of the glacier and associated strain patterns at the surface (Hambrey and Müller, Reference Hambrey and Müller1978) and velocity measurements at glacier cross-sectional profiles (Müller and Iken, Reference Müller and Iken1973; Iken, Reference Iken1974). Together, these early studies provide important baseline information for this study, as well as a 55-year mass-balance record. Surface mass-balance measurements have continued on a near annual basis since 1959 and the observed balance has become increasingly negative since 2005 (Cogley and others, Reference Cogley, Adams and Ecclestone2011; Thomson and others, Reference Thomson, Zemp, Copland, Cogley and Ecclestone2016), a trend that was not statistically verifiable between 1960 and 1991 (Cogley and others, Reference Cogley, Adams, Ecclestone, Jung-Rothenhäusler and Ommanney1996). There is good agreement between the cumulative annual surface balance measurements (−213 ± 28 mm w.e. a–1) and the geodetic balance (−178 ± 16 mm w.e. a–1) calculated over the period 1960–2014. The geodetic data indicate that thinning has occurred along the length of the glacier below 1400 m a.s.l. since 1960, with losses exceeding 50 m near the terminus.
The historic (1960–70) and recent (2012–16) velocity measurements were collected at three profiles located 8.5, 5.5 and 3.2 km from the glacier terminus (Fig. 1). The upper profile (historically referred to as ‘Moraine Profile’) is at 870 m a.s.l. and was located near the mean equilibrium line observed during the 1960s, while the middle (‘Wind Profile’, 580 m a.s.l.) and lower (‘Anniversary Profile’, 370 m a.s.l.) profiles are well within the ablation zone since the onset of measurements at White Glacier. The average equilibrium line altitude (ELA) at the time of early velocity observations (1960–70) was 990 ± 160 m a.s.l. and located ~2 km up-glacier of the upper profile, but has risen to 1270 ± 190 m a.s.l. in the last decade (2005–15) (Thomson and others, Reference Thomson, Zemp, Copland, Cogley and Ecclestone2016).
3. METHODS
3.1. Velocity observations 1960–70
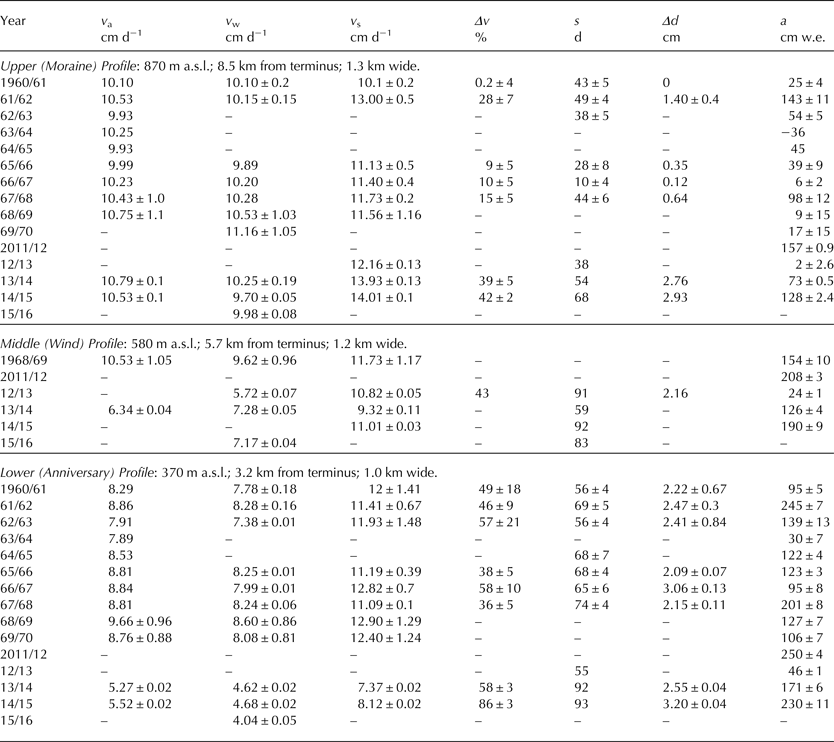
Between 1960 and 1968 measurements of annual (v a), winter (v w) and summer (v s) velocities were compiled in Müller and Iken (Reference Müller and Iken1973), along with calculations of the mean increase in v s over v a (Δv), melt season duration (s), movement increment during the melt season (Δd) and ablation (a). These velocity measurements motivated more detailed studies of daily to seasonal velocity fluctuations by Almut Iken from 1968 to 1970 (Iken, Reference Iken1974); the measurements presented here therefore expand the Müller and Iken (Reference Müller and Iken1973) dataset by a further 2 years (1969/70) using data from Iken (Reference Iken1974), which also incorporates the velocity data recorded at the middle profile.
Glacier velocities were calculated for the upper, middle and lower profiles from repeat stake positions measured by theodolite surveys of baseline cairns set up along the margins of the glacier (Müller and Iken, Reference Müller and Iken1973). The timing of measurements at the onset and end of the melt season enabled the calculation of mean annual and seasonal glacier velocities, with v a being defined as the displacement observed from the start of the winter season to the end of the following summer melt season (e.g. late-summer 1960 to late-summer 1961). Gaps in the data series are associated with a lack of observations either at the onset or end of the melt season.
Velocity errors were calculated from ‘repeated and 180° reversed readings from the two ends of a base line’ and ranged from 0.01 to 1.48 cm d–1 (Müller and Iken, Reference Müller and Iken1973). For each station, the duration of the melt period (s) was defined by the number of days for which the 5-d mean daily temperatures surpassed 0°C. These measurements were collected using thermographs and recorders at each of the three stations (Müller, Reference Müller1963). Ablation at each profile was approximated from the mean annual ablation measured at 5–10 stakes installed across the profile. When in situ observations of ablation or temperature (for the calculation of s) were not available, estimates were made by interpolation between the highest and lowest observation sites, or in a few cases extrapolated from climate data at the Eureka weather station on Ellesmere Island, 100 km east of White Glacier (Fig. 1a; see Environment Canada Archive: http://climate.weather.gc.ca/). The errors in s and a (Table 1) consequently reflect the uncertainties associated with extrapolated climate and ablation data. The representativeness of Eureka climate data for conditions at White Glacier in the early studies (1960–70) is currently unknown, although comparison of summer temperatures at Eureka and temperatures recorded at an automatic weather station located at the White Glacier terminus from 2012 to 2015 indicate that the average difference in mean daily temperatures is <1°C and maximum residuals do not exceed 5°C.
Annual and seasonal velocity changes in the ablation area of White Glacier where: v a = mean annual surface velocity; v w = mean winter surface velocity; v s = mean summer surface velocity; Δv = mean increase of v s over average of preceding and succeeding v w; s = length of ‘summer’ (melt period); Δd = movement increment during melt period = s(v s -v w); a = ablation. Observations from 1960 to 1968 and 1968–70 originate from Müller and Iken (Reference Müller and Iken1973) and Iken (Reference Iken1974), respectively, while observations from 2012 to 2016 result from dGPS measurements conducted in this study

3.2. Velocity observations 2012–16
In 2012, velocity measurements were re-initiated on White Glacier with three Trimble R7 dual-frequency GPS (dGPS) units that were installed at the middle profile in April 2012, at the upper profile in April 2013, and at the lower profile in July 2013. The dGPS antennas were mounted on steel poles drilled ~3.5 m into the ice and were powered using 50–75 amp hour 12 V batteries connected to 20 W solar panels. In 2012 the middle dGPS was initially programmed to collect positions every 15 s for 1 hour between 12h and 13h local time daily, in an effort to prolong the operating period into the winter months. However, starting in spring 2013 all of the dGPS units were run continuously every spring/summer with a 15 s sampling frequency. Post-processing of differential GPS data utilized the Precise Point Positioning (PPP) tool provided by Natural Resources Canada (http://webapp.geod.nrcan.gc.ca/geod/tools-outils/ppp.php), in which the signal timing between ground stations and receiving satellites, alongside well-constrained satellite orbital positions, are used to generate baselines for trilateration and positioning. PPP analysis was conducted using the final satellite orbital information, which is released 10 d after data acquisition. This provides three-dimensional (x, y, z) accuracies of ~ ± 2 cm for an observation period of 1 hour.
For comparison with the Müller and Iken (Reference Müller and Iken1973) and Iken (Reference Iken1974) datasets, it was first necessary to define the span of the melt season (s) within which v s would be calculated, and the final day of the melt period that defines the start of the v w and v a sample period. As in the earlier studies, s was defined as the period in which the 5-d mean daily temperature surpassed 0°C. Shielded HOBO-U23 temperature/relative humidity loggers mounted on poles 1–3 m above the ice at each dGPS station were used to calculate s and data gaps were filled by modeled temperatures using daily temperature lapse-rates derived from two automatic weather stations at the glacier terminus (35 m a.s.l.) and an upper nunatak (1511 m a.s.l.) (Fig. 1). Annual ablation (a) was modelled for each station using the annual mass-balance gradient determined from stake measurements along the glacier centreline. The goodness of fit of the polynomial (n = 3) expression of mass-balance gradient that is used to calculate glacier-wide surface mass balance shows a goodness of fit (R 2) >0.9 for >90% of the 55 years with observations, and a fit >0.95 for >65% of the record. The mean summer velocity (v s) is determined from displacement between the daily mean positions of the first and last days of s, divided by s. Errors in dGPS-derived velocities are based on a calculation of the RMSE combining the standard deviations of the daily positions divided by the duration of s. Throughout this paper velocity should be considered as surface displacement in the down-glacier direction.
3.3. Surface elevations
The 1:10000 map of White Glacier by Haumann and Honegger (Reference Haumann and Honegger1964) was used as the primary source of ice surface elevations between 1960 and 1970. This map, plotted in a local planar coordinate system with 10 m contours (vertical accuracy considered to be 5 m) was created using a combination of field-based surveying and photogrammetry methods. A summary of the mapping techniques for Haumann and Honegger (Reference Haumann and Honegger1964) and associated references are provided in the World Glacier Monitoring Service's Fluctuations of Glaciers Maps data archive (http://wgms.ch/products_fog_maps/). A DEM derived from this map was used to extract point elevations along the cross-sectional velocity profiles (Thomson and Copland, Reference Thomson and Copland2016).
Contemporary surface elevations, based on measurements made in 2014, were derived from kinematic dGPS measurements collected with a Trimble R7 system mounted on a skidoo and post-processed with the same online PPP tool as the aforementioned dGPS stations. A 1:10000 map of White Glacier produced using >400 oblique air photos and Structure from Motion photogrammetry methods supported determination of elevations near the glacier margins where dGPS measurements were not possible (Thomson and Copland, Reference Thomson and Copland2016). This map, with a 5 m vertical accuracy, was also valuable in assessing the amplitude and spatial variability of ice thinning along the trunk of White Glacier.
3.4. Ice thickness
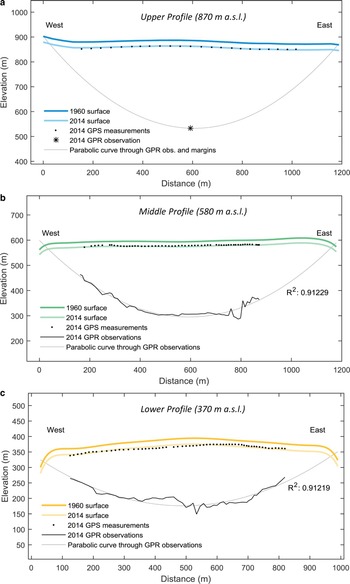
Cross-sectional ice depth profiles for the three stations were collected in 2014 using a 10 MHz ice penetrating radar system equipped with GPS, as described by Mingo and Flowers (Reference Mingo and Flowers2010). Assuming a radar wave speed in ice of 1.68 × 10⁸ m s–1, the glacier bed was clearly identifiable at the lower and middle profiles with an estimated vertical error of <10 m (Wilson, Reference Wilson2012). At the upper profile, challenges interpreting radar returns due to steep rock walls adjacent to the profile resulted in only a single successful measurement of ice thickness, located near the glacier centreline at the site of the dGPS station. A polynomial regression through the observations was used to estimate the glacier bed in regions where surface conditions restricted radar measurements (primarily close to the glacier margins). A parabolic curve best described the measured basal profiles at the lower and middle sites, with R 2 values exceeding 0.9. It was assumed that the bed profile at the upper profile exhibited a similar parabolic profile to the two lower stations, so the cross-sectional area of this profile was estimated by fitting a polynomial (n = 2) regression through the single measured ice thickness near the glacier centre and 0 m ice thickness at the glacier margins (Fig. 2). The results of the ice radar measurements show reasonable agreement (±50 m) with early seismic and gravity-based observations of ice thickness conducted in 1961/62 (Müller, Reference Müller1963).
Cross-sectional depth and elevation profiles at the (a) upper, (b) middle and (c) lower velocity profiles. Ice thicknesses are based on 10 MHz ice penetrating radar measurements conducted in 2014. Surface elevations for 1960 are derived from the Haumann and Honegger (Reference Haumann and Honegger1964) 1:10000 map, and the 2014 surface elevations are derived from GPS observations (black points) and the Thomson and Copland (Reference Thomson and Copland2016) map of White Glacier.

Having greater confidence in the accuracy of historic and contemporary elevation observations, we derived changes in ice thickness from changes in surface height between 1960–70 and 2014 (described above), rather than comparison of contemporary radar-derived thickness measurements with historic gravity and seismic observations (Müller, Reference Müller1963; Blatter, Reference Blatter1987). Elevations at rock cairns located off-ice near White Glacier measured in 1960 (Haumann and Honegger, Reference Haumann and Honegger1964) agreed well (within 1 m horizontally and vertically) with dGPS point measurements at the same locations in 2014. This approach assumes that basal erosion processes are negligible for a mostly-cold and slow moving (<100 m a–1) glacier.
4. RESULTS
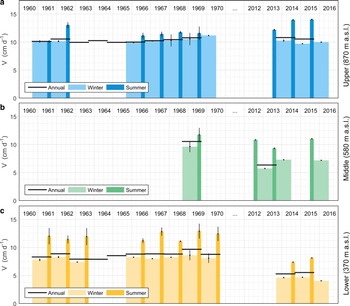
Annual, winter and summer glacier velocities were calculated for 2012–16 at the upper, middle and lower profiles following the criteria of Müller and Iken (Reference Müller and Iken1973) and are shown with the 1960–70 measurements in Figure 3. Comparing the historic and contemporary observations, mean annual velocities decreased at the middle and lower profiles by 31 and 38%, respectively. Mean annual velocities at the upper station did not show a statistically significant change within their combined errors (0.82 cm d–1). Mean winter velocities showed a similar trend to the annual velocities with decreases of 31 and 45% at the middle and lower profiles, respectively, and a smaller decrease at the upper profile (3.5%) that is not statistically significant. The summer patterns were somewhat different; the middle and lower sites exhibited decreased mean summer velocities by 12 and 35%, respectively, but the upper station exhibited a 12% increase in mean summer velocity since 1960–70. The detailed velocity time series, including information on the length of the summer period (s) and ablation (a) are given in Table 1, which builds upon the record presented in Müller and Iken (Reference Müller and Iken1973). At the upper and lower profiles, where the historic record of measurements spans 10 years, the percent contribution of summer motion to annual velocity has increased from 2 to 8% at the upper profile over the period of record, and from 8 to 15% at the lower profile. We also find that the discrepancy between winter and annual velocities has increased. In the 1960s, winter velocities were 2 and 8% slower than annual velocities at the upper and lower profiles, respectively, whereas presently they are 6 and 14% slower.
Variations in annual, winter and summer velocities between 1960–70 (Müller and Iken, Reference Müller and Iken1973) and 2012–16 (this study) at the (a) upper, (b) middle and (c) lower velocity profiles.

The longitudinal pattern of ice velocities has also changed from the 1960–70 observations of Müller and Iken (Reference Müller and Iken1973), who observed that v a decreased from the upper to middle profiles and then showed a slight increase to the lower profile, after which the velocity declined steeply towards the terminus. Our measurements now indicate a continuous decrease in annual velocity from the upper profile towards the terminus, with no increase near the lower profile.
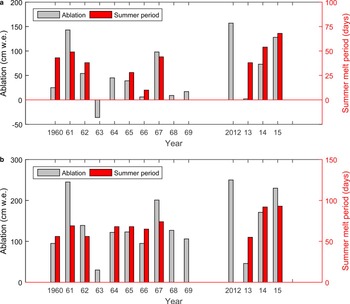
The average duration of the summer melt period (s) has increased across the glacier between the 1960s and today, with the greatest change at the upper profile where melt conditions prevail for 18 d longer (Fig. 4). This corresponds to a 53% increase in melt at the upper profile in recent years (2011–15) in comparison with the mean ablation observed from 1960 to 1970. The increase in s is not as great at the lower profile, only 15 d longer than the 1960–70 average of 65 d, although the increase in ablation is greater than at the upper station with a 73% increase in melt being observed since the observations of Müller and Iken (Reference Müller and Iken1973).
Annual ablation (a) derived from mass-balance measurements and duration of the melt period (s) for the: (a) upper, and (b) lower profiles. Negative ablation values indicate that the profile was in the accumulation area (e.g. in 1963). Missing s values refer to years where meteorological data were not available for the given profile.

5. DISCUSSION
To investigate the potential causes of the observed long-term slowdown in the lower parts of White Glacier, and lack thereof at the upper profile, we consider how the primary influences on glacier motion may have changed over time, including internal deformation, basal motion and surface mass balance. Additionally, we assess how changes in ice thickness, duration of the melt period, ablation and potential changes in englacial temperatures have impacted the processes controlling ice velocities.
5.1. Internal deformation
Following from Glen's (Reference Glen1955) flow law and the formulations of Nye (Reference Nye1965), which describes the role of the glacier bed profile on ice deformation at the glacier centreline, we applied the method of Nolan and others (Reference Nolan, Motyka, Echelmeyer and Trabant1995) to calculate the surface motion due to ice deformation at the three velocity profiles using:
 $$U_{\rm d} = 2A(n + 1)^{ - 1} \; (\rho g\sin \alpha )^n \; H^{n + 1} \; f^n $$
Here U d refers to the centreline velocity due to ice deformation and is a function of the rate parameter (A), the flow-law exponent (n = 3) and basal shear stress, which is the product of ice density (ρ = 900 kg m–3), gravity (g = 9.8 m s–2), ice thickness (H), surface slope (α) and the shape factor (f).
The ice radar results (Fig. 2) indicate that the glacier cross section is approximately parabolic in the study areas, and thus we utilize the parameterization of Nye's (Reference Nye1965) parabolic shape factor values by Nolan and others (Reference Nolan, Motyka, Echelmeyer and Trabant1995), which calculates f based upon the ratio between the glacier half-width and ice thickness at the centreline. This value is treated as constant for each profile throughout the following analysis because updating f between 1960 and 2016 does not result in statistically significant changes in U d. Similarly the surface slope α, which is determined by a linear regression fit through a 2 km longitudinal transect of surface elevations centred on each station, does not statistically change between the 1960 and 2014 topographic models of the glacier (Thomson and Copland, Reference Thomson and Copland2016).
In many studies the rate parameter A is commonly stated as a constant, which is a reasonable assumption for temperate glaciers where ice temperatures are generally homogeneous and at or very near the pressure melting point. However, with englacial temperatures ranging from −15°C to very near 0°C in White Glacier (Blatter, Reference Blatter1987), it is less clear how one should define A. The rate parameter changes as a function of temperature according to the Arrhenius relation:
 $$A = A_o \exp \left( { - Q/RT} \right)$$
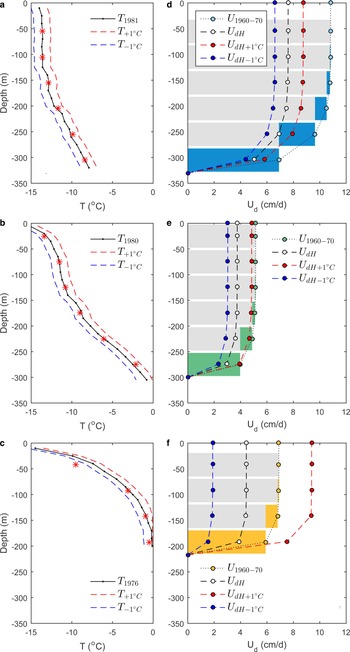
where A o = 2.95 × 10⁻⁹ Pa–3 s–1 (independent of temperature), the activation energy of creep Q = 7.88 × 10⁴ J mol−1 (Weertman, Reference Weertman1983), R = 8.31 J mol–1 K–1 is the universal gas constant and T is the ice temperature. Using temperature profiles from boreholes drilled at each of the three velocity profiles between 1976 and 1981, we apply a discretization to account for the variability of ice temperature with depth and the subsequent impact on A and U d. Starting from the glacier bed, the mean temperature of 50 m thick segments was calculated for the upper, middle and lower profiles using englacial temperature profiles from the boreholes ‘3/81’, ‘4/80’ and ‘1/76’ of Blatter (Reference Blatter1987), respectively (Figs 5a–c). It should be noted that the borehole at the upper station was ~100 m short of the glacier bed, so a linear regression through the lower portion of the profile was used to estimate the temperatures between the deepest drill depth of 260 m and the bed. From the mean temperature  $(\bar T)$ of each 50 m layer, A was calculated using Eq. (2) and the resulting velocity of each layer attributable to ice deformation (U d) was determined from Eq. (1). The sum of U d values from each layer thus provides the expected surface velocity attributable to ice deformation at the centreline (Figs 5d–f).
Englacial temperature measurements at the (a) upper, (b) middle and (c) lower velocity profiles with 50 m mean temperatures indicated by red stars, and modelled vertical deformation profiles (d,e,f) for each profile within scenarios 1–4, where U 1960–70 refers to modelled deformation using ice thickness and temperature conditions during the 1960–70s, while U dH applies the thickness change (dH) observed between 1960 and 2014 with no temperature change, or with a +1°C warming (U dH +1°C) or with 1°C cooling (U dH −1°C). The horizontal columns in the background of (d,e,f) illustrate the amount of deformation in a given layer (coloured segment) and the cumulative sum of deformation attributable lower layers (grey) as a result of laminar flow.

As Eq. (1) indicates, decreases in ice thickness H induce decreases in U d. Changes in ice thickness (dH) between 1960 and 2014 at the three stations were: dH upper = −23 m, dH middle = −19.5 m and dH lower = −19 m. The slightly lower ice thinning at the middle and lower stations is likely attributable to shadowing effects at these sites, where the glacier is narrower and confined by steep valley walls. It is also possible that dynamic thinning is occurring due to flux-divergence at the upper station, notably the only station that did not demonstrate a statistically significant decrease in v a between the 1960s and present day.
Arguments exist that support both increases and decreases in englacial temperatures under a warming climate and thinning glacier, with the outcome depending on the dominant processes taking place (Wilson and Flowers, Reference Wilson and Flowers2013). For example, heat delivered from supraglacial meltwaters to the glacier bed followed by refreezing and the release of latent heat has been presented as a mechanism for warming and softening the base of the Greenland ice sheet (Bell and others, Reference Bell2014). Conversely, for smaller ice masses it has been demonstrated that the loss of ice thickness reduces englacial strain heating and the capacity for reaching pressure melting point with decreased overburden pressure as has been demonstrated at Kårsaglaciären, northern Sweden (Rippin and others, Reference Rippin, Carrivick and Williams2011) and Midre Lovénbreen, Svalbard (Hambrey and others, Reference Hambrey2005).
A 3°C warming of annual air temperatures over the past 60 years has been observed at Eureka station (Lesins and others, Reference Lesins, Duck and Drummond2010), but without concrete evidence of how englacial temperatures might be changing at White Glacier, we investigate the possibility of both ice warming and cooling in this analysis.
Considering the observed changes in ice thickness and potential changes in englacial temperatures over the past several decades, the above methodology was applied to estimate the centreline velocity attributable to ice deformation under the following scenarios:
(1) Historic (1960–70) ice thickness (H) and $\bar T$ values (denoted as U 1960–70);
(2) Changing ice thickness (dH, 1960–2014) and historic
$\bar T$ values (U dH);(3) Changing ice thickness (dH) and a −1°C change to historic
$\bar T$ values (U dH −1°C);(4) Changing ice thickness (dH) and a +1°C change to historic
$\bar T$ values (U dH +1°C).


In scenario 4, if the temperature increase led to temperatures >0°C these layers were assigned a maximum temperature of −0.1°C.
From these scenarios (Figs 5d–f), we see that the result of changes in ice thickness alone decreases deformation rates by 29, 27 and 37%, respectively, at the upper, middle and lower stations. A 1°C decrease in temperature along the entire temperature profile would theoretically lead to a further 10–15% decrease in deformation rates at each profile, whereas 1°C of englacial warming results in ice deformation rates approaching (or exceeding, in the case of the lower profile) those modelled from 1960 to 1970. The consequences of changing englacial temperatures are most significant at the lower station, which has the warmest temperature profile. This is likely because deformation rates are particularly sensitive at temperatures approaching the pressure melting point (~0°C), where ice deforms at a rate >100 times faster than ice at −20°C (Cuffey and Paterson, Reference Cuffey and Paterson2010). We also find that the proportion of net motion attributable to the deformation of the deepest 50 m of ice increases from the upper (63%) to the middle (77%) and lower (86%) stations as englacial temperatures near the bed also increase. Additionally, the modelled depth-averaged velocities, based on the profiles in Figure 5, are very close to the modelled surface velocities (95–96%) and varied by <1% between stations.
5.2. Basal motion
Where the modelled deformation rates fail to meet the observed surface velocities, it is generally accepted that the resulting motion is due to basal sliding or deformation of the bed (Hubbard and others, Reference Hubbard, Blatter, Nienow, Mair and Hubbard1998; Copland and others, Reference Copland, Sharp, Nienow and Bingham2003b; Minchew and others, Reference Minchew, Simons, Hensley, Björnsson and Pálsson2015). We are unable to discriminate between the relative importance of basal sliding vs bed deformation processes at the bed of White Glacier, so from hereon we refer to any motion at the bed simply as basal motion.
5.2.1. Winter basal motion
Iken (Reference Iken1974) provided the first evidence that basal motion was able to occur beneath mostly-cold polythermal Arctic glaciers during the melt season. More recent studies have indicated that basal motion can also continue through the winter months on land-terminating polythermal glaciers, as has been observed at John Evans Glacier on Ellesmere Island (Bingham and others, Reference Bingham, Nienow and Sharp2003; Copland and others, Reference Copland, Sharp and Nienow2003a) and McCall Glacier, Alaska (Rabus and Echelmeyer, Reference Rabus and Echelmeyer1997).
From the ice deformation model results in scenario 1, with historic ice thickness and englacial temperature conditions (U 1960–70), it can be derived that ice deformation fully accounts for observed winter velocities at the upper station, but that basal motion is required to explain 47% of the observed wintertime motion at the middle profile, and 15% at the lower profile (Fig. 6). This finding agrees with the suggestion of Blatter (Reference Blatter1987), based on observed ice thicknesses and temperature profiles, that basal sliding begins shortly down-glacier of the upper profile where englacial temperatures closest to the bed change from ~–6 to >−1°C.
Component of winter surface velocity attributable to deformation (hatched pattern) and basal motion (solid colour) at the (a) upper, (b) middle and (c) lower velocity profiles for scenarios 1–4, where U 1960–70 refers to modelled deformation using ice thickness and temperature conditions during the 1960–70s, while U dH applies the thickness change (dH) observed between 1960 and 2014 with no temperature change, or with a +1°C warming (U dH +1°C) or with 1°C cooling (U dH −1°C).

For contemporary velocities (2012–16) reductions in H alone (scenario 2; U dH) have led to a decrease in deformation rates at all stations since 1960–70 (Fig. 6). Of particular note is that the onset of wintertime basal motion appears to have occurred at the upper profile since 1960–70. This essentially offsets the decrease in ice deformation there, such that the overall changes in v w at the upper profile are negligible. Below the upper profile, the proportion of wintertime basal motion has decreased since 1960–70, particularly at the lower profile where internal deformation now accounts for >95% of v w (assuming no changes in englacial temperatures; U dH = scenario 2). If englacial temperatures have decreased since the observations of Blatter (Reference Blatter1987), scenario 3 (U dH −1°C) indicates that ice deformation rates would have correspondingly declined and increased basal motion is required to reach contemporary winter velocities at all stations. The contrary is true for an increase in englacial temperatures (scenario 4; U dH +1°C), in which warmer, softer ice will deform more readily.
5.2.2. Summer basal motion
The relationship between meltwater delivery to the glacier bed and the resulting magnitude of basal motion is dependent on the efficiency of the subglacial hydrological network (Flowers, Reference Flowers2015) and its capacity to maintain basal water pressures that reduce friction at the glacier bed (Iken and Bindschadler, Reference Iken and Bindschadler1986). It has been suggested that the speedup of Jakobshavn Isbrae and other outlet glaciers on the western coast of Greenland is driven by enhanced surface melt at increasingly higher elevations, prompting increased water pressure at the bed and acceleration of the glacier, thus inducing a potential positive-feedback cycle where dynamic thinning as acceleration draws down high-elevation ice to lower, warmer elevations (Zwally and others, Reference Zwally2002). Other studies suggest a buffering to this effect in which efficient drainage systems at the glacier bed are able to develop under high and continuous melt conditions, thus rapidly removing water from the bed and ultimately reducing the basal water pressures and leading to a slowing of the ice (Schoof, Reference Schoof2010; Sundal and others, Reference Sundal2011). Through dye-tracing experiments at John Evans Glacier, Ellesmere Island, Canada, Bingham and others (Reference Bingham, Nienow, Sharp and Boon2005) indicated that this range of processes is also possible beneath mostly-cold polythermal valley glaciers. Generally, glacier speed-up events occur when subglacial water pressures are high and the subglacial hydrological network is unable to convey water efficiently out of the system, with this connection observed at both temperate (Iken and others, Reference Iken, Röthlisberger, Flotron and Haeberli1983; Kamb and others, Reference Kamb1985; Iken and Bindschadler, Reference Iken and Bindschadler1986) and polythermal glaciers (Iken, Reference Iken1974; Copland and others, Reference Copland, Sharp, Nienow and Bingham2003b; Rippin and others, Reference Rippin, Willis, Arnold, Hodson and Brinkhaus2005; Bingham and others, Reference Bingham, Nienowv, Sharp and Copland2006). Thus, if the subglacial hydrological network evolves into a system of large conduits that can efficiently drain the system and reduce water pressures at the glacier bed, then even high levels of surface melt and delivery of that water to the bed may not result in glacier speedup.
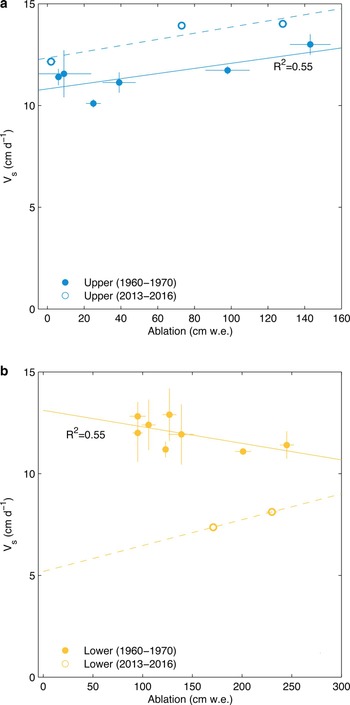
While detailed information about the nature of the subglacial hydrological network at White Glacier is not available, we can make inferences based on the relationships between ablation and summer velocities at the upper and lower stations, where the greatest number of historic observations is available. The lack of correlation (or weak at best) between annual (i.e., summer) ablation and summer velocity at the upper profile during the 1960s could be because of negligible supra-subglacial connectivity influencing basal motion at that time (Fig. 7). The marked increase in v s at this profile between the 1960s and present day, coupled with the strong correlation between ablation and summer velocity during 2013–16 suggests such connectivity is starting to be established at higher elevations. In contrast to the upper profile, a weak negative correlation was found between annual ablation and v s at the lower profile, suggests that an efficient subglacial drainage system was in place over the lower ablation during 1960–70. While no trend can be interpreted from the 2013–16 observations at the lower profile, there has been a significant slowdown in v s.
Relationship between annual ablation and summer velocities (v s) at the (a) upper and (b) lower profiles. R 2 values provided for historic data between 1960 and 1970.

A possible mechanism for the increase in v s at the upper profile relates to the prolonging of s and a rise of the mean ELA from 990 to 1270 m a.s.l. (±160 m) since the 1960–70 mean, thereby increasing the area of the up-glacier catchment where meltwater can be produced. The occurrence of many crevasses in this region, some indicative of being the precursors of moulins given supraglacial streamflow into them, suggest that this meltwater is reaching the bed and facilitating basal motion in the past decade. Down-glacier of the middle profile, evidence for the presence of a sustained subglacial drainage system includes: (1) the occurrence of several large and active moulins that have persisted since the mid-1960s to present in the same geographic locations relative to the glacier margin; (2) the continued presence of an ice cave that directs a marginal stream beneath the glacier 1 km down-glacier of the lower profile (first reported in the early 1960s by Maag (Reference Maag1969)); (3) the recent exposure of very large subglacial and englacial drainage conduits near the glacier terminus following the collapse of the glacier surface between White Glacier and the adjacent Thompson Glacier in ~2010; (4) the presence of a temperate bed extending from ~200 to 700 m a.s.l. (Blatter, Reference Blatter1987).
5.3. Role of mass balance
Over longer periods, ice velocities are dictated by glacier mass balance in which the theoretical balance flux of mass through a cross-sectional area equals the mass budget of the upstream basin (Cuffey and Paterson, Reference Cuffey and Paterson2010). For each 25 m elevation band (h) on White Glacier, we calculate the balance flux (Q b) for each year of the 55 year mass-balance record using:
 $$Q_{{\rm b}(h,t)} = \mathop \sum \limits_{i = h}^{h_0} b(i,t)\; s(i,t)$$
where i ranges from h, a given 25 m elevation band, up to h 0, the maximum elevation, b is the observed elevation band mass balance, s is the area of the elevation band in year t (updated annually by linear interpolation from 1960 to 2014 in Thomson and others (Reference Thomson, Zemp, Copland, Cogley and Ecclestone2016)), where t is 0 in 1960).
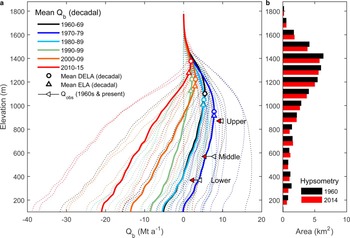
Plotting the annual and decadal mean balance flux (Fig. 8a) illustrates that fluxes increased from the 1960s to 1970s, but have declined steadily since. The elevation at which the balance flux profile intersects Q b = 0 indicates the theoretical balance terminus and is the elevation to which ice flux can be sustained by the cumulative mass-balance conditions up-glacier. The decadal mean profiles suggest that the hypsometry of White Glacier (Fig. 8b) was dynamically in balance with the climate conditions of the 1970s, the only decade in which Q b = 0 at the elevation of the present terminus (~100 m a.s.l.) and the decadal mean glacier wide mass balance was ~0 m w.e.. In all other decades, the elevation of the balance terminus is higher than the present glacier terminus and since the 1990s it has risen above the upper velocity profile (870 m a.s.l), to reach a maximum elevation of 1190 m a.s.l. in 2010–15.
(a) Annual (grey) and decadal mean (coloured) balance flux (Q b) profiles based upon the 55-year mass-balance record at White Glacier. Also plotted are the observed fluxes (Q obs) derived from 1960 to 1970 velocities (white triangles) and 2012–16 velocities (red triangles). Coloured circles and triangles, respectively refer to the dynamic ELA where maximum flux occurs, and the corresponding ELA based on surface mass-balance data. (b) Glacier hypsometry in 1960 (black) based upon Haumann and Honegger (Reference Haumann and Honegger1964) and 2014 (red) from Thomson and Copland (Reference Thomson and Copland2016).

Observed mass flux (Q obs) through the three velocity profiles, calculated from the product of the depth averaged velocity (~95% of the observed surface velocity) and the cross-sectional area of the profiles, shows that mass fluxes have decreased at all three profiles since the 1960s (Fig. 8a). At the upper profile, this decline (−16.4 Mt) is entirely attributable to the reduction in the cross-sectional area of the profile as a result of ice thinning, while at the middle and lower profiles a combination of ice thinning and decreased ice speeds led to the reduced fluxes. For the main glacier trunk below the middle profile, the cumulative decline in mass flux between 1960 and 2014 has reduced the dynamic replenishment of ice mass by 81.5 Mt below the middle profile and 68.2 Mt below the lower profile. These reductions in mass delivery explain only a small percentage (~2.5%) of the observed mass loss along the glacier terminus below the middle profile (−3427 Mt) and lower profile (−3043 Mt) based on geodetic mass balance (volume-derived) mass changes between 1960 and 2014 (Thomson and others, Reference Thomson, Zemp, Copland, Cogley and Ecclestone2016). This indicates that the observed ~15 m thinning along the main trunk of White Glacier since 1960 is primarily due to downwasting (melt), rather than reductions in dynamic mass input. Should ice fluxes along the glacier trunk continue to decline at a linear rate similar to that observed over 1960–2014, stagnant ice conditions (Q obs = 0) would hypothetically occur within ~80 years at the lower profile, within 110 years at the middle profile, and within 750 years at the upper profile.
We also find that the dynamic ELA (DELA), defined here as the elevation at which the maximum flux is expected, is consistently above the ELA that is based on the mass-balance gradient. This observation contradicts general theory (Benn and Evans, Reference Benn and Evans2010; Cuffey and Paterson, Reference Cuffey and Paterson2010), which suggests that for a glacier in steady state maximum mass turnover (flux) should occur at the ELA. This discrepancy is related to the hypsometry of White Glacier, which the DELA incorporates, but which the mass-balance ELA does not as this is defined simply as the elevation at which the mass-balance gradient intersects b(h) = 0. The observed discrepancy between the DELA and ELA therefore emphasizes the importance of basin geometry in the stability of glacier response. The hypsometry of the White Glacier basin reaches its maximum area at elevations of 1300–1500 m a.s.l., meaning that this zone presents an important threshold. Should the long-term mass-balance ELA exceed this elevation range the glacier will likely be reduced to a small cirque-type ice mass, which Harrison and others (Reference Harrison, Cox, Hock, March and Pettit2009) characterize as an ‘unstable’ glacier response. Based on the mass-balance record the observed ELA has risen by an average rate of +6 m a–1 over the past 55 years, increasing to a rate of +9 m a–1 over the past 30 years. If the trend persists, then by between ~2040 and 2060 the average ELA will exceed the 1500 m a.s.l. threshold.
6. CONCLUSIONS
In agreement with the work of Heid and Kääb (Reference Heid and Kääb2012) it is apparent that, in general, long-term ice velocities are decreasing at White Glacier with the observed decline being greatest towards the glacier terminus. One exception is the upper station, which showed an increase in summer velocities that is suspected to be associated with an increase in meltwater reaching the bed and inducing basal motion that persists beyond the summer melt period. In agreement with Van Wychen and others (Reference Van Wychen2016), we find in our contemporary velocity measurements that winter velocities are ~6–13% slower than annual velocities, an increase in comparison with earlier velocity measurements (Müller and Iken, Reference Müller and Iken1973; Iken, Reference Iken1974), which winter velocities were 1–7% lower than annual velocities. Vertical ice deformation profiles modelled using rate parameters based on historic englacial temperature measurements (Blatter, Reference Blatter1987) indicate that ice deformation alone cannot explain contemporary surface velocities. It is therefore highly likely that basal motion occurs at White Glacier through the winter, possibly by means of transient water storage at the glacier bed through the winter months as has been observed at Kennicott Glacier, Alaska (Bartholomaus and others, Reference Bartholomaus, Anderson and Anderson2008).
Observed declines in ice flux have not, however, contributed significantly (<2.5%) to observed mass loss along the glacier trunk from 1960 to 2014. The observed thinning at low elevations is therefore primarily associated with high ablation rates and not reduced dynamic contributions over the past 55 years. It is worthwhile noting that the majority of mass lost between 1960 and 2014 is associated with retreat of the terminus, rather than ice thinning. A hypsometric response of this nature acts to buffer the glacier system by retreating ice from low elevations where the greatest melt rates occur. Therefore, with regard to changes in elevation and extent, White Glacier is presently exhibiting a stable response to recent warming. Balance velocities modelled using annual mass-balance observations and glacier hypsometry reveal that the current flow regime is unsustainable and that the observed mass flux through three cross-sectional profiles currently exceeds balance fluxes by >200%. It is expected that if contemporary deceleration rates continue into the future, ice at elevations near 600 m a.s.l. will stagnate within the next 110 years, and ice within the primary trunk below 400 m a.s.l. will become stagnant within ~80 years.
ACKNOWLEDGEMENTS
This research was supported by the Natural Sciences and Engineering Research Council of Canada, Canada Foundation for Innovation, Ontario Research Fund, ArcticNet, University of Ottawa, the W. Garfield Weston Foundation and the Canadian Polar Commission's Northern Studies Training Program. We acknowledge the continued support of the Canadian Polar Continental Shelf Program for providing field logistics at Expedition Fiord. Particular thanks go to Wayne Pollard, current Director of the McGill Arctic Research Station, where the glacier research programme has operated for 55 years and to Miles Ecclestone for his assistance and guidance in the field. We also thank Derek Mueller of Carleton University for providing access to his radar system in the field. The suggestions by reviewers Dr M. Hambrey and Dr R. Bingham were particularly helpful in improving this manuscript and we thank them for their insight and contribution.

 Open access