

Introduction
Moths (Lepidoptera) are speciose and ecologically important components of the arthropod assemblage in boreal forests, where they inhabit both trees and understorey vegetation (Munroe Reference Munroe1979). Moths in boreal forests are herbivores and transfer energy from vegetation to the forest floor (Danks and Foottit Reference Danks and Foottit1989); they are important prey items for insectivorous birds (Aves) (Atlegrim Reference Atlegrim1992) and mammals (Mammalia) (Dodd et al. Reference Dodd, Lacki, Britzke, Buehler, Keyser and Larkin2012) and the adult moths may be important in pollen transport (Devoto et al. Reference Devoto, Bailey and Memmott2011). Outbreak species, notably spruce budworm (Choristoneura fumiferana (Clemens) (Lepidoptera: Tortricidae)), are well studied (reviewed by Pureswaran et al. Reference Pureswaran, Johns, Heard and Quiring2016). However, the vast majority of moth species in forests do not exhibit episodic outbreaks (Danks and Foottit Reference Danks and Foottit1989) nor are considered pests. Despite their ubiquity in northern North American forests, assemblages of non-pest forest moths have not been extensively studied (Summerville and Crist Reference Summerville and Crist2008), and this is particularly true for the assemblages in boreal forest. Pohl et al. (Reference Pohl, Langor, Landry and Spence2004) characterised the moth community of an Alberta, Canada, mixed-wood boreal forest, and the effects on moth communities of mammalian herbivory (Brousseau et al. Reference Brousseau, Hébert, Cloutier and Côté2013) and forest disturbance (Chaundy-Smart et al. Reference Chaundy-Smart, Smith, Malcolm and Bellocq2012) have been studied in boreal forests in eastern Canada. There have been no published studies of the implications of currently used spruce budworm control measures for the assemblages of non-target moths in boreal forests.
Spruce budworm is a periodically dominant component of boreal forests that can inflict stand-altering change during outbreaks (MacLean and Ostaff Reference MacLean and Ostaff1989) but is almost undetectable between outbreaks (Morris Reference Morris1963). Host trees of spruce budworm are within the family Pinaceae and include balsam fir (Abies balsamea (Linnaeus) Miller), and white, black, and red spruce (Picea glauca (Moench) Voss, P. mariana (Miller) Britton, Sterns, and Poggenburg, and P. rubens Sargent) (Mattson et al. Reference Mattson, Simmons, Witter and Berryman1988). Spruce budworm is univoltine and – with the exception of the adults, which fly in mid-summer – all life stages occur in the canopy of the host (Miller Reference Miller1963). First instars eclose in late summer and, without feeding, construct hibernacula inside which they moult to second instars and enter overwintering diapause. In spring, larvae leave hibernacula before bud-flush and feed either within buds by mining old needles or in pollen cones; after bud-flush – from about the third instar – larvae feed externally on the needles of the current year, if they are available. The six instars are completed by late June (Miller Reference Miller1963; Régnière and Nealis Reference Régnière and Nealis2007).
Spruce budworm outbreaks result in tree growth loss, cone and seed mortality, widespread tree mortality, and increased susceptibility to secondary pests and stresses (reviewed in MacLean Reference MacLean2016). The history of use of aerial insecticide application in Canada to prevent such losses has been thoroughly reviewed by Holmes and MacQuarrie (Reference Holmes and MacQuarrie2016). Early insecticides used for spruce budworm control included DDT and a range of organophosphate and carbamate compounds. From 1985 onwards, the bacterial insecticide Bacillus thuringiensis Berliner (Bacteria: Bacillaceae) serotype kurstaki has been widely used for spruce budworm control (van Frankenhuyzen et al. Reference van Frankenhuyzen, Lucarotti and Lavallée2016). Tebufenozide (Mimic) received full Canadian registration for spruce budworm control in 2006 and is a frequently used alternative to B. thuringiensis in operational spruce budworm control programmes (Holmes and MacQuarrie Reference Holmes and MacQuarrie2016; Amirault et al. Reference Amirault, Amos-Binks and Morrison2018). Both B. thuringiensis and tebufenozide are primarily active against Lepidoptera, and must be ingested by larvae to kill them (van Frankenhuyzen Reference van Frankenhuyzen1990; Retnakaran et al. Reference Retnakaran, Smith, Tomkins, Primavera, Palli, Payne and Jobin1997). Within eight hours of ingestion of a lethal dose of tebufenozide, spruce budworm larvae cease feeding; larvae later undergo an incomplete precocious moult without shedding the old cuticle and die of desiccation and starvation (Retnakaran et al. Reference Retnakaran, Smith, Tomkins, Primavera, Palli, Payne and Jobin1997).
Bacillus thuringiensis serotype kurstaki application for spruce budworm control has negative effects on non-target Lepidoptera (Morris et al. Reference Morris, Armstrong and Hildebrand1975, Miller Reference Miller1992), but these have not been observed for other arthropods (Kreutzweiser et al. Reference Kreutzweiser, Capell and Thomas1994; Addison et al. Reference Addison, Otvos, Battigelli and Conder2006). In contrast to a few days of active life of B. thuringiensis on foliage (van Frankenhuyzen et al. Reference van Frankenhuyzen, Nystrom, Dedes and Seligy2000), residues lethal to spruce budworm larvae can persist on foliage for 64 days after tebufenozide application (Sundaram et al. Reference Sundaram, Sundaram and Sloane1996). This level of persistence enhances risks to non-target organisms (Sundaram et al. Reference Sundaram, Sundaram and Sloane1996). Although cladoceran Crustacea are sensitive to tebufenozide in some aquatic systems (Kreutzweiser and Thomas Reference Kreutzweiser and Thomas1995; Kreutzweiser et al. Reference Kreutzweiser, Gunn, Thompson, Pollard and Faber1998), non-target effects on most non-lepidopterous arthropods are extremely unlikely (Retnakaran et al. Reference Retnakaran, Krell, Feng and Arif2003). Non-target effects of tebufenozide on Lepidoptera have seldom been studied. In the summer following late-May tebufenozide application to oak (Quercus Linnaeus; Fagaceae) stands for gypsy moth (Lymantria dispar (Linnaeus); Lepidoptera: Lymantriidae) control, there were significantly fewer caterpillars of five common species of non-target macrolepidoptera, and the abundance and number of species of macrolepidopterous larvae were reduced for up to 14 months after application (Butler et al. Reference Butler, Kondo and Blue1997). Despite these indicators of the potential for negative effects, our study appears to be the first to assess the risk to non-target moths of tebufenozide application for control of spruce budworm.
Most studies of the effects of B. thuringiensis or tebufenozide on non-target Lepidoptera have sampled larvae in foliage. Foliage samples do not represent the complete non-target assemblage, particularly if they omit some (Miller Reference Miller1990; Butler et al. Reference Butler, Kondo and Blue1997; Boulton Reference Boulton2004) or all (Miller Reference Miller1992) of the forest canopy. Butler et al. (1995, Reference Butler, Kondo and Blue1997) were able to identify more than 80 species of larvae of non-target Lepidoptera without rearing them. For many non-target species, larvae have to be reared individually on their host foliage for identification – a requirement that makes research expensive (Wagner et al. Reference Wagner, Peacock, Carter and Talley1996), or limits the study to a few species (Morris et al. Reference Morris, Armstrong and Hildebrand1975; Miller Reference Miller1990, Reference Miller1992; Boulton Reference Boulton2004) that inadequately represent the whole lepidopterous assemblage. Where larval sampling and light trapping of adult non-target moths have both been used, more species were detected by light traps; light trap catches showed similar trends to those from larval samples, but lagged the effect on larvae by intervals that depended upon the life cycle of the insect (Sample et al. Reference Sample, Butler, Zivkovich, Whitmore and Reardon1996; Strazanac and Butler Reference Strazanac and Butler2005). Catches in light traps are not restricted to larvae from a specific vegetation stratum, but may include moths from outside the treated area, if spray blocks are small (Strazanac and Butler Reference Strazanac and Butler2005). As a result of these findings, we opted to use light trapping of moths for up to 27 months following treatment as the main means of assessing non-target effects of treatments. The data from light traps were augmented by a limited programme of larval sampling.
Our study took place in the boreal forest of Manitoba, Canada, during an outbreak of spruce budworm that began in 1995 and continued to 2008. At the peak of the outbreak in 2003, over 131 000 ha of spruce-fir forest in Manitoba suffered moderate to severe defoliation by spruce budworm (Knowles Reference Knowles2003). Tebufenozide was applied for spruce budworm control between 1999 and 2004. In our study, unsprayed plots were compared with similar plots sprayed in the current or previous years as part of the operational spray programme. Our objectives were to assess the effects of tebufenozide application on spruce budworm and, primarily through light trapping, to investigate the effects of the application on the assemblage of non-target moth species.
Methods
Study area and experimental design
Our study was conducted in an irregularly shaped area approximately 80 km north of The Pas, Manitoba, Canada, and immediately south of Cranberry Portage (Fig. 1). The spray area was in the Tolko Forest Industries Forest Management License Area and is part of the Boreal Plains ecozone of Manitoba (Zoladeski et al. Reference Zoladeski, Wickware, Delorme, Sims and Corns1995). The forest is of uneven age with the most abundant Pinaceae being white spruce, black spruce, jack pine (Pinus banksiana Lambert), tamarack (Larix laricina (Du Roi) Koch), and balsam fir (Rowe Reference Rowe1972; Zoladeski et al. Reference Zoladeski, Wickware, Delorme, Sims and Corns1995). Hardwood species include white birch (Betula papyrifera Marshall; Betulaceae), trembling aspen (Populus tremuloides Michaux; Salicaceae), and balsam poplar (P. balsamifera Linnaeus) (Zoladeski et al. Reference Zoladeski, Wickware, Delorme, Sims and Corns1995).
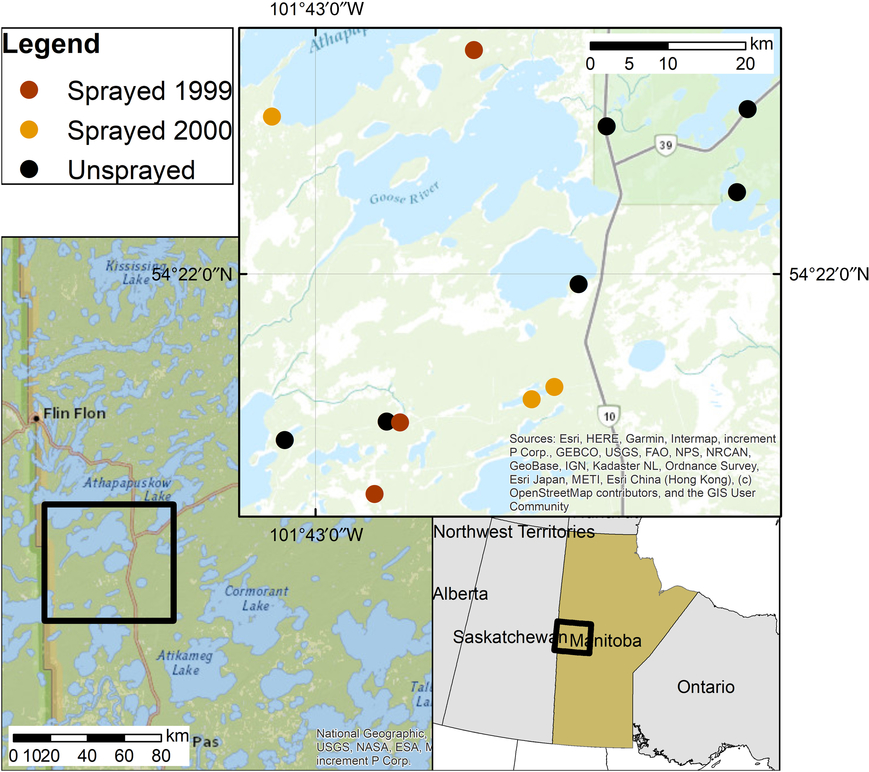
Fig. 1. Location of study area in Manitoba, Canada.
Sampling was carried out in 2000 and 2001 to compare plots sprayed with tebufenozide in either 1999 or 2000 with unsprayed plots which had never received a tebufenozide application. We overlaid aerial maps depicting spray blocks from the 1999 and 2000 spruce budworm management programmes with forest inventory maps (Manitoba Sustainable Development, unpublished) to select white spruce-balsam fir forest stands. We field-verified these forest stands for the presence of spruce budworm defoliation, uniformity in topography, vegetative structure, and plant species composition. Twelve stands were used: six unsprayed stands, three stands sprayed in 1999 (hereafter “sprayed 1999”), and three stands sprayed in 2000 (“sprayed 2000”). One 70 × 70-m plot was established in each stand. Sprayed plots were located at least 100 m inward from the edge of the spray block and at least 100 m from roadways and water bodies. Unsprayed plots were separated from spray blocks by a minimum of 2.5 km and were located at least 500 m apart.
Tebufenozide was applied when bud-flush was almost complete and spruce budworm larvae were between the third and sixth instar. In 1999, study stands were sprayed on 7 or 10 June; and in 2000, applications were on 17 or 18 June. Mimic 240LV was mixed with water and applied under favourable weather conditions at 70 g AI in 2.0 L/ha with a Cessna 188 Agtruck fitted with four Micronair AU4000 rotary atomisers and insecticide delivery sensors; application procedures followed operational guidelines (Health Canada 1995).
Characterisation of plots
In summer 2001 and 2002, the vegetation in plots was sampled in randomly selected quadrats. Trees (less than 2 m in height) were sampled in three 10 × 10-m quadrats per plot, and species composition, stem density, age, height, and diameter at breast height (1.3 m) were recorded. The diversity of trees was assessed using the log-series alpha diversity index (Fisher et al. Reference Fisher, Corbet and Williams1943), fitted using the iterative technique described in Magurran (Reference Magurran2004). Ten 2 × 2-m quadrats were used to sample shrubs (woody plants less than 2 m in height), and shrub species and estimated per cent cover were recorded. Ten 1 × 1-m quadrats were used to sample herbaceous plants and moss. Per cent cover was estimated for all species of herbs; per cent cover of mosses was recorded, but mosses were not identified to species. For shrubs and herbaceous vegetation, the Shannon–Wiener index of diversity was calculated based upon the cover estimates of each (Magurran Reference Magurran2004).
Light intensity was measured 1.5 m above the ground at 16 locations in each plot level using a Gossen Tri-Lux foot-candle meter (Gossen, Erlangen, Germany). Light intensity at each location within the plot was expressed as a percentage of that measured in a nearby clearing immediately before measurements in the plot. All measurements were taken under clear sky in the middle of the day. The average percentage of light intensity was used as an index of canopy closure in the plot, and the coefficient of variation (standard deviation/mean) within the plot was used as an index of canopy heterogeneity.
Sampling of Lepidoptera
Adult nocturnally active moths were sampled in each plot in 2000 and 2001, and lepidopterous larvae feeding in the understorey were sampled in 2000. Additional sampling of spruce budworm larvae and their effects was also carried out.
Adult moths were sampled using one Luminoc 6 V battery-powered insect light trap (Biocom, Sainte-Foy, Québec, Canada) at the centre of each plot. Traps were suspended at height 4–5 m from the branch of a spruce budworm host tree. The light source was a fluorescent tube producing ultraviolet light (wavelength approximately 300–400 nm) with a typical intensity of 2.86 µW/cm2 at 10 cm from the source (Biocom 1998). Traps operated in each of the 12 plots between May and September (106 consecutive nights in 2000; 91 consecutive nights in 2001). Light was turned on by a photocell at dusk and operated continuously for six hours. The catch was killed by a trichlorvos-impregnated resin strip (Vapona; Ortho Canada, Gatineau, Québec, Canada) in the trap collection container. Traps were emptied approximately every 10 days and the contents frozen and taken to the laboratory for sorting and identification.
Based on ease and accuracy of identification, specimens in light trap catches of C. fumiferana and four families of macrolepidoptera (Lepidoptera: Erebidae, Noctuidae, Geometridae, and Drepanidae) were identified and recorded for subsequent data analysis. Moths were identified using McGuffin (Reference McGuffin1967, Reference McGuffin1981, Reference McGuffin1987), Franclemont (Reference Franclemont1973), Covell (Reference Covell1984), Ferguson (Reference Ferguson1985, Reference Ferguson2008), Lafontaine (Reference Lafontaine1987, Reference Lafontaine1998, Reference Lafontaine2004), Bolte (Reference Bolte1990), Lafontaine and Poole (Reference Lafontaine and Poole1991), Handfield (Reference Handfield1999), Mikkhola et al. (Reference Mikkhola, Lafontaine and Gill2009), Powell and Opler (Reference Powell and Opler2009), Moth Photographers Group (2015), Pacific Northwest Moths (2016), and University of Alberta (2016). Classification was based on Pohl et al. (Reference Pohl, Patterson and Pelham2016). Most specimens were identified to species, but for some taxa, this was not possible (often because specimens were too worn or damaged), and specimens were assigned to an aggregate or numbered taxon. Where possible, information in the above taxonomic resources or other literature was used to assign life history characteristics to species caught. Voucher specimens for all species collected are held in the insect collection at the Department of Biology, University of Winnipeg (Winnipeg, Manitoba, Canada).
For each plot in each year, the numbers of moths caught and numbers of taxa were used to derive three indicators of diversity of the assemblage represented by light trap catches. Dominance was assessed using the Berger–Parker index (Berger and Parker Reference Berger and Parker1970). The log-series alpha diversity index was estimated as described above. Rarefaction curves were calculated for each plot in each year using Ecosim 7.0 (Gotelli and Entsminger Reference Gotelli and Entsminger2001), with individual-based subsamples (increments of five) and 1000 randomisations without replacement. Similarities between assemblages in pairs of treatments were investigated using the Sørensen qualitative coefficient and the Morisita–Horn quantitative coefficient (Southwood and Henderson Reference Southwood and Henderson2000).
In 2000, lepidopterous larvae were sampled from understorey vegetation on four occasions (17–22 June, 8–11 July (early July), 23–28 July (late July), and 8–23 August) in each plot. The programme of June understorey sampling occurred during the period of spray application in the sprayed 2000 treatment; understorey samples in this treatment occurred 1–2 days after those applications. On each occasion, samples were taken at two foliage-dense locations on each of eight 70-m transects (10 m apart) per plot. At each location, branches of foliage ≤ 2.5 m above the ground were beaten five times with a wooden stick, and dislodged caterpillars were collected on a 1 × 2-m tarpaulin spread beneath; also, larvae were handpicked from understorey vegetation for a maximum of two minutes. Larvae from both sampling techniques were pooled and placed in 70% ethanol solution. In the laboratory, they were classified into three groups: spruce budworm, Geometridae, and other Lepidoptera.
The effect of tebufenozide application on subsequent numbers of spruce budworm larvae on host trees was assessed in early June 2001. Five separate white spruce or balsam fir trees were randomly selected from each plot. Three branch tips (approximately 45 cm in length) were removed from the mid-canopy of each selected tree using pole-pruners equipped with a canvas basket. Two branch samples were taken to the laboratory where spruce budworm larvae were counted. A third branch sample from each tree was used to estimate defoliation that had occurred in 1999 and in 2000.
Data analysis
The responses to spray treatments of univariate measures were assessed by one-way analysis of variance and a priori contrasts of the unsprayed treatment with the sprayed 1999 treatment and of the unsprayed treatment with the sprayed 2000 treatment. Light trap catches for each year of the study were analysed separately, as there were great differences in catch in each year, and treatment effects were expected to change with the lapse of time since spray application. Conformity of data to the model for analysis of variance was assessed by graphical inspection of residuals and by tests of normality and heteroscedasticity; when indicated, transformations were applied before final analysis. All univariate analyses were performed using Systat (Systat 2009). In both univariate and multivariate analyses, the α level for significance was 0.05.
Responses to spray treatments of the non-target moth assemblages represented by light trap catches were investigated using constrained ordination. Preliminary analyses indicated that a linear model of untransformed catch data was most appropriate, and so untransformed data were subjected to redundancy analysis using Canoco 5 (ter Braak and Šmilauer Reference ter Braak and Šmilauer2012). All three treatments were included as explanatory variables, and the significance of the constrained axes was assessed by Monte Carlo permutation. Where axes were significant, the relationship of individual moth taxa to spray treatments was investigated using t-value biplots with Van Dobben circles (ter Braak and Looman Reference ter Braak and Looman1994).
To investigate the presence of characteristic or indicator species associated with treatments, indicator species analysis (Dufrêne and Legendre Reference Dufrêne and Legendre1997) was run using PC-ORD version 5.0 (McCune et al. Reference McCune, Grace and Urban2002) using light trap catches of spruce budworm and the previously listed four families of macrolepidoptera. Indicator values were tested for significance using Monte Carlo randomisation with 1000 permutations (McCune et al. Reference McCune, Grace and Urban2002).
Results
Site characteristics
In each treatment, the spruce budworm hosts – P. glauca, P. mariana, and A. balsamifera – averaged more than 50% of the stems in tree quadrats. Populus tremuloides and B. papyrifera were the most abundant deciduous trees. Of the quantitative measures derived from tree quadrats (Table 1), only the percentage of conifers differed between the unsprayed treatment and a sprayed treatment. Neither mean light intensity nor the coefficient of variation – a measure of canopy heterogeneity – differed between unsprayed and sprayed treatments (Table 1).
Table 1. Mean (± standard error) values of vegetation-related measures in the plots of each treatment, and results of analysis of variance contrasts between unsprayed treatment and each sprayed treatment.
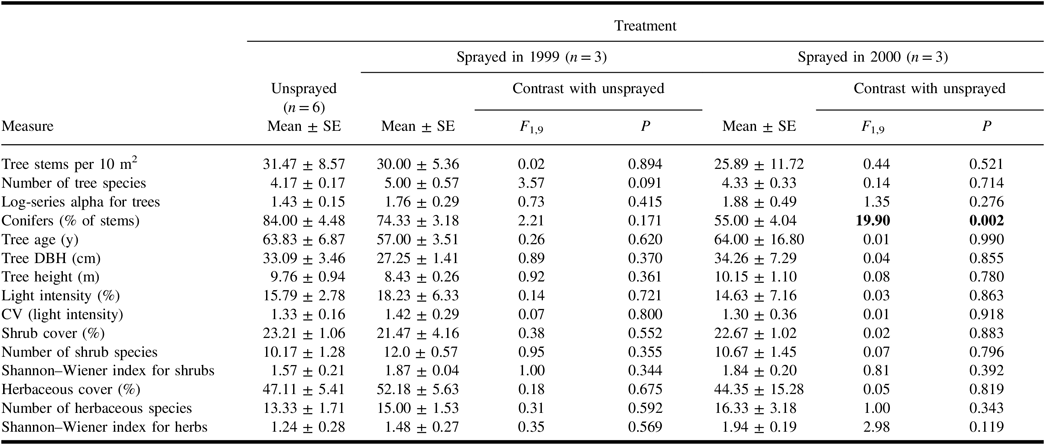
With the exception of “conifers”, all measures for trees include all species of trees. Light intensity in plots is expressed as a per cent of intensity in the open. Results of contrasts are shown in bold if they are significant (α = 0.05).
SE, standard error; DBH, diameter at breast height; CV, coefficient of variation.
All shrub samples in each plot contained spruce budworm host trees that were under 2 m in height. Additional frequent species in the shrub samples were Alnus crispa (Aiton) Pursh (Betulaceae), Ledum groenlandicum Oeder (Ericaceae), Linnaea borealis Linnaeus (Caprifoliaceae), Ribes triste Pallas (Grossulariaceae), Rosa acicularis Lindley (Rosaceae), and Viburnum opulus var.edule Michaux (Adoxaceae). None of the quantitative measures derived from shrub samples in sprayed treatments differed from those in the unsprayed treatment (Table 1).
In quadrat samples for herbaceous vegetation, living plant cover averaged 44–52% in the treatments, with much of the remaining area comprising coarse woody debris and bare ground. Mosses averaged 53 ± 7% of the total cover of living herbaceous plants, and the most abundant spermatophytes were Aralia nudicaulis Linnaeus (Araliaceae), Cornus canadensis Linnaeus (Cornaceae), and Rubus pubescens Rafinesque (Rosaceae). Quantitative measures derived from herbaceous quadrat samples did not differ significantly between unsprayed and sprayed treatments (Table 1).
Treatment effects on spruce budworm
A total of 1349 spruce budworm moths were collected in light traps in 2000 and 2001. The catches of spruce budworm during the mid-summer flight period in 2000 were lower than in the unsprayed treatment in plots sprayed earlier in 2000, and in those sprayed in 1999 (Table 2). However, catches in 2001 showed no significant differences between unsprayed and sprayed treatments. Hence for plots sprayed 12–15 months before sampling, the effect of treatment on the catch of spruce budworm adults differed in the two years of sampling.
Table 2. Mean (± standard error) measures of spruce budworm and associated defoliation in the plots of each treatment, and results of analysis of variance contrasts between unsprayed treatment and each sprayed treatment.
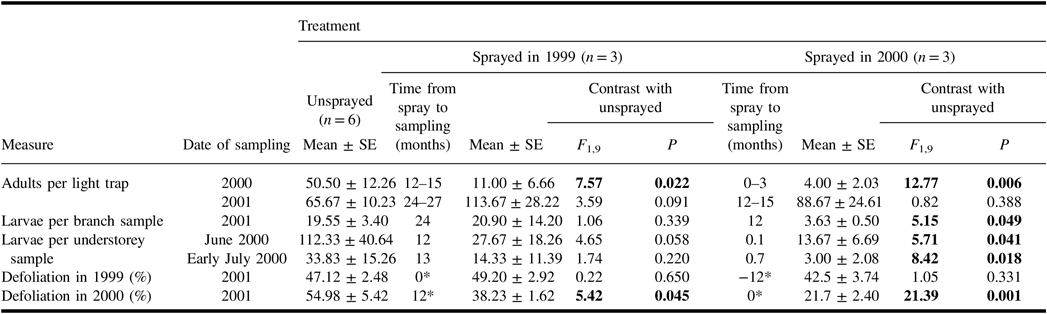
Results of contrasts are shown in bold if they are significant (α = 0.05).
* Time from spray to time of defoliation. Defoliation in 1999 and in 2000 were both assessed in 2001.
SE, standard error.
Spruce budworm larvae were common in understorey samples taken in June and early July 2000 (Table 2), but few were found in understorey samples taken in late July 2000, and there were none in samples in August 2000. Both the June and early-July samples showed a significant difference between the numbers of larvae in unsprayed plots, and in those sprayed earlier in the same summer. Average numbers in the sprayed 1999 treatment were much less than half the numbers in corresponding samples from unsprayed plots, but these differences were not significant. There was considerable variability among plots within treatments, and numbers in one plot of the sprayed 1999 treatment were well within the range of those in unsprayed plots.
In June 2001, the numbers of spruce budworm larvae per branch sample from the mid-canopy of host trees were lower than in the unsprayed treatment in plots sprayed 12 months previously (Table 2) but not in plots sprayed 24 months previously. Retrospective defoliation assessments taken at the same time as these larval samples indicated that both spray treatments reduced defoliation in 2000. Defoliation levels in 1999 were unaffected by spray treatments.
Treatment effects on non-target moths
A total of 1828 identifiable non-target moths were caught in light traps in 2000 and 2001. See Table 3 for a list of frequently caught taxa with authority and family and published life history information and the observed date range of catches where catch numbers warranted.
Table 3. Catches in 2000 and 2001 of frequently caught moths (total catch ≥10) in light traps in each treatment, and observed date range of catches where numbers warrant. Infrequently caught species are also included if analyses identified them to be associated with treatments. Also included are life history information derived from the literature.
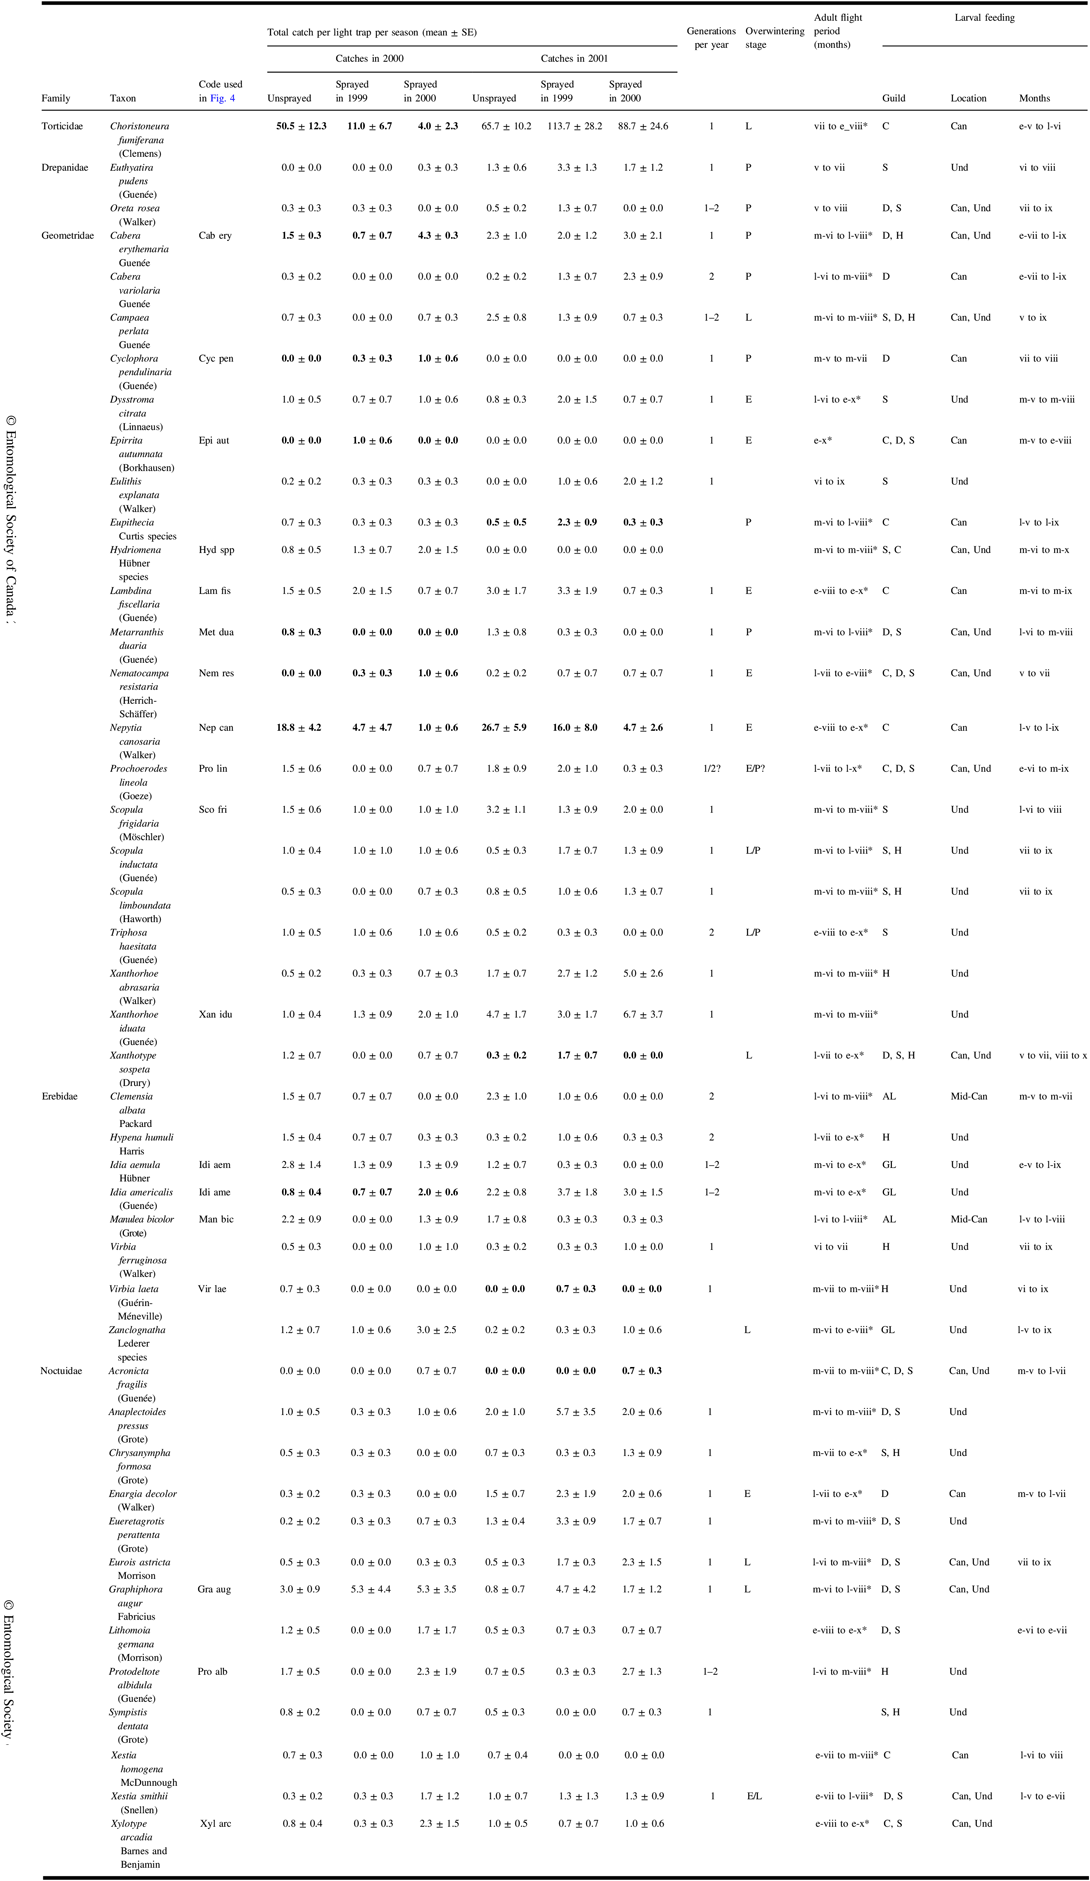
Means and standard error for the three treatments for a sample year are bold if redundancy analysis indicated a significant effect (Fig. 4) or if they were ranked highly by indicator species analysis (Table 5).
Months of adult flight period and of feeding are identified by Roman numerals, sometimes prefixed by e-, early; m-, mid; l-, late. Flight periods identified with * are the range of catch dates observed in this study; other sources of life history information are Ives and Wong (Reference Ives and Wong1988), Prentice (Reference Prentice1963), and the identification resources listed in the “Methods” section.
Three taxa are closely related species that, because of wing wear, cannot be reliably distinguished in light trap catches. These combined taxa are:
Eupithecia species: a mixture of E. palpata Packard and E. misturata (Hulst)
Hydriomena species: a mixture of H. divisaria (Walker) and H. renunciata (Walker)
Zanclognatha species: mostly Z. jacchusalis (Walker) but we cannot rule out several being Z. protumnalis (Walker).
Overwintering stages – E, egg; L, larva; P, pupa; feeding guilds – C, coniferous trees; D, deciduous trees; S, shrubs; H, herbs; AL, arboreal lichens; GL, ground lichens and litter; feeding location – Can, canopy; Mid-Can, mid-canopy; Und, understorey; SE, standard error.
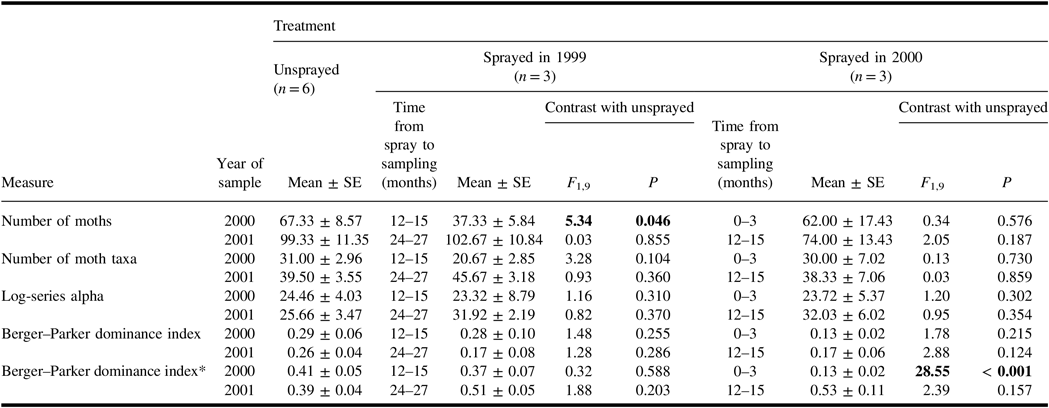
In light traps in 2000, average total catch of non-target taxa in plots sprayed the previous year was lower than in unsprayed plots (Table 4). There were no other significant effects of spray treatment on total catch per plot, number of taxa, or the log-series alpha index of diversity for non-target moths caught in light traps in either 2000 or 2001.
Table 4. Summary statistics (mean ± standard error) for total light trap captures per season of moths in plots of each treatment, and results of analysis of variance contrasts between unsprayed treatment and each sprayed treatment. Except when marked with an asterisk, all measures are for non-target species with spruce budworm excluded.
Results of contrasts are shown in bold if they are significant (α = 0.05).
* Data include values for spruce budworm.
SE, standard error.
When the Berger–Parker dominance index was calculated for non-target taxa only, no effects of spray treatments were evident. However, when spruce budworm catches in light traps were included in the calculation of the index, the indices were considerably elevated in almost all treatments, and in 2000, the index for catches in the sprayed 2000 treatment differed significantly from that in the unsprayed treatment. Spruce budworm was numerically dominant in light trap catches in 2000 in all unsprayed plots, and dominant in catches in every plot in 2001. Consequently, as illustrated by its effect on Berger–Parker indices, the inclusion of spruce budworm catches in summary statistics had a profound and often obscuring effect on how spray treatments affected the non-target assemblage.
The number of species estimated by rarefaction was calculated with and without spruce budworm (Fig. 2). Estimates based on a sample size of 30 (the smallest catch per plot in 2000) allowed the examination of the effects of inclusion or exclusion of spruce budworm. The dominance of spruce budworm in most plots resulted in lower estimates of the number of species when spruce budworm was included, except for the sprayed 2000 treatment in catches from 2000. Estimates based on samples of 30 also demonstrated that, despite a tendency for higher numbers of individuals and taxa in 2001 than in 2000 (Table 4), once corrected for sample size by rarefaction, species richness was similar in both years. Only one of the eight contrasts between unsprayed and a sprayed treatment (Fig. 2) was significant: when spruce budworm was included, there was a significant difference between estimates for the unsprayed and sprayed 2000 treatments in samples from 2000 (F = 13.6; df = 1,9; P = 0.005).
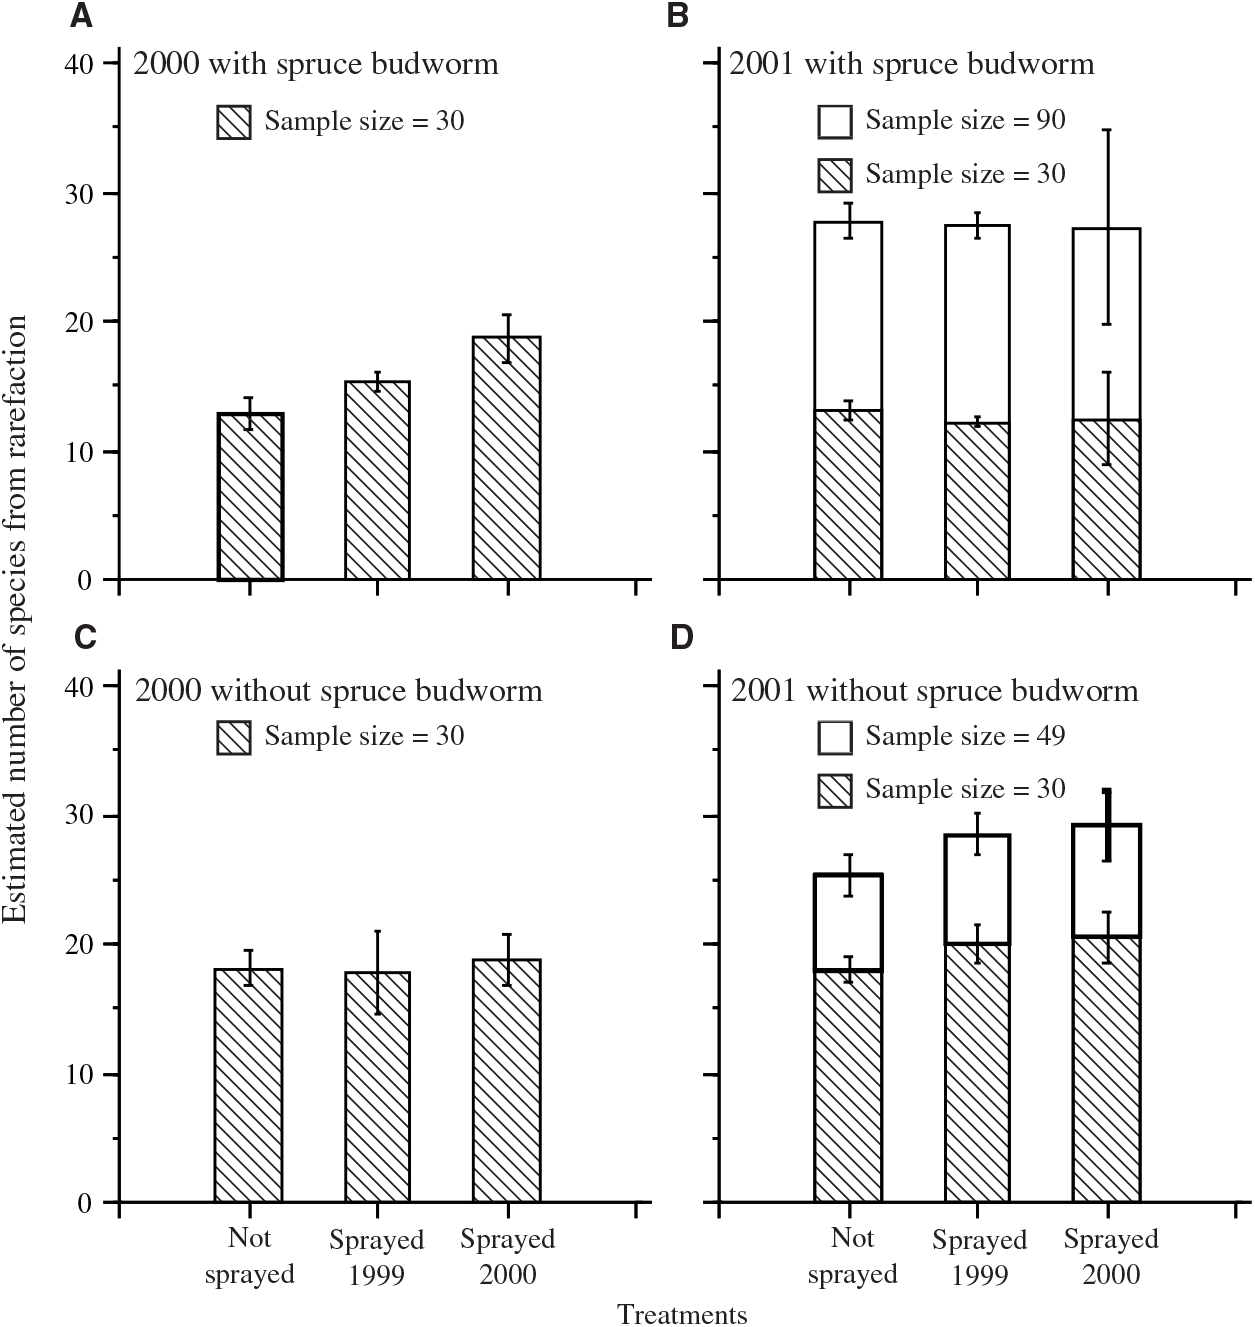
Fig. 2. Mean (± standard error) rarefaction estimates of standardised number of moth taxa per plot in light trap catches in each treatment sample. A, 2000 including spruce budworm; B, 2001 including spruce budworm; C, 2000 with spruce budworm excluded from rarefaction calculation; D, 2001 with spruce budworm excluded from rarefaction calculation. Hatched bars in all panels show estimates standardised to sample size 30, the smallest catch per plot in 2000. In B and D, the taller bars show estimates for the smallest catch in 2001.
Excluding specimens identified only to family level, a total of 162 non-target moth taxa were represented in light trap catches during the study; of these, 27 were present only in 2000 and 60 were present only in 2001. Although 54% of species were unique to one year, they represent only 12% of the non-target catch, as 83% of these species were represented by three or fewer specimens. Of the 102 taxa present in catches in 2000, 24% were found in all three treatments. The Sørensen qualitative coefficient of similarity (Fig. 3) showed little difference in the degree of similarity of taxon occurrence in pairs of treatments in samples from 2000; however, the Morisita–Horn coefficient, which is influenced by the number of individuals of each taxon, indicates relatively low similarity between unsprayed and sprayed 2000 treatments compared with other pairs of treatments. A total of 135 taxa were represented in light trap catches in 2001, of which 33% were present in all treatments. Both qualitative and quantitative coefficients indicated greater similarity between assemblages in pairs of treatments than in the previous year. In the 2001 samples, the Morisita–Horn coefficient again indicated that the unsprayed and sprayed 2000 treatments were the least similar pair of treatments.

Fig. 3. Venn diagrams showing the pattern of presence of non-target taxa within and among treatments in catches in Luminoc light traps. A, 2000; B, 2001. Similarity of assemblages in pairs of treatments is represented by the Sørensen qualitative coefficient (C S ) and Morisita–Horn quantitative coefficient (C MH ).
The redundancy analysis ordination of light trap catches of non-target moths in 2000 explained a total of 39.5% of variation in the assemblage, and the two axes relating to treatments were significant (Monte Carlo F = 2.9, P = 0.018). Axis 1 (Fig. 4) was strongly associated with differences between sprayed and unsprayed treatments (F = 5.2, P = 0.006), with the centroid for sprayed 2000 most removed from that for the unsprayed treatment. The centroid for sprayed 1999 is intermediately placed with respect to axis 1 and separated from both the other treatments with respect to axis 2, which explains only a small amount of variation. From t-value biplots, it was determined that there were significant positive associations of the two species (Nepytia canosaria and Metarannthis duaria) with the unsprayed treatment. One species, Epirrita autumnata, had a significant negative association with the unsprayed treatment, and a significant positive association with the sprayed 1999 treatment. Three species (Cabera erythemaria, Cyclophora pendulinaria, and Nemetocampa resistaria) had significant positive associations with the sprayed 2000 treatment.
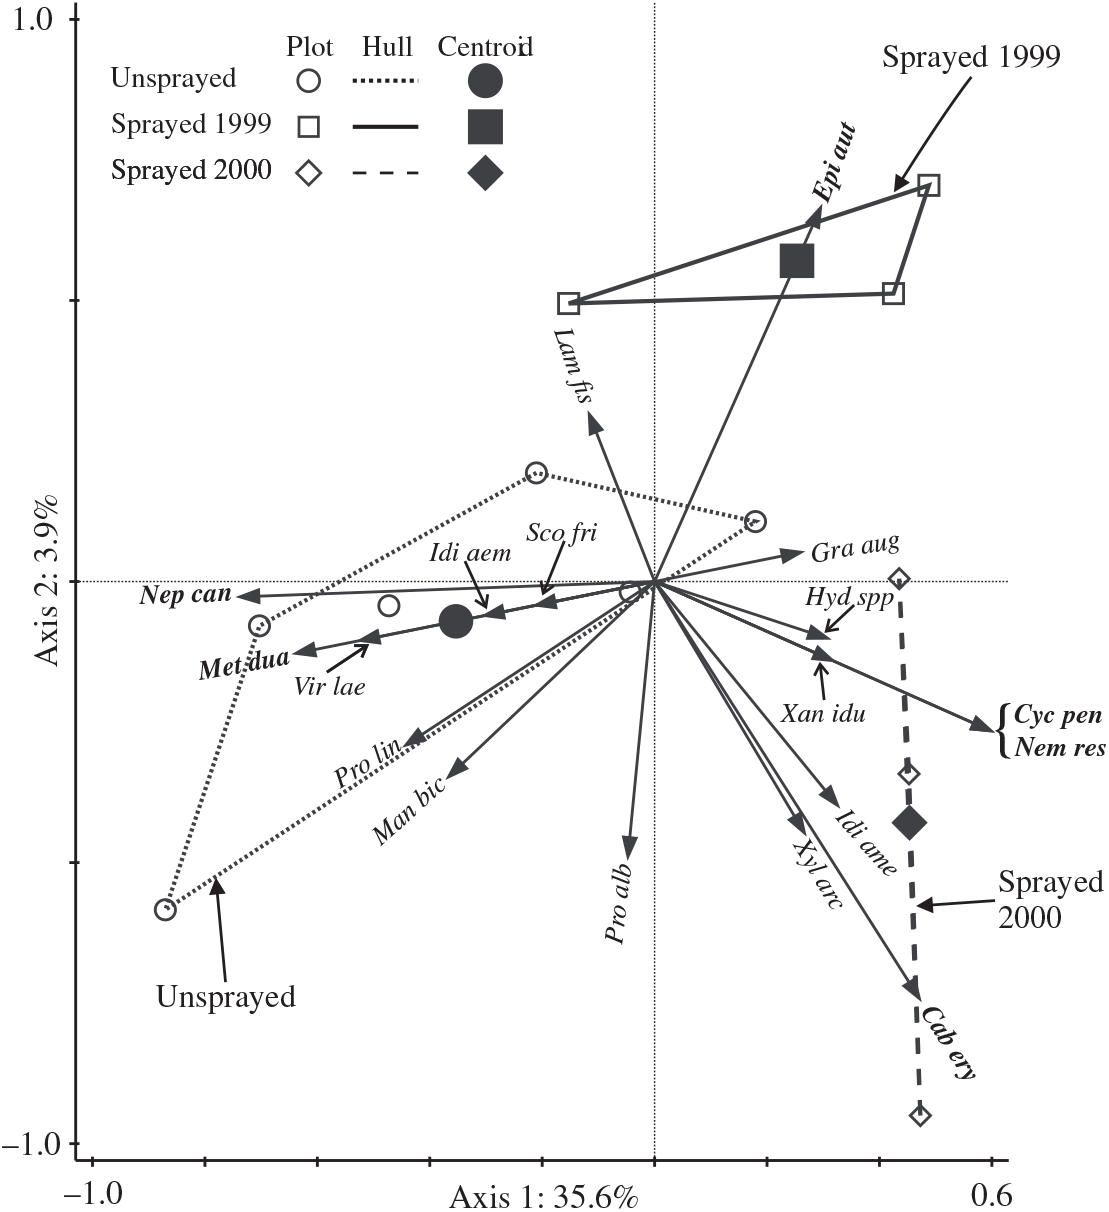
Fig. 4. Triplot showing the results of redundancy analysis ordination of catches of non-target taxa in light traps in 2000. Arrows for the most frequently caught species (total 2000 catch ≥10) and those with significant positive associations with treatments (bold italic labels) are shown. Significant associations are detectable only when there are sufficient numbers of a species caught: for the unsprayed treatment, associations were potentially detectable for 33 species, and for each spray treatment, associations were potentially detectable for 51 species. Arrows for two species (Scopula inductata and Triphosa haesitata) are invisible because they begin and end at the origin. Plots in the same treatment are contained by a convex hull. Key to species labels is in Table 3.
The redundancy analysis ordination of light trap catches from 2001 explained 15.6% of variance, and no axes were significant (F = 2.0, P = 0.112). As redundancy analysis axes depict general responses of an assemblage to treatment variables, it can be concluded that general responses to treatments were weak in 2001.
Unlike the redundancy analysis, the indicator species analysis of light trap catches (Table 5) included spruce budworm, which, in the analysis for catches from 2000, was the most significant indicator for the unsprayed treatment. The next four species in the ranking of indicator values in the 2000 analysis conform in their associations with those identified in the redundancy analysis for the same year. In both years of sampling, Nepytia canosaria ranked third in indicator values and was associated with the unsprayed treatment. In the indicator species analysis of catches from 2001, spruce budworm was not identified as an indicator species, and the only two significant indicators were associated with the sprayed 1999 treatment.
Table 5. Results from indicator species analysis for adult moths caught in light traps in 2000 and 2001 showing species and indicated treatment, observed indicator value (IV), and results of Monte Carlo tests of significance.
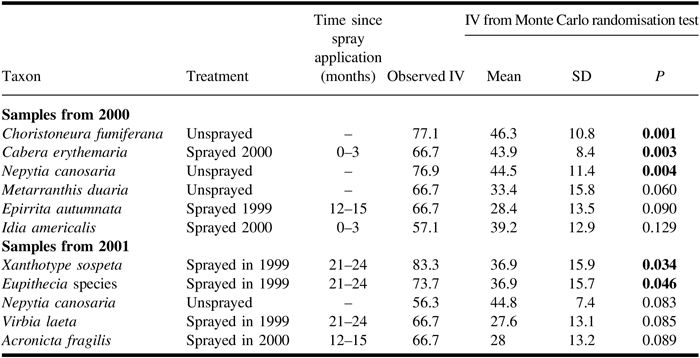
Results of Monte Carlo tests are shown in bold if they are significant (α = 0.05). Only significant and the first three non-significant species are shown. For samples from 2000, trap catches were high enough to have the potential to be significant indicator species for 33 species for unsprayed and 51 species for each sprayed treatment. For 2001, the corresponding numbers are 53 species for unsprayed and 76 species for each sprayed treatment.
SD, standard deviation.
In samples of geometrid and other non-target Lepidoptera larvae taken from understorey vegetation on four occasions in 2000 (Table 6), the mean number of non-geometrid larvae was significantly higher in unsprayed plots than in plots sprayed in the previous two days. Although numbers in the unsprayed treatment tended to be higher than in sprayed treatments for most other samples, none of these differences were significant.
Table 6. Numbers (mean ± standard error) of non-target larvae per sample from understorey vegetation taken in 2000 in plots of each treatment, and results of analysis of variance contrasts between unsprayed treatment and each sprayed treatment.
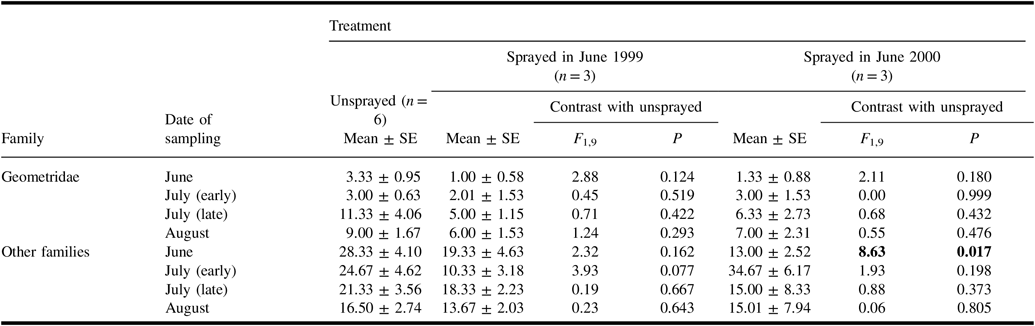
Results of contrasts are shown in bold if they are significant (α = 0.05).
SE, standard error.
Discussion
Operational spruce budworm management programmes involve applications under a range of environmental conditions to a mosaic of spruce budworm-susceptible forest stands. Our experimental stands were fitted within sprayed and unsprayed blocks selected on the basis of forest management criteria, and received applications over the range of dates and conditions typical of operational control programmes. Our plots were dominated by spruce budworm hosts, and their vegetation was characteristic of the boreal plain ecozone, but individual plots (details in Saunders Reference Saunders2003) fell within the several white spruce or black spruce mixedwood forest ecosystem classes (Zoladeski et al. Reference Zoladeski, Wickware, Delorme, Sims and Corns1995). Thus, our study intentionally included several sources of variation that are inherent in operational spruce budworm management programmes, but which might reduce the sensitivity of detection of treatment effects. However, the absence of significant differences between unsprayed and sprayed treatments in 29 of 30 contrasts of structural and vegetative measures suggests that confounding effects of forest variability were unlikely to overwhelm the direct effects of spray application.
Effects on spruce budworm
We will consider first the results for the sprayed 2000 treatment, as our sampling provides the most complete record of responses to this treatment. Relative to the unsprayed treatment, the sprayed 2000 treatment had lower numbers of spruce budworm larvae in the understorey after application, and there was reduced defoliation in 2000. As in the studies reviewed in Holmes and MacQuarrie (Reference Holmes and MacQuarrie2016), tebufenozide application caused high levels of mortality of larval spruce budworm in the year of application. In the mid-summer flight period of 2000, light trap catches of adult spruce budworm moths were much lower in the sprayed 2000 treatment than in the unsprayed treatments – a result that would not have occurred if the majority of moths in traps had immigrated from outside the treatment blocks. Rhainds and Kettela (Reference Rhainds and Kettela2014) concluded that light traps that, like ours, are hung in host trees are likely to catch a high proportion of local moths. Newly emerged females usually mate within 24 hours (Outram Reference Outram1971) but, unless food-deprived larvae, cannot fly from their natal stand until they have reduced their body mass through oviposition (Wellington Reference Wellington1948; Van Hezewijk et al. Reference Van Hezewijk, Wertman, Stewart, Béliveau and Cusson2018) of about 50% of their eggs (Rhainds and Kettela Reference Rhainds and Kettela2013). These phenomena are probably responsible for the Rhainds and Kettela (Reference Rhainds and Kettela2014) observation of correlation of numbers of eggs and catches of moths in light traps located in the tree canopy. In our study, we did not assess egg numbers, but the diminished numbers of larvae in branch samples taken in 2001 provide evidence for reduced oviposition in 2000 following tebufenozide application of that year. In the sprayed 2000 treatment, tebufenozide affected larval numbers 12 months after application, but there was no detectable effect on catches of adults 12–15 months after application.
The incidence of spruce budworm in the sprayed 1999 treatment has some similarities with patterns in sprayed 2000. Compared with the unsprayed treatment, canopy defoliation in 2000 in the sprayed 1999 treatment was reduced, indicating lower numbers of spruce budworm larvae in the canopy 12 months after tebufenozide application. In contrast to the sprayed 2000 treatment, there was no significant effect of the 1999 application on the level of defoliation in the year of application.
In both spray treatments, there were reduced spruce budworm larval numbers 12 months after application, as has previously been reported (Cadogan et al. 2002, Reference Cadogan, Scharbach, Knowles and Krause2005; Régnière et al. Reference Régnière, Cadogan and Retnakaran2005). The multi-year effect in our study most likely arose because of reduced levels of oviposition later in the summer of application. Reduced oviposition is partly attributable to there being fewer females surviving to lay eggs in sprayed treatments, and partly attributable to diminished reproductive performance of survivors (Dallaire et al. Reference Dallaire, Labrecque, Marcotte, Bauce and Delisle2004; van Frankenhuyzen and Régnière Reference van Frankenhuyzen and Régnière2017).
Effects on non-target moths
For light trap catches in 2000, there are several lines of evidence that suggest that spruce budworm was more strongly affected by treatment than were most non-target moths. Compared with the unsprayed treatment, the total catch of spruce budworm in the sprayed 1999 treatment was reduced by 78%, but by only 45% for non-target moths, and in the sprayed 2000 treatment, the total catch was significantly reduced for spruce budworm, but not for non-target moths. Comparisons of analyses of diversity measures with and without spruce budworm also showed that spruce budworm and the non-target assemblage were not equally affected by the sprayed 2000 treatment. Rarefaction estimates are strongly affected by dominance (Magurran Reference Magurran2004), and these and the Berger–Parker index of dominance were significantly affected by the sprayed 2000 treatment, when spruce budworm was included, but not when it was excluded. Log-series alpha is relatively uninfluenced by dominance (Taylor et al. Reference Taylor, Kempton and Woiwod1976), and was not affected by treatment regardless of the inclusion or exclusion of spruce budworm. Hence we can conclude that the reduction of spruce budworm dominance was the most important effect on moth diversity, and that species richness, dominance, and evenness of the non-target assemblage were not strongly affected by tebufenozide treatments.
Measures of similarity between the non-target assemblages in pairs of treatments that rely on species presence in light trap catches were relatively insensitive to spray treatments. In contrast, measures based on the number of each species caught showed that the unsprayed treatment was least similar to the most recently sprayed treatment, and that similarity of a sprayed treatment with the unsprayed treatment increased with time elapsed since spraying. It can be inferred that there was little effect of spraying on the presence or absence of species, but that there was an effect on species abundance that diminished over time. These inferences are supported by the redundancy analysis and indicator species analysis, which are influenced by species abundance, and which showed a strong influence on the 2000 catches of whether or not plots were sprayed, but no significant effects of this contrast in the following year.
At the time of spray application, budworm larvae feed on new foliage at branch tips, if available (Morris Reference Morris1963), and their density per unit area of foliage may be the highest in the upper canopy (Eveleigh and Johns Reference Eveleigh and Johns2014). Thus, the distribution and feeding behaviour of spruce budworm larvae lead to them ingesting lethal doses of aerially applied tebufenozide, compared with lepidopterous larvae that feed in more protected locations. We expected that non-target Lepidoptera would be most vulnerable to the toxic effects of tebufenozide if the time and location of their larval feeding were similar to those of late instar spruce budworm. The anticipated effects of such vulnerability would be to reduce light trap catches in the same year as the application if adults fly later in the year in which feeding larvae are exposed to the application, or in the year following the application if species are univoltine and overwinter as larvae or pupae.
In the light traps, Nepytia canosaria was the species most consistently identified to have a positive association with the unsprayed treatment – and hence a negative association with sprayed treatments. In the prairie provinces, this species overwinters in the egg stage (Ives and Wong Reference Ives and Wong1988). Larvae feed in the canopy of coniferous trees and have been recorded from late May until late September (McGuffin Reference McGuffin1987). Thus, it appears likely that larvae were feeding in foliage at or shortly after the time of tebufenozide application. The catches of N. canosaria were depressed in the year of application and the following year, but were similar to the levels in unsprayed treatment by two years after the application.
In the light trap catches from 2000, Metarranthis duaria was also associated with the unsprayed treatment. Larvae feed on deciduous trees and shrubs and occur both in the canopy and the understorey from late June until mid-August (McGuffin Reference McGuffin1987). As M. duaria is univoltine and overwinters as a pupa, the effects of tebufenozide on light trap catches would lag one year behind the application. Thus, in the 2000 light trap catches, the absence of this species in the sprayed 1999 treatment is consistent with larval mortality in 1999, but the absence of the species in the sprayed 2000 treatment cannot be attributed to tebufenozide application. This species was caught in small numbers, and never caught in the sprayed 2000 treatment, so it may be that the pattern of catches is related more to site conditions than to treatment effects.
In addition to the two species that were significantly associated with the unsprayed treatment in the redundancy analysis of 2000 light trap catches, four other species had vectors pointing in the same direction in ordination space and averaged greater than one per trap in at least one treatment. All of these species have larval stages beginning in May or June and so would likely be feeding at the time of tebufenozide application. Two of the species, Prochoerodes lineola, which feeds on a wide range of trees and shrubs (Prentice Reference Prentice1963), and Manulea bicolor, which eats arboreal lichens (University of Alberta 2016), occur in the canopy where they would be most exposed to spray applications. Scopula frigidaria larvae feed on understorey shrubs (Handfield Reference Handfield1999), where exposure to tebufenozide may have been less but was still sufficient, immediately after the application in 2000, to reduce the numbers of non-geometrid larvae. Idia aemula feeds on leaf litter on the forest floor (University of Alberta 2016), and might be expected to have been relatively protected from spray applications; yet, unlike I. americalis which has a similar feeding habit, I. aemula was more frequently caught in the unsprayed treatment.
Life history information for some of these species is scanty or contradictory, and may be derived from regions with longer and warmer growing seasons compared to our study area. For P. lineola (as P. transversata (Drury)), McGuffin (Reference McGuffin1987) reported overwintering as an egg, and a larval period preceding the flight period, consistent with a univoltine life cycle; however, Ives and Wong (Reference Ives and Wong1988) reported that there are apparently two generations in the prairie provinces and that pupae overwinter. Our catch patterns for this species showed the lowest number in the year following tebufenozide application, which is most consistent with a univoltine life cycle with pupal overwintering. The catches of M. bicolor were also low in the year following application; this could indicate that this is a univoltine species with a pupal overwintering stage. However, no life history information on M. bicolor is available in the literature (University of Alberta 2016).
A positive association of light trap catches of a species with a sprayed treatment may be interpreted as indicating that tebufenozide treatment did not cause significant larval mortality but favoured the insects in some way. Reducing the number of a dominant defoliator can favour non-target defoliating caterpillars through increased availability or modified chemistry of foliage of the host of the dominant defoliator (Sample et al. Reference Sample, Butler, Zivkovich, Whitmore and Reardon1996); there can also be positive effects on non-target species through changes in shared natural enemies (Schmidt and Roland Reference Schmidt and Roland2006), or modifications in the forest environment resulting from the suppression of defoliation (Sample et al. Reference Sample, Butler, Zivkovich, Whitmore and Reardon1996; Strazanac and Butler Reference Strazanac and Butler2005). Our methodology was not designed to identify mechanisms underlying positive associations with sprayed treatments; however, if adequate life history information is available, the observed patterns of catch can provide some insight into potential and unlikely mechanisms.
In the redundancy analysis of light trap catches of 2000, Epirrita autumnata was positively associated with sprayed 1999 treatments. Moths were caught only in two plots of the sprayed 1999 treatment and only in 2000. Larvae feed on conifers and deciduous trees and, in the prairie provinces, commence feeding in early June (McGuffin Reference McGuffin1958). We would expect the 1999 tebufenozide application to have caused larval mortality in 1999 and, as survivors would fly later in the same year (McGuffin Reference McGuffin1958), that there would have been fewer moths had we sampled in 1999. The catches in 2000 in the sprayed 1999 treatment might indicate that E. autumnata larvae feeding in 2000 benefited from the reduced spruce budworm competition and defoliation in that spring.
In 2000, the catches of Cabera erythemaria, Cyclophora pendulinaria, and Nematocampa resistaria were significantly positively associated with the sprayed 2000 treatment. The larvae of C. erythemaria and C. pendulinaria feed on deciduous trees (Prentice Reference Prentice1963) and, in the prairie provinces, are univoltine and overwinter as pupae (Ives and Wong Reference Ives and Wong1988). Although McGuffin (Reference McGuffin1987) indicated that N. resistaria overwinters in the egg stage, in the prairie-specific treatment of Ives and Wong (Reference Ives and Wong1988), the species was reported to be univoltine with pupal hibernation and capable of feeding on both conifers and deciduous trees. Thus, for these three species, moths caught in 2000 would have completed larval development in 1999, and so the mechanism of response to the sprayed 2000 treatment did not involve larval interactions with spruce budworm or their defoliation. It may be that, in 2000, the conditions in the sprayed 2000 sites favoured visits from females seeking oviposition sites: defoliation had been reduced by tebufenozide application, and these sites had the highest proportion of deciduous trees.
In the 2000 light trap catches, for which the redundancy analysis was significant, there were several relatively common taxa that did not respond significantly to treatment. Of these, the most frequently caught was Graphiphora augur, which were adults at the time of spray application (Moth Photographers Group 2015). Also common was Lambdina fiscellaria whose larvae feed from mid-June to October, but are most commonly on foliage in July in the prairie provinces (Prentice Reference Prentice1963). The temporal separation of spray application and larval feeding may have been sufficient to protect the larvae of both species from encounters with lethal levels of tebufenozide. Zanclognatha species were also relatively frequently caught in 2000 and showed no response to treatment. The larvae of Z. jacchusalis are detritivores feeding on leaf litter (Pacific Northwest Moths 2016) and so are less likely to receive lethal levels of tebufenozide than are canopy dwellers.
Catches in 2001 of Eupithecia species and Xanthotype sospeta were significantly positively associated with the sprayed 1999 treatment in the indicator species analysis. Eupithecia larvae feed on conifers in the canopy at the time of tebufenozide application (Prentice Reference Prentice1963) and, as overwintering is in the pupal stage, we expect adult catches in the sprayed 1999 treatment to have been depressed in 2000. The sprayed 1999 treatment had reduced spruce budworm numbers and defoliation in 2000, which would have favoured Eupithecia larvae in that year, leading to higher numbers of moths in 2001. Xanthotype sospeta overwinters as a fifth instar and, during the period of tebufenozide application, develops through two more instars (McGuffin Reference McGuffin1981); the surviving larvae could be caught as adults later in the year of application. The larvae of X. sospeta feed primarily on understorey shrubs and herbs (Prentice Reference Prentice1963), so they would have been less exposed to tebufenozide application than were canopy dwellers, and it is implausible for the positive indicator species analysis finding to be a direct result of relaxed competition from spruce budworm.
In general, the foregoing discussion supports the hypothesis that non-target species with larvae feeding in the forest canopy at the time of application are most likely to be negatively affected by tebufenozide. This supports the findings of the only other study to examine non-target effects of tebufenozide on Lepidoptera (Butler et al. Reference Butler, Kondo and Blue1997), where weekly canopy foliage samples were taken in oak stands that had been treated in May for gypsy moth control. The numbers of five commonly collected species of larvae were significantly reduced in sprayed plots, and four of the five have larvae feeding at or shortly after the application. The numbers of species and total numbers of macrolepidoptera larvae were reduced in larval samples taken in spring or early summer both in the year of application and in the following year (Butler et al. Reference Butler, Kondo and Blue1997).
Using light trap catches as a means of detecting non-target effects had the benefit of allowing a large number of taxa in the non-target assemblage to be assessed, and permitted the use of redundancy analysis to elucidate the general effects of treatments across many taxa. The general negative effects were not detectable more than 12–15 months after tebufenozide application. So we conclude that the assemblage in our plots had largely recovered by 15 months after treatment even though recolonisation of our plots may have been inhibited by their being embedded in the large spray blocks of an operational spruce budworm management programme. Other studies that used light traps to study the effects of Lepidoptera-specific insecticides on non-target Lepidoptera have involved B. thuringiensis application against gypsy moth. In West Virginia, total catches of macrolepidoptera were reduced by B. thuringiensis both in the year of application and in the following year; the catches of geometrid moths were lower in sprayed plots in the year of treatment, and those of noctuid moths were reduced in the year following treatment (Sample et al. Reference Sample, Butler, Zivkovich, Whitmore and Reardon1996). A second study in the same geographic area (Strazanac and Butler Reference Strazanac and Butler2005) used light traps to study the non-target effects of gypsy moth control during two consecutive years of B. thuringiensis application and for three subsequent years. Compared with the unsprayed controls, moth catches of univoltine species with larvae feeding at the time of application were significantly reduced by B. thuringiensis. Of eight commonly caught univoltine species with larvae feeding during applications, three showed significant reductions in light trap catches in B. thuringiensis treatments, and for two of these, the effects persisted for two years after treatments ended. As our study detected no significant negative effects of tebufenozide beyond 15 months after application, it seems that the greater persistence of effect of tebufenozide than B. thuringiensis against spruce budworm (Sundaram et al. Reference Sundaram, Sundaram and Sloane1996; van Frankenhuyzen et al. Reference van Frankenhuyzen, Nystrom, Dedes and Seligy2000) does not result in tebufenozide having more persistent non-target effects.
A disadvantage of using light traps is the large burden of specimen preparation and identification required to characterise the assemblage as completely as possible. The indicator species analysis, coupled with insights from the redundancy analysis, could allow the selection of one or a few species that could be used to indicate the general effect without the labour of identifying all the specimens. The catches of N. canosaria were most consistently negatively affected by spraying. Nepytia canosaria had advantages as an indicator in our study: it was the most frequently caught and displayed the most consistent negative response to spraying, among the non-target species; because the overwintering stage is the egg, the effects of larval mortality are initially evident in trap catches in the same year as treatment. The range of N. canosaria extends from Saskatchewan eastwards to the Atlantic coast (McGuffin Reference McGuffin1987), the area of Canada in which C. fumiferana is most frequently controlled. Hence the comparisons of light trap catches of N. canosaria in treated and untreated areas could be used as a monitoring tool for non-target effects of tebufenozide in future spruce budworm management programmes. However, for each geographic area, it would be wise to validate the status of N. canosaria as the best indicator species in that area.
Acknowledgements
We thank M. Thiessen, D. Wytrykush, B. Jones, J. Shaddock, J. Ackerman, H. Tomkins, J. Heanult, and R. Boone for field and laboratory assistance. K. Knowles, Forestry Branch, Manitoba Sustainable Development, and B. Remphrey, Department of Plant Science, University of Manitoba, provided guidance on the design and implementation of the project. This research was funded primarily by Manitoba Sustainable Development and the Manitoba Hydro Forest Enhancement Program.


