


Introduction
More than 3.5 million Healthcare-Associated Infections (HAIs) are reported in the European Union/European Economic Area (EU/EEA) each year, resulting in more than 90,000 deaths and approximately 2.5 million disability-adjusted life years (DALYs). Reference Latour and Kärki1 The incidence of HAIs with adverse patient outcomes increases with age, making older people more vulnerable to HAIs and their complications. Reference Cristina, Spagnolo, Giribone, Demartini and Sartini2 Long-term care facilities (LTCFs), due to their community-based nature and frail elderly users, are particularly exposed to increased incidences of HAI-associated morbidity and mortality.
The Healthcare associated infections and antimicrobial use in European LTCFs projects, led by the European Centre for Disease Prevention and Control (ECDC), reported a pooled HAI prevalence between 2.6% and 3.7%. Reference Bennett, Tanamas and James3,4 Based on national prospective surveillance studies, the incidence of HAIs in European ranges from 2.1 to 11.8 per 1,000 resident days. Reference Engelhart, Hanses-Derendorf, Exner and Kramer5,Reference König, Medwed and Pux6 A pilot Point Prevalence Study conducted in 2022 in Italy, found that 2.5% of residents experienced at least one case of HAI, including COVID-19. Reference Vicentini, Russotto and Bazzolo7 A previous nationwide Italian study estimated that there were approximately 641,065 new HAI cases and 29,375 attributable deaths over a one-year period and the total annual burden was calculated to be 702.5 DALYs per 100,000 inhabitants. Reference Bordino, Vicentini, D’Ambrosio, Quattrocolo and Zotti8 Urinary tract infections (UTIs), respiratory tract infections (RTIs), gastrointestinal tract infections and skin and soft tissues infections are among the most reported HAIs. Reference Matheï, Niclaes, Suetens, Jans and Buntinx9 A recent European 12-month longitudinal study led by ECDC in 2022–2023 (H4LS study, “Healthcare-associated infections and antimicrobial use in LTCFs—support to a point prevalence survey and a longitudinal study,”) Reference Ricchizzi, Sasdelli and Leucci10 found a high incidence of HAIs in 65 LTCFs. One in two residents had at least one HAI, leading to hospitalization in 4.3% of total HAIs and death in 4.5% of cases, with RTIs and UTIs accounting for almost half of all HAIs.
LTCF residents are often viewed as a relatively homogeneous, highly frail group with multiple functional deficits. However, an individualized approach recognizes substantial heterogeneity in care needs, particularly regarding cognition and mobility, which are inversely related and major drivers of LTCF admission. Reference Fazio, Pace, Flinner and Kallmyer11,Reference Sverdrup, Bergh, Selbæk, Røen, Kirkevold and Tangen12 The risk of acquiring a HAI, with its associated increased morbidity and mortality, is influenced by specific resident characteristics including advanced age, underlying medical conditions, impaired cognitive and functional status, and the use of invasive devices such as indwelling urinary catheters. Reference Cristina, Spagnolo, Giribone, Demartini and Sartini2,Reference Bennett, Tanamas and James3 In this context, rather than quantifying frailty per se, identifying multidimensional resident profiles based on the concurrent assessment of functional, cognitive, and clinical characteristics associated with differential susceptibility to specific types of HAIs becomes fundamental.
Recent applications of machine learning (ML) models have demonstrated the potential to significantly enhance the prediction of HAIs. Predictive algorithms have been successfully applied to estimate the risk of HAIs in intensive care units, Reference Wang, Wang, Wang and Wang13 to identify bloodstream infections at an early stage, Reference Murri, De Angelis and Antenucci14 and to recognize patients at risk of acquiring RTIs, including COVID-19, during hospitalization. Reference Chang, Chang and Chien15,Reference Cho, Lee and Kim16 In many cases, these models have achieved promising predictive performance, with possible applications in supporting clinical decision-making and infection prevention and control (IPC). Reference El Arab17 However, while artificial intelligence (AI) has already been successfully applied in hospital settings for HAI prediction and antimicrobial stewardship, its use in LTCFs is still largely unexplored. Reference Arzilli, De Vita and Pasquale18 This study addressed this gap by applying an unsupervised ML approach in on LTCF resident data from the H4LS study. Reference Ricchizzi, Sasdelli and Leucci10 The aim was to identify resident subgroups with differing risk profiles and HAI susceptibility patterns based on a multidimensional clinical assessment, thereby supporting more targeted and personalized IPC strategies.
Methods
Study population and data collection procedures
This research was conducted following the guidelines outlined in the Strengthening the Reporting of Observational Studies in Epidemiology statement, Reference Vandenbroucke, von Elm and Altman19 using data collected within the H4LS study, aimed at assessing the incidence of HAIs and their associated mortality and hospitalizations in European LTCFs. Reference Ricchizzi, Sasdelli and Leucci10 Informed consent requirements prevented full baseline resident enrollment; therefore, a convenience sampling strategy was adopted rather than a complete census. Eligible residents were those expected to stay in the facilities for at least one year. The population of the present study consisted of 395 residents living in 24 LTCFs (nursing homes, residential homes or mixed type facilities), from two Italian regions, Emilia-Romagna and Piedmont.
The Italian study’s National Survey Coordinator provided each LTCF with the survey protocol and the following operational tools: an Institutional Questionnaire to collect LTCF characteristics, a Resident Questionnaire to collect clinical and demographic information for each resident and a HAI Questionnaire to record each HAI case occurred during the follow-up period. Information on temporary discharges from the facilities were also collected, to include only the HAIs acquired within the LTCFs in the analyses. All data converged into a national study database. The H4LS study procedures are detailed elsewhere. Reference Ricchizzi, Sasdelli and Leucci10
Definition of HAI
To ensure unambiguous identification of HAIs, definitions of HAIs followed the McGeer and revised McGeer criteria as adopted in the H4LS study Reference Ricchizzi, Sasdelli and Leucci10 and described in the ECDC protocol for surveillance in European LTCFs. 20 No modifications to these definitions were applied in the present analysis. The COVID-19 case definition was based on the positive result of a laboratory test. Asymptomatic cases were not considered. In addition to HAIs acquired within the facilities, HAIs related to a temporary discharge were also included when symptoms occurred more than two days after readmission, since these cases were partially or fully managed and treated within the LTCF.
Statistical analyses
The following HAI incidence metrics were computed from the crude sample data: (i) percentage, ie the number of HAIs per type, over the total number of HAIs; (ii) ratio, ie the cumulative incidence of HAIs per 100 residents, calculated as the number of HAIs per type divided by the total number of LTCF residents multiplied by 100; (iii) rate, ie the number of HAIs per 1,000 resident days, calculated as the ratio between the total number of HAIs and the sum of follow-up days multiplied by 1,000.
Due to the multi-center nature of the data, Generalized Estimating Equations models were also estimated with an appropriate link function (Poisson or binomial, based on variable types). The intercept of these models was used to obtain a clean measure of the multi-center effects.
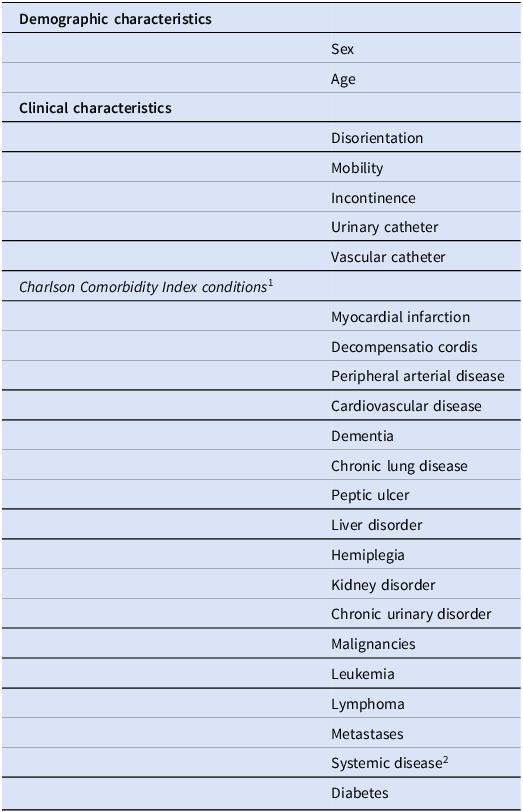
Unsupervised ML was used to identify groups of residents with similar clinical-demographic characteristics, and a hierarchical cluster analysis was performed using a dissimilarity matrix based on the Gower metric and the complete linkage clustering method. Table 1 reports the clinical and demographic variables that were used for clustering. To assess the robustness of the clustering solution, a bootstrap resampling procedure with 1,000 iterations was implemented. The stability of the resulting solutions was quantified using the adjusted Rand index (ARI) between each resampled clustering and the original solution, and the mean ARI was calculated as an overall measure of cluster reproducibility. After clustering, the characteristics of the resulting groups were examined through descriptive statistics and the incidence of each type of HAI was calculated for each group by means of the following measures: (i) number of each type of HAI divided by the total number of HAIs in the group multiplied by 100; (ii) number of each type of HAI divided by the total number of residents in the group multiplied by 100. In addition, a t-test for quantitative variables and a χ 2 test for qualitative variables were performed to test for any significant differences between the groups. In this study, clustering was applied as a data-driven stratification tool to group residents into distinct multidimensional susceptibility profiles rather than to rank residents by overall frailty; comparisons with a Frailty Index Reference Searle, Mitnitski, Gahbauer, Gill and Rockwood22 and the Charlson Comorbidity Index Reference Buntinx, Niclaes, Suetens, Jans, Mertens and Van den Akker21 are reported in Appendix A1.
Demographic, functional, clinical and comorbidity variables included in the machine-learning clustering analysis

Table 1 Long description
The table presents demographic, functional, clinical, and comorbidity variables included in a machine-learning clustering analysis. It is divided into three main sections: Demographic characteristics, Clinical characteristics, and Charlson Comorbidity Index conditions. The Demographic characteristics section includes Sex and Age. The Clinical characteristics section lists Disorientation, Mobility, Incontinence, Urinary catheter, and Vascular catheter. The Charlson Comorbidity Index conditions section includes Myocardial infarction, Decompensatio cordis, Peripheral arterial disease, Cardiovascular disease, Dementia, Chronic lung disease, Peptic ulcer, Liver disorder, Hemiplegia, Kidney disorder, Chronic urinary disorder, Malignancies, Leukemia, Lymphoma, Metastases, Systemic disease, and Diabetes. The table has three columns and twenty rows, providing a comprehensive list of variables used for clustering residents with similar clinical-demographic characteristics.
2 Systemic lupus erythematosus, polymyositis, mixed connective tissue disease, polymyalgia rheumatica, or moderate-to-severe rheumatoid arthritis.
Results
Clinical-demographic characteristics and incidence of HAIs in the resident population
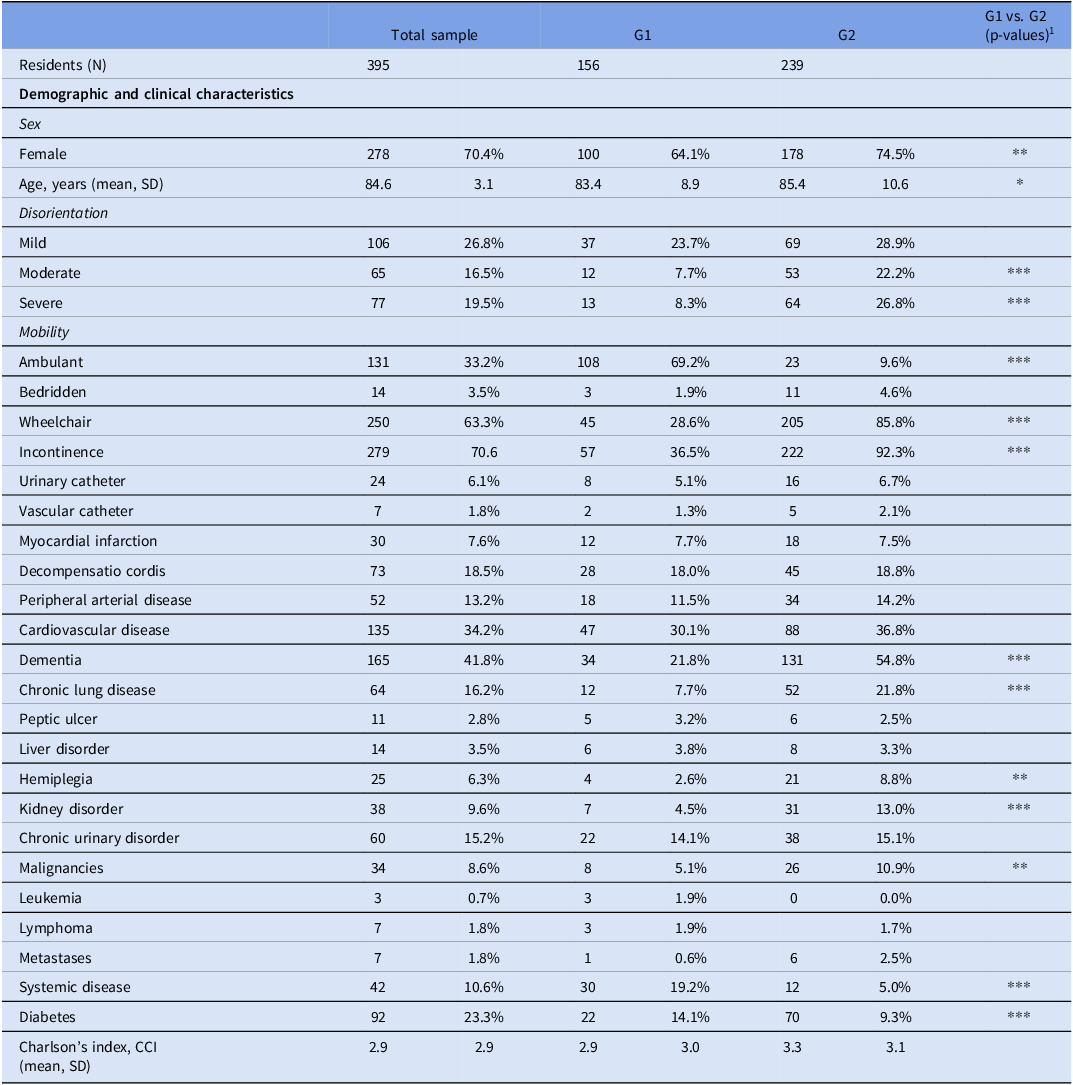
The 395 residents in the study population were predominantly women (70%) and had a mean age of 84.6 years (SD 3.1). Their clinical characteristics were heterogenous, with multiple health conditions (mean CCI = 2.9, SD: 2.2) (Table 2).
Demographic and clinical characteristics of LTCF residents, overall and by groups, after cluster analysis

Table 2 Long description
The table presents demographic and clinical characteristics of 395 long-term care facility residents, divided into two groups, G1 and G2. It includes data on sex, age, disorientation levels, mobility, incontinence, and various health conditions. The table has 31 rows and 5 columns, with columns for total sample, G1, G2, and p-values comparing G1 and G2. Notable trends include a higher percentage of females in G2 (74.5%) compared to G1 (64.1%), and a higher mean age in G2 (85.4 years) than in G1 (83.4 years). Disorientation levels vary significantly, with severe disorientation more prevalent in G2 (26.8%) than in G1 (8.3%). Mobility differences are stark, with 69.2% of G1 residents being ambulant compared to only 9.6% in G2. Incontinence is more common in G2 (92.3%) than in G1 (36.5%). Health conditions such as dementia, chronic lung disease, and kidney disorders show significant differences between the groups. The Charlson's Comorbidity Index (CCI) is slightly higher in G2 (3.0) compared to G1 (2.9).
1 P-values are reported as follows: * .01 ≤ P < .05; ** .001 ≤ P < .01; *** P < .001.
G1 and G2: groups resulting from the machine-learning clustering analysis.
Data source: Italian H4LS data set, 2023.
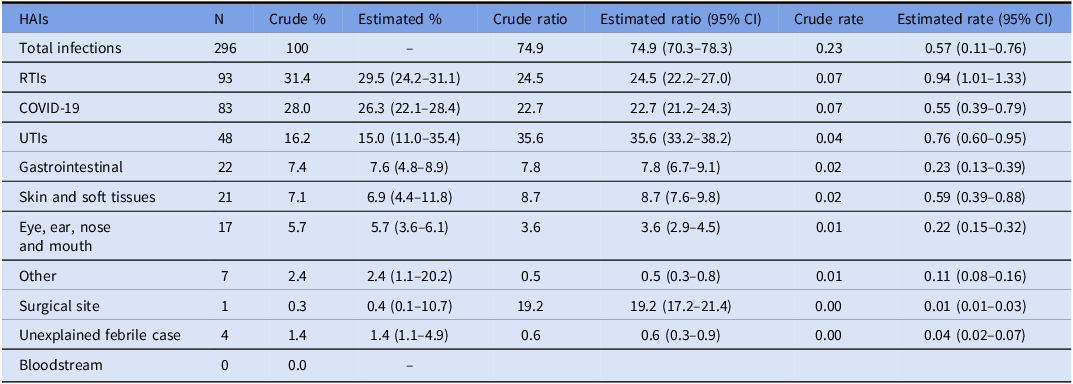
The total number of HAIs recorded during the study period was 296, with RTIs being the most reported (29.5%, 95% CI 24.2%–31.1%), followed by COVID-19 infections (26.3%, 95% CI 22.1%–28.4%) and UTIs (15%, 95% CI 11.0%–35.4%). Table 3 shows crude and estimated incidence measures by type of HAI.
Crude percentage, estimated ratio and rate by type of HAIs in the total sample (n = 395)

Table 3 Long description
The table presents crude and estimated incidence measures by type of healthcare-associated infections (HAIs) in a total sample of 395 individuals. It includes columns for the number of cases, crude percentage, estimated percentage with confidence intervals, crude ratio, estimated ratio with confidence intervals, crude rate, and estimated rate with confidence intervals. The table lists various types of HAIs such as respiratory tract infections (RTIs), COVID-19, urinary tract infections (UTIs), gastrointestinal infections, skin and soft tissue infections, eye, ear, nose, and mouth infections, other infections, surgical site infections, unexplained febrile cases, and bloodstream infections. RTIs are the most reported, followed by COVID-19 infections and UTIs. Each row provides detailed data on the incidence measures for each type of HAI.
RTIs, respiratory tract infections; UTIs, urinary tract infections.
Data source: Italian H4LS data set, 2023.
Clustering of residents
The algorithm produced two significant groups, characterized by low intra-group heterogeneity and high inter-group heterogeneity, reflecting the different clinical case mix of the residents. The quality of the clustering solution was good (silhouette coefficient: 0.59) and reproducibility of clusters was high (ARI: 0.83). Group 1 (G1) included 156 residents (39% of the sample); Group 2 (G2) included 239 residents (61%) (Table 2).
Compared to G1, residents in G2 were predominantly women (G1: 64% vs G2: 75%, P = .01), disoriented (G1: 40% vs G2: 78%, P < .0001), in a wheelchair (G1: 29% vs G2: 86%, P < .0001) and incontinent (G1: 37% vs G2: 92%, P < .0001). Moreover, regarding the clinical characteristics, G2 included a higher percentage of residents with dementia (G1: 22% vs G2: 55%, P = .001), chronic lung disease (G1: 8% vs G2: 22%, P < .0001), hemiplegia (G1: 3% vs G2: 9%, P = .02), kidney disorders (G1: 7% vs G2: 31%, P < .0001), malignancies (G1: 5% vs G2: 11%, P = .03) and diabetes (G1: 14% vs G2: 29%, P < .0001). In contrast to G2, most of the G1 residents were ambulant (69.2%). G1 was characterized by a significantly higher percentage of residents with systemic disease (G1: 19.2% vs G2: 5.0%, P = .001). The mean age of G1 and G2 was 83 (SD 8.9) and 85 (SD 10.6), respectively.
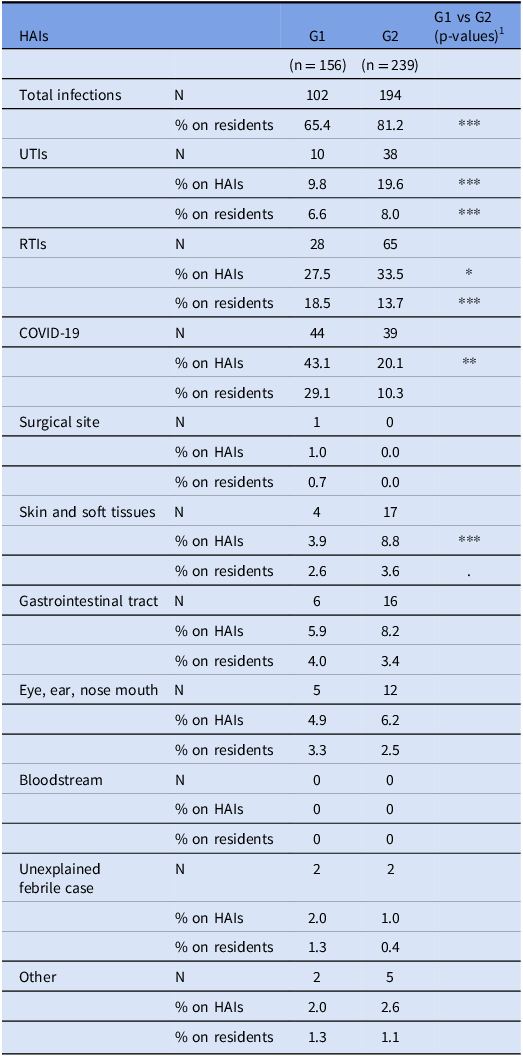
The proportion of HAIs in G2 was significantly higher than in G1 (G1: 65.4% vs. G2: 81.2%, P < .0001), highlighting an increased susceptibility of this group to HAIs, including UTIs (G1: 9.8% vs. G2: 19%, P < .0001), RTIs (G1: 27.5% vs. G2: 33.5%, P = .04) and skin and soft tissues infections (G1: 3.9% vs. G2: 8.8%, P < .0001). G1 was characterized by a higher percentage of COVID-19 infections (G1: 43.1% vs. G2: 20.1%, P = .02) (Table 4).
Percentage of type of HAIs by groups

Table 4 Long description
The table compares the percentage of healthcare-associated infections (HAIs) between two groups, G1 and G2. It includes data on total infections, urinary tract infections (UTIs), respiratory tract infections (RTIs), COVID-19, surgical site infections, skin and soft tissue infections, gastrointestinal tract infections, eye, ear, nose, and mouth infections, bloodstream infections, unexplained febrile cases, and other infections. The table has 12 rows and 5 columns, with column headers including HAIs, G1, G2, and G1 vs G2 (p-values). Notable trends include a higher proportion of HAIs in G2 compared to G1, with significant differences in UTIs, RTIs, and skin and soft tissue infections. G1 has a higher percentage of COVID-19 infections. The data highlights increased susceptibility to HAIs in G2.
RTIs, respiratory tract infections; UTIs, urinary tract infections; HAIs, healthcare-associated infections.
1 P-values are reported as follows: .10 < P < .05; * .01 ≤ P < .05; ** .001 ≤ P < .01; *** P < .001.
Data source: Italian H4LS data set, 2023.
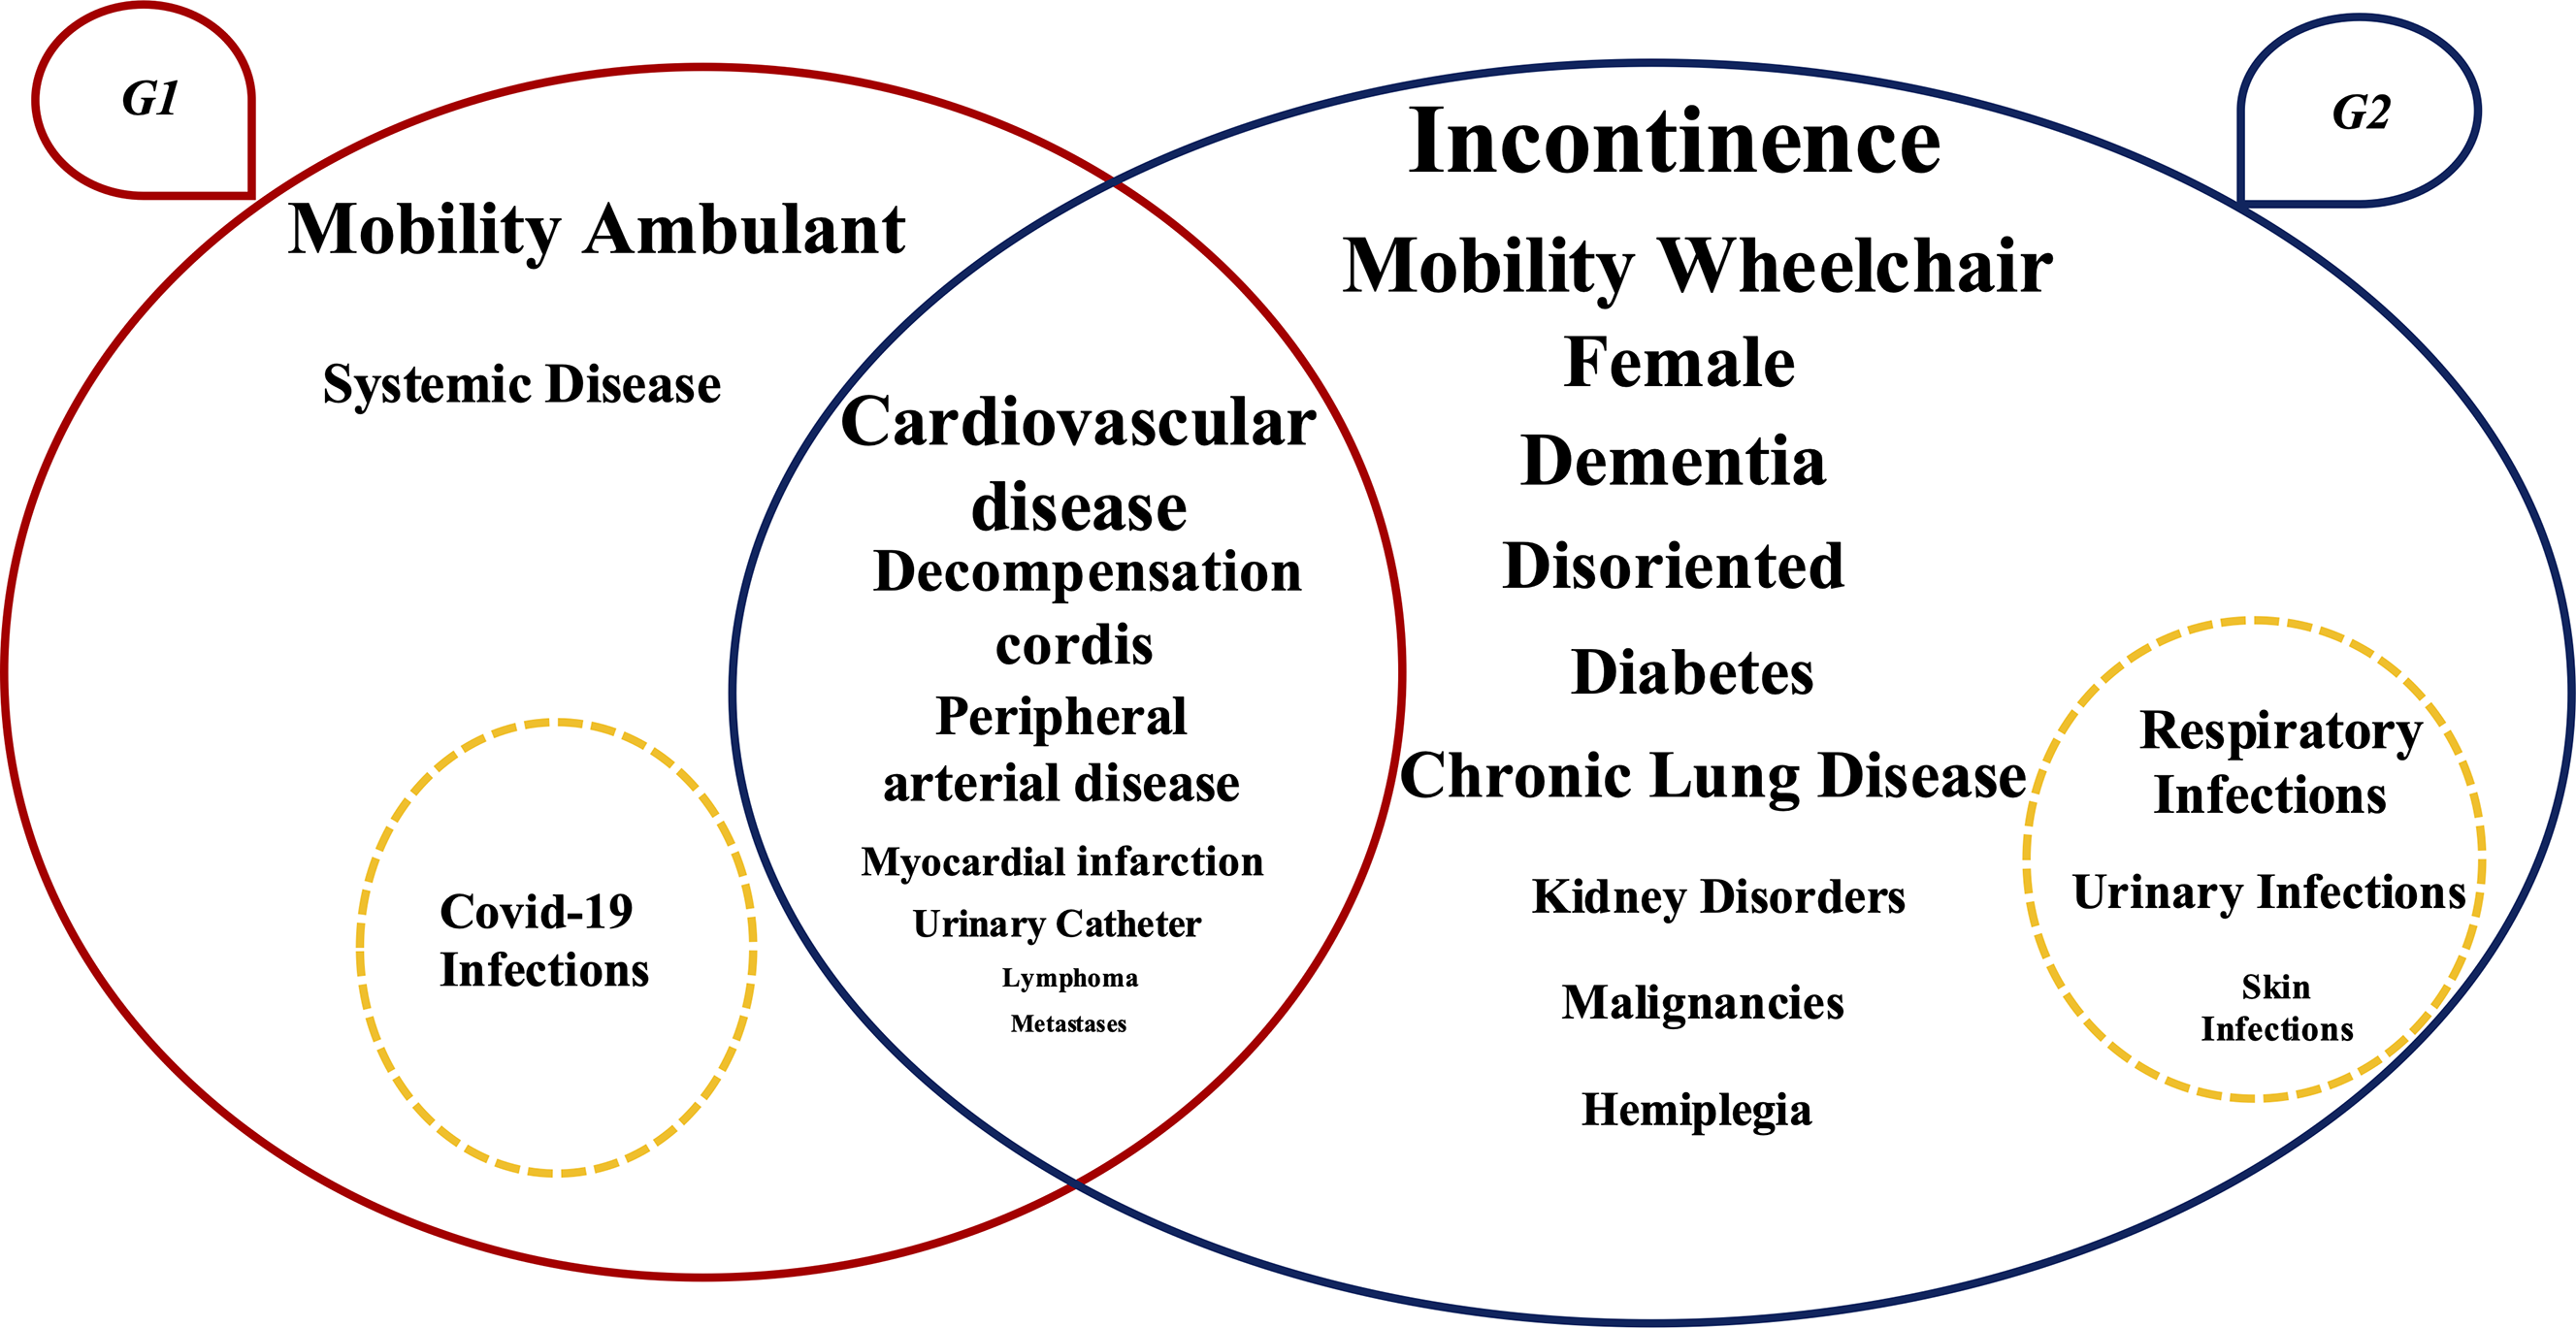
Figure 1 summarizes the clustering results shown in Tables 2 and 4.
Visual representation of the clustering results (N = 395). Note: G1 and G2 are represented by ovals with the corresponding clinical conditions reported within them. The conditions positioned at the intersection of the ovals are those that do not show statistically significant differences between the two groups. Conversely, the conditions placed within each oval are those that differ significantly between the groups; each condition is reported in the group where it has a higher prevalence. The font size is proportional to the percentage of residents presenting each clinical condition. The dashed circle indicates the HAIs that are more prevalent in each group.

Figure 1 Long description
A Venn diagram illustrates the clustering results of clinical conditions in two groups of residents in long-term care facilities. The diagram consists of two overlapping ovals labeled G1 and G2. The oval labeled G1 represents the group with conditions such as systemic disease, cardiovascular disease, decompensation cordis, peripheral arterial disease, myocardial infarction, urinary catheter, lymphoma, metastases, and COVID-19 infections. The oval labeled G2 represents the group with conditions such as incontinence, mobility wheelchair, female, dementia, disoriented, diabetes, chronic lung disease, respiratory infections, urinary infections, skin infections, kidney disorders, malignancies, and hemiplegia. The overlapping section between G1 and G2 includes cardiovascular disease, indicating that this condition does not show statistically significant differences between the two groups. Conditions within each oval are those that differ significantly between the groups, with each condition reported in the group where it has a higher prevalence. The font size of each condition is proportional to the percentage of residents presenting that clinical condition. A dashed circle within G1 indicates that COVID-19 infections are more prevalent in this group, while a dashed circle within G2 indicates that respiratory infections, urinary infections, and skin infections are more prevalent in this group.
Discussion
The longitudinal design of the study provides important evidence on the incidence of HAIs in a relatively large sample of Italian LTCFs. The estimated overall HAI incidence of 0.6 per 1,000 resident days complements incidence rates from earlier European studies, underscoring the need for targeted surveillance and prevention strategies. Reference Engelhart, Hanses-Derendorf, Exner and Kramer5,Reference König, Medwed and Pux6
Beyond its epidemiological contribution, this study extends the application of AI, particularly ML methods, from their predominant use in acute-care hospital settings, Reference Wang, Wang, Wang and Wang13–Reference El Arab17 to LTCFs, suggesting their potential to predict HAIs and inform antimicrobial stewardship in this context as well.
Rather than relying solely on frailty, this method identified a highly stable two-cluster stratification, that captured multidimensional clinical profiles reflecting underlying health status and differential susceptibility to specific types of HAIs. The observed high level of cluster reproducibility indicates that the ML-derived resident stratification was robust and unlikely to result from sampling variability. Such stability reinforces the value of an ML-based approach for reliably defining HAI susceptibility profiles in LTCFs and supports its potential use as an early-warning component for IPC. In addition, the identification of high-risk clusters may enhance antimicrobial stewardship by prioritizing targeted screening and guiding differentiated antibiotic protocols, thereby reducing inappropriate antimicrobial use.
Compared to Group 1, Group 2 included more clinically vulnerable residents with higher exposure to RTIs, UTIs, and skin and soft tissues infections. These infections were significantly more frequent among residents with a high prevalence of underlying health conditions such as disorientation, incontinence, low mobility, hemiplegia, kidney disorder, dementia, malignancies, diabetes, and chronic lung disease. Most of these conditions are well-recognized risk factors for bacterial HAIs, particularly UTIs and skin or soft-tissue infections. The observed co-occurrence of incontinence and UTIs, and of chronic lung disease and RTIs aligns with previous reports and supports the biological plausibility of these findings. Reference Bennett, Tanamas and James3,4,Reference Furmenti, Rossello and Bianco23,Reference Baranowska-Tateno, Micek, Gniadek, Wójkowska-Mach and Różańska24 In contrast, Group 1 residents, characterized by better mobility, greater functional autonomy, preserved cognitive status, and by a lower overall comorbidity burden, showed a higher proportion of COVID-19 infections. Greater mobility within the facility and increased interpersonal contact may have facilitated exposure to respiratory viral pathogens, consistent with patterns described in LTCF COVID-19 outbreaks. Reference McAndrew, Sacks-Davis, Abeysuriya, Delport, West, Parta, Majumdar, Hellard and Scott25 Notably, G1 included residents with clinically significant systemic diseases (as defined in Table 2), underscoring that serious inflammatory conditions may occur despite a relatively low overall comorbidity burden, reflecting substantial heterogeneity across individuals and among different rheumatic disorders. Reference Radner26
Prior studies have demonstrated that variation in resident frailty, disability, and clinical case mix substantially influences infection risk, prompting efforts to operationalize these differences using administrative measures such as the Case-Mix Index (CMI) and Resource Utilization Groups. Reference Fries, Schneider and Foley27–Reference Mylotte30 However, no consistent association was observed between CMI and infection rates, with the notable exception of a study conducted in the same Italian regions included in the present analysis. Reference Marchi, Grilli, Mongardi, Bedosti, Nobilio and Moro31 Taken together, these findings suggest that traditional administrative measures may not fully capture the multidimensional clinical vulnerability underlying susceptibility to HAIs in LTCFs. Likewise, frailty indices and comorbidity scores summarize vulnerability primarily as an overall burden of deficits, limiting their ability to differentiate distinct clinical profiles within already frail LTCF populations. Reference Clegg, Young, Iliffe, Rikkert and Rockwood32,Reference Charlson, Pompei, Ales and MacKenzie33 In contrast, the unsupervised clustering approach adopted in this study offers a methodologically distinct and complementary perspective: rather than ranking residents along a single continuum of frailty or comorbidity, it integrates functional, cognitive, clinical, and care-related variables simultaneously, without imposing predefined weights or linear assumptions. This data-driven framework may facilitate the identification of latent clinical profiles defined by specific combinations of characteristics, thereby helping to capture heterogeneity that could be masked by unidimensional summary measures.
Consistent with this perspective, the two clusters identified in this study share several underlying health conditions, reflecting the generally high baseline vulnerability of the LTCF population. However, they differ in functional, cognitive, continence, and care-dependency patterns that may better capture infection susceptibility than overall frailty.
This approach aligns with contemporary models of geriatric care, which move beyond the traditional view of LTCF populations as uniformly frail, and instead adopt a more dynamic, risk-adjusted perspective. Reference Fazio, Pace, Flinner and Kallmyer11,Reference Clegg, Young, Iliffe, Rikkert and Rockwood32 In this context, the integration of ML techniques into epidemiological surveillance enhances early warning capabilities and supports evidence-based clinical decision-making through resident-level data stratification. The well-documented severe consequences of HAIs among LTCF residents reinforce the urgency of identifying high-risk resident groups and tailoring preventive interventions accordingly. Reference Koch, Eriksen, Elstrøm, Aavitsland and Harthug34 Additionally, high rates of colonization with multidrug-resistant organisms, as observed in Italian LTCFs, Reference Giufrè, Ricchizzi and Accogli35 further underscore the critical need for proactive surveillance and stratification strategies to mitigate infection risk.
Some limitations of this study should be considered when interpreting the findings. Incomplete resident enrollment due to informed consent requirements prevented a full census in some facilities, potentially limiting representativeness. Such barriers to comprehensive surveillance are well recognized in LTCFs, where resident turnover and consent procedures often hinder systematic data collection. 4,Reference Juthani-Mehta and Quagliarello36 Generalisability may be further constrained by the heterogeneity of participating LTCFs and their differing case-mix profiles, as well as by the use of a convenience sample, as previously noted in the H4LS study. Reference Kohler and McGeer37 Reliance on manual data collection rather than routinely collected electronic data in LTCFs constrains the scalability of AI-based approaches. This highlights the need for shared data repositories that integrate resident-level information across facilities. Access to such data would enable the application of information extraction methods such as clustering, to classify facilities based on the proportion of residents at high risk for HAIs. Finally, although formal statistical testing of associations between comorbidities and HAIs was not feasible with the present data set, and the observed cluster-specific infection profiles should therefore be considered as hypothesis-generating rather than confirmatory, these patterns suggest that preventive strategies may benefit from being tailored to residents’ functional and clinical profiles.
In conclusion, this study indicates that AI-based clustering is feasible in LTCFs and may complement traditional infection risk assessment methods. In a field where AI applications remain limited, these findings support further investigation of machine-learning approaches using larger and more comprehensive data sets. By capturing infection-specific risk profiles that extend beyond global frailty, ML-based clustering highlights subgroups with higher HAI incidence and may inform targeted prevention and more efficient resource allocation. Future research should assess the reproducibility of these results across diverse LTCF settings and evaluate the impact of AI-driven risk stratification on resident outcomes, healthcare costs, and infection prevention strategies.
Supplementary material
The supplementary material for this article can be found at https://doi.org/10.1017/ice.2026.10413.
Data availability statement
Pseudonymised case-based data or aggregate data are available upon a data request for research purposes to the ECDC (https://www.ecdc.europa.eu/en/publications-data/request-tessy-data-research). Following the approval of the data request, the relevant data can be shared through a secure online platform. The data can be made available for a minimum of 10 years from the end of the study.
Acknowledgements
The authors wish to thank the staff and management of the participating long-term care facilities in Emilia-Romagna and Piedmont for their invaluable support in data collection. We gratefully acknowledge the European Centre for Disease Prevention and Control (ECDC) for coordination of the H4LS study. A special mention for their availability and contributions to study implementation at the local level to: Simonetta Bottinelli, Ada Molinaroli, Susanna Delmolino, Silvia Galeazzi, Mauro Bonomini, Lorenzo Ascheri, Francesca Bigonzi, Serena Antonelli, Michele Garulli, Ionela Paunescu, Stefania Azzali, Bruno Giuseppe, Victor Nicolenco, Elena Geana, Manuela Razzetti, Francesca Tassi, Andrea Conti, Fantini Maura, Lisa Ambrosini, Laura Cavazzuti, Paola Anceschi, Monica Cocchi, Emanuele Rocchi, Emanuela Ronchetti, Margherita Giusti, Mirella Pizzi, Marika Sepe, Alessandra Ortolani, Giacomo Accogli, Giuliano Marini, Lucio Tondi, Marisa Tesolin, Grazyna Abramsca, Paola Bulzamini, Roberto Forni, Francesca Tavoni, Catia Cammarata, Dalia Neagoe, Erica Simoni, Antonella Contino, Silvia Termini, Sofia Castellari, Gheorghina Vicas, Jolanta Paszko, Romina Barbieri, Giuseppe Rubino, Quirino Pisapia, Matteo Cappi, Giuseppe Neri, Giovanni Zoffoli, Concetta Scarcella, Giuseppe Palazzo, Daniela Volpi, Greta Calabria, Svetlana Panfil, Natascia Cavallini, Filippo Manfrini, Irene Frezzati, Giuseppe Dalla Vedova, Fabiola Straforini, Bergamini Morena, Rezarta Selimaj, Mirco Torrini, Othmane Majdouli, Ciro Aggoun, Manuela Corzani, Anna Rita Carta, Paolo Pironi, Vito Tamborrini, Ombretta Spadaccini, Stefania Gasperoni, Stefania Santolini, Laura Sangiorgi, Evo Stanghellini, Daniela De Martino, Maria Grazia Silviotti, Alma Nieddu, Maria Buonocore, Patrizia Farruggia, Catia Bedosti, Franco Romagnoni, Carlo Biagetti, Alessandra Amadori, Valentina Magnani, Nicol Marcatelli, Monia Malavolti, Dario Ceccarelli, Margherita Tancredi, Valentina Blengini, Anna Maddaleno.
Author contribution
ACL: conceptualization, methodology, figures, study design, data collection, data interpretation, data analysis, data interpretation, data curation, investigation, writing and editing. ES: conceptualization, literature search, data collection, data interpretation, investigation, data curation, writing review and editing. LC: literature search, review and editing. EF: local coordination. EB: resources, funding acquisition and review. CV: literature search, review and editing. CMZ: review. KT: final review. ER: project administration, conceptualization, resources, study design, methodology, funding acquisition, data collection, data interpretation, writing, review and editing.
Financial support
The institutions of the authors received a funding to participate at this study. This work was supported by the European Centre for Disease Prevention and Control through the framework contract ECDC/2020/006 “Healthcare-associated infections and antimicrobial use in long-term care facilities—support to a point prevalence survey and a longitudinal study,” which was awarded to Sciensano (Brussels, Belgium) and Agenzia Sanitaria e Sociale Regionale—Emilia Romagna (Bologna, Italy).
Competing interests
The author declared no potential conflicts of interest with respect to the research, authorship, and/or publication of this article.
Ethical standard
For Piedmont region: approved by Comitato Etico Interaziendale of Azienda Ospedaliero Universitaria San Luigi Gonzaga of Orbassano, February 18th 2022, protocol number 2720.
For Emilia-Romagna region: this study was approved by an ethical committee for each province involved (Ethic Committee of Romagna with prot. N. 9184/2021 on Nov 5th 2021, Ethic Committee of Area Vasta Emilia Centro for Bologna with prot. N. 1067-2021-OSS-AUSLBO on Dec 16th 2021, Ethic Committee of Area Vasta Emilia Centro for Ferrara with prot. N. 937/2021/Oss/AUSLFe on Nov 17th 2021, Ethic Committee of Area Vasta Emilia Centro for Imola with prot. N. 929-2021-OSS-AUSLIM-21178-ID 3083 on Dec 13th 2021, Ethic Committee of Area Vasta Emilia Nord for Modena with prot. N. 908/2021/OSS/AUSLMO SIRER ID 3083 prot. AOU 0036083/21 on Dec 1st 2021, Ethic Committee of Area Vasta Emilia Nord for Parma with prot. N. 918/2021/OSS/AUSLPR prot. 51078 of Dec 14th 2021, Ethic Committee of Area Vasta Emilia Nord for Piacenza with prot. N. 929/2021/OSS/AUSLPC prot. 2021/0205125 del Dec 1st 2021, Ethic Committee of Area Vasta Emilia Nord for Reggio Emilia with prot. N. 894/2021/OSS/AUSLRE prot. 2021/0150621 del Dec 1st 2021).


 Open access