


Introduction
Regime transitions are typically characterized by significant uncertainty (O’Donnell and Schmitter Reference O’Donnell and Schmitter1986; Schedler Reference Schedler2013). Some of the most influential works on democratization have tried to identify patterns of institutional development during these unpredictable periods. For example, research on Latin American democratization in the 1970s and 1980s identified that individual rights tended to pave the way for associational rights and in turn competitive elections (O’Donnell and Schmitter Reference O’Donnell and Schmitter1986), while work on post-Cold War Africa found that competitive elections were an early mover in sequences of democratization (Lindberg Reference Lindberg2006). Many also assess whether internal development influences the likelihood that liberalization will result in successful transition to democracy. For instance, liberal theory suggests that democracies are more likely to endure if individual rights such as those of property, movement, and access to justice, which expand economic opportunities, precede mass suffrage and competitive elections (Berlin Reference Berlin2002; Friedman Reference Friedman1962; Hayek Reference Hayek1944). Dahl (Reference Dahl1971) famously proposed that democracy is more likely to survive where competition is established before participation expands. Munck and Leff (Reference Munck and Leff1997) suggest that the ‘very process of transition from authoritarian rule [helps determine] the success of the transition to democracy’ (344).
These contributions make progress in theorizing the institutional order by which democratization unfolds. However, there is a gap between these theories and available empirical evidence. Many investigations of the trajectory of democratization focus only on particular regions and time periods using case studies or small-N comparative analysis (Lindberg Reference Lindberg2006; O’Donnell and Schmitter Reference O’Donnell and Schmitter1986). Such approaches provide a detailed view of institutional change in a small sample but are missing a generalized account of democratic development across many aspects, over time, in many countries. Such an account is necessary to identify, empirically, the average or typical order of democratization across time and space.
More recent research has introduced quantitative tools to study the order of democratic development. For instance, Lindenfors et al. (Lindenfors, Jansson, Wang et al. Reference Lindenfors, Jansson, Wang and Lindberg2018; Lindenfors, Krusell and Lindberg Reference Lindenfors, Krusell and Lindberg2019) present a methodology to analyze which of a pair of variables develops first. Edgell, Boese, Maerz et al. (Reference Edgell, Boese, Maerz, Lindenfors and Lindberg2022) use this methodology to study democratization from 1900 to 2019. They compare democratic institutions, two at a time, to show which sets of institutions have higher levels of democracy than others, aggregated across all episodes. Other recent studies use sequence analysis to study regime transitions (Wilson Reference Wilson, Blanchard, Bühlmann and Gauthier2014; Wunsch and Blanchard Reference Wunsch and Blanchard2023). This approach requires deductively dividing the period of regime change into a sequence of discrete, categorical states. Both of these approaches are limited, however. Pairwise domination analysis, for instance, compares pairs of institutions, showing that values of one set of institutions tend to be higher or lower than another, and then aggregates these comparisons to reveal a general pattern of institutional development across all episodes. However, this approach cannot capture the multi-step processes at the heart of theories about democratic development, which involves changes in the development of many different institutions over time. The aggregation of results can also obscure heterogeneity in individual cases. As a result, the study by Edgell, Boese, Maerz et al. (Reference Edgell, Boese, Maerz, Lindenfors and Lindberg2022) identifies an overall pattern but cannot tell us about the sequence in which democratic institutions change within particular episodes of democratization. By contrast, the method we introduce builds on within-case patterns before aggregating across them and identifies longer patterns of change.
Sequence analysis also has its limitations. For instance, scholars must have an idea about how to divide different variables into discrete, categorical states before analysis. In cases where researchers do not have strong priors about patterns of institutional change, sequence analysis is less useful. Furthermore, sequence analysis cannot compare simultaneous changes across many ordinal or continuous variables, a pattern which is common to democratization processes.Footnote 1
This research note addresses these substantive and methodological gaps in transitology research by introducing a new method, Analysis of Chains (AOC). The AOC method identifies chains or progressions of consecutive improvement across three or more variables. This approach is advantageous for the study of democratization because it can assess the progressive development – in order and magnitude – of many institutions that may change concurrently. The AOC method builds on pairwise domination analysis (Lindenfors, Jansson, Wang et al. Reference Lindenfors, Jansson, Wang and Lindberg2018; Lindenfors, Krusell and Lindberg Reference Lindenfors, Krusell and Lindberg2019), but accommodates comparisons between more than two variables at a time using the logic of a repeated transitive tournament. This approach mirrors historical and contemporary cases of democratization, where democracy develops as a long process of institutional change. Rather than one set of variables changing and then another, democratization unfolds as improvements in some aspects of democracy facilitate improvements in others, which in turn facilitate improvements in others, and so on. In further contrast to pairwise domination analysis, the AOC method considers the amount of change in each variable rather than variables’ values relative to each other. In the analysis section, we identify chains of democratic development across up to seven different aspects of democracy. Identification of these patterns provides unique insight for academics and policymakers seeking to understand the full process by which democratization unfolds. The AOC method also reveals new patterns relative to sequence analysis. For instance, the chains method is more flexible than sequence analysis because there is no upper limit to the number of variables that can be included in the analysis, and researchers need not establish a finite number of mutually exclusive states between these variables before conducting analysis. Rather, the AOC method takes an infinite number of variables – dichotomous, ordinal, or continuous – as inputs and, inductively, identifies patterns of development between them.
The remainder of this research note first introduces the details of the AOC method. Then, we use the method to descriptively evaluate the institutional development of 47 elements of liberal democracy across 202 countries from 1900 to 2021. Given the scope of this research note, we focus on the development of liberal democracy, as defined by the Varieties of Democracy (V-Dem) project (Coppedge, Edgell, Knutsen et al. Reference Coppedge, Edgell, Knutsen and Lindberg2022a). V-Dem’s Liberal Democracy Index (LDI) includes core features of electoral democracy, like clean elections and freedom of expression, as well as measures of individual liberties and constraints on the executive, like property rights, freedom of movement, and independent courts. This focus allows us to assess the internal development of democracy across a core set of institutions. Of course, existing research demonstrates that exogenous factors – like economic development – also influence the trajectory of democratization (Acemoglu and Robinson Reference Acemoglu and Robinson2006; Przeworski, Alvarez, Cheibub et al. Reference Przeworski, Alvarez, Cheibub and Limongi2000). For the purposes of this research note, however, we limit the analysis to the development of definitional features of democracy.
The analysis yields comprehensive, generalizable results about the typical patterns of democratization over the last century. In addition to generating descriptive accounts of the multi-step process of regime change in each episode of liberalization, we highlight two general findings. First, the results show that institutions related to freedom of association and elections are the most common elements of democracy to develop earlier, and to a greater extent, than other institutions. Second, we find limited evidence for an association between the ordering and the outcome of democratization episodes. Overall, the research note makes critical methodological and empirical contributions to research on democratic transitions.
Analysis of chains
This section introduces the AOC method, a new technique to evaluate patterns of change across three or more variables. In brief, AOC involves (1) selecting an appropriate sample of cases, (2) identifying relevant variables, (3) converting the data into a change matrix, (4) creating percentage tables for each case in the data, and (5) generating chains using the logic of an iterative transitive tournament. The next sub-sections describe each of these components.
Sample selection
The first step in the AOC method is to select a sample of relevant units. AOC identifies chains in each of the units, independently of the other units. In other words, AOC is not sensitive to the cases included in the sample, and it can be used to identify chains in any number of cases. For our purposes, the sample of interest is democratization episodes starting in autocracies. We use the Episodes of Regime Transformation (ERT) framework and dataset (version 4) to capture this sample (Edgell, Maerz, Maxwell et al. Reference Edgell, Maerz, Maxwell, Morgan, Medzihorsky, Wilson, Boese, Hellmeier, Lachapelle, Lindenfors, Lührmann and Lindberg2022; Maerz, Edgell, Wilson et al. Reference Maerz, Edgell, Wilson, Hellmeier and Lindberg2023). The ERT identifies episodes of sustained and substantial change in V-Dem’s Electoral Democracy Index.Footnote 2 From these cases, we select episodes of liberalization, or cases originating in autocracies. Additionally, we omit episode-years following transitions to democracy and use ERT’s classification of the episode outcome (successful or failed transitions). In total, the sample includes 377 episodes of liberalization and 1553 country-years from 1900 to 2021.
Identification of variables
Next the researcher must identify relevant variables. The AOC method can take any number of interval, ordinal, or dichotomous variables as inputs. For our purpose, we use the ordinal indicators that make up the component indices of V-Dem’s LDI: freedom of association, clean elections, freedom of expression, suffrage, equality before the law and individual liberties, judicial constraints on the executive, and legislative constraints on the executive (Coppedge, Gerring, Knutsen et al. Reference Coppedge, Gerring, Knutsen, Lindberg, Teorell, Altman, Bernhard, Cornell, Fish, Gastaldi, Gjerløw, Glynn, Grahn, Hicken, Kinzelbach, Marquardt, McMann, Mechkova, Paxton, Pemstein, von Römer, Seim, Sigman, Skaaning, Staton, Tzelgov, Uberti, Wang, Wig and Ziblatt2022b). While we include 47 indicators in the analysis, to facilitate interpretation we group the indicators according to the V-Dem indices shown in bold in Table 1 in the results.Footnote 3
V-Dem liberal democracy indicators

Notes: Across all indicators, higher values indicate higher levels of democracy. For instance, higher values on the variable government media censorship (v2mecenefm) indicate that censorship was rare or nonexistent, while lower values mean that censorship was direct and routine. Indicators in italics are component indicators of the Electoral Democracy Index.
Change matrix
Next we measure the amount of change in each variable compared to the variable’s value at the start of each unit. In this application, we measure how much each democracy indicator changed since the year preceding the onset of democratization.Footnote 4 Figure 1 shows the first steps in the AOC method for the episode of Bahrain’s failed transition to democracy at the turn of the 21st century.Footnote 5 In the figure, panel (a) shows the original values of the democracy indicators, and panel (b) is re-coded to reflect the amount of change in each variable in each episode-year compared to the year preceding the episode onset. Across panels, darker shading represents relatively higher values. Overall, Figure 1 shows, in one representative case, how the indicators vary and change over time. It also shows how there is an order to the change in indicators, which the AOC method is uniquely equipped to analyze. In the Online Appendix, Figures A7 and A8 show the average original values and average amount of change across successful and failed episodes to give a fuller picture about variation in the order of change across cases.
Democratization in Bahrain, 2000–2003.
Notes: Across all indicators, higher values indicate higher levels of democracy. For instance, higher values on the variable government media censorship (v2mecenefm) indicate that censorship was rare or nonexistent, while lower values mean that censorship was direct and routine. The figure omits indicators that were 0 for the whole episode.

Percentage tables
The third step in the AOC method involves creating one percentage table for each liberalization episode. This step utilizes the method developed by Lindenfors, Krusell and Lindberg (Reference Lindenfors, Krusell and Lindberg2019) and later applied by Edgell, Boese, Maerz et al. (Reference Edgell, Boese, Maerz, Lindenfors and Lindberg2022), with the distinction that we compare indicators within liberalization episodes rather than across all liberalization episodes. We also analyze the change in indicators rather than their original values. Percentage tables compare every possible pair of variables, ${X_1}$
and
${X_1}$
and ${X_2}$
. For each pair, the percentage table reports the percentage of episode-years in which one indicator is greater than (
${X_2}$
. For each pair, the percentage table reports the percentage of episode-years in which one indicator is greater than ( ${X_1} \gt {X_2}$
), equal to (
${X_1} \gt {X_2}$
), equal to ( ${X_1} = {X_2}$
), or less than (
${X_1} = {X_2}$
), or less than ( ${X_1} \lt {X_2}$
) the other. Because the data have already been converted to a matrix of change for each variable since the start of the episode, percentage tables showing that
${X_1} \lt {X_2}$
) the other. Because the data have already been converted to a matrix of change for each variable since the start of the episode, percentage tables showing that ${X_1} \gt {X_2}$
more than 51% of the time indicate that
${X_1} \gt {X_2}$
more than 51% of the time indicate that ${X_1}$
has changed before and/or more than
${X_1}$
has changed before and/or more than ${X_2}$
over the course of the episode. Continuing along in this way, the percentage tables compare all possible pairs of indicators for each of the 377 liberalizing episodes in the sample.
${X_2}$
over the course of the episode. Continuing along in this way, the percentage tables compare all possible pairs of indicators for each of the 377 liberalizing episodes in the sample.
To give a concrete example, the percentage table for Bahrain’s liberalization episode would begin by comparing the variables ‘property, men’ ( ${X_1}$
) and ‘no killings’ (
${X_1}$
) and ‘no killings’ ( ${X_2}$
) in panel (b) of Figure 1. The variable ‘property, men’ shows no change (0) for every episode-year. The variable ‘no killings’ shows a 2-increment improvement for every episode-year. Thus, the percentage table would show
${X_2}$
) in panel (b) of Figure 1. The variable ‘property, men’ shows no change (0) for every episode-year. The variable ‘no killings’ shows a 2-increment improvement for every episode-year. Thus, the percentage table would show ${X_1} \gt {X_2}$
0% of the episode-years,
${X_1} \gt {X_2}$
0% of the episode-years, ${X_1} = {X_2}$
0% of the episode-years, and
${X_1} = {X_2}$
0% of the episode-years, and ${X_1} \lt {X_2}$
100% of the episode years. These results capture the fact that the change in
${X_1} \lt {X_2}$
100% of the episode years. These results capture the fact that the change in ${X_2}$
(‘no killings’) preceded and outpaced the change in
${X_2}$
(‘no killings’) preceded and outpaced the change in ${X_1}$
(‘property, men’).
${X_1}$
(‘property, men’).
Chains
The AOC method next builds from these pairwise comparisons to identify longer chains of institutional change. The first step is to create a directed graph ${\cal G}$
for each episode.Footnote
6
Each node in
${\cal G}$
for each episode.Footnote
6
Each node in ${\cal G}$
is identified by one variable. The program scans the percentage tables to establish the links between nodes in the following way. For every pair of nodes
${\cal G}$
is identified by one variable. The program scans the percentage tables to establish the links between nodes in the following way. For every pair of nodes ${X_1}$
and
${X_1}$
and ${X_{2,}}$
we create a link from the first node
${X_{2,}}$
we create a link from the first node ${X_1}$
to the second node
${X_1}$
to the second node ${X_2}$
if the variable
${X_2}$
if the variable ${X_1}$
is greater than variable
${X_1}$
is greater than variable ${X_2}$
at least 51% of the episode. We then use the logic of a transitive tournament to link the third node,
${X_2}$
at least 51% of the episode. We then use the logic of a transitive tournament to link the third node, ${X_3}$
. A set of nodes form a transitive tournament if and only if every triple of nodes from that set is transitive (Bang-Jensen and Gutin Reference Bang-Jensen and Gutin2009). That is, for each triple in the set:
${X_3}$
. A set of nodes form a transitive tournament if and only if every triple of nodes from that set is transitive (Bang-Jensen and Gutin Reference Bang-Jensen and Gutin2009). That is, for each triple in the set: ${X_1} \gt {X_2}$
at least 51% of the time,
${X_1} \gt {X_2}$
at least 51% of the time, ${X_2} \gt {X_3}$
at least 51% of the time, and
${X_2} \gt {X_3}$
at least 51% of the time, and ${X_1} \gt {X_3}$
at least 51% of the time. Thus, formally, a chain is a progression of variables
${X_1} \gt {X_3}$
at least 51% of the time. Thus, formally, a chain is a progression of variables ${X_1},{X_2},{X_3}, \ldots, {X_t}$
such that the link between each of the nodes follows the logic of a transitive tournament.
${X_1},{X_2},{X_3}, \ldots, {X_t}$
such that the link between each of the nodes follows the logic of a transitive tournament.
To better understand this process, consider the case of democratization in Bahrain, shown in Figure 1. The AOC method identifies eight chains in this case. One such chain consists of three nodes beginning with media critical, followed by media censorship, followed by CSO entry/exit. This pattern coheres with the descriptive data shown in panel (b) of Figure 1. There, we see that the indicator for media critical improved by one point in the first year of the episode and by another two points halfway through the episode. Meanwhile, the measure for media censorship improved by one point in the second year of the episode and by another point halfway through the episode. Finally, the variable for CSO entry and exit improved by only one point over the full course of the episode, and this improvement only occurred in the second half of the episode. This example thus demonstrates the face validity of the AOC methodology: it was able to capture a substantively interesting pattern during Bahrain’s democratization, where, over a four-year period, the media first increased its ability to criticize the government, then the government reduced the level of censorship, then CSO organizations gained more freedom.
After the program has identified all of the chains in the directed graph ${\cal G}$
, it subsequently identifies the subset of maximal chains within this full set of chains. Maximal chains are those chains that are not contained within a longer chain.Footnote
7
The basic program first finds all transitive triples of variables. This can be done by checking, at each node, if the vertices of each pair of one incoming link and one outgoing link form a transitive triple. Next we check for each pair of triples with two common vertices if they form a chain of length four. Similarly, we check for each pair consisting of a chain of length four and triple, with two common vertices, if they form a chain of length five. This process can be repeated from length
${\cal G}$
, it subsequently identifies the subset of maximal chains within this full set of chains. Maximal chains are those chains that are not contained within a longer chain.Footnote
7
The basic program first finds all transitive triples of variables. This can be done by checking, at each node, if the vertices of each pair of one incoming link and one outgoing link form a transitive triple. Next we check for each pair of triples with two common vertices if they form a chain of length four. Similarly, we check for each pair consisting of a chain of length four and triple, with two common vertices, if they form a chain of length five. This process can be repeated from length $t$
to length
$t$
to length $t + 1$
as long as chains of length
$t + 1$
as long as chains of length $t$
were found. Whenever we find that a chain of length
$t$
were found. Whenever we find that a chain of length $t$
has no extension to length
$t$
has no extension to length $t + 1$
, this shows that the chain is maximal. As an illustration, consider the chain mentioned above in the case of Bahrain (media critical
$t + 1$
, this shows that the chain is maximal. As an illustration, consider the chain mentioned above in the case of Bahrain (media critical $\to$
media censorship
$\to$
media censorship $\to$
CSO entry/exit). The AOC method identified that this chain was not part of a longer chain and so is considered maximal. If it were contained within a longer chain, say media critical
$\to$
CSO entry/exit). The AOC method identified that this chain was not part of a longer chain and so is considered maximal. If it were contained within a longer chain, say media critical $\to$
media censorship
$\to$
media censorship $\to$
CSO entry/exit
$\to$
CSO entry/exit $\to$
EMB capacity, only the four node chain would be reported in the set of maximal chains.
$\to$
EMB capacity, only the four node chain would be reported in the set of maximal chains.
Figure 2 gives an example of a directed graph and its chains. At the bottom of this figure, we have an example directed graph ${\cal G}$
. In the middle level, we show all the transitive triples from
${\cal G}$
. In the middle level, we show all the transitive triples from ${\cal G}$
. The top level shows the only chain of length four in
${\cal G}$
. The top level shows the only chain of length four in ${\cal G}$
. The maximal chains are colored gray, including the chain of length four (
${\cal G}$
. The maximal chains are colored gray, including the chain of length four ( $C \to D \to F \to G$
) and two of the transitive triples (
$C \to D \to F \to G$
) and two of the transitive triples ( $A \to C \to B$
and
$A \to C \to B$
and $D \to G \to E$
). In our application, there is one directed graph for each episode. The program finds the total number of maximal chains for each of these directed graphs. These chains range in length from three to seven nodes. As discussed above, each node represents a variable of substantive interest and each chain shows the trajectory of democratic development in a particular case. The chain identified in the case of Bahrain (media critical
$D \to G \to E$
). In our application, there is one directed graph for each episode. The program finds the total number of maximal chains for each of these directed graphs. These chains range in length from three to seven nodes. As discussed above, each node represents a variable of substantive interest and each chain shows the trajectory of democratic development in a particular case. The chain identified in the case of Bahrain (media critical $\to$
media censorship
$\to$
media censorship $\to$
CSO entry/exit), for instance, could parallel the maximal chain with three nodes A
$\to$
CSO entry/exit), for instance, could parallel the maximal chain with three nodes A $\to$
C
$\to$
C $\to$
B in Figure 2.
$\to$
B in Figure 2.
Chains from a directed graph.
Notes: The bottom row shows the directed graph  ${\cal G}$ for a theoretical democratization episode. Each letter represents a different variable (from Table 1), or node, and each arrow represents a link between the nodes formed by the logic of a transitive tournament. The middle row shows all transitive triples from ${\cal G}$ and the top row shows the only chain of length four created from ${\cal G}$. The maximal chains are colored gray.

Notably, the use of a threshold of 51% reflects our substantive interest. Variables appearing in earlier links in the chains changed either (1) earlier and/or (2) to a greater extent than variables appearing in later links in the chains. These two conditions are balanced against each other because the chains are created by looking at an indicators’ total change score over the course of each liberalization episode, and indicators generally improve over the course of the episode. For instance, an indicator that increased by 1 in the first year – and maintained this value throughout the episode – could come before an indicator that increased by 1 (and maintained this value) in the second half of the episode. Such a chain would indicate that the first indicator changed earlier than the second, though both changed by the same amount. Another chain might put the indicator that increased by 1 in the first year after an indicator that increased by 2 for the second half of the episode. The indicator that increased by 2 would be higher than the first indicator for more than half of the episode. This chain, in contrast to the other, would demonstrate that the first link changed more than the second link. Following this logic, it is important to also note that an indicator that changed only in the latter half of an episode would never come before another indicator in a chain. Overall, the chains capture both early-moving indicators and indicators with higher overall change in a balanced way, reflecting our theoretical interest.
Patterns of democratic development, 1900–2021
This section applies the AOC method to understand (1) the patterns of institutional change that are most common during episodes of liberalization and (2) whether certain chains are more often associated with successful transition than others. In the previous section, we described how AOC identifies chains for 47 democracy indicators in 377 democratization episodes between 1900 and 2021. Here, we present results with each indicator grouped into higher-order categories, as shown in Table 1.Footnote 8 As described above, recall that most episodes contain multiple chains since the AOC method accounts for simultaneous changes across many different aspects of democracy.
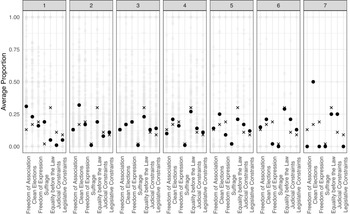
Figure 3 gives the first set of results. Each of the seven panels represents one node in a chain. Along the x-axis are the seven categories of liberal democracy (shown in Table 1) that could be represented in each node: freedom of association (association), clean elections (elections), freedom of expression (expression), suffrage, equality before the law and individual liberties (equality), judicial constraints, and legislative constraints. The gray points each represent one episode. They show, of all the chains in that episode that have that node, the proportion of chains with each node category. So, for instance, consider an episode that has only one chain: freedom of association $\to$
clean elections
$\to$
clean elections $\to$
freedom of expression. This episode would be represented by a faded gray point at 1 for freedom of association in node 1 (and 0 for all other categories), at 1 for clean elections in node 2 (and 0 for all other categories), and at 1 for freedom of expression in node 3 (and 0 for all other categories). 100% of the chains in this episode features freedom of association for the first node, clean elections for the second node, and freedom of expression for the third node. 0% of the chains in this episode feature a node with any other category. Lastly, for this episode, the panels for nodes 4, 5, 6, and 7 would be empty. No chain in this episode had a 4th, 5th, 6th, or 7th node.
$\to$
freedom of expression. This episode would be represented by a faded gray point at 1 for freedom of association in node 1 (and 0 for all other categories), at 1 for clean elections in node 2 (and 0 for all other categories), and at 1 for freedom of expression in node 3 (and 0 for all other categories). 100% of the chains in this episode features freedom of association for the first node, clean elections for the second node, and freedom of expression for the third node. 0% of the chains in this episode feature a node with any other category. Lastly, for this episode, the panels for nodes 4, 5, 6, and 7 would be empty. No chain in this episode had a 4th, 5th, 6th, or 7th node.
Proportion of chains (by Episode) with each node category.
Notes: Each panel represents a node in a chain. The x-axis shows the seven categories of liberal democracy that could be represented in each node. The faded gray points each represent one episode. They show, of all the chains in that episode that have that node, the proportion of chains that fell into each node category. The large black points plot the average proportion of chains in each node category across all episodes. The black x-marks show the expected value in each node category if the chains were randomly distributed.

We can further conceptualize these results by considering the example of Bahrain’s democratization episode, discussed above. The AOC method identified eight chains in this episode. Once we group the indicators in these chains into higher-order categories and collapse repeating categories, there are three types of chains. Two of the chains follow the pattern expression $\to$
freedom of association, four expression
$\to$
freedom of association, four expression $\to$
elections, and the two remaining expression
$\to$
elections, and the two remaining expression $\to$
judicial constraints. Substantively, this means that freedoms of expression developed earlier and/or to a greater extent than indicators representing freedoms of association, election quality, and judicial constraints. Referring back to Figure 3, we would first represent the chains in this episode with a gray point at 1.00 for freedom of expression in the first panel (100% of the chains in this episode started with a variable in the category freedom of expression in the first node). In the second panel, representing the second node, we would plot gray points for Bahrain’s democratization episode at 0.25 for freedom of association, 0.50 for elections, and 0.25 for judicial constraints. These points would show that 2/8 chains had indicators for freedom of association in the second node, 4/8 had indicators for elections in this node, and 2/8 had indicators for judicial constraints in this node. Finally, we would plot points at 0.00 for the remaining categories in panels 1 and 2, showing that there was no representation of these categories in these nodes in this episode. We would not plot points in the remaining panels, as none of the collapsed chains had a length longer than two.
$\to$
judicial constraints. Substantively, this means that freedoms of expression developed earlier and/or to a greater extent than indicators representing freedoms of association, election quality, and judicial constraints. Referring back to Figure 3, we would first represent the chains in this episode with a gray point at 1.00 for freedom of expression in the first panel (100% of the chains in this episode started with a variable in the category freedom of expression in the first node). In the second panel, representing the second node, we would plot gray points for Bahrain’s democratization episode at 0.25 for freedom of association, 0.50 for elections, and 0.25 for judicial constraints. These points would show that 2/8 chains had indicators for freedom of association in the second node, 4/8 had indicators for elections in this node, and 2/8 had indicators for judicial constraints in this node. Finally, we would plot points at 0.00 for the remaining categories in panels 1 and 2, showing that there was no representation of these categories in these nodes in this episode. We would not plot points in the remaining panels, as none of the collapsed chains had a length longer than two.
Layered above the faded gray points are dark black points that show the average proportion of chains in each node category across all episodes (so, the average value for each column in the figure). Finally, the black x-marks show the expected value if the chains were randomly distributed.Footnote 9 Considering again the example from Bahrain, we see that the fact of the first node always being filled with freedoms of expression is unusual compared to the average across episodes (the black point at 0.16) and the expected value (the black x-mark at 0.19).
What do these results reveal about the typical ordering of democratization? Let us first consider the first node. We see that, on average, most chains began with improvement in freedom of association. The proportion of chains starting with freedom of association is remarkable given that this category is over-represented compared to its underlying frequency. On average, 31% of chains began with development in freedom of association, but only 13% of all indicators belong to this category. Two other categories outperformed the distribution expected by chance in the first node. On average, clean elections developed first in 23% of chains (compared to 17% expected by chance) and suffrage developed first in 19% of chains (compared to 2% expected by chance). Overall, the results from the first node suggest that indicators having to do with freedom of association, elections, and suffrage improved earlier and to a larger extent than indicators in other categories.
Turning to the subsequent nodes, we see that clean elections are over-represented in almost every category. Indicators having to do with judicial and legislative constraints are over-represented in later nodes (3–7). Interestingly, indicators having to do with freedom of expression and equality before the law were never over-represented in the chains: these categories appear as often or less than as often as would be expected by chance. Together, these results suggest that elections continue to develop throughout the democratization process, and judicial and legislative constraints tend to develop relatively later and to a lesser extent than freedoms of association, suffrage, and clean elections.
We can also use these averaged results to assess whether the distribution of chains across node categories varies between successful and failed episodes of democratization. Figure 4 breaks down the results in Figure 3 by the outcome of the episode, with the upper panel representing successful episodes and the lower panel representing failed episodes.Footnote 10 Here we see that the average proportion of chains in each node category is quite similar across cases that succeeded and failed. With only a few exceptions, the patterns of proportions mirror each other across the successful and failed cases. From these results, we conclude that, on average, successful and failed episodes exhibit similar patterns of institutional change. Though this is a null result, we also believe it is informative in the context of previous research (eg Berlin Reference Berlin2002; Dahl Reference Dahl1971; Friedman Reference Friedman1962; Hayek Reference Hayek1944; Munck and Leff Reference Munck and Leff1997), which theorizes that the internal sequence of democratic development could influence the trajectory of the process of democratization. Actually, these descriptive findings suggest that the endogenous process of democratization follows a similar pattern regardless of the outcome of the episode. This finding indicates that external factors likely hold greater sway in influencing whether or not democratization is ultimately successful.
Proportion of chains (by episode) with each node category, by outcome.
Notes: Each panel represents a node in a chain. The x-axis shows the seven categories of liberal democracy that could be represented in each node. The faded gray points each represent one episode. They show, of all the chains in that episode that have that node, the proportion of chains that fell into each node category. The large black points plot the average proportion of chains in each node category across all episodes. The black x-marks show the expected value if the chains were randomly distributed. The top figure plots the results for cases that transitioned to democracy (success) while the bottom figure plots the results for episodes that did not transition (failed).

The results thus far provide an initial overview of the AOC method. Still, Figures 3 and 4 only show averages for each node across all episodes. Another important consideration is the components and frequency of individual chains. The AOC method identifies 10,308 chains across democratization episodes. Of these, there are 3,031 unique chains. Each of these chains were typically observed in $ \gt\!1$
episode and, because we have grouped the original 47 indicators into seven categories,
$ \gt\!1$
episode and, because we have grouped the original 47 indicators into seven categories, $ \gt\! 1$
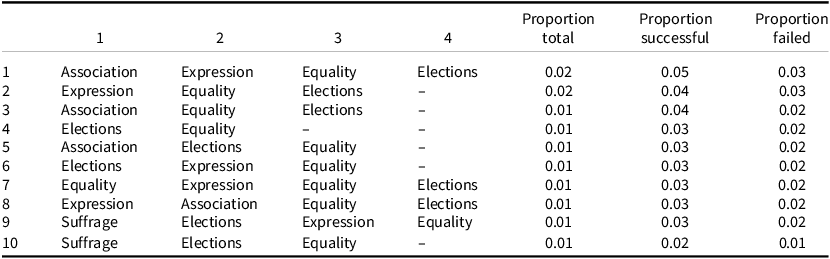
time per episode. To find the most common chains, we identify how frequently each chain occurs as a proportion of all chains, all chains in successful episodes, and all chains in failed episodes. Table 2 shows the 10 most frequent chains and their occurrence by these metrics. The most common chains are the same across these three samples, again suggesting limited variation between successful and failed episodes.Footnote
11
$ \gt\! 1$
time per episode. To find the most common chains, we identify how frequently each chain occurs as a proportion of all chains, all chains in successful episodes, and all chains in failed episodes. Table 2 shows the 10 most frequent chains and their occurrence by these metrics. The most common chains are the same across these three samples, again suggesting limited variation between successful and failed episodes.Footnote
11
Most common chains across liberalization episodes

Notes: List of the ten most common chains across all episodes, successful episodes, and failed episodes. The first column shows the category of variable that occupies each node of the chain. Proportion Total reports the frequency of this chain as a proportion of chains in all episodes; Proportion Successful reports the frequency of this chain as a proportion of chains in successful episodes; Proportion Failed reports the frequency of this chain as a proportion of chains in failed episodes.
Several patterns emerge from these results. First, in line with the results from Figure 3, freedom of association (association), clean elections (elections), and suffrage were the most common categories to occur early in the chains, accounting for the first node in 7/10 of the most frequent chains. Freedom of expression (expression) occurs twice in the first node, and equality before the law (equality) occurs once. In the other nodes, we see that clean elections occur regularly in all the nodes, again indicating that elections continue to improve during the earlier periods of the democratization episodes. Equality before the law is also featured in all of the nodes. Freedom of expression occurs in several chains in earlier nodes, and freedom of association occurs in the second node for one chain. Overall, these results indicate that suffrage and freedom of association are early to improve, clean elections improve early and throughout the episode, and freedom of expression and equality before the law improve in the earlier period of the episode. Interestingly, none of the top chains feature judicial constraints or legislative constraints. As shown in the results in Figure 3, this supports the idea that horizontal institutions develop later in the episodes.
Finally, we assess whether there is a correlation between these frequently occurring chains and the outcome of democratization episodes. Figure 5 demonstrates, for each of the patterns in the top-10 chains, what proportion fell in episodes that ended in successful transition to democracy versus failed transition to democracy. The horizontal lines show the proportion of failed and successful episodes in the full sample (62% failed and 36% successful), which would be the proportion expected for each chain if they were randomly distributed across episodes. In general, the results do not clearly distinguish chains between successful and failed episodes, indicating that the order of episodes might not predict their outcome.
Common chains and episode outcomes.
Notes: The x-axis shows the 10 most common chains as reported in Table 2. The y-axis plots the proportion of these chains that fell in successful versus failed episodes. The horizontal lines indicate the overall proportion of episodes that failed (dark gray) and succeeded (light gray). These are the proportions we would expect to see if there was no correlation between the chain and the outcome of the episode.

One possibility when considering the results is that they are a product of these specific versions of the data or of measurement error. To increase confidence in the results, we present several robustness checks in the Online Appendix. Specifically, Online Appendix Section A5 replicates the results using a version of the ERT data constructed with V-Dem’s LDI, Online Appendix Section A8 replicates the results with alternative thresholds for the ERT data, Online Appendix Section A9 shows results with updated datasets, and Online Appendix Section A10 shows the robustness of the results to alternative cutoffs in the transitive tournaments. The analyses from all these robustness checks are consistent with the main results.
Conclusion
This paper presents a novel methodology, AOC, to analyze the order of institutional development during episodes of liberalization. A long literature exists to evaluate the conditions that facilitate transitions to democracy. Our research instead turns attention to the process of institutional development. The AOC method makes it possible to study this complex process in a systematic, replicable way. Overall, the results provide an initial glance at the typical trajectory of democratic development in the 20th and 21st centuries. We find that freedom of association, clean elections, and suffrage are the most common elements of democracy to develop earlier and to a greater extent compared to other institutions. Horizontal institutions, like judicial and legislative constraints, more often develop in the later part of democratization episodes. However, we see limited correlation between the order of development and the outcome of the episode, though Figure 5 suggests some evidence that early development of suffrage and elections is associated with successful transition.
What do these findings reveal about existing theories on endogenous processes of democratization? First, we confirm that elections are often early movers in democratization (Lindberg Reference Lindberg2006). Second, rights of association also move early, as expected by much of the work conducted on the early democratizers of the third wave (O’Donnell and Schmitter Reference O’Donnell and Schmitter1986). Thus, there is some support for both of these seminal theories in the aggregate assessment. Third, we find little support for theories that propose that the internal sequencing of democratization influences the success or failure of democratization episodes. This last finding, though a null result, is an important one. The results suggest that policymakers would likely do better to focus on exogenous factors to facilitate successful democratization.
In considering extensions for this research, we recognize that exogenous factors likely interact with these endogenous processes to influence the trajectory of democratization. Though a full treatment of these possibilities lies beyond the scope of this research note, the AOC method provides exciting opportunities for future research to probe these complex relationships. For instance, future work can examine where structural transformations relating to class composition (Moore Reference Moore1966; Reuschmayer, Stephens and Stephens Reference Reuschmayer, Huber and Stephens1992), the development of national unity (Rustow Reference Rustow1970), the adoption of free market capitalism (Friedman Reference Friedman1962; Hayek Reference Hayek1944), the acquisition of sufficient state capacity (Carothers Reference Carothers2007; Mansfield and Snyder Reference Mansfield and Snyder2007), and levels of economic development (Acemoglu and Robinson Reference Acemoglu and Robinson2006; Przeworski, Alvarez, Cheibub et al. Reference Przeworski, Alvarez, Cheibub and Limongi2000) fall relative to changes in other democratic institutions during democratization. Similarly, scholars could analyze the order of development between different characteristics of a country’s political system – such as the strength of the party system (Linz and Valenzuela Reference Linz and Valenzuela1994; Mainwaring Reference Mainwaring1993; Sartori Reference Sartori1987) or the strength of incumbent elites during autocracy (Riedl, Slater, Wong et al. Reference Riedl, Slater, Wong and Ziblatt2020; Ziblatt Reference Ziblatt2017) – and the features of liberal democracy identified here. Finally, future research can assess how all of these factors interact to influence the success or failure of democratization.
Supplementary material
The supplementary material for this article can be found at https://doi.org/10.1017/S1475676526100863.
Data availability statement
Data and code to replicate all analysis are available on the publisher’s website and at https://kellyemorrison.com/research/.
Author contributions
Author contributions to research design and conceptualization: Morrison (40%), Lundstedt (10%), Sato (10%), Markström (20%), Lindberg (20%); statistical analysis: Morrison (90%), Markström (10%); writing: Morrison (70%), Lundstedt (10%), Sato (10%), Markström (5%), Lindberg (5%). The order of authors reflects the significance of the authors’ contributions.
Funding statement
We recognize support by the Swedish Research Council, Grant 2018-01614, PI: Staffan I Lindberg; by Knut and Alice Wallenberg Foundation to Wallenberg Academy Fellow Staffan I. Lindberg, Grant 2018.0144; by European Research Council, Grant 724191, PI: Staffan I. Lindberg; and by internal grants from the Vice Chancellor’s office, the Dean of the College of Social Sciences, and the Department of Political Science at the University of Gothenburg. The computations of expert data were enabled by the Swedish National Infrastructure for Computing at the National Supercomputer Centre, Linköping University, partially funded by the Swedish Research Council through grant agreement no. 2021-5-504.
Competing interests
The authors have no competing interests to declare.


 Open access