


1. Motivation & background
An engineer’s ability to interpret a system is critical for system understanding, troubleshooting unexpected system behaviors, and communicating knowledge. System interpretation is almost always facilitated through a representation of the given system. For example, the control systems used by large-scale utility providers are often represented through a set of gauges, indicators, displays, or graphical visualizations. These representations are useful to engineers working in highly complex, high-stakes environments because of the quick decision-making necessary for smooth operation and service.
This work is directly motivated by prior work on mental models. Research has shown that learning functional modeling and decomposition can improve students’ mental models of systems (Murphy, Banks, et al., Reference Murphy, Banks, Nagel and Linsey2019, Reference Murphy, Banks, Nagel and Linsey2023; Murphy et al., Reference Murphy, Banks, Bohm, Nagel and Linsey2020). Notably, Markman defines mental models as “internal representations of external systems” (Reference MarkmanMarkman, 2013) and Fein et al. suggests that mental models represent the “knowledge that a user has about how a system works, its component parts, the processes, their interrelations, and how one component influences another” (Reference Fein, Olson and OlsonFein et al., 1993). These definitions fit well within the context of engineering design theory. Work has also been done to explore how physical product teardown activities may impact students’ mental models of systems where product teardown is shown to directly impact mental models of the given product with no evidence of knowledge transfer between functionally similar products (Reference BanksBanks, 2019; Reference Murphy, Whittle and SummersMurphy, Whittle, et al., 2023). Functional modeling leans towards recognition of system boundaries and mass/energy conservation. These prior results motivate an exploration of how representation modality impacts systems thinking where a functional model is one of many modalities an engineer may choose to represent a system.
The study presented in this paper is in contribution to a larger research investigation into the role of representation modality on systems thinking (Reference Murphy, Patel, Sen and SummersMurphy et al., 2022; Murphy, Patel, et al., Reference Murphy, Patel, Zorn, Gericke and Summers2023; A. Patel et al., Reference Patel, Murphy, Summers and Sen2022; A. R. Patel et al., Reference Patel, Murphy, Summers and Sen2023). This paper specifically investigates whether correct vs. incorrect product identification, given a representation of the product, impacts subsystem clustering behavior. The aim of this work is to determine to what extent (if at all) being aware of the product impacts systems thinking. A tertiary goal of this work is to uncover other factors that influence systems interpretation for future investigation.
1.1. Functional decomposition
Functional decomposition is a method found commonly in engineering design. Typically, it is presented as a design method that divorces system functionality from system form (Dieter & Schmidt, Reference Dieter and Schmidt2021; Otto & Wood, Reference Otto and Wood2001; Pahl et al., Reference Pahl, Beitz, Feldhusen and Grote1996). Isolating functionality is viewed as advantageous because it circumvents existing mental models, which may bias the engineering design process at the concept generation stage and can help avoid design fixation (Atilola et al., Reference Atilola, Tomko and Linsey2016; Linsey et al., Reference Linsey, Tseng, Fu, Cagan, Wood and Schunn2010; Viswanathan & Linsey, Reference Viswanathan and Linsey2013). Functional modeling is often presented as a solution-neutral design method that slots into the design process before concept generation (Dieter & Schmidt, Reference Dieter and Schmidt2021; Pahl et al., Reference Pahl, Beitz, Feldhusen and Grote1996). With functions tied to specific design requirements, an engineer can generate ideas for specific functions before synthesizing a set of complete solutions from those subfunction concepts. Work has been done to formalize the grammar of functional modeling (Nagel et al., Reference Nagel, Vucovich, Stone and McAdams2007, Reference Nagel, Vucovich, Stone and McAdams2008, Reference Nagel, Bohm and Linsey2014), create a set of standardized verbs (J. Hirtz et al., Reference Hirtz, Stone, McAdams, Szykman and Wood2002; J. M. Hirtz et al., Reference Hirtz, Stone, McAdams, Szykman and Wood2001; Stone & Wood, Reference Stone and Wood1999), and develop a function repository for design by analogy (Bohm et al., Reference Bohm, Vucovich and Stone2008; Bohm & Stone, Reference Bohm and Stone2004). Others have formalized a functional modeling scoring rubric (Reference Murphy, Nelson, Bohm, Nagel and LinseyMurphy et al., 2018; Murphy, Ingram, et al., Reference Murphy, Ingram, Nelson, Bohm, Linsey and Nagel2019; Nagel et al., Reference Nagel, Bohm, Linsey and Riggs2015) and explored how individual differences impact functional modeling behavior individually and in teams (Reference Patel and SummersA. Patel & Summers, 2021).
In this study, functional models are used as two of the three representation modalities. Namely, these two kinds of functional models are referred to as a function graph and a function structure throughout this paper. A function graph position functions (nodes) in the same general location where you might expect to find its component analog in a section-view of a product. A function structure reorganizes these functions with a left-to-right flow bias, which is common among published functional models (Reference Otto and WoodOtto & Wood, 2001) while not necessarily following any formal rule. These two kinds of functional models generally follow the language identified in the functional basis (Reference Hirtz, Stone, McAdams, Szykman and WoodJ. Hirtz et al., 2002) and adhere to EMS (energy-material-signal) flow conventions (Reference Otto and WoodOtto & Wood, 2001). This flow convention was also used on the component graph modality for consistency.
1.2. Partitions of a set
Given a set, a partition refers to a collection of subsets in which each element appears exactly once (Reference HalmosHalmos, 1960). In other words, an element cannot belong to two subsets simultaneously. For instance, a set of five elements can be arranged into 52 unique partitions, ranging from all elements in a single subset, to each element in its own subset individually. This total number of possible unique partitions given a set of elements can be calculated using the Bell Number (Reference KaiKai, 1997). The Bell Number has a variety of applications including the calculation of possible rhyme schemes in poetry or how many distinct ways an integer can be factored in primes (Reference GardnerGardner, 1978). A generating function B(x) can be used to determine the total number of partitions given a set of elements as an infinite series:

The three products used in this study (a hair dryer, a food mixer, and a toilet) have Bell Numbers of 21147, 678570, and 4140 for 9, 11, and 8 elements, respectively. Clearly, the Bell Number increases substantially as the number of elements increases. The generated list of all possible partitions given a set of elements is referred to as the “Bell List” throughout this paper.
1.3. Research questions & hypotheses
To explore the overarching aims of this work, the following research questions were developed:
1. To what extent does representation modality impact an engineer’s ability to identify a system.
2. How does product identification affect the variation of information between partitions of system elements given a representation modality.
3. How does product identification affect resulting best-fit partitions between different representations modalities.
To address the hypotheses, the authors hypothesize that:
1. Correct identification of the system will be most common for component graphs.
2. The variation of information will be smallest for those who correctly identify a system regardless of representation modality.
3. Product identification will have the greatest impact on component graphs.
By exploring these questions, the authors will make significant strides towards the overarching goal of this research. Namely, results from this research will shed light on whether the correct identification of a product impacts systems thinking. Specifically, results will show whether access to existing schema through product identification has a stronger impact on systems thinking when compared to spatial arrangement of elements, hierarchical relationships, flow connectivity, or graph aesthetics.
2. Methods
A mixed replication experimental design was used for this study, with a prompt that contextualized the subsystem clustering activity. The following subsections detail the study context, chosen products, system representation modalities used, and the variation of information approach leveraged for data analysis. Details of the experiment procedure, data collection, and response coding are omitted for brevity and can be found in publications of prior work (Murphy et al., Reference Murphy, Patel, Sen and Summers2022; A. Patel et al., Reference Patel, Murphy, Summers and Sen2022). In short, participants were asked to partition the elements of a system into meaningful subsystems.
2.1. Study context
Data for this study was collected at two universities. University 1 is a research-focused university situated in the southern United States. Participants were enrolled in a course that serves as an introductory engineering course covering many different engineering topics at a surface level. Most participants were first-year engineering students. University 2 is a private university situated in the south-eastern United States that offers a variety of liberal arts and STEM degree programs. Participants were recruited from a first-year engineering design course at the university. Recruitment followed an informed consent procedure for participation in this research at both universities.
2.2. Products
Three products were chosen for assessment: a hair dryer, a food mixer, and a toilet. The hair dryer was chosen because it has been used extensively in prior work to investigate how functional modeling (Murphy, Banks, et al., Reference Murphy, Banks, Nagel and Linsey2019, Reference Murphy, Banks, Nagel and Linsey2023; Murphy et al., Reference Murphy, Banks, Bohm, Nagel and Linsey2020) or product teardown (Reference Murphy, Whittle and SummersMurphy, Whittle, et al., 2023) impacts mental models of systems. The food mixer was chosen because it has a similar level of complexity to a hair dryer and is likely as familiar to the average population. Lastly, the toilet was chosen because it is generally not an electro-mechanical product. Note that all three chosen products are common household products. Participants were expected to have some level of experience with these products, implying that they have at least a partial mental model of the system. Finally, these products can all be represented in two dimensions with minimal overlap of internal components.
2.3. Representation modality
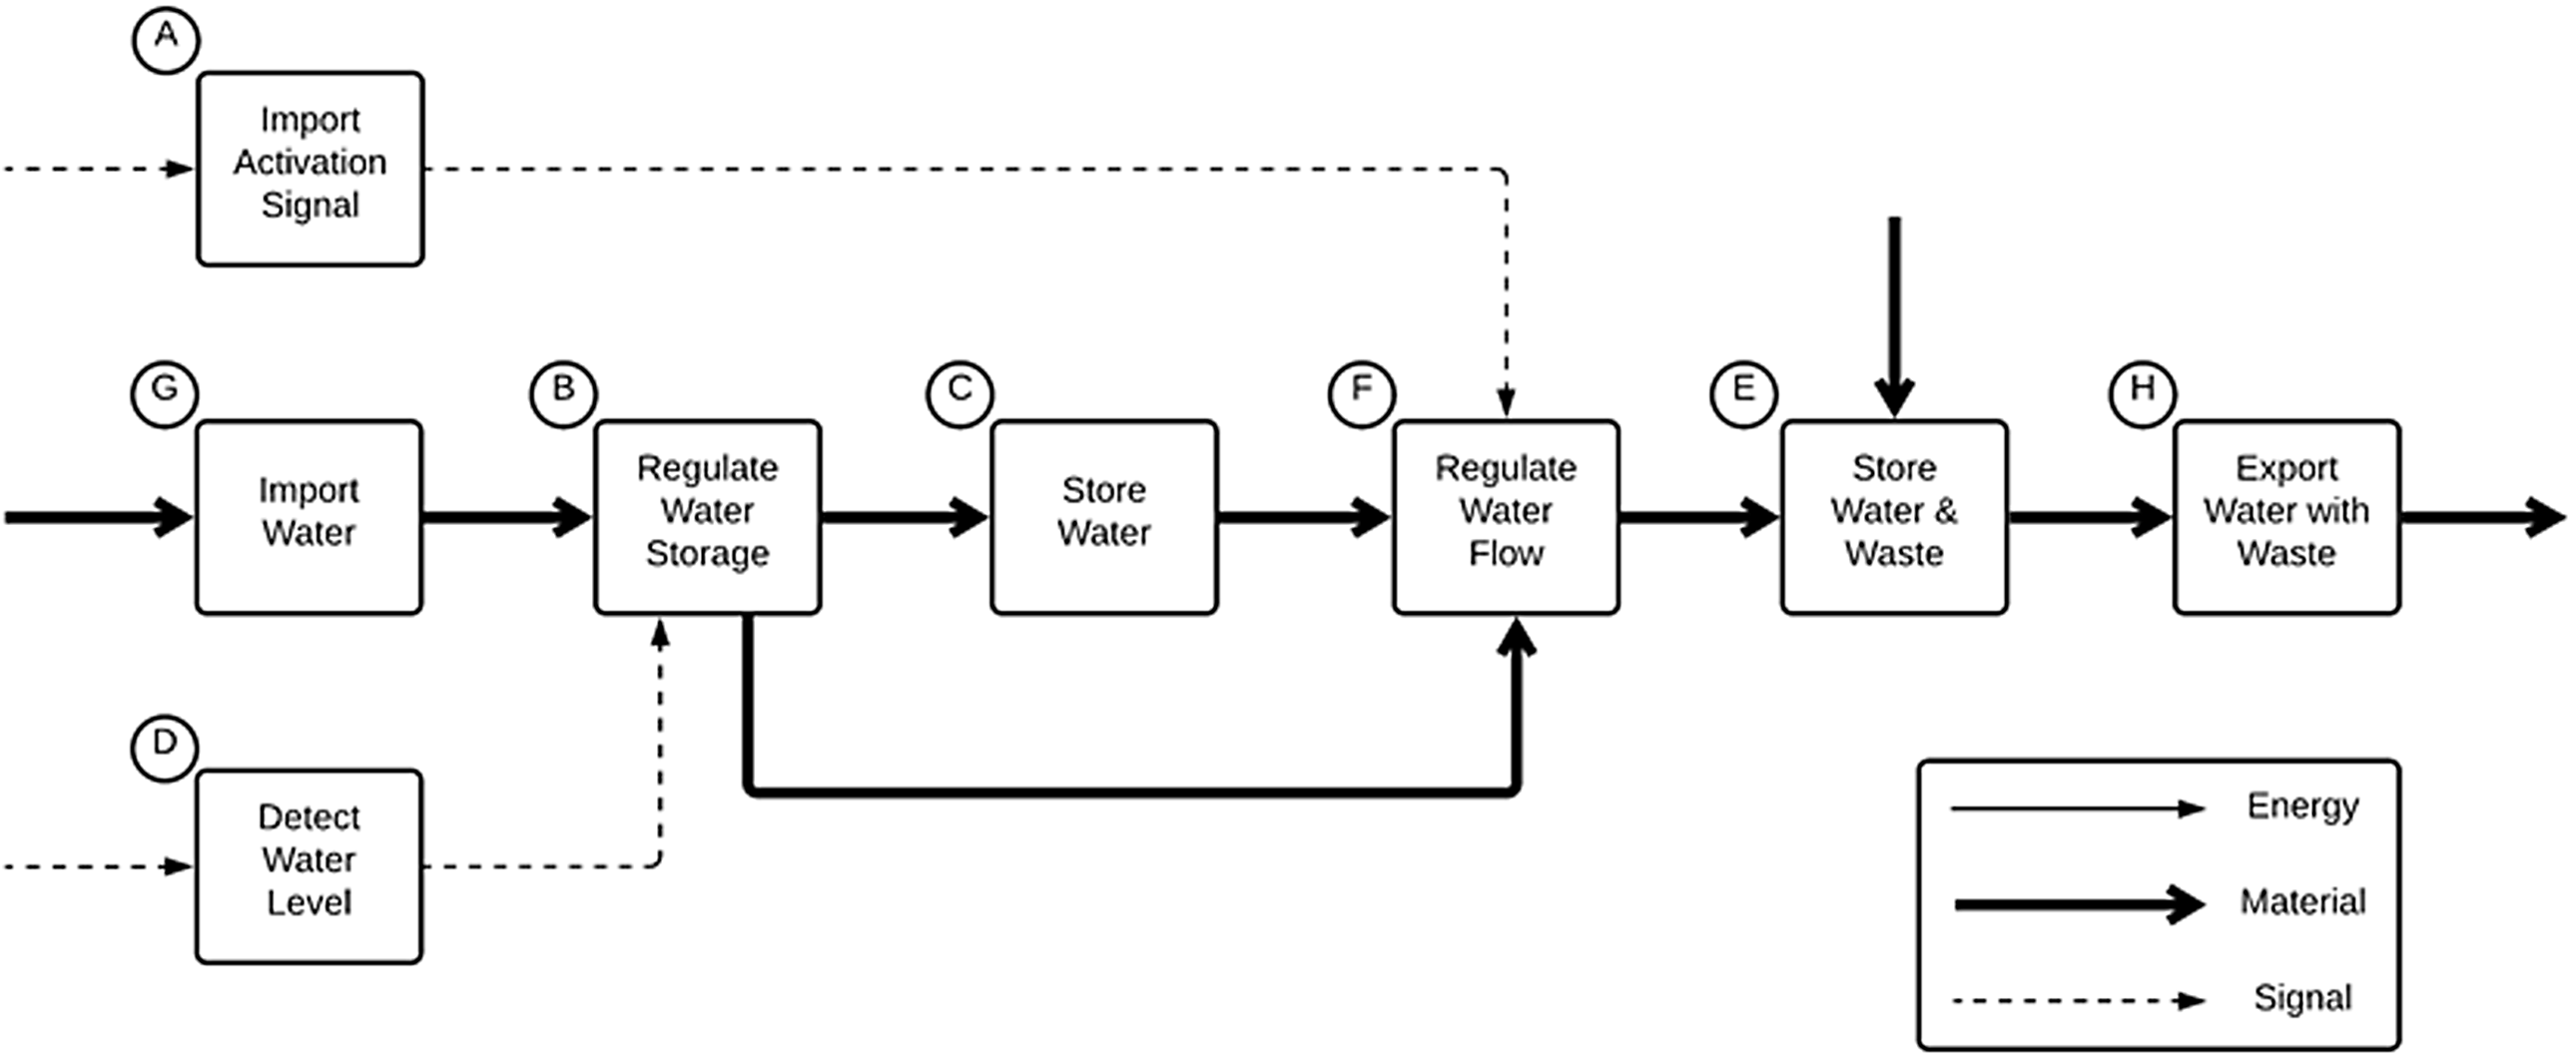
Each of these three products were represented in three different representation modalities. A component graph (CG) pictorially shows components located roughly where one would expect to find them inside the product. A function graph (FG) replaces each component with a function transformation constructed as a verb-noun pair. Lastly, a function structure (FS) relocates the functions formed in the FG to have a left-to-right bias, which is common for functional models found in engineering design theory (Reference Otto and WoodOtto & Wood, 2001). In this manner, the CG and FG differ in terms of their graphical vocabulary, whereas the FG and FS differ in terms of the spatial arrangement. Therefore, the CG and FS differ in terms of both their graphical vocabulary and spatial arrangement and are the least similar to each other. The combination of different products and different representation modalities results in 9 different possible configurations, which were permutated in participant study packets to avoid biasing the results due to ordering. Figure 1 shows an example of the toilet function structure representation used in the study.
Toilet function structure example used for data collection

2.4. Variation of information
Prior work explored different analytical methods for exploring the observed partitions generated by participants (Reference Murphy, Patel, Zorn, Gericke and SummersMurphy, Patel, et al., 2023). Namely, these methods are element cluster frequency, observed partition probability, and variation of information (VoI). Results from this prior work showed that the VoI approach is most appropriate for this context because it does not introduce any new transformations into the analysis procedure (Reference Murphy, Patel, Zorn, Gericke and SummersMurphy, Patel, et al., 2023). It is an information theory-based approach proposed to compare set partitions or clusters (Meilă, Reference Meilă2007; Rossi, Reference Rossi2011). VoI, also known as shared information distance, measures the theoretical distance between two different partitions of a given set. Prior work has used VoI to compare subspace clustering (Reference Patrikainen and MeilaPatrikainen & Meila, 2006) and to assess clustering methods for grouping design behaviors (Reference Rahman, Gashler, Xie and ShaRahman et al., 2018). The VoI approach is preferable for this task as it avoids the need to transform the set partitions into alternate representations, thus preventing potential information loss. VoI is used throughout this paper to analyze groups of set partitions or clusters generated by participants. Equation (2) shows the procedure for computing the VoI between set partitions X and Y. $VoI(X;Y) = - \mathop \sum \limits_{ij} r_{ij} [\log (r_{ij} /p_i ) + \log (r_{ij} /q_j )]$
Assuming xi and yi are subsets of X and Y , respectively; p and q in equation (2) are the counts of elements in xi and yi , respectively. The length of intersection between xi and yi is represented by r. Finally, p, q, and r are normalized by the number of elements in the set (X or Y, as they must have the same size for the calculation of VoI).
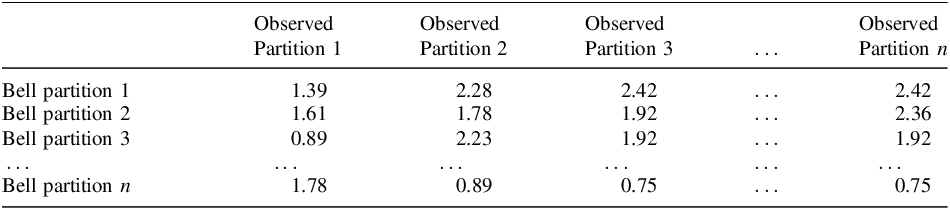
VoI is used to identify the best-fit set partition for a given set of observed set partitions. In this study, a set partition refers to how a participant clustered system elements given a representation of the system. This is done by computing the VoI between each partition in the observed data set against all possible partitions possible in the Bell List. This generates a b×n matrix of VoI values where each cell corresponds to the VoI between an observed set partition and one from the Bell List. An excerpt of the matrix generated for component graph of the hair dryer is presented in Table 1.
Excerpt from the VoI table for hair dryer component graphs.

In Table 1, b = 21147 and n = 20. This example is for data collected from University 1, and filtered to include only participants who correctly identified the product. Next, a row-wise mean is computed, yielding the average VoI for each Bell partition. Finally, the Bell partition with the minimum average VoI is selected as the best-fit set partition for the group of participants.
3. Results
Participant responses on the clustering activity were coded to support systematic comparisons of groups. The coding procedure is outlined in prior work and omitted here for brevity (Murphy et al., Reference Murphy, Patel, Sen and Summers2022; A. Patel et al., Reference Patel, Murphy, Summers and Sen2022). Each participant completed three clustering activities, resulting in a total of 213 and 231 responses from University 1 and University 2, respectively. Each participant’s response also included the product identification, which was coded as either correct or incorrect. The two universities are compared based on frequency of correct product identification. Next, the effects of correctly identifying the products are examined.
3.1. Correct vs. incorrect Identification
A list of acceptable product identifications was generated by the research team. This was necessary since some products are functionally identical to each other (e.g., a hair dryer and a space heater theoretically have identical functional decompositions). For instance, responses such as “heater”, “hot air blower”, and “blow dryer” were accepted as correct identification for the hair dryer. In total, seven different responses were considered correct for the hair dryer. Similarly, eleven and nine correct responses were identified for the mixer and toilet, respectively. The full list of accepted responses is omitted for brevity. Next, participant responses were analyzed to determine whether there were significant differences between the two universities. Table 2 shows the number of correct and incorrect responses for each product-representation pair from both universities.
Pooled count of correct and incorrect product identification from both universities.

The proportion of correct responses largely remains the same between the two universities. To determine whether any differences in the proportion of correct responses between universities were statistically significant, a two-proportions test was conducted for each product-representation pair. None of the comparisons found a statistically significant difference (α = 0.05), with the smallest p-value observed for function graph of the hair dryer (p = .093). A Fisher’s exact test was conducted for that case, which also failed to reject the null hypothesis of similarity (p = .155). This suggests that participants in both populations were not different in terms of correct product identification. Therefore, the data was pooled for subsequent analysis.
Next, the combined counts of correct and incorrect product identifications are analyzed to address RQ1. One of the aims of this study was to understand how representation of a system influences the ability to correctly identify the system being represented. In this case, three representations (CG, FG, FS) are examined in three systems (hair dryer, mixer, and toilet). At the product level, the proportion of correctly identified products ranged from 74% (toilet) to 39% (mixer) correct; however, these numbers are not equivalently reflected at the representation level. As stated by H1, the component graph is expected to support the most accurate product identification. To examine this, two-proportion tests are conducted comparing the three representations for each product, with results shown in Table 3.
Comparing product identification by representation.

As three comparisons were performed for data from each product, a Bonferroni correction is applied to the significance level, resulting in α = 0.017. As such, the component graph is found to be significantly different from the other representations for the mixer. For the hair dryer, the component graph is significantly different from the function structure. For the toilet, the component graph is only found to be significantly different from the function graph. For all three products, the product identification rates were similar for the function graph and the function structure (lowest p = .388). These findings were confirmed by a Fisher’s exact test.
3.2. Correct vs. incorrect variation of information
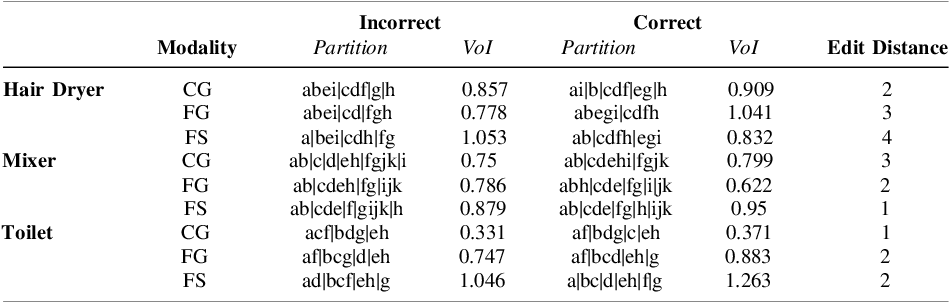
Following the analysis of the proportion of correct identification, effects of product identification on subsystem clustering are evaluated. To do this, the best-fit partitions for each product, modality, and correct vs. incorrect identification are compared. Table 4 shows which partition from the Bell List had the lowest VoI when compared to the observed set of participant partitions. In cases where the VoI was equivalent for multiple Bell List partitions, the partition with the lowest variance was selected. Table 4 also shows the edit distance between best-fit partitions where edit distance was determined based on a modified version of the Hamming distance. A one-point cost is incurred for transporting an element from one set to another set. No cost is incurred for the insertion or deletion of empty sets, however, transporting an element into an empty set will cost one point.
VoI and edit distance between correct and incorrect product identification.

Note that the data presented in Table 4 is pooled from both universities. A Kruskal Wallis Test was performed to compare the two VoI values from both universities. Results do not indicate significant differences: H(1) = 1.528, p = 0.216. Moreover, edit distances between partitions that best fit observed data between University 1 and University 2 do not exceed 2 (not shown in Table 4). Given these results, the data is assumed to be from the same population. Given this pooled data, there are overall no meaningful differences in the VoI for any given pair of partitions (Table 4). This is corroborated by the low edit distances observed between any pairings of incorrect vs. correct partitions. Notably, the hair dryer function structure had the largest edit distance of 4, which is explored in more detail in the discussion section. Overall, these results show that product identification may not meaningfully contribute to subsystem clustering behavior given various system representation modalities.
4. Discussion
The results of this study suggest that product identification may not play a large role in subsystem clustering behavior. The proportion of correct identification was significantly different between at least two representations for each product. This suggests that the representation used influences the likelihood of deciphering the product being modelled. No differences were observed for any pair of partitions based on product identification. This is true for each of the representation modalities and across the three products. Given prior results supporting this finding, which show that representation modality does indeed have an impact on clustering behavior (Reference Murphy, Patel, Sen and SummersMurphy et al., 2022; Murphy, Patel, et al., Reference Murphy, Patel, Zorn, Gericke and Summers2023; A. Patel et al., Reference Patel, Murphy, Summers and Sen2022), this result suggests that factors other than product identification likely contribute to how engineers reason about systems and subsystems.
Figure 2 shows the best-fit partitions for correct (left) and incorrect (right) identification of the hair dryer. Note that these do not reflect a ground truth of correct partitioning; rather they are the aggregated models of participants who did (on the left) or did not (on the right) correctly identify the product. On the partition shown in Figure 2 (left), notice the cluster ‘abei’, which very closely follows the mass flow (or thick arrow) and indicates that flow connectivity may play a role. Further, cluster ‘cdf’ all contain signal inputs or outputs, which also supports that flow connectivity may be a significant factor. This is also true in the best-fit partition shown in Figure 2 (right). For this partition, the motor and fan have been clustered together, which indicates that hierarchical clustering related to schema may also play a role (given that fans are almost always connected to motors). If a participant was unsure about what product was being represented, they may have been drawn to cluster the fan with the motor instead of clustering elements associated with the flow of air.
Best fit partitions for correct (left) and incorrect (right) product identification

The first hypothesis, “correct identification of the system will be most common for component graphs”, is partially supported by the results. For two of the three products, the component graph was found to not only have the highest proportion of correct identification, but also was significantly higher than at least one, if not both of the other two representations. For the hair dryer, the results are mixed, with a more balanced distribution of correct and incorrect identifications. Results from the hair dryer task may differ since there are multiple products that are functionally similar (a hair dryer, a space heater, a toaster oven, etc.). Each of these products exists in slightly different contexts and are operated differently, which may explain why the results do not match the other two products.
The second hypothesis, “the variation of information will be smallest for those who correctly identify a system regardless of representation modality”, is not supported. In reference to Table 4, the VoI for correct product identification was smaller than the VoI for incorrect identification in only two cases: the hair dryer function structure and the mixer function graph. This illustrates that correctly identifying a system from a representation does not decrease cluster variance. In terms of systems thinking, it appears that factors other than recognition are contributing to system interpretation. This hypothesis was originally formulated on the basis that recognition will give access to preexisting schema, where schema “refers to knowledge structures that govern thought by selective attention, retention, and use of information about a particular aspect of the world” (Reference Nisbett and NorenzayanNisbett & Norenzayan, 2002). It seemed likely that mental models built on these schemata would lead to convergence in systems thinking, where a distinction of permanence can be made between mental models and schema (Reference Al-DibanAl-Diban, 2012). The results of this study do not support this and instead suggest that other factors may be influencing how engineers parse a system representation.
The third hypothesis, “product identification will have the greatest impact on component graphs” is also not supported by the results. This hypothesis serves as an extension to the second hypothesis, examining whether differences might be observed specifically for different representation modalities. This was not the case. With the central metric being VoI, product identification does not seem to significantly affect the resulting best-fit partition across all three products regardless of representation modality nor for the different modalities when ignoring product differences.
An apparent difference in information density between the representation modalities served as a primary motivation for the analysis presented in this paper. Information density here refers to the amount of system-identifiable information present in the representation. Arguably, the component graph is the most dense in that it contains pictorial, relational (flows or edges), and spatial information. The function graph, lacking pictorial information, sits in the middle retaining relational and spatial information. While there is an argument that the function graph introduces new information in the form of a verb-noun functional description of each element, functional decomposition is generally considered to be solution-neutral and a step away from the physical (Dieter & Schmidt, Reference Dieter and Schmidt2021; Otto & Wood, Reference Otto and Wood2001; Pahl et al., Reference Pahl, Beitz, Feldhusen and Grote1996). The function structure has the lowest information density with the removal of spatial information (replaced by a left-to-right bias) and only the relational information retained. For hair dryer function structures, an edit distance of 4 was observed between those who correctly vs. incorrectly identified the product. This difference might be explained by the variety of systems functionally analogous to a hair dryer coupled with the comparatively low information density associated with a function structure. Results of this work set a foundation for future work that explores what other factors most strongly influence how engineers reason about systems given that various representations have been shown to result in differences in subsystem clustering (Reference Murphy, Patel, Zorn, Gericke and SummersMurphy, Patel, et al., 2023).
This study is subject to a few limitations. First, the number of observed partitions is far from the Bell Number for each product. For example, the mixer with only 11 elements has 678570 possible partitions. Not all possible partitions are observed, which is not unexpected. However, the large quantity of possibilities likely warrants sample sizes at least of the same order of magnitude for more common statistical analysis methods. Second, the quality of the system models and representations used in this study might influence a participant’s ability to identify meaningful subsystems. In that case, participants may fall back on other means of clustering less relevant to the system description. Third, the analysis presented in this paper assumes convergence on a most representative partition. Of course, it may be that no single partition emerges as most representative. It is likely that a family of partitions better represents human behavior. Characterizing which factors contribute to this converge is central to the overarching research question which this research makes a meaningful contribution towards. Finally, the functional models (the FGs and FSs) would likely be modeled differently by other designers. In fact, assigning function transformations to components is a bit antithetical to the norms around functional modeling and decomposition. Within the context of this study, functional modeling as a method is largely borrowed for its differences in representation and its familiarity to the engineering design field.
5. Conclusion
The results presented in this paper indicate that system identification does not dominate subsystem clustering behavior in the given engineering design task. While the proportion of correctly identified products differ based on the representation, no consistent differences are observed in the best-fit partitions of correct and incorrect identification. This implies that access to schema through recognition does not necessarily impact system reasoning, which was surprising. This indicates that other factors are more strongly influencing how engineers parse a system into discreet subsystems. In future work, the spatial arrangement of elements will be assessed to determine if the physical distances between elements dominates systems thinking. As an analysis method, k-means clustering has been identified to generate partitions that only consider the spatial arrangement of elements. There are also plans to address hierarchical decomposition (Reference Hirtle and KallmanHirtle & Kallman, 1988), flow connectivity, and graph aesthetics (Reference Purchase, Carrington and AllderPurchase et al., 2002; Reference Ware, Purchase, Colpoys and McGillWare et al., 2002). Ultimately, these factors will be weighed against each other to determine how engineering designers deconstruct a system in constituent subsystems.
The work presented in this paper makes significant strides towards the overarching research goal of this project to understand what factors of a representation most strongly impact systems thinking. Showing that correct vs. incorrect product identification does not impact clustering behavior builds on prior work that showed representation modality does indeed have an impact on the resulting best-fit partitions (Reference Murphy, Patel, Zorn, Gericke and SummersMurphy, Patel, et al., 2023). System representations exist in many forms across a wide variety of industry applications from system monitoring equipment to the control rooms of utility companies. Better understanding of how system representation decisions impact the systems thinking of engineers may guide the design of these control systems in the future to reduce cognitive load, improve troubleshooting capabilities, and minimize errors that could negatively affect our lives.
Acknowledgements
The authors would like to thank all the students for their voluntary participation in this research study. We would also like to thank Chiradeep Sen for his contributions to this work. This material is based upon work supported by the National Science Foundation under Grant No. EEC-2127509 to the American Society for Engineering Education. Any opinions, findings, and conclusions or recommendations expressed in this material are those of the authors and do not necessarily reflect the views of the National Science Foundation.




 Open access

