


Impact Statement
Tandem flapping foils have the potential to be used for propulsion, especially by bio-inspired autonomous underwater vehicle (AUV) designers, due to their superior performance over single flippers. In this study, we evaluate the importance of aspect ratio on the thrust-augmenting effect of in-line flapping, known as wake recapture. It is shown that flipper elongation impacts the interaction between the hind flipper (or follower) and its incoming flow, as it strengthens the vortices, shed in the wake of the front flipper. This affects both the thrust-generating capacity and the optimal phasing of the flippers, allowing the engineer to determine the vehicle's suitability towards certain missions, simply based on foil slenderness. An in-depth analysis of the wake dynamics enables us to distinguish the limitations as well as ways to optimise this approach by monitoring the transition towards a quasi-two-dimensional flow.
1. Introduction
Flapping foil mechanisms are the basic means of propulsion and control within the avian and aquatic fauna. These systems are often more agile, durable and efficient compared to conventional man-made propulsors (Reference WeymouthWeymouth, 2016). Thus, many studies have focused on the analysis of these biological configurations in terms of kinematics (Reference Cimarelli, Franciolini and CrivelliniCimarelli, Franciolini, & Crivellini, 2021; Reference Khalid, Wang, Akhtar, Dong, Liu and HemmatiKhalid et al., 2021), fluid–structure interaction (Reference Kim, Hussain and GharibKim, Hussain, & Gharib, 2013; Reference Zurman-Nasution, Ganapathisubramani and WeymouthZurman-Nasution, Ganapathisubramani, & Weymouth, 2020) as well as the effects of planform geometry (Reference Dagenais and AegerterDagenais & Aegerter, 2020; Reference Zurman-Nasution, Ganapathisubramani and WeymouthZurman-Nasution, Ganapathisubramani, & Weymouth, 2021b) and flexibility (Reference Fernandez-Feria and Alaminos-QuesadaFernandez-Feria & Alaminos-Quesada, 2021; Reference Shi, Xiao and ZhuShi, Xiao, & Zhu, 2020).
Tandem flapping configurations e.g. insect wings (Reference AlexanderAlexander, 1984; Reference Thomas, Taylor, Srygley, Nudds and BomphreyThomas, Taylor, Srygley, Nudds, & Bomphrey, 2004), plesiosaur flippers (Reference Hawthorne, McMenamin and De la SalleHawthorne, McMenamin, & De la Salle, 2019; Reference Robinson and JaRobinson & Ja, 1975) etc. are shown to outperform single flappers due to certain foil–wake interactions commonly referred to as  ${\rm wake}~{\rm recapture}$ (Reference Broering and LianBroering & Lian, 2012; Reference Muscutt, Weymouth and GanapathisubramaniMuscutt, Weymouth, & Ganapathisubramani, 2017b). This has inspired researchers to experiment with quadruple foil systems to propel autonomous underwater vehicles (AUVs), using a variety of harmonic kinematics e.g. pitch, roll, coupled motion, etc. Most of these tetrapodal swimmers (see Figure 1) are electric-powered, designed for a wide range of depths (1–100 m) and can reach velocities of 0.5–2 m s $^{-1}$ (Reference Licht, Polidoro, Flores, Hover and TriantafyllouLicht, Polidoro, Flores, Hover, & Triantafyllou, 2004; Reference Long, Schumacher, Livingston and KempLong, Schumacher, Livingston, & Kemp, 2006; Reference Weymouth, Devereux, Copsey, Muscutt, Downes and GanapathisubramaniWeymouth et al., 2017), which are comparable to modern propeller-driven, ocean-going AUVs of a similar size and weight (Reference YuhYuh, 2000).
Two examples of bio-inspired AUVs that combine front and back flipper oscillation (tandem arrangement) as a means of propulsion: (a) a pure pitching motion (Reference Long, Schumacher, Livingston and KempLong et al., 2006); (b) a combination of rolling and pitching (Reference Weymouth, Devereux, Copsey, Muscutt, Downes and GanapathisubramaniWeymouth et al., 2017). A simplified version of the latter kinematics is used in this study.

Of particular interest, towards the design of these systems, is the aspect ratio  $AR$ (for rectangular wings, $AR=W/\mathcal {C}$, where $W$ is the wingspan and $\mathcal {C}$ is the chord length) due to its impact on the system's thrust generation capacity. Slender flippers, for example, are widely considered as beneficial to both thrust and efficiency (Reference Dewey, Boschitsch, Moored, Stone and SmitsDewey, Boschitsch, Moored, Stone, & Smits, 2013; Reference Green and SmitsGreen & Smits, 2008; Reference Shao, Pan, Deng and YuShao, Pan, Deng, & Yu, 2010), which is further implied by the predominance of high $AR$ wings among birds and insects (Reference AzumaAzuma, 1992; Reference EllingtonEllington, 1984; Reference Usherwood and EllingtonUsherwood & Ellington, 2002). As a result, early research was driven towards two-dimensional (2-D) or quasi-two-dimensional approaches both experimentally (Reference KoochesfahaniKoochesfahani, 1989; Reference Triantafyllou, Triantafyllou and GrosenbaughTriantafyllou, Triantafyllou, & Grosenbaugh, 1993) and numerically (Reference Guglielmini and BlondeauxGuglielmini & Blondeaux, 2004; Reference MittalMittal, 2004; Reference Pedro, Suleman and DjilaliPedro, Suleman, & Djilali, 2003).
Unlike avian organisms however, aquatic animals demonstrate a great variety of  $AR$ values with non-migratory fish using mostly low $AR$ values (Reference Combes and DanielCombes & Daniel, 2001; Reference Walker and WestneatWalker & Westneat, 2002), as they are considered more suitable for their drag-based paddling motion. Furthermore, comparisons among various species suggest that high $AR$ values benefit cruising efficiency while low $AR$ values promote thrust generation in short bursts (Reference DomeniciDomenici, 2010; Reference Flammang and LauderFlammang & Lauder, 2009), which is also supported by recent experiments (Reference Lee, Park, Cho, Kim and KimLee, Park, Cho, Kim, & Kim, 2017). A preference towards lower $AR$ values in aquatic propulsion can be additionally attributed to the much higher density of water, which leads to greater added-mass associated bending moments (Reference Dong, Mittal and NajjarDong, Mittal, & Najjar, 2006). This can significantly constrain the design of an AUV by determining manufacturing costs, durability, mission envelope etc., and thus demonstrates the necessity of finite flipper analysis.
Contemporary literature on finite wings of varying  $AR$ often focuses on single flapping configurations (Reference Hammer, Garmann and VisbalHammer, Garmann, & Visbal, 2021; Reference Zhong, Han, Moored and QuinnZhong, Han, Moored, & Quinn, 2021; Reference Zurman-Nasution, Ganapathisubramani and WeymouthZurman-Nasution et al., 2021b) with only a few studies related to tandem arrangements (Reference Arranz, Flores and Garcia-VillalbaArranz, Flores, & Garcia-Villalba, 2020; Reference Jurado, Arranz, Flores and García-VillalbaJurado, Arranz, Flores, & García-Villalba, 2022). A key feature of the above is the presence of tip vortices that transform the 2-D wake into a complex chain of ring-like formations (Reference Li, Pan, Zhao, Ma and WangLi, Pan, Zhao, Ma, & Wang, 2018; Reference Shao, Pan, Deng and YuShao et al., 2010). Moreover, the majority of these studies use insect and small fish kinematics and/or geometries which, although quite suitable for special applications, are less relevant to open water designs. However, certain heave-to-pitch combinations are considered dominant in cetacean locomotion (Reference Ayancik, Fish and MooredAyancik, Fish, & Moored, 2020; Reference Han, Wang, Fish and DongHan, Wang, Fish, & Dong, 2020) (where spanwise flexibility of the caudal fin is comparatively low (Reference Adams and FishAdams & Fish, 2019; Reference Gough, Fish, Wainwright and Bart-SmithGough, Fish, Wainwright, & Bart-Smith, 2018)). Furthermore, heave-to-pitch coupling is considered sufficient to represent the mid-chord kinematics of flipper-based, AUVs and/or aquatic animals using roll-to-pitch combinations (Reference Muscutt, Dyke, Weymouth, Naish, Palmer and GanapathisubramaniMuscutt et al., 2017a) such as sea turtles, penguins and most notably the tetrapodal plesiosaurs (Reference Carpenter, Sanders, Reed, Reed and LarsonCarpenter, Sanders, Reed, Reed, & Larson, 2010). In addition, the effect of flipper $AR$ on the wake recapture remains unknown, despite its aforementioned importance within tandem-flapping AUV concepts.
The present study attempts to address these issues via the numerical analysis of rectangular flippers with elliptical tip, undergoing heave-to-pitch coupling for a chord based Reynolds number,  $Re_\mathcal {C}= \rho U_{\infty } \mathcal {C} / \mu =8500$, where $\rho$ is the water density, $U_{\infty }$ is the freestream velocity and $\mu$ is the dynamic viscosity. Seven $AR$ values are tested in both single and tandem configurations of identical $AR$ for an amplitude-based Strouhal, $St_{A}= f\cdot 2\mathcal {A}/ U_{\infty }=0.4$, where $f$ is the frequency of oscillation and $2\mathcal {A}$ is the peak-to-peak amplitude of the trailing edge (TE) (Reference Triantafyllou, Triantafyllou and GopalkrishnanTriantafyllou, Triantafyllou, & Gopalkrishnan, 1991). In addition, the phase lag and distance between consecutive flippers are kept constant, selected for maximum thrust augmentation at the given $St_A$ in a 2-D domain (Reference Muscutt, Weymouth and GanapathisubramaniMuscutt et al., 2017b). Here, the choice of $St_A$ is based on the observed range of Strouhals used by swimming and flying organisms (Reference Triantafyllou, Triantafyllou and GrosenbaughTriantafyllou et al., 1993). Furthermore, the test cases are evaluated in terms of load coefficients, relative thrust augmentation and hydrodynamic efficiency. To this end, we compare the single/tandem flipper sensitivity to $AR$ and attempt to shed light on the three-dimensional (3-D) aspect of the wake to wake interaction.
2. Methodology
2.1 Flipper geometry and kinematics
We consider a rigid NACA0016 with a thickness  $D = 0.16\,\mathcal {C}$, a rectangular planform section where the width is equal to $1\,\mathcal {C}$ and a tapered elliptical tip as shown in Figure 2. Here, the elliptical section has a span of $1\,\mathcal {C}$ while $W$ is the total span of the flipper. Thus, for the sake of simplicity, we use the $AR$ definition of rectangular flippers (explained in § 1) and we set our baseline test case at $AR =2$ proceeding towards $AR =8$ in increments of $AR =1$.
Structural details of an  $AR=4$ hydrofoil, where the (a) frontal, (b) upper and (c) side views are presented. A detailed model of the flipper in the form of an IGS file can be found online, within the supplementary material of this study.

The kinematics parameters of the hydrofoil can be seen in Figure 3. As stated above, the flippers use heave-to-pitch coupling, which is achieved by the superposition of the two harmonic components. More specifically, pitch refers to the sinusoidal rotation about the pivot point  $\mathcal {P} = 0.25$ (normalised by $\mathcal {C}$) while heave is a sinusoidal, vertical translation with respect to the centreline. Thus, the combined motion of the TE can be described as
 $$\begin{gather} y_f(t) = \underbrace{h_\mathit{0}\sin(2f{\rm \pi} t)}_{y_h(t)} + \underbrace{(1-\mathcal{P})\mathcal{C}\sin[{\theta}(t)]}_{y_\theta(t)} \end{gather}$$
 $$\begin{gather}{\rm with}\ \theta(t) = {-}\theta_\mathit{0} \sin(2f{\rm \pi} t + \psi), \end{gather}$$
where subscripts  $f$,
$f$,  $h$ and $\theta$ denote the front (or single foil), heaving and pitching components, respectively.
Kinematic parameters and coordinate system of an oscillating foil undergoing (a) heave, (b) pitch and (c) coupled motion. Redrawn from Reference Lagopoulos, Weymouth and GanapathisubramaniLagopoulos, Weymouth, and Ganapathisubramani (2019).

Here, the instantaneous pitching angle is expressed as the  $\theta (t)$, while $h_{0}$ and $\theta _{0}$ represent the amplitudes of the two motions. Note that although the total peak-to-peak amplitude is a combination of these TE displacements, the chosen kinematic parameters result in $\mathcal {A} \sim h_{0} = 1\,\mathcal {C}$. Furthermore, the heave-to-pitch phase difference is set to $\psi = 90^{\circ }$, which is shown to maximise the propulsive efficiency within the frequency range of interest (Reference Platzer, Jones, Young and LaiPlatzer, Jones, Young, & Lai, 2008). Lastly, the combined (or effective) angle of attack $\alpha (t)$ equals to the summation of $\theta (t)$ and the heave-induced angle of attack. For the current range of kinematic parameters (i.e. amplitudes and frequencies), the amplitude of the effective angle of attack can be approximated as
 \begin{equation} \alpha_0 = \arctan \frac{2 {\rm \pi}f h_{0}}{U_\infty} - \theta_{0}, \end{equation}
where  $2 {\rm \pi}f h_{0}$ is the amplitude of ${\rm d} y_h/{\rm d} t$. Within this study, all simulations are conducted for $\alpha _0=20^{\circ }$ due to its dominance within modern cetaceans (Reference Fish and RohrFish & Rohr, 1999) and relevant studies in tetrapodal swimming (Reference Muscutt, Dyke, Weymouth, Naish, Palmer and GanapathisubramaniMuscutt et al., 2017a).
The complete tandem arrangement is depicted in Figure 4. To distinguish parameters referring to the front or the back foil, we use the subscripts  $f$ (already mentioned above) and $b$, respectively, for the remainder of this study. Furthermore, to describe the foil-to-foil interaction, we introduce two more parameters: the phase lag and the inter foil spacing.
Details of a tandem foil configuration, undergoing synchronous ( $\phi =0^\circ$) heave-to-pitch coupling.

The phase lag between the two foils is expressed as  $\phi$ and will be referred to as simply the phase. Thus, the back flipper's motion is described as
 \begin{equation} y_b(t) = y_ h(t + \phi) + y_ {\theta}(t + \phi). \end{equation}
 Here,  $\phi =0^{\circ }$, as preliminary simulations found that this increases the overall thrust of the hind foil for the chosen parameters (for details, see Appendix A).
Spacing  $\mathcal {S}$ is the distance between the TE of the front foil and the leading edge (LE) of the back foil towards the streamwise direction. Therefore, the chord normalised spacing $\mathcal {S}_C$ is defined as
 \begin{equation} \mathcal{S}_\mathcal{C} = \frac{\mathcal{S}}{\mathcal{C}}. \end{equation}
 While a  $\mathcal {S}_C \leq 1$ is dominant among small fliers such as dragonflies (Reference Broering and LianBroering & Lian, 2012; Reference Usherwood and LehmannUsherwood & Lehmann, 2008), fossil records suggest that $\mathcal {S}_C \geq 3$ was more common in plesiosaurs (Reference Muscutt, Dyke, Weymouth, Naish, Palmer and GanapathisubramaniMuscutt et al., 2017a; Reference O'Keefe and CarranoO'Keefe & Carrano, 2005). In our study, $\mathcal {S}_C = 2$, which allows a relatively compact design and has demonstrated maximum thrust augmentation in tandem arrangements of similar kinematics and $St_A$ (Reference Muscutt, Weymouth and GanapathisubramaniMuscutt et al., 2017b).
2.2 Performance metrics
Within a flapping cycle, the flipper experiences a time-dependent thrust  $F_{X}(t)$, a side (lateral) force $F_{Y}(t)$ and moment $M_{Z}(t)$ around $\mathcal {P}$. In this study, we focus on the thrust generation capacity and lateral force development of the fore and hind flipper, characterised by the thrust and side force coefficients, respectively:
 \begin{equation} C_{T} = \frac{F_{X}}{\dfrac{1}{2}\rho U_\infty ^2 G},\quad C_{Y} = \frac{F_{Y}}{\dfrac{1}{2}\rho U_\infty ^2 G}, \end{equation}
where  $G= \mathcal {C} \cdot (W-\mathcal {C}) + 0.25 {\rm \pi}\mathcal {C}^2$ is the planform area. Cycle-averaged quantities are presented with a tilde ( $~\widetilde {}~$) to distinguish them from their instantaneous counterparts. Furthermore, the 2-D thrust coefficient (where $G$ is replaced by $\mathcal {C}$) is distinguished by the use of the subscript $t$ instead of $T$.
$T$.
Another important parameter is the propulsive (hydrodynamic) efficiency ( $\eta$) of each flipper. This is simply the ratio between the power of the generated thrust and the power imparted to the flipper so that it overcomes the loads imposed by the fluid:
 \begin{equation} \eta = \frac{T U_\infty}{P}, \end{equation}
where  $T$ is the thrust and $P$ the input power defined as
 \begin{equation} P(t) = F_{Y}(t)\frac{{\rm d} y_ h(t)}{{\rm d} t} + M_Z(t)\frac{{\rm d}\theta(t)}{{\rm d} t}. \end{equation}
To compare the performance of the single and tandem configurations, we normalise the above values by the equivalent parameters of the single (front) flipper:
 \begin{equation} C^ * _{T,b} = \frac{\widetilde{C_{T,b}}}{\widetilde{C_{T,f}}},\quad \eta^ * _{b} = \frac{\eta_{b}}{\eta_{f}}, \end{equation}
where  $^*$ denotes relative terms. Previous studies suggest little to no alteration of the front foil's loads and efficiency by the presence of the hind for $S_\mathcal {C} \ge 1$ (Reference Muscutt, Weymouth and GanapathisubramaniMuscutt et al., 2017b). Thus, any normalised parameters presented here are associated with the back flipper.
2.3 Computational method
The numerical package used for this work is based on the boundary data immersion method (BDIM). The BDIM is able to simulate the entire domain by combining the full Navier–Stokes equations and the prescribed solid kinematics through a kernel function (Reference Weymouth and YueWeymouth & Yue, 2011). Here, the equations are solved on a Cartesian finite volume grid, where the convective term is expressed by a flux-limited quadratic upstream interpolation for convective kinematics (QUICK) scheme (Reference LeonardLeonard, 1979) and the diffusive terms are handled via central differences. Temporal discretisation is achieved via Heun's explicit second-order method and an adaptive time-stepping scheme is used to preserve stability (Reference Polet, Rival and WeymouthPolet, Rival, & Weymouth, 2015). Moreover, turbulence is described through an implicit large eddy simulation (iLES) model that uses flux limiting to model the energy dissipation caused by sub-grid stress (Reference Lauber, Weymouth and LimbertLauber, Weymouth, & Limbert, 2022). iLES modelling is well suited to intermediate Reynolds numbers such as those used in the present study, and (Reference Hendrickson, Weymouth, Yu and YueHendrickson, Weymouth, Yu, and Yue (2019)) demonstrates that this iLES model completely deactivates when the grid is sufficiently fine to resolve the physical dissipation. In addition, the BDIM has been validated for flapping foil applications at a wide range of kinematics and Reynolds numbers up to  $10^5$, resulting in thrust prediction errors of $\epsilon \leq 5\,\%$ (Reference Maertens and WeymouthMaertens & Weymouth, 2015).
When the computational domain is 2-D, it is formed by a rectangular mesh with a dense uniform zone around the body and near wake, while exponential grid stretching is used for the far-field. In particular, the inlet is located  $2\mathcal {C}$ ( $0.5\mathcal {C}$ for the uniform zone) ahead of the front foil's $\mathcal {P}$ and the outlet is placed at $14\mathcal {C}$ ( $9\mathcal {C}$ for the uniform zone) downstream. Regarding the upper/lower boundaries, the foils are placed in the middle, keeping a distance of $6\mathcal {C}$ ( $2\mathcal {C}$ for the uniform zone) from both sides. To avoid discrepancies between 2-D and 3-D results, the 3-D mesh configurations are derived from the 2-D mesh configurations by simply extending the domain towards the spanwise direction ( $z$ axis). Here, the uniform grid exceeds the flipper span by $0.2\mathcal {C}$ to include possible wingtip effects (Reference Zurman-Nasution, Ganapathisubramani and WeymouthZurman-Nasution, Ganapathisubramani, & Weymouth, 2021a), while the non-uniform grid increases proportionally with $AR$, so that the space between the flipper and the spanwise boundary equals $1.25W$ for all test cases (e.g. at $AR=2$, the spanwise domain is $4.5\mathcal {C}$ long, while at $AR=8$, it reaches $18\mathcal {C}$).
The simulations are conducted with uniform inflow, zero-gradient outflow and free-slip conditions on the upper and lower boundaries. Additionally, no-slip conditions are imposed on the oscillating foil and, for the 3-D simulations, symmetric conditions are enforced towards the two spanwise directions.
A convergence analysis is performed where the mesh density is expressed in terms of grid points per chord. More specifically, in the case of the uniform zone, a grid of  ${\rm \Delta} x = {\rm \Delta} y = {\rm \Delta} z = C/64$ is used, yielding relatively fast results while the standard deviation of the estimated thrust is ${\leq }8\,\%$ of the simulations with four times the resolution in both 2-D and 3-D domains (Reference Zurman-Nasution, Ganapathisubramani and WeymouthZurman-Nasution et al., 2021a).
3. Results and discussion
3.1  $AR$ effect on the single flipper

The performance of the single flipper at varying  $AR$ can be seen in Figure 5. Elongation leads to a sharp increase of the thrust coefficient until $AR \sim 4$, where the curve starts to asymptote for higher $AR$ and ${\delta \widetilde {C_T}}/{\delta AR} \leq 3\,\%$ (beyond $AR> 6$). However, a noticeable discrepancy still exists between the longest spans tested and the 2-D case, where $\widetilde {C_{t,f}} =0.675$ (see Appendix A). Unlike $\widetilde {C_T}$, the propulsive efficiency seems almost insensitive to slenderness, possibly due to the use of an optimal $St_A$ (Reference Dong, Mittal and NajjarDong et al., 2006; Reference Triantafyllou, Triantafyllou and GrosenbaughTriantafyllou et al., 1993), with a negligible decline observed for $AR$ between 2 and 4.
Impact of  $AR$ on the (a) thrust coefficient and (b) efficiency of the single flipper, undergoing heave-to-pitch coupling. Simulation points are characterised by $\circ$ while the best fit curve is depicted by a dashed line.

A qualitative comparison of the flow field around different  $AR$ values can be seen in figure 6, where the wake is visualised during the mid-upstroke, via the $Q$-criterion (Reference King, Kumar and GreenKing, Kumar, & Green, 2018). Animations of the vorticity fields for the single $AR=2$ and $AR=8$ test cases can be found in the on-line supplementary movies and are entitled singleAR2 and singleAR8, respectively. Due to the combined heave and pitch, all cases experience shallow, dynamic separations (Reference Ol, Bernal, Kang and ShyyOl, Bernal, Kang, & Shyy, 2010) throughout the flapping cycle. In other words, an initially small leading edge vortex (LEV) travels backwards while remaining attached to the foil and eventually sheds near the TE at full size (Reference Karbasian and EsfahaniKarbasian & Esfahani, 2017). Since the flow is 3-D, this shed vortex resembles a cylindrical tube, which appears almost undisturbed by the tip effects (red box in Figure 6d). Turbulent structures can be seen only downstream of the elliptical end, indicating local breakdown. This breakdown propagates towards the root covering a distance of $2.5\mathcal {C}$ which remains constant, regardless of the flipper $AR$ (Figures 6a–6c). Consequently, an increasing $AR$ allows the formation of elongated, undisturbed vortices leading to quasi-2-D wake.
Snapshots of normalised vorticity at  $t/T = 1$, where $T=1/f$, for single flappers of (a) $AR=2$, (b) $AR=4$, (c) $AR=6$ and (d) $AR=8$. Wake structures are visualised using iso-surfaces with $0.14\,\%$ of $Q_{max}$. The direction of the free-stream flow $U_{\infty }$ is from right to left. Areas of undisturbed 2-D wake are characterised by rectangles of red dashed lines.

To quantify the above observations, we examine changes in the strength of the downstream wake for varying levels of planform slenderness. This can be achieved by calculating the circulation ( $\varGamma$) of an LEV at a chosen instant of the flapping cycle, from a spanwise-averaged flow field. Variations along the span will be absorbed in this spanwise-averaging process leading to increased circulation for only the most coherent LEVs. Details of the procedure can be found in Appendix B. As shown in Figure 7(a), the LEV appears to become more compact for higher $AR$, causing $\varGamma$ to saturate at a constant value (see Figure 7b). This, in turn, leads to a constant velocity surplus across the flipper span, which is reflected in the similar behaviour of $\widetilde {C_{T,f}}$ in Figure 5.
(a) Spanwise-averaged vorticity for single flippers at  $t/T = 0.25$, where the LEV is enclosed by a black dashed box for $AR=2$. (b) Resultant circulation over kinematic viscosity ( $\nu$) of the LEV, calculated at this instance for all $AR$ values of this study.

Fundamentally, the development and propagation of the LEV is associated with the generation of circulatory (lift-based) forces (Reference Karbasian and EsfahaniKarbasian & Esfahani, 2017; Reference Muscutt, Weymouth and GanapathisubramaniMuscutt et al., 2017b). Therefore, similarities in the convergence of  $\widetilde {C_{T,f}}$ and $\varGamma$ towards high $AR$ imply that the main contributors of thrust under the chosen kinematics are lift-based. Indeed, heave-dominant motions have been mostly connected to circulatory forces while pitch-based kinematics are more affected by the added mass effect (Reference Floryan, Van Buren, Rowley and SmitsFloryan, Van Buren, Rowley, & Smits, 2017; Reference Van Buren, Floryan and SmitsVan Buren, Floryan, & Smits, 2019). The latter has been linked to the peaked lateral forces in oscillating fins of similar geometry, undergoing rolling or twisting at medium $Re_{\mathcal {C}}$ (Reference Zurman-Nasution, Ganapathisubramani and WeymouthZurman-Nasution et al., 2021a). Motivated by these findings, we plot the front foil's $C_{Y,max}$ for varying $AR$ in Figure 8(b). Once again, a sharp force increase is observed for $AR \leq 4$ followed by a slow converge towards high levels of slenderness. Consequently, we can argue that both the added mass and circulatory components experience a saturating effect towards high $AR$, while a more detailed separation of the two forces serves as a motivation for our future research.
(a) Temporal evolution of  $C_{T}$ and $C_{Y}$ for the front flipper at $AR=8$. (b) Development of the peak lateral force coefficient for the front flipper at varying $AR$ values. Simulation points are depicted as $\circ$ while the dashed lines represent the best fit curves.

Here, it is noteworthy to mention that similar  $\widetilde {C_T}\mathrm {-}AR$ relationships to those shown previously have been reported by Reference Shao, Pan, Deng and YuShao et al. (2010) despite the latter's different planform geometry (no wingtip) and significantly lower $Re_\mathcal {C}$. As both studies use heave-to-pitch coupling at $\psi =90^{\circ }$, a similar dynamic separation should be expected at least in two dimensions. Moreover, the chosen kinematics are essentially 2-D ( ${\delta y_f}/{\delta z} ={\delta y_b}/{\delta z}=0$), further reducing the importance of the spanwise geometry, although they still cause minor discrepancies between the two studies e.g. in $\widetilde {C_T}$. This, in turn, can support the predominance of medium slenderness ( $AR \sim [4, 6]$ using our paper's definition) caudal fins observed in cetaceans (Reference Ayancik, Fish and MooredAyancik et al., 2020; Reference Woodward, Winn and FishWoodward, Winn, & Fish, 2006), where the same kinematics are used. Indeed, fins of too low $AR$ would reduce the propulsive capacity of the species, yet much larger ones would be structurally demanding without offering any significant hydrodynamic advantage. It should be noted, however, that these animals demonstrate a plethora of wingtip geometries, combined with at least some level of flexibility (Reference Fish and RohrFish & Rohr, 1999). Thus, although a deeper analysis in the area is required, this topic is beyond the focus of the present work.
3.2 $AR$ effect on the tandem configuration

The addition of another upstream oscillating body alters the flow field and determines the performance of the downstream foil. This is made clear in Figure 9(a), where the rear flipper demonstrates significantly higher  $\widetilde {C_T}$ than the front, due to wake recapture. Once again, elongation has a greater impact on low $AR$ values but $\widetilde {C_T}$ appears to stabilise at a rate that is marginally slower than that of a single foil (or that of the front foil). This delayed convergence allows tandem systems to further improve their propulsive characteristics by reaching higher $AR$ values than the single test cases. However, the efficiency shows a negligible improvement while following the same trend as for the front foil (see Figure 9b).
Impact of  $AR$ in terms of (a) thrust coefficient and (b) efficiency on the fore and hind flippers of a tandem configuration undergoing heave-to-pitch coupling at $\phi =0^{\circ }$ and $\mathcal {S}_{\mathcal {C}}=2$. Simulation points are characterised by $\circ$ while the best fit curve is depicted by a dashed line.

To investigate the relative augmentation of thrust for the back foil in more detail, we examine  $\widetilde {C_{T,b}}^*$ (from (2.9a,b)) in Figure 10(a). It can be seen that there is a sharp increase in this ratio for $AR \sim [2, 4]$ (from $\widetilde {C_{T,b}}^* =1.3$ to $\widetilde {C_{T,b}}^* =1.45$) and the ratio seems to level out around $AR = 4$ (at $\widetilde {C_{T,b}}^* \sim 1.42$), which remains approximately constant beyond this aspect ratio. This shows that the rate of increase in thrust for the front and back foils essentially follow each other proportionately. Thus, there are no further benefits beyond $AR = 4$ in terms of relative augmentation, although there is still a benefit in the overall thrust produced by the pair of flippers.
Impact of  $AR$, in terms of relative (a) thrust and (b) efficiency augmentation, on the hind flipper of the tandem configuration, undergoing heave-to-pitch coupling at $\phi =0^{\circ }$ and $\mathcal {S}_{\mathcal {C}}=2$. Simulation points are depicted as $\circ$ while the dashed lines represent the best fit curves.

Interestingly, Figure 10(b) shows that the relative efficiency  ${\eta _b}^*$ (which is the ratio of efficiency of the back foil to the front foil) remains practically unchanged, showing minor growth of approximately $2.4\,\%$ throughout the entire range of $AR$ (see Figure 10b). This has been reported in recent studies of in-line foils (Reference Arranz, Flores and Garcia-VillalbaArranz et al., 2020; Reference Broering and LianBroering & Lian, 2015) for a range of harmonic motions and can be linked to the $St_A$ being already optimised for maximum efficiency on both flippers (similarly to the single foil cases). Yet, for a tandem set-up, the choice of a particular $\phi$ should be also taken into account. Indeed, flipper phasing has been shown to impact the hind foil's efficiency in various tandem foil concepts (Reference Arranz, Flores and Garcia-VillalbaArranz et al., 2020; Reference Broering and LianBroering & Lian, 2015; Reference Epps, Muscutt, Roesler, Weymouth and GanapathisubramaniEpps, Muscutt, Roesler, Weymouth, & Ganapathisubramani, 2017; Reference Muscutt, Weymouth and GanapathisubramaniMuscutt et al., 2017b; Reference Xu, Duan and XuXu, Duan, & Xu, 2017). Therefore, proper alignment of the aforementioned parameters might result in further gains within this area. However, this is beyond the scope of our current study.
The above observations can be linked to the flow field development between the two foils. This is evident in Figure 11, where the wakes of tandem arrangements for  $AR=2$ and $AR=8$ are compared (animations of these test cases can be found in the supplementary material). As mentioned previously, wingtip effects are proportionally higher in the wake of $AR=2$ compared to $AR=8$ (Figures 11a and 11b) resulting in the break-up of the foils’ shed vortices (Figures 11c and 11d). Specifically, the break-up of the LEV shed from the front foil means that the back foil does not experience a coherent wake across its span, which limits the benefits derived from wake recapture. Therefore, although a ${\sim }30\,\%$ increase in thrust can be noteworthy (Figure 10a for $AR=2$), it is still far away from the optimal cases reported here or found in the literature (Reference Akhtar, Mittal, Lauder and DruckerAkhtar, Mittal, Lauder, & Drucker, 2007; Reference Boschitsch, Dewey and SmitsBoschitsch, Dewey, & Smits, 2014; Reference Joshi and MysaJoshi & Mysa, 2021; Reference Lagopoulos, Weymouth and GanapathisubramaniLagopoulos, Weymouth, & Ganapathisubramani, 2020; Reference Muscutt, Dyke, Weymouth, Naish, Palmer and GanapathisubramaniMuscutt et al., 2017a, Reference Muscutt, Weymouth and Ganapathisubramani2017b; Reference Xu, Duan and XuXu et al., 2017). It should also be noted that a similar performance deterioration of in-line flapping due to 3-D associated effects has been witnessed within insect-like concepts, where lower $Re_{\mathcal {C}}$ and $\mathcal {S}_{\mathcal {C}}$ have been used (Reference Arranz, Flores and Garcia-VillalbaArranz et al., 2020). However, the propulsive enhancement derived from flipper elongation is not limitless. As the $AR$ increases past a certain degree (here $AR \geq 4$), the incoming wake takes a quasi-2-D form (except at around the tip) and the gains in $\widetilde {C_{T,b}}^*$ begin to stagnate since no additional benefit can be extracted. These findings can be further quantified by computing the spanwise-averaged circulation of the LEV for the back flipper at different aspect ratios. As shown in Figure 12(a), wake recapture allows the formation of a noticeably larger and stronger LEV compared with those shed by the front foil. However, its compactness/coherence is more dependent on flipper elongation, which alters the LEV circulation with $AR$ (see Figure 12b). Note that the circulation is computed based on a given box size and further information on the effect of box size on the computation of this circulation is in Appendix B. For low $AR$, the vortex appears to be diffused due to interactions between the main LEV and the tip. As $AR$ increases, the spanwise-averaged LEV becomes more coherent and its circulation rises (for a given box size). However, this value starts to level off at higher $AR$, following the same trend as the thrust coefficient. It can also be seen that the circulation values in the back foil are significantly higher than those of the front foil, in accordance with the thrust results.
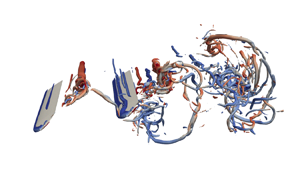
Snapshots of normalised vorticity at  $t/T=1$ for tandem configurations, where the flow structures are visualised by using iso-surfaces with $0.14\,\%$ of $Q_{max}$. A top view comparison shows that (a) the wake of $AR=2$ suffers significantly from vortex breakdown while (b) the wake of $AR=8$ remains mostly unaffected. This is more evident at a side view of (c) $AR=2$ and (d) $AR=8$ , although the aft foil (highlighted with a black border) manages to weave through the incoming vortex pair (red dashed boxes) of the front flipper, due to proper $\phi$ adjustment.

(a) Spanwise-averaged vorticity for back flippers of a tandem configuration, at  $t/T = 0.25$, where the LEV is enclosed in a black dashed box for $AR=2$. (b) Resultant $\varGamma / \nu$ calculated at this instance for the LEV of both front and back foils with $AR \sim [2,8]$.

Similarly to the findings of § 3.1, values of  $C_{Y,max}$ follow a saturating pattern with increasing flipper elongation (see Figure 13b). Furthermore, by comparing peaks $C_{Y,f}$ and $C_{Y,b}$, we notice relatively higher values for the latter. As mentioned previously, these loads are mostly associated with the added mass effects while circulatory forces are the major contributor in thrust generation. Therefore, we conclude that the combination of high $AR$ and wake recapture, experienced by the aft flipper, leads not only to the stabilisation but also the augmentation of both the circulatory and added mass forces.
(a) Temporal evolution of  $C_{Y}$ for both flippers at $AR=8$. (b) Comparison of the peak lateral force coefficients for both flippers at varying $AR$. Simulation points are depicted as $\circ$ while the dashed lines represent the best fit curves.

3.3 Application concerns
Recent advancements in AUV technology have revealed an abundance of novel configurations, for a wide range of civilian and military applications (Reference BudiyonoBudiyono, 2009; Reference Weymouth, Devereux, Copsey, Muscutt, Downes and GanapathisubramaniWeymouth et al., 2017). Undoubtedly, the effectiveness of these designs is heavily influenced by the specifications of the chosen propulsor. Having analysed the performance of such system, we now propose certain combinations that enable us to exploit the advantages of in-line flapping.
The previous sections revealed a lack of coherence in the shed vortices of  $AR \leq 4$. Another critical feature of low- $AR$ flippers is the tendency of consecutive LEVs to travel further apart from the centreline, leading to more divergent streams (Reference Dong, Mittal and NajjarDong et al., 2006; Reference Shao, Pan, Deng and YuShao et al., 2010). Indeed, Figure 14 shows that the distance of successive vortices, normal to the hind foil's chord, is larger at $AR=2$ compared to $AR=8$. This, combined with their aforementioned low cohesion, means that colliding with the back foil is both less probable and less critical for the latter's performance. Consequently, low $AR$ values permit a broader range of $\phi$, leading to a more flexible service envelope. In other words, changes of the kinematic parameters (e.g. in $St_A$) that would result in a less optimal phasing, will not weaken the wake recapture significantly.
Spanwise-averaged vorticity of the tandem configuration at  $t/T = 1$, for (a) $AR=2$ and (b) $AR=8$. Black dashed boxes mark the boundaries of consecutive shed vortices, while the distance between them is highlighted by black arrows. Notice how this is reduced as we move to higher $AR$ (solid versus dashed arrows).

High- $AR$ flippers, however, would be preferable for steady cruising, namely constant speed at undisturbed kinematic conditions. This is probably supported by natural evolution examples, as fossils of the long-distance swimming $plesiosauromorphs$ indicate $AR \geq 8$ (Reference O'KeefeO'Keefe, 2001). Having said that, tandem arrangements of $AR \sim [4\unicode{x2013}6]$ may be a prudent compromise between augmentation benefits and mechanical behaviour, since the relative thrust enhancement has reached a saturated state while the size is still small enough to withstand the large unsteady loads.
Finally, a set of mixed  $AR$ values can be a further improvement in cases where LEV breakdown has not developed significantly by the time it reaches the hind foil (e.g. low $\mathcal {S}_\mathcal {C}$ and average/high flipper slenderness). More specifically, we speculate that a shorter rear flipper (lower $AR$) would be able to avoid the disturbances of the front wingtip, functioning completely within the quasi-2-D stream. In fact, this strategy can lead to an increase of $\widetilde {C_{T,b}}$ by up to $8\,\%$ in dragonfly-inspired concepts (Reference Jurado, Arranz, Flores and García-VillalbaJurado et al., 2022) and it was likely used by certain plesiosaur species (Reference O'KeefeO'Keefe, 2001).
4. Conclusions and future work
The propulsive characteristics of single and tandem flapping foils were examined numerically under a heave-to-pitch coupling motion, for seven flipper sets of  $AR \sim [2\unicode{x2013}8]$ of rectangular flippers with elliptical tip at $Re_{\mathcal {C}}=8500$. Each set had the same $AR$ and the test was conducted for the fixed combination $St_A =0.4 - \mathcal {S}_C=2$ at $\phi =0^{\circ }$ which was found to optimise wake recapture in a 2-D domain.
Our analysis shows that flipper elongation has a positive impact on the coefficients of phase-averaged thrust and peak lateral force for both single and tandem configurations at low  $AR$ values but this effect subsides as we move towards higher $AR$. More specifically, an increasing $AR$ benefits the wake recapture of the tandem configuration, which results in a slower convergence of the back flipper's hydrodynamic loads. However, the efficiency remains virtually unaffected due to the foils’ optimal kinematics and the thrust-targeting $\phi$.
Physically, the behaviour of thrust is related to the enhanced strength and cohesion of the vortex pair shed at each cycle. In particular, snapshots of instantaneous vorticity show that 3-D effects have a localised behaviour around the wing tip of the front foil which remains constant throughout the range of  $AR$ values. This affects its spanwise-averaged LEV circulation, which increases with slenderness but eventually saturates, so that the growth of $\widetilde {C_T,f}$ diminishes towards 2-D concepts ( $AR \sim \infty$). However, low $AR$ values lead to weaker LEVs which move away from the centerline and decay faster in the streamwise direction. The above traits can additionally affect the hind flipper as a stronger incoming wake will induce higher acceleration of the surrounding flow, while a wider and weaker vortex pair can enable a greater range of $\phi$ since weaving within the vortices becomes easier. Consequently, wake recapture leads to an augmented $\varGamma$ for the LEV of the rear foil, but proper phasing becomes more challenging as we move towards more elongated flippers. Thus, the circulation in that LEV experiences a comparatively sharper increase and a slower convergence with $AR$, following the pattern of $\widetilde {C_T}$ results, probably due to the prevalence of circulatory forces in heave-dominant motions. As the peak lateral forces show a similar trend, it is possible that the added mass-induced force components are affected in an analogous manner.
This study provides evidence of the  $AR$ impact on wake recapture under kinematics commonly used in the natural world. In addition, our findings provide hints for the design of more versatile bio-inspired systems by revealing the hydrodynamic benefits and limitations of the single and tandem flipper arrangements. This is based on the singular effect of aspect ratio addressed here for a simple spanwise geometry. However, natural systems can achieve a wide range of planforms for the same aspect ratio, while it is possible to expand this design range through advanced engineering tools used in modern industry. Therefore, we believe that the effects of planform shape can be further explored at a given aspect ratio that is optimised for a particular tandem foil concept.
Appendix A. Phase optimisation
To set our reference test case in terms of maximum thrust augmentation, a preliminary study was conducted in two dimensions, evaluating the phasing  $\phi$ of the tandem configuration for the chosen spacing, kinematic parameters and ambient conditions. Tandem foil simulations were performed, starting from $\phi =0^{\circ }$ and progressing at increments of ${\rm \Delta} \phi =45^{\circ }$ until $\phi =315^{\circ }$, while the single foil was found to produce $\widetilde {C_{t,f}} \sim 0.675$. Figure 15 shows that the modification of the hind foil's thrust, due to interaction with the incoming wake, follows a cosine-like curve with respect to the phase lag, as shown in similar studies (Reference Muscutt, Dyke, Weymouth, Naish, Palmer and GanapathisubramaniMuscutt et al., 2017a). Clearly, optimal $C^*_{T,b}$ is found for $\phi =0^{\circ }$ and therefore it is chosen for all the simulations presented in the current study.
Impact of  $\phi$ on the 2-D wake recapture, expressed via the relative thrust augmentation of the two foils. Here, $C^*_{T,f} =1$ since the front foil experiences no flow field changes, which coincides with $\widetilde {C_{t,f}} \sim 0.675$. Simulation points are depicted as $\circ$ while the dashed lines represent the best fit curves.

Appendix B. Sensitivity analysis of the LEV circulation
In this study, circulation is calculated via the integration of vorticity over a rectangular cell (see Figure 16a). As we focus on the LEV analysis, the size and location of this area should be optimised to enclose the exact size of the vortex while minimising ambient interference. Therefore, after visually choosing an initial location, we gradually increase the area of integration until the overall circulation begins to drop (see Figure 16b). Having finalised the size of the box, we re-evaluate its location by moving its centre towards the  $y$ and $x$ axis until a position of maximum circulation is identified. Due to the shape/size of the LEV for various $AR$ values, this procedure was conducted individually for all single and tandem test cases such that the ‘highest’ circulation is obtained for each case.
Sensitivity analysis of the integration area, used to calculate the circulation of the front foil's LEV. Here, the vorticity is first spanwise averaged at  $t/T= 0.25$, (a) for $AR=2$. (b) It is then integrated within boxes of increasing size until circulation values begin to drop.

Acknowledgements
We would like to thank A.N. Zurman-Nasution and M. Lauber for our fruitful discussions throughout the duration of this project. Furthermore, we would like to thank the IRIDIS High Performance Computing Facility, with its associated support services at the University of Southampton, for their aid towards the completion of our study.
Funding statement
This research was supported financially by the Office of Naval Research award N62909-18-1-2091 and the Engineering and Physical Sciences Research Council doctoral training award (1789955).
Declaration of interests
The authors declare no conflict of interest.
Author contributions
Conceptualisation: N.S.L, G.W. and B.G. Investigation: N.S.L. Writing original draft: N.S.L. Writing review and editing: G.W. and B.G.
Data availability statement
All data supporting this study, including useful supplementary material, is openly available via the University of Southampton repository at https://doi.org/10.5258/SOTON/D2467.
Ethical standards
The research meets all ethical guidelines, including adherence to the legal requirements of the study country.


 Open access