
Introduction
Biomedical research involving epidemiology, social determinants of health (SDOH) and other place-based topics often require the use of patient addresses for inference and analysis. A high level of geographic precision is important for many studies. Summarizing patient data to common, low-resolution geographies such as counties and ZIP codes can obscure important patterns in health and exposure [Reference Krieger, Chen, Waterman, Soobader, Subramanian and Carson1]. Access to high-resolution geographic units including residential addresses and census tracts allows researchers to link their data to public data sets including the US Census data, US Department of Agriculture food desert status, deprivation indices, the Child Opportunity Index [2], and other information that is useful for biomedical research [Reference Krager, Puls and Bettenhausen3,Reference Kane, Wang and Gerkovich4]. Other geospatial work can contribute to understanding issues related to access to care, including drive time [Reference Leiser, Anderson, Martin, Hanson and O’Neil5]. These capabilities have also been applied to understanding social determinants of health influencing missed appointments [Reference Williamson, Bon Nieves, Tracy, Raje and Arganbright6]. This work is critical for tracking infectious diseases, evaluating health access, and characterizing regional variations in healthcare resources or healthcare utilization [Reference Monlezun, Samura, Patel, Thannoun and Balan7,Reference Mukherjee, Idigo and Ye8].
Patient address is one of the 18 fields identified by the Health Insurance and Portability Accountability Act (HIPAA) as requiring stringent protection. Researchers performing work that requires geographically precise information must either utilize a locally installed commercial package [Reference Morales-Alemán, Hu, Ferreti and Yerby9], install an open-source application such as the Decentralized Geomarker Assessment for Multi-Site Studies (DeGAUSS) application, that requires command line skills and familiarity with software containerization [Reference Brokamp, Wolfe, Lingren, Harley and Ryan10,Reference Rasnick, Ryan and Blossom11], or utilize a hybrid approach with a cloud-provider under a business associates agreement (BAA) [Reference Rivera and Hoffman12]. While commercial packages provide many useful features, they may be cost prohibitive. Command line applications are powerful, but can be a deterrent to users who are not comfortable with the technology and may limit adoption [Reference Joppich and Zimmer13].
The Translational Science principles of producing generalizable solutions and enhancing the efficiency and speed of research require technologies that are user-friendly and provide value to research [Reference Faupel-Badger, Vogel, Austin and Rutter14]. In support of these goals, we describe a project to provide users with a self-contained geomarker portal wrapper for DeGAUSS in order to offer simple access to output that includes geomarker values, the Community Material Deprivation Index, drive distance and census block [Reference Trinidad, Brokamp and Mor Huertas15]. The wrapper includes a graphical front-end interface and removes the requirement to use the command line interface. We also provide an application programming interface (API) to enable high volume geocoding transactions.
Materials and methods
We developed a platform-agnostic web portal with APIs and business logic to wrap complex command-line prompts associated with the DeGAUSS container images available through the DeGAUSS website [16]. The current images are Geocode (latitude, longitude), Drive Time, Deprivation Index and Census Block Group. After authenticating, users are prompted to select “single address” or “multi-address.” Selecting “single address” generates a prompt with results returned in real time. Selecting “multi-address” prompts the user to upload an input file, as described in the user guide. The format of this input file varies depending on the type(s) of output the user intends to process. For example, Unique Id and Address fields are required for geocoding, while geocoded results are required for other output types. After the valid file upload users choose which type(s) of output they need and then submit the file for asynchronous processing. When Drive Time is selected, the user is prompted to select the destination if their organization has multiple sites. When Census Block Group is selected, a dropdown menu is presented to select which US Census year should be used. When the run is complete, the user receives a notification indicating that they may download the output file. The file provides the output specific to the DeGAUSS services selected.
The architecture of the system is provided in Figure 1. A Linux-based, cross-platform web portal was developed as a standalone container using C# and R. The portal leverages the DeGAUSS container image [Reference Brokamp, Wolfe, Lingren, Harley and Ryan10]. In the initial release we include images likely to be useful for clinical research. The system is delivered as a collection of Docker images orchestrated by either Docker Compose or Kubernetes [Reference Mandl17]. The application requires a minimum of 8 CPU cores and 32 GB RAM. Specific resources needed will vary based on workload and deployment strategy.
General architecture of the self-service GeoMarker functionality. Users interact with a graphical user interface (GUI) delivered by a containerized web server, or with the application programming interface (API) provided by the same server. Operations through both the GUI and API are validated and forwarded to an internal swarm of worker containers that host a subset of the aggregate API along with the underlying DeGAUSS programs that are invoked by a request. Responses with annotated address content are yielded to the consumer through the web portal and aggregate API gateway.

The system is associated with the authentication system used by the installing organization to offer auditing required for HIPAA compliance. The installing organization can use one of many standard Single-Sign On (SSO) frameworks. Children’s Mercy uses Entra ID (formerly Active Directory (AD)) SSO (Microsoft, Redmond WA), while the University of Kansas uses the Central Authentication Service (CAS). The system is also compatible with Google Identity and Amazon Web Services (AWS) Identity and Access Management. The installing organization can also enroll and authenticate users using a local system with OpenIddict [18].
To demonstrate the system using examples that are not associated with protected health information, the system was tested with a list of addresses representing 222 retail pharmacies in the Kansas City metropolitan area.
In addition to a web interface, we developed an API for automated access. This allows users to submit a file of one or more addresses either synchronously or asynchronously to an endpoint based on the service. If the request is synchronous, they will receive the results in near-real-time, but this is currently limited to 300 addresses. For asynchronous API calls, three endpoints are utilized – one for request submission, another to monitor the status, and a third endpoint is to retrieve the results.
The output files are purged after two weeks, a default setting that each site can configure. To evaluate the system at multiple locations, we first deployed at Children’s Mercy Hospital Kansas City (CMKC), then to the University of Kansas Medical Center (KUMC) and are currently installing at the Children’s Hospital of Cincinnati.
At Children’s Mercy, a training module was developed in the Cornerstone Learning Management System (Santa Monica, CA) to orient users to the system and raise awareness of data handling considerations. Only users who completed this training were provided with accounts. We used REDCap to survey users from CMKC and KUMC, inquiring about prior experience with DeGAUSS, perceived ease of use for DeGAUSS users, ease of use of the self-service application, impact of the self-service Geomarker application on their research, selection of services utilized and category of usage from these options: health equity, population health, epidemiology, social determinants of health, health economics, organizational operations [Reference Harris19]. The survey respondents also had free text prompts seeking details about their analytical work and another seeking comments about their experience with the self-service geomarker.
Results
The front end of the application is shown in Figure 2a. The application prompts the user to select a file with a single address or batch of addresses. There are 24 individual users across 2 sites, as shown in Table 1. Users are prompted to select the annotations they wish to receive, including Geocode (address coordinates), Drive Time, Deprivation Index and Census Block Group and tract identifiers. After submitting their request, the system processes the input file and sends an email notification when the process is complete.
Front End at Children’s Mercy Kansas City. The GeoMarker web portal provides a simple form interface to select one or more DeGAUSS processes to run on a file uploaded to the web server. A section labeled ‘History’ displays a table of processing results for the current user based on their last two weeks of submissions and results.

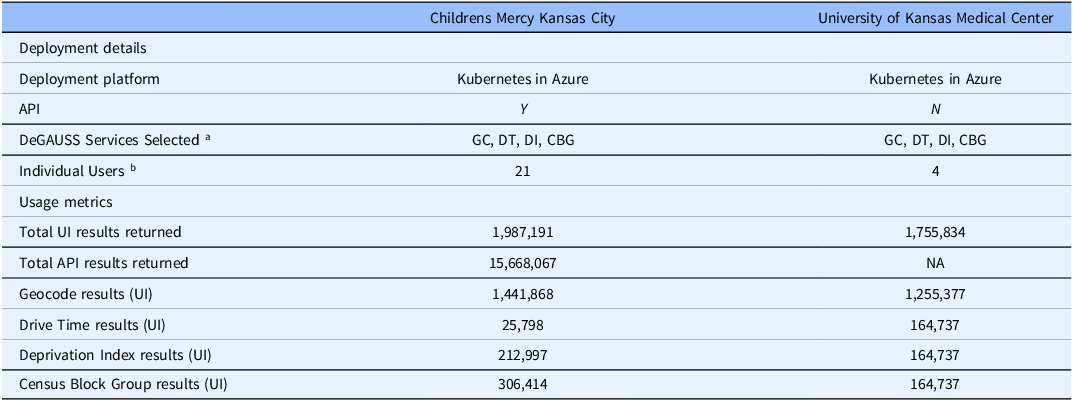
Deployment details and usage metrics

Note: aGC = Geocode, DT = Drive Time, DI = Deprivation Index, CBG = Census Block Group.
b Excluding developer accounts and API accounts.
The system logs the number of addresses processed and provides an administrative statistics and request audit dashboard. Figure 2b shows the dashboard for the test runs by the corresponding author. The dashboard is only available to authorized users, as determined by the site administrator. The dashboard allows users to view the number of records processed in total, by user, API consumer and by service utilized. The dashboard also indicates the number of failed records (data not shown). The email notification received by a user is shown in Figure 3a and the partial output from the pharmacy test is shown in Figure 3b. The output is consistent with the command line DeGAUSS output and includes metrics to enable the user to filter by score and precision of the geocoding.
An administrative audit page displays a filterable view with records of requests processed by the system. Upload date, user id, number of addresses, request type, and process time are all tracked to audit usage of the system.

Example email notification to user when asynchronous process is completed.

Partial output of testing using list of retail pharmacies in Kansas City metropolitan area.

The system was installed at Children’s Mercy Kansas City (CMKC) and evaluated by internal users. Following that testing period, the application was delivered to the University of Kansas Medical Center for external testing. Deployment details and usage metrics as of August 8, 2025, are provided Table 1. Metrics for developers and testers were excluded. Both sites used Microsoft Azure to deploy the functionality. CMKC used Kubernetes while KUMC used a virtual machine (VM). At the time of submission, only CMKC has used the API.
The API usage rapidly gained heavy use at CMKC, with 15,668,067 API results returned at the time this paper was submitted. An institutional health equity initiative uses the API daily for large batches of addresses. The API calls are triggered by any change to a patient record, generating redundant output while ensuring continued accuracy of patient geolocation. KUMC activated the system on February 5, 2024. Research queries at KUMC were primarily generated in support of cancer research, with wider availability planned.
By Aug 8, 2025, a total of 19,411,092 results had been returned to 24 users from two organizations through the UI and API modalities. Geocode was the most actively used service, followed by Census Block Group and Deprivation Index. We did not evaluate the patterns of individual users.
We sent a quality improvement survey to 16 users at Children’s Mercy (12) and KUMC (4) about their experience with the system. Ten users completed the survey (63% response rate). Two of the 10 respondents had previously used the command line version of DeGAUSS. One of these users indicated that the command line was very easy to use while the other indicated that it was very difficult. Both experienced DeGAUSS users indicated that the self-service application was “very easy” to use. Among all survey respondents, 9 (90%) found the self-service application “very easy” or “easy” to use, while one respondent found it “straightforward” (Figure 4a). Most respondents (80%) indicated that the application had a “very positive” impact on their work, with 10% choosing “Somewhat positive” and 10% choosing “no impact” (Figure 4b).
Number of survey respondents selecting ease of use categories.

Number of survey respondents selecting categories in response to the question, “Please rate the impact that the Geomarker application had on your research.”

All users who responded to the survey indicated that they used the Geocode feature and 90% used Census Block Group service. The Deprivation Index was used by 60% of respondents and Drive Time by 30%. The most prevalent applications were for population health research and social determinants of health research (both 80%), followed by health equity (70%). Thirty percent of users indicated that they used the system for “organizational operations – not research.” Only 20% selected “Health economics.” None of the respondents provided details about the specific projects. Four users responded to the “Please share comments about your experience with the Self-Service Geomarker” prompt. Among the responses were these comments, “The ability to upload a file for batched processing is a strength of this tool. The required structure of the upload file was problematic initially, specifically the naming convention for the column headers. Once the expected data structure was understood, it was an easy process” and “The process is much more efficient and resilient than other solutions that were in place and led to huge time savings over what we anticipated we would need to develop.” Other responses included identifying characteristics and are not provided.
Discussion
Place-based information is an essential factor in recognizing extrinsic factors that influence health and has been proposed as a “sixth vital sign” [Reference Bazemore, Cottrell and Gold20]. Geocoding is an important initial step in understanding communities and health, yet electronic health record systems do not routinely or natively geocode patient addresses [Reference Tyris, Dwyer, Parikh, Gourishankar and Patel21]. Performing research related to social determinants of health (SDOH), variation in access to care, epidemiology and other topics requiring geographic precision has historically required researchers to use command-line interfaces or complex and often costly or non-reproducible commercial software packages. While common cloud platforms offer geocoding capabilities, many organizations do not have a BAA in place with these platform providers, a requirement for sending PHI. Commercial GIS applications can be costly and can have a steep learning curve. We describe a development initiative with the goal of providing a user-friendly, HIPAA-compliant self-service portal for geographic annotation of files including one or more addresses. The system gained widespread use throughout Children’s Mercy Kansas City and is actively utilized at the University of Kansas Medical Center.
Implementing the self-service geomarker requires capabilities including an enterprise platform to host software applications (on-prem web server or cloud servers), administrative approvals to manage the platform, and access to data storage services. A mechanism for secure network access to the application should also be in place to ensure that native security features perform as expected. Deploying the system as a containerized image enabled it to be installed in a variety of environments, including Microsoft Azure, a local server and a Virtual Machine using Docker Compose. This design positions the application for installation on other platforms that support virtualization, including Amazon Web Services (AWS), the Google Cloud Platform or DigitalOcean. While KUMC initially installed the self-service geomarker in a VM, they noticed that the demand surpassed the capacity of a single VM and moved the system to Azure Kubernetes. While others have also containerized DeGAUSS [Reference Schappe, McElroy, Ogundolie, Matsouaka, Rogers and Bhavsar22], we focused on a user experience that is accessible to users who prefer a front end application and to generating results at scale through an API.
Geospatial information must be managed in a manner that preserves and protects privacy [Reference Haley, Matthews and Cooper23]. In addition to providing a user-friendly and efficient means of geocoding for a wide range of users, when properly installed and managed, Geomarker can be used with protected health information (PHI) and can enable HIPAA compliance. The system is designed with the recognition, however, that users must have already gained appropriate access to PHI (patient or research subject addresses), whether through clinical operations or institutional review board approved research. Likewise, the users are expected to handle the output with full security considerations. A limited survey of early users indicated that they are satisfied with the application, future work could include a more comprehensive evaluation.
This work has several known limitations. Input addresses that are poorly formatted, inaccurate or incomplete will not be reconciled by the system. However, the application does return such address with missing geocodes, allowing for iterative address cleaning by the user and processing by Geomarker. Future versions could implement natural language processing of individual address components to better deal with messy, real-world addresses [Reference Manning, Duan and Taylor24]. The system requires that the input data adhere to the format required by DeGAUSS and does not allow for manual input of multiple addresses. However, single addresses can be run at the prompt, with the output as JSON formatted text.
A current limitation of the API is that requests seeking output from more than one service, for example Deprivation Index and Geocode, can only be run in synchronous mode, with no more than 300 addresses per request in order to prevent the system from timing out. The asynchronous mode for a single service does not limit the number of records. The geomarker functionality does not offer a visual presentation of the output, for example using a map. A separate initiative addresses this need.
Conclusion
The HIPAA-compliant, Self-Service Geomarker functionality builds on the strong success of DeGAUSS and offers a user-friendly framework to expand the use of geocoding. The application can be accessed by an API, enabling automated access for regular processes that benefit from geocoded output. Users provided insights into the features that are most utilized and shared comments highlighting the benefits of the application.
The application is available through a GPL 3 license and may be accessed at https://github.com/ChildrensMercyResearchInstitute/geomarker.
Acknowledgments
We appreciate the assistance of Hope Davis, Luna Varela, Sadie Easter, and Jenny Wilkerson.
Author contributions
Harpreet Gill: Conceptualization, Formal analysis, Project administration, Software, Supervision, Writing-original draft, Writing-review & editing; Kevin Power: Conceptualization, Formal analysis, Investigation, Project administration, Software, Supervision, Visualization, Writing-original draft, Writing-review & editing; Catherine Jackson: Project administration, Supervision, Writing-original draft; Jared Johnson: Formal analysis, Methodology, Software, Visualization, Writing-original draft, Writing-review & editing; Matthew Llewelyn: Investigation, Software, Writing-original draft, Writing-review & editing; Kushal Vallambhatla: Data curation, Investigation, Methodology, Software, Visualization, Writing-original draft, Writing-review & editing; Natalie Kane: Investigation, Methodology, Writing-original draft; Jeffrey Thompson: Investigation, Project administration, Supervision, Writing-original draft, Writing-review & editing; Kelechi Anuforo: Data curation, Formal analysis, Investigation, Writing-original draft; Cole Brokamp: Methodology, Writing-original draft, Writing-review & editing; Mark Hoffman: Conceptualization, Formal analysis, Funding acquisition, Investigation, Methodology, Project administration, Supervision, Writing-original draft, Writing-review & editing.
Funding statement
This work was funded by NIH 5UL1TR002366.
Competing interests
There are no conflicts of interest to report.


 Open access