


Introduction
As much as one-third of premature deaths seem to be attributable to socioeconomic disadvantage, as data from England show (Lewer et al., Reference Lewer, Jayatunga, Aldridge, Edge, Marmot, Story and Hayward2020). Indeed, the role of lacking socioeconomic resources in ill health is widely acknowledged. The construct of socioeconomic status (SES), defined by education, income and/or occupation, has been commonly used to this end. SES has shown a robust association with mental (e.g. Reiss et al., Reference Reiss, Meyrose, Otto, Lampert, Klasen and Ravens-Sieberer2019), physical (e.g. Kivimäki et al., Reference Kivimäki, Batty, Pentti, Shipley, Sipilä, Nyberg, Suominen, Oksanen, Stenholm, Virtanen, Marmot, Singh-Manoux, Brunner, Lindbohm, Ferrie and Vahtera2020) and cognitive health (e.g. Lyu and Burr, Reference Lyu and Burr2016; Marden et al., Reference Marden, Tchetgen Tchetgen, Kawachi and Glymour2017).
The construct of SES has been criticised as too restrictive to reflect the complex reality of deprivation (Salmond et al., Reference Salmond, Crampton, King and Waldegrave2006; Czajka and Denmead, Reference Czajka and Denmead2008). As a result, studies using multi-domain individual social deprivation indicators have emerged (e.g. Chung et al., Reference Chung, Chung, Gordon, Wong, Chan, Lau, Tang and Wong2018; Dunlop et al., Reference Dunlop, Rakofsky, Mischoulon, Mayberg, Kinkead, Nierenberg, Ziegler, Fava and Rapaport2022). Multi-domain assessments on the area level – such as the Townsend Deprivation Index (Townsend et al., Reference Townsend, Phillimore and Beattie1988) or the Area Deprivation Index (Kind et al., Reference Kind, Jencks, Brock, Yu, Bartels, Ehlenbach, Greenberg and Smith2014) – reflect the degree to which an individual possesses inadequate resources relative to the societal standard. This is particularly relevant to studying older adults, who rely increasingly on resources other than income, such as wealth and health care (O'Reilly, Reference O'Reilly2002; Galobardes et al., Reference Galobardes, Shaw, Lawlor, Lynch and Smith2006; Steptoe and Zaninotto, Reference Steptoe and Zaninotto2020).
Multi-domain individual social deprivation indicators have demonstrated an association of deprivation with mental and physical health (e.g. Saito et al., Reference Saito, Kondo, Kondo, Abe, Ojima and Suzuki2014; Pförtner and Elgar, Reference Pförtner and Elgar2016; Chung et al., Reference Chung, Chung, Gordon, Wong, Chan, Lau, Tang and Wong2018). However, cognitive outcomes have received less attention. Therefore, our group has recently investigated the association between social deprivation and cognitive function in dementia-free older adults. To this end, we constructed a measure of social deprivation, the Social Deprivation Index (SoDep Index), a brief yet comprehensive index measure of five domains (years of education, income, wealth, health insurance status, lifetime job stability). SoDep Index scores have been found to be related to standardised measurements of cognitive status and decline in 11 101 respondents in the US Health and Retirement Study (HRS; Hofbauer and Rodriguez, Reference Hofbauer and Rodriguez2021a) as well as 51 630 respondents of the Survey of Health and Retirement in Europe (SHARE; Hofbauer and Rodriguez, Reference Hofbauer and Rodriguez2021b).
We expect that this association of individual social deprivation with cognitive function in dementia-free older adults may extend to an association with dementia risk. While this has not been investigated directly, indication is given by previous research linking aspects of social deprivation, such as low wealth (Cadar et al., Reference Cadar, Lassale, Davies, Llewellyn, Batty and Steptoe2018) and low education (Xu et al., Reference Xu, Tan, Wang, Tan, Tan, Li, Zhao and Yu2016), to dementia risk. Such an association may be explained by the social causation hypothesis. It postulates that individuals with high social deprivation are more likely to experience chronic stressors, such as financial worry and social defeat (Almeida et al., Reference Almeida, Neupert, Banks and Serido2005; Hudson, Reference Hudson2005). Evidence from rodent models suggests that chronic stressors induce harmful physiological processes, such as chronic inflammation, including neuroinflammation (Calcia et al., Reference Calcia, Bonsall, Bloomfield, Selvaraj, Barichello and Howes2016). Observational studies in humans appear to support this, with chronic stress showing an association with neuropathology and -degeneration (Peña-Bautista et al., Reference Peña-Bautista, Casas-Fernández, Vento, Baquero and Cháfer-Pericás2020).
If chronic stressors are involved in a pathway linking social deprivation and dementia risk, this is likely to be reflected in an indirect effect of social deprivation on dementia risk via depression. This is because social deprivation has repeatedly been shown to be associated with depression (e.g. Fernández-Niño et al., Reference Fernández-Niño, Manrique-Espinoza, Bojorquez-Chapela and Salinas-Rodríguez2014; Wickham et al., Reference Wickham, Taylor, Shevlin and Bentall2014; Cohen-Cline et al., Reference Cohen-Cline, Beresford, Barrington, Matsueda, Wakefield and Duncan2018; Ye et al., Reference Ye, Wen, Sun, Chu, Li, Cheng, Cheng, Liu, Zhang, Ma, Qi, Liang, Kafle, Jia, Wu, Wang, Wang, Ning, Sun and Zhang2021), and the association is mediated by chronic stressors (Wickham et al., Reference Wickham, Taylor, Shevlin and Bentall2014). Depression, in turn, is related to poor cognition (Shaw et al., Reference Shaw, Jana and Kundu2022). It is associated with pathological brain changes (Geerlings et al., Reference Geerlings, Sigurdsson, Eiriksdottir, Garcia, Harris, Sigurdsson, Gudnason and Launer2013; Belzung et al., Reference Belzung, Willner and Philippot2015) and with dementia risk (Livingston et al., Reference Livingston, Huntley, Sommerlad, Ames, Ballard, Banerjee, Brayne, Burns, Cohen-Mansfield, Cooper, Costafreda, Dias, Fox, Gitlin, Howard, Kales, Kivimäki, Larson, Ogunniyi, Orgeta, Ritchie, Rockwood, Sampson, Samus, Schneider, Selbæk, Teri and Mukadam2020). Indeed, recently it has been found that depression partially mediates the relationship between area social deprivation and cognition (Shaw et al., Reference Shaw, Jana and Kundu2022). However, whether this extends to dementia risk remains to be shown. Further, as the previous finding was made on an area level, it would be informative to see whether this can be replicated using a comprehensive individual-level social deprivation indicator.
Depression might be particularly detrimental in high social deprivation which could account for a higher dementia risk. Depression has been found to be more persistent in those experiencing socioeconomic disadvantage (Finegan et al., Reference Finegan, Firth, Wojnarowski and Delgadillo2018) and those living in deprived areas (Finegan et al., Reference Finegan, Firth and Delgadillo2020), compared to those who experience less disadvantage. Factors such as the demoralising effect of living a deprived environment, lack of self-esteem due to upward social comparison, and poor access to health-enhancing goods may be creating a downward spiral (Finegan et al., Reference Finegan, Firth and Delgadillo2020). This downward spiral may further exacerbate depression-related brain changes and ultimately result in less available resources when it comes to resisting dementia.
Aim
We aim to establish whether social deprivation is a risk factor for dementia, expecting higher social deprivation to be associated with a higher risk of (self-reported) dementia. Further, we inspected the role of depression in the association between social deprivation and dementia risk. We hypothesise that the association between depression and dementia risk will vary with social deprivation status, with a stronger negative effect in those more deprived.
Method
Sample
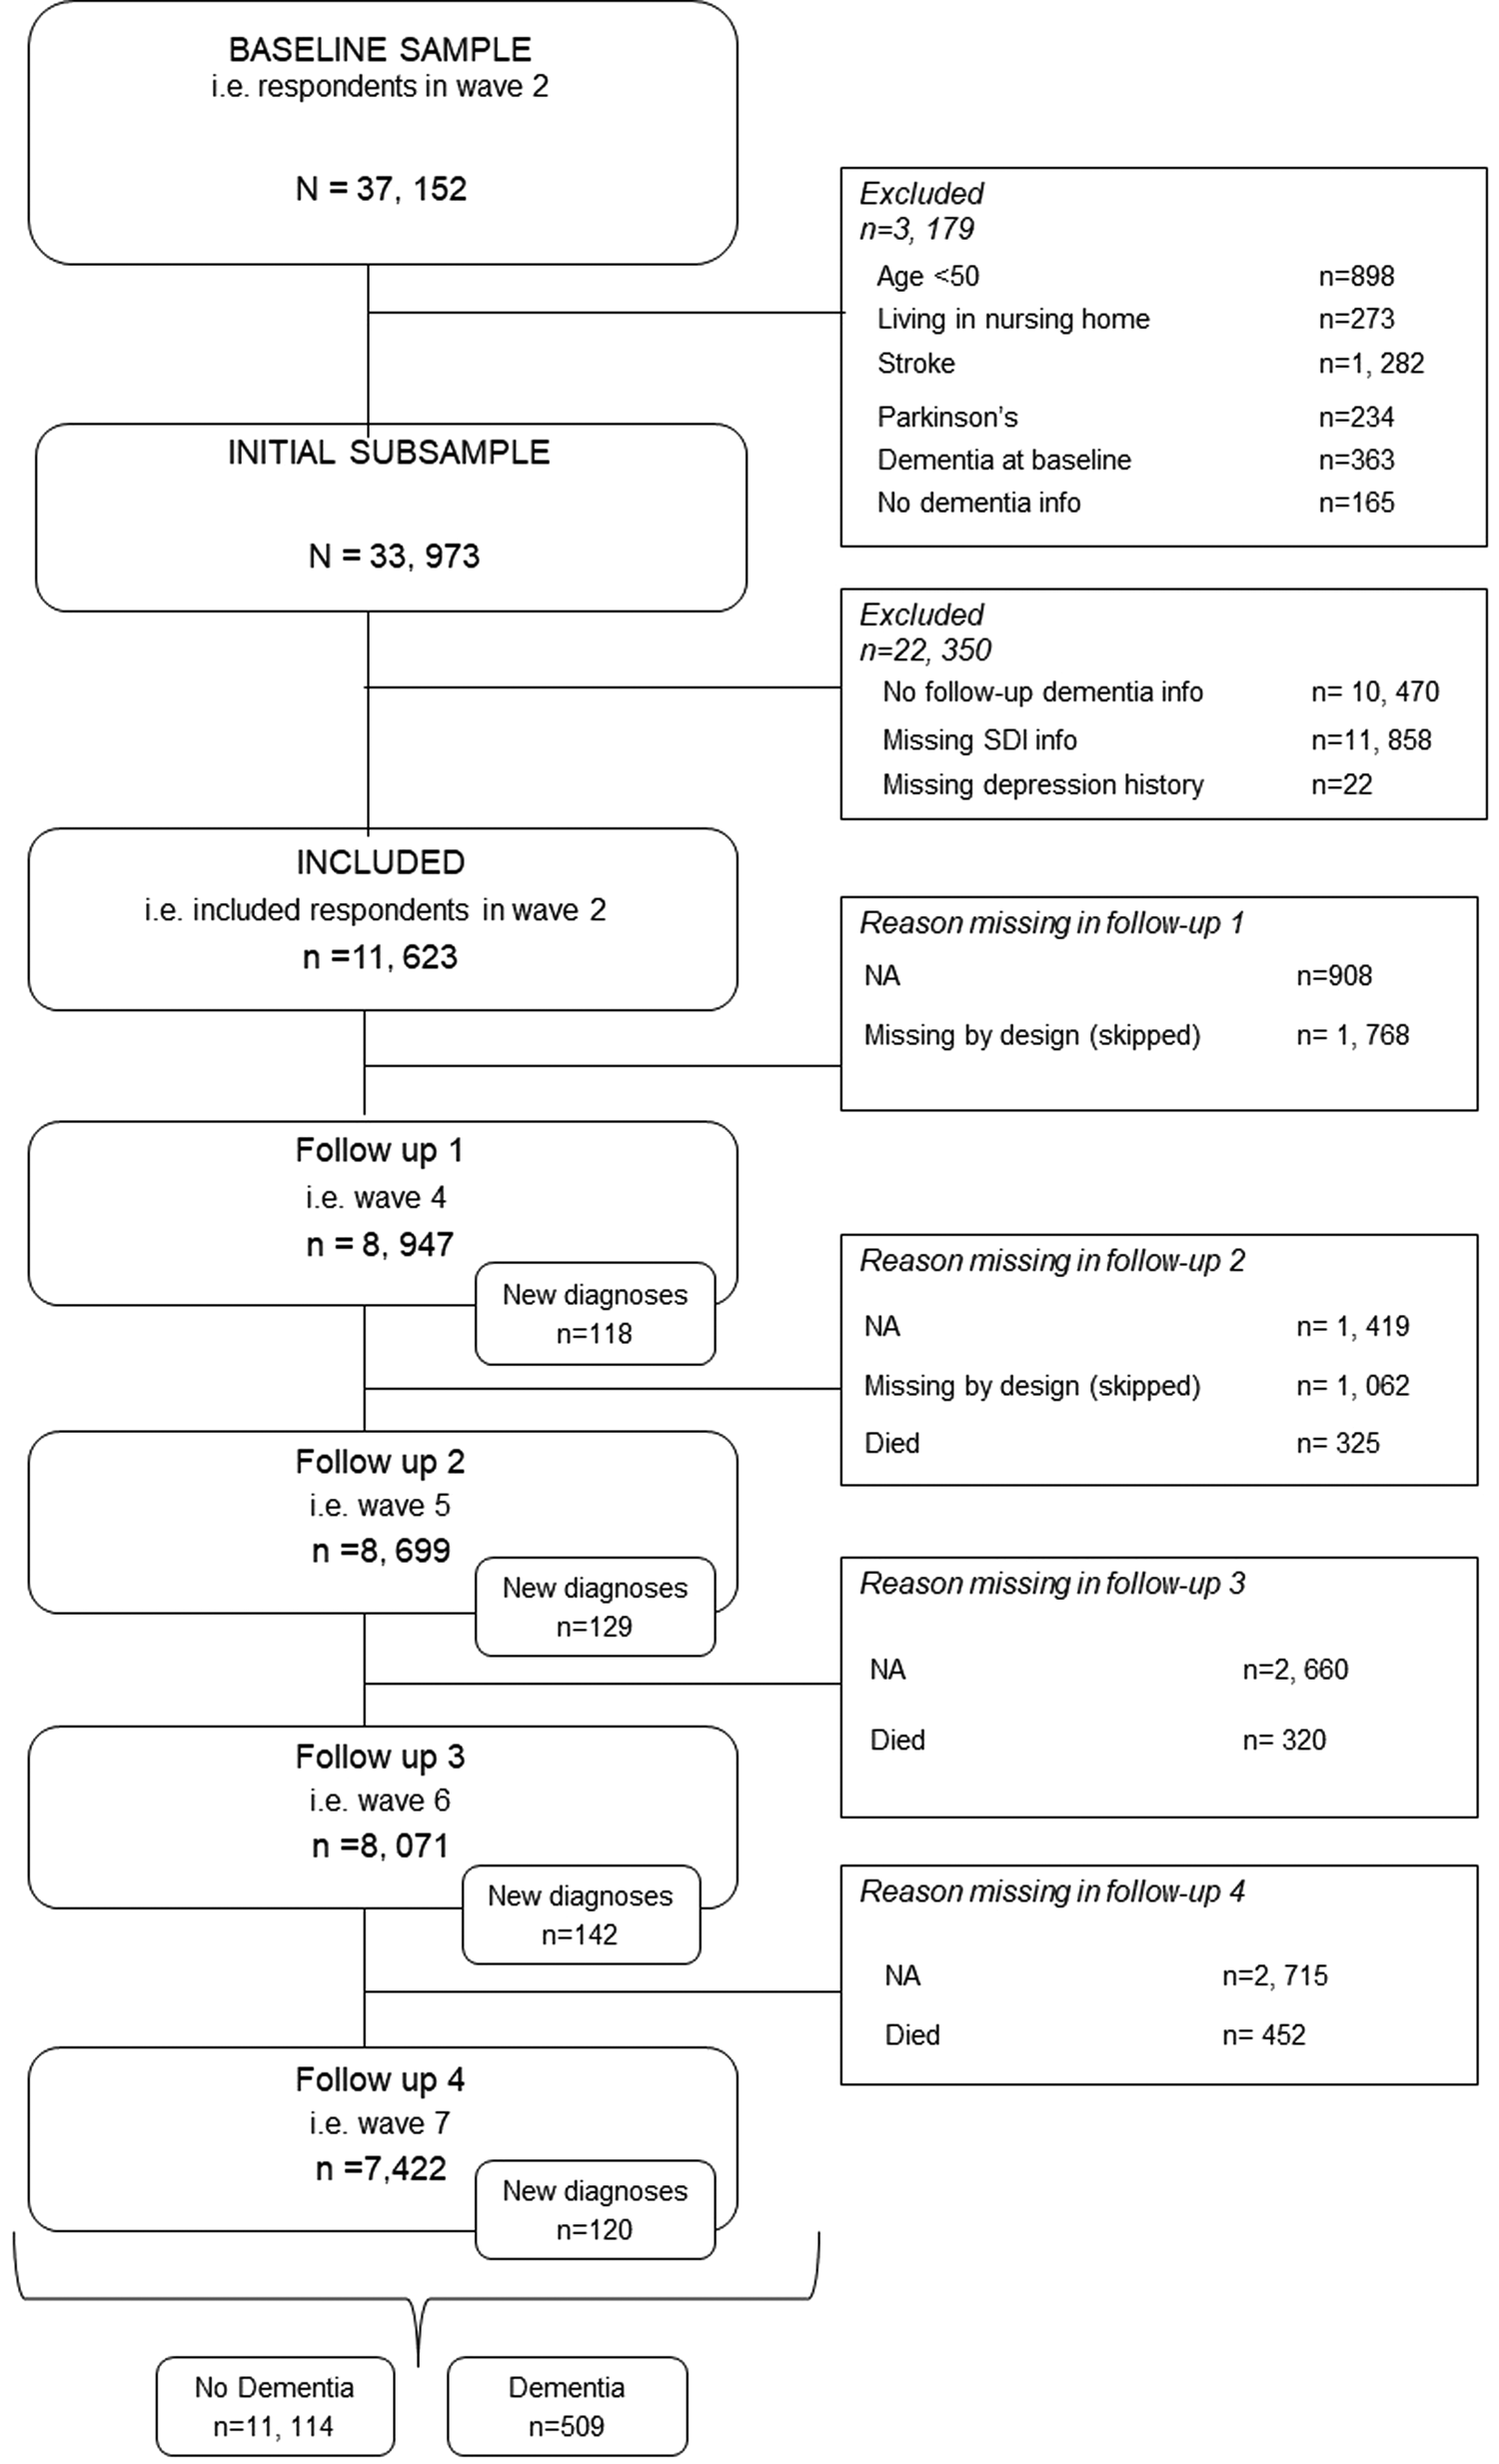
The SHARE is a longitudinal cross-country study of Europeans and Israelis 50 years and older. Ethic committees at the University of Mannheim and the Max Planck society have approved this study. All participants provided written informed consent. The first wave of data collection took place in 2004; since then, data collection has been taking place approximately every 2 years. Due to the Covid-19 pandemic, data collection has been limited for wave 8, so that, at the time of writing, the most recent complete data collection was that for wave 7 in 2017. In the present analysis, we included data from waves 2–7, as dementia status was not assessed in wave 1. In wave 3, data collection was restricted to retrospective life history data (SHARELIFE). We include respondents who at baseline (wave 2) reported being dementia-free and having neither a past nor current stroke/cerebral cardiovascular disease nor Parkinson's disease. We further limited inclusion to participants for whom information on covariates, depression symptomatology and social deprivation was available and who were at least 50 years of age and not in institutional care at baseline. Further, we excluded respondents who were never re-interviewed after baseline. The final sample contained 11 623 respondents (see Fig. 1).
Flow chart showing respondent selection.
Social Deprivation Index (SoDep Index) Status
The SoDep Index was originally conceptualised in the US HRS sample (Hofbauer and Rodriguez, Reference Hofbauer and Rodriguez2021a) and has since been validated in the SHARE sample (Hofbauer and Rodriguez, Reference Hofbauer and Rodriguez2021b). Domains included are education, income, wealth, job stability and health insurance status. Education is measured in years. Income sums all reported household incomes. Wealth expresses a household's net financial assets less the household's financial liabilities. Income and wealth were adjusted for the household size by dividing by the square root of household size. To determine job stability (i.e. having held a job for 5+ years) we extracted employment history from the retrospective SHARELIFE data. For health insurance status, we recorded whether respondents had any supplementary health insurance beyond basic national insurance.
All domains were reverse coded, so that a greater value indicated greater deprivation. We then multiplied the domains with weights determined by structural equation modelling coefficients during index construction (see Hofbauer and Rodriguez, Reference Hofbauer and Rodriguez2021a). The coefficients are shown in Table 1. Finally, we sub-divided the sample according to SoDep Index Status. Respondents with high SoDep Index scores (⩾80% percentile) were considered to have high SoDep Index Status, low SoDep Index scorers (⩽20% percentile) were considered to have low SoDep Index Status. These percentiles are commonly operationalised as indicating ‘high’ and ‘low’ socioeconomic position (e.g. Krieger et al., Reference Krieger, Kosheleva, Waterman, Chen, Beckfield and Kiang2014; Stenberg et al., Reference Stenberg, Persson, Näslund, Ottosson, Sundbom, Szabo and Näslund2019). Accordingly, remaining respondents (21–79% percentile) were identified as having moderate SoDep Index Status.
SoDep Index domains with corresponding weights based on Hofbauer and Rodriguez Reference Hofbauer and Rodriguez2021a

SEM, structural equation modelling.
1 Index domains were reverse scored so that a higher value on the index reflects greater deprivation experience.
Age at self-reported dementia diagnosis
We considered participants who responded in the affirmative to ‘Has a doctor ever told you that you had/Do you currently have: Alzheimer's disease, dementia, organic brain syndrome, senility or any other serious memory impairment’ as having dementia. While this is neither specific, nor a confirmed clinical diagnoses, it is established practice in the handling of SHARE data (e.g. Ferreira et al., Reference Ferreira, Brandão and Cardoso2020). Thus, throughout this manuscript, we use ‘dementia’ when referring to self-reported diagnosis. We took the halfway point between the last wave at which respondents reported being dementia-free and the first wave they reported a diagnosis as the time of self-reported diagnosis (see also e.g. Wang et al., Reference Wang, Wahlberg, Karp, Winblad and Fratiglioni2012; Wu et al., Reference Wu, Wang, Yao, Yan and Pei2020). We used baseline age and the time to diagnosis to determine age at self-reported diagnosis.
Age at death
SHARE interviewers record at each wave whether a respondent is alive or has died, confirming this vital status wherever possible with someone in the respondents close social network (Bergmann et al., Reference Bergmann, Kneip, De Luca and Scherpenzeel2019). We took the halfway point between last wave alive and first wave respondents were recorded dead as the time of death to calculate the age at death.
Depressive symptom status
We used a composite measure reflecting whether respondents had in the past experienced symptoms indicative of depression and/or whether they were experiencing them at baseline. A distinction between past and baseline depression was made given differential effects of early- and late-onset depression on cognitive decline (Jamieson et al., Reference Jamieson, Goodwill, Termine, Campbell and Szoeke2019; Manning et al., Reference Manning, Wu, McQuoid, Steffens and Potter2022). To determine past depressive symptoms, respondents were asked whether there had been a time or times in their life, when they suffered from symptoms of depression which lasted at least 2 weeks. Baseline depressive symptoms were recorded using the EURO-D scale, with scores ⩾6 being deemed indicative of depression at baseline (Tomás et al., Reference Tomás, Torres, Oliver, Enrique and Fernández2022). Respondents were grouped according to their report of depressive symptoms (1) neither in the past nor at baseline, (2) in the past but not a baseline (‘past depressive symptoms’) (3) at baseline but not in the past (‘baseline depressive symptoms’), (4) both in the past and at baseline (‘stable depressive symptoms’).
Baseline covariates
Covariates recorded at wave 2 (baseline in this study) were respondents' gender, whether respondents were married/partnered or not (i.e. widowed/divorced/never married) and the number of chronic health conditions respondents reported having been diagnosed with (for the list of conditions considered see online Supplementary Table S1). Covariates were chosen based on evidence showing an association with dementia risk and depressive symptomatology. Being married or partnered has beneficial effects on cognition (Sommerlad et al., Reference Sommerlad, Ruegger, Singh-Manoux, Lewis and Livingston2018) and mitigates negative effects of deprivation on mental health (Bierman, Reference Bierman2009). Both risk of dementia (Nebel et al., Reference Nebel, Aggarwal, Barnes, Gallagher, Goldstein, Kantarci, Mallampalli, Mormino, Scott, Yu, Maki and Mielke2018) and depression (Girgus et al., Reference Girgus, Yang and Ferri2017) are generally higher in women. Poor overall health is also associated with greater dementia risk (Stephan et al., Reference Stephan, Sutin, Luchetti, Aschwanden and Terracciano2021) as well as depression (Chang-Quan et al., Reference Chang-Quan, Xue-Mei, Bi-Rong, Zhen-Chan, Ji-Rong and Qing-Xiu2009). Baseline covariates are chosen to minimise the risk of reverse causality (see e.g. VanderWeele et al., Reference VanderWeele, Jackson and Li2016).
Analyses
All analyses were conducted using R (Version 4.2.2.) in RStudio (RStudio Team, 2020). We set the significance level α < 0.05.
We calculated the mean and standard deviation (s.d.), or the median and interquartile range, of participant demographics. We assessed group differences at baseline between respondents with and without dementia. For continuous variables we employed Mann–Whitney U tests based on violations of the homogeneity of variance assumption. Age was the exception to this and compared using a t test. For categorical variables, we used χ 2 tests. In addition, we completed a χ 2 tests to determine whether there was a significant association between SoDep Index Status and dementia as well as between SoDep Index Status and Depressive Symptoms Status.
For all survival analyses, time to event was defined as lifetime to event (i.e. age). Given the close link between dementia and age, age has been identified as the appropriate timescale to use in dementia-related analyses (Thiébaut and Bénichou, Reference Thiébaut and Bénichou2004; Weuve et al., Reference Weuve, Proust-Lima, Power, Gross, Hofer, Thiébaut, Chêne, Glymour and Dufouil2015). The time at risk was defined as the lifetime between birth and either dementia or censure (death/last contact). For each SoDep Index Status, we calculated the total time at risk and the incidence per 1000 person-years. In addition, we completed Kaplan–Maier analyses to estimate the median age of dementia-free survival by SoDep Index Status, i.e. the age at which the probability of dementia-free survival reached 50%. Further, we estimated the probability of being dementia-free at 70 and 90 years of age.
In a multivariate Cox proportional hazards model (R package: ‘survival’; Therneau, Reference Therneau2021), we included, dementia status (dementia or censored) and age at last follow-up (age at self-reported diagnosis, death, end of participation or end of study) as outcomes. Predictors, entered simultaneously, were SoDep Index Status and baseline covariates. In a second step, we extended this model by adding Depressive Symptom Status as a predictor. This step-wise approach allowed us to first estimate the total variance in dementia risk explained by SoDep Index Status before identifying the variance explained by SoDep Index Status directly. Further, we intended to investigate an interaction between SoDep Index Status with Depressive Symptoms Status. Yet, this would have resulted in a multitude of crossing hazard curves, indicating that this was not appropriate (see online Supplementary Fig. S1). Thus, we repeated the hazard analyses separately for each SoDep Index Status (low, moderate, high) to determine whether the association between depression history and dementia risk would vary depending on SoDep Index status.
To account for the fact that respondents who die may in the future have reported a dementia diagnosis (i.e. the competing risk of death), we completed an additional analysis using a Fine–Gray subdistribution hazard model (R package: ‘cmprsk’; Gray, Reference Gray2020). The Fine–Gray model included event status (dementia, death or censored) and age at last follow-up as outcomes and SoDep Index Status, baseline covariates and Depressive Symptom Status as predictors. In addition, we completed a sensitivity analysis using cognitive performance scores (see online Supplementary Text S1).
Results
Descriptive characteristics
At baseline, respondents in the survey were on average 64.86 (s.d.: 8.63) years old, and 52.16% were female. They were followed for an average 8.70 (s.d.: 2.17) years. A total of 509 respondents (4.38%) reported dementia over the follow-up period. At baseline, those who went on to develop dementia were, on average, older, had undergone fewer years of education, were less likely to be married/partnered, had more chronic conditions, more frequently had experienced past, present or stable depressive symptoms and had lower median incomes and wealth (see online Supplementary Table S2).
SoDep Index Status was significantly associated with dementia (χ 2 (2) = 34.66, p < 0.001). The association between SoDep Index Status and Depressive Symptoms was also significant (χ 2 (6) = 163, p < 0.001). For percentages see Table 2.
Sample demographics
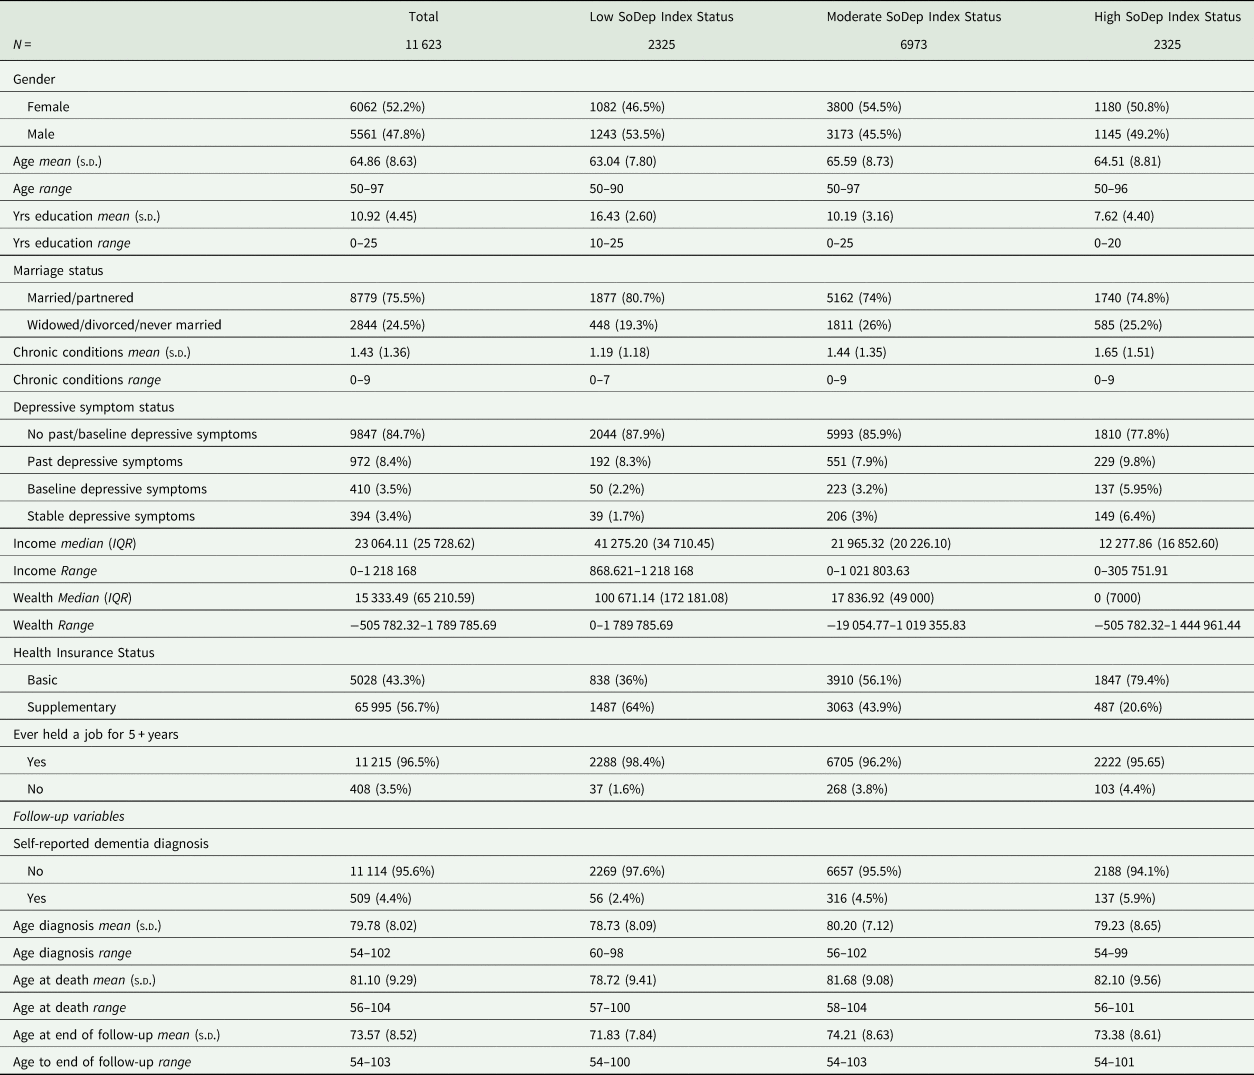
EURO-D, European Depressive Symptoms Scale, IQR, interquartile range; N, total number; NA, not applicable; s.d., standard deviations, Yrs, years.
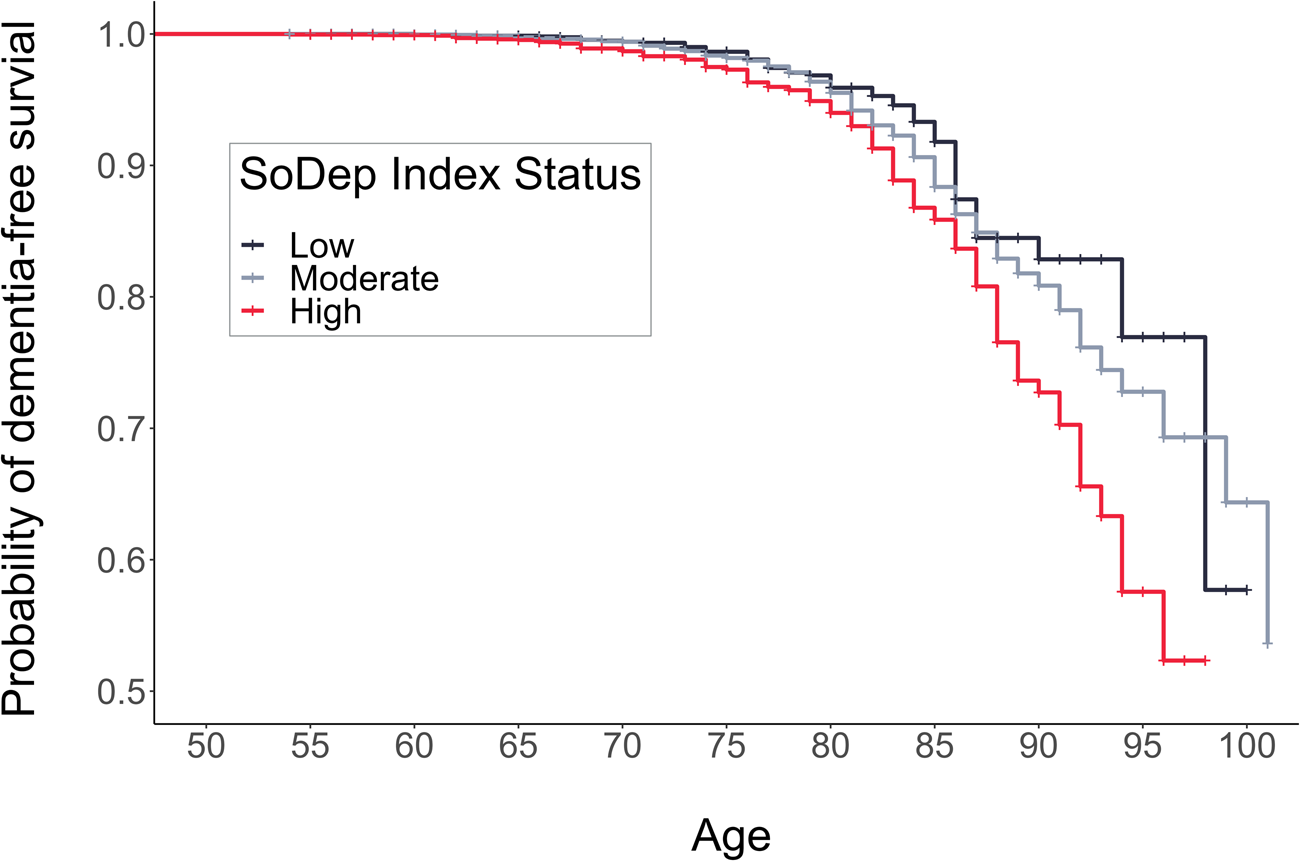
Dementia-free survival by SoDep index status
The total person-years at risk and incidence rates per 1000 person-years were the following: 166 997 person-years (incidence: 0.34) for low SoDep Index Status, 517 446 person-years (incidence: 0.61) for moderate SoDep Index Status and 170 614 person-years (incidence: 0.80) for high SoDep Index Status. Results from the Kaplan–Mayer estimation showed that the median dementia-free age reached was 102 in the moderate SoDep Index Status group and 99 in the high SoDep Index Status group. For those with low SoDep Index Status, the median was not yet reached, i.e. the probability of dementia-free survival did not drop to 50% in the observed data for this group. The probability of being dementia-free at age 70 was 99.41% (95% CI 99.04–99.78) for low, 99.40% (95% CI 99.20–99.61) for moderate and 98.69% (95% CI 98.16–99.22) for high SoDep Index Status. At age 90, the probabilities were 82.86% (95% CI 77.25–88.86), 80.85% (95% CI 78.42–83.36) and 72.73% (95% CI 67.31–78.58), respectively.
SoDep index status, depressive symptom status and dementia
Cox regression results showed high SoDep Index Status to be associated with increased dementia risk (HR = 1.79, [95% CI 1.31–2.45], p < 0.001), compared to low SoDep Index Status (see Fig. 2). After adding Depressive Symptom Status as a predictor, the HR for high SoDep Index Status changed to 1.63 ([95% CI 1.19–2.24], p = 0.002). In conjunction, these findings indicate that high (v. low) SoDep status was associated with a 79% increase in dementia risk and that Depressive Symptom Status accounted for 16% of this difference in risk. In addition, compared to not having past or baseline depressive symptoms, each Depressive Symptom Status was associated with an increased dementia risk (past depressive symptoms: HR = 1.66, [95% CI 1.23–2.24], p < 0.001; baseline depressive symptoms: HR = 1.48, [95% CI 1.04–2.10], p = 0.030; stable depressive symptoms: 2.96, [95% CI 2.12–4.14], p < 0.001). For full model output see Table 3. These findings held up to adjustment for mortality (see online Supplementary Table S3) and were replicated for cognitive performance (see online Supplementary Text S1).
Cumulative Incidence Function showing risk of a dementia diagnosis by age and SoDep Index Status.
Cox regression results for the full sample
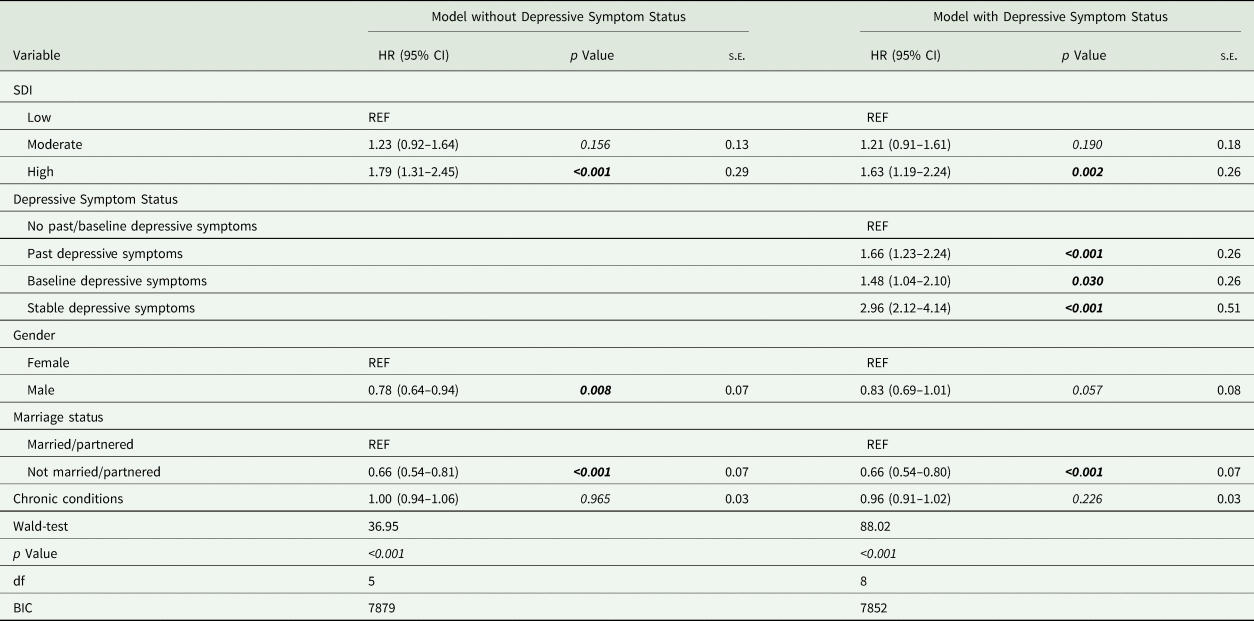
BIC, Bayesian information criterion; CI, confidence interval; df, degrees of freedom; HR, hazard ratio; REF, indicates the reference level of a variable; s.e., standard error.
SoDep index status subgroup analyses
In subgroup analyses, stable depressive symptoms, compared to no past or baseline depressive symptoms, were associated with higher dementia risk in the moderate (HR = 2.11, [95% CI 1.26–3.54], p = 0.005) and high (HR = 4.37, [95% CI 2.65–7.22], p < 0.001) SoDep Index Status group. That is, the dementia risk was more than doubled in those with moderate SoDep Status and stable depressive symptoms compared to those with moderate SoDep Index Status and no past or baseline depressive symptoms. For those with high SoDep Index Status and stable depressive symptoms the dementia risk was more than quadrupled compared to those with high SoDep Index Status and no past or baseline depressive symptoms. In addition, for those with moderate SoDep Index Status past depressive symptoms were associated with increased risk (HR = 1.70, [95% CI 1.16–2.49], p = 0.007) compared to no past or baseline depressive symptoms. For the low SoDep Index Status group, none of the predictors were significant (see Table 4).
Cox regression results for SoDep Index Status subgroups
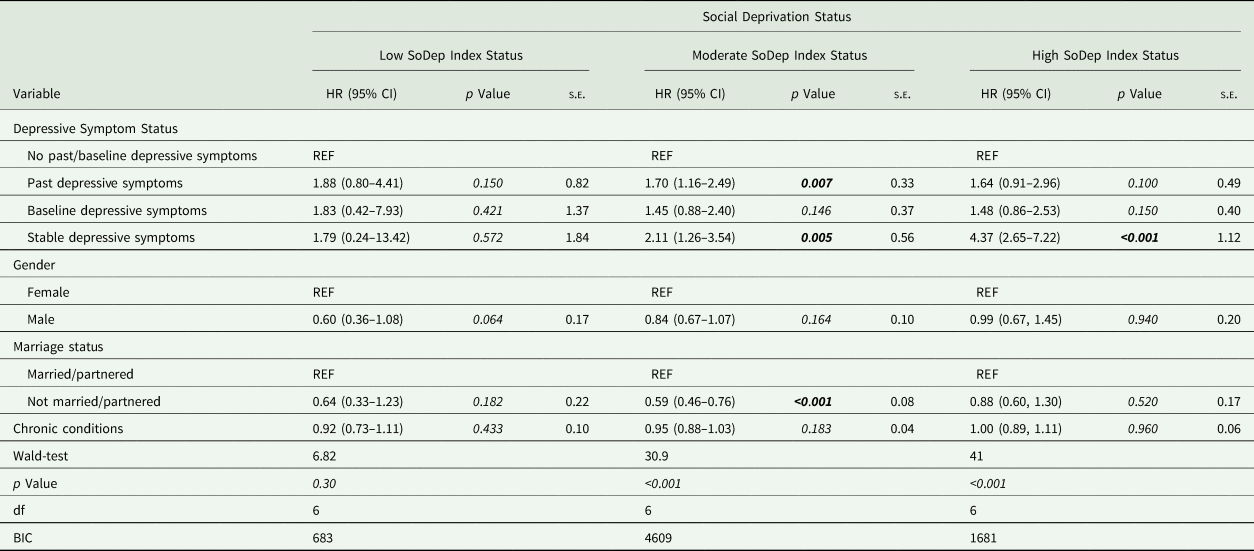
BIC, Bayesian information criterion; CI, confidence interval; df, degrees of freedom; EURO-D, European Depressive Symptoms Scale; HR, hazard ratio; REF, indicates the reference level of a variable; s.e., standard error.
Discussion
In this paper, we aimed to investigate the association between individual social deprivation status, as measured by the SoDep Index, and dementia risk, as determined using self-reported dementia diagnosis. Compared to low SoDep Index Status, high SoDep Index Status was associated with a 79% increase in dementia risk. We further investigate the role of depression in this association. Depressive Symptom Status accounted for 16% of the above reported increase. The subgroup analyses revealed that experiencing depressive symptoms both in the past and at baseline, compared to not experiencing any, was associated with an increased dementia risk in those with high or moderate SoDep Index Status but not those with low SoDep Index Status. Past depressive symptoms were associated with increased dementia risk in those with moderate SoDep Index Status. Results held up to mortality correction and were replicated in an analysis impaired cognitive test performance as the outcome.
Thus, our results show that the previously documented association found between individual social deprivation and cognition (Bongue et al., Reference Bongue, Colvez, Amsallem, Gerbaud and Sass2016; Hofbauer and Rodriguez, Reference Hofbauer and Rodriguez2021a, Reference Hofbauer and Rodriguez2021b) expands to dementia risk. This is in line with the conceptualisation of cognitive ageing as a continuum that ranges from unimpaired to pathologically impaired function, with a shared underlying process (Brayne and Calloway, Reference Brayne and Calloway1988). Only a relatively small fraction of the variance in dementia risk was explained by depressive symptomatology. This is contrary to expectation that depression could be the pathological manifestation of high social deprivation leading to dementia (Calcia et al., Reference Calcia, Bonsall, Bloomfield, Selvaraj, Barichello and Howes2016; Peña-Bautista et al., Reference Peña-Bautista, Casas-Fernández, Vento, Baquero and Cháfer-Pericás2020; Shaw et al., Reference Shaw, Jana and Kundu2022). Other pathways not considered in this work likely play a larger role in the association. One prominent candidate is lifestyle. Individuals with restricted access to resources may be less able to conform to a lifestyle that supports healthy cognition. Indeed, recent research has demonstrated that wealth is associated with a less brain-healthy lifestyle, which in turn mediates around half of the wealth-based dementia risk difference (Deckers et al., Reference Deckers, Cadar, van Boxtel, Verhey, Steptoe and Köhler2019). Future research may clarify whether this can be replicated using a more comprehensive deprivation assessment.
In the subgroup analyses, we found a particularly strong association between stable depressive symptoms and dementia risk in the high SoDep Index group. Social deprivation may result in low cognitive reserve and thus induce greater vulnerability to depression (Barnett et al., Reference Barnett, Salmond, Jones and Sahakian2006), with stable depressive symptoms lowering resources to the degree that vulnerability to dementia is exacerbated. However, subgroup analysis may have been underpowered and confidence intervals suggest substantial uncertainty, so that results need to be interpreted with caution. Moreover, being collected in older adults, the data used in this analysis cannot be used to make any causal claims. Reverse causality (i.e. that depression leads to social deprivation) can be argued for, e.g. because depression can lead to job-loss (Lerner et al., Reference Lerner, Adler, Chang, Lapitsky, Hood, Perissinotto, Reed, McLaughlin, Berndt and Rogers2004). Yet, this is unlikely to fully account for the effect, given that socioeconomic disadvantage in childhood is associated with later depression (Angelini et al., Reference Angelini, Howdon and Mierau2018).
In conjunction with our previous findings, the present results suggest a consistent association of SoDep Index scores with cognitive health outcomes in older adults. It may be developed into a brief assessment tool to identify individuals at high risk. Unlike standard SES measures, the index was constructed and validated in large, older adult samples, thus answering long-standing calls for assessments specific to this group (e.g. Salmond et al., Reference Salmond, Crampton, King and Waldegrave2006; Czajka and Denmead, Reference Czajka and Denmead2008).
These findings have practical implications. Clinical practitioners should be aware that the association between depressive symptoms and dementia risk varies by social deprivation status, with those with high social deprivation appearing particularly susceptible to detrimental effects. Interventions to individuals with double risk-status should be prioritised. Ultimately, however, individual-level intervention must be combined with population-level prevention (Walsh et al., Reference Walsh, Govia, Wallace, Richard, Peters, Anstey and Brayne2022). That is, policy makers must realise the health-threat that social deprivation poses and address inequality. Basic income appears one plausible way to do so, with economic models confirming macroeconomic feasibility (Gibson et al., Reference Gibson, Hearty and Craig2020; Luduvice, Reference Luduvice2021) and initial trials showing that such an intervention can indeed be successful in boosting health of recipients (Painter, Reference Painter2016; Ruckert et al., Reference Ruckert, Huynh and Labonté2017; Gibson et al., Reference Gibson, Hearty and Craig2020).
Strengths of this study include that we were able to draw on the large, representative sample of the SHARE. The rich data allowed for comprehensive assessment of both social deprivation and depression as risk factors for dementia. Nonetheless, there are some limitations. First, neither dementia nor depressive symptomatology was clinically confirmed. This limits the reliability of results. Therefore, the findings may be biased by insight into symptoms. In both cases, stigma may influence reporting. Second, by excluding those who reported a dementia diagnosis at baseline, we likely excluded those who were particularly exposed to risk factors for dementia, including social deprivation and depressive symptoms. Thus, our findings may somewhat underestimate the associations. Third, covariates were assessed at baseline. They thus cannot reflect any changes that might relate to dementia risk. For instance, if overall health decreased rapidly during follow-up this may account for some of the variance in dementia risk.
In conclusion, social deprivation appears to be an important risk factor for dementia, even after control for other known risk factors and mortality. Depressive symptoms are a particular concern in those who are experiencing moderate or high levels of social deprivation. Thus, physicians should offer help to any patients that present with depressive symptomatology and experience some degree of socioeconomic strain. Greater equity in society is ultimately the only way to address these dementia risk factors on the population level.
Supplementary material
The supplementary material for this article can be found at https://doi.org/10.1017/S2045796023000033
Data
For this study, we make use of the Survey of Health, Ageing and Retirement in Europe (SHARE) data. SHARE data are available to interested researches who register under http://www.share-project.org.
Acknowledgements
We thank the SHARE staff for making the data available for analysis.
Financial support
This research did not receive any specific grant from funding agencies in the public, commercial or not-for-profit sectors.
Conflict of interest
None.


 Open access