


1. INTRODUCTION
Two of the most remarkable, and widely appreciated effects of snow are its ability to alter the color and the nature of the surface on which it falls. There is a vast amount of material, scientific and artistic, relating to the first-mentioned power. This color-altering ability, or more scientifically, the ability of snow to increase the albedo of glaciers, forests, prairies and tundra, forms the basis of crucial studies related to the surface energy balance of the Earth, and plays a role in climate change and sea level rise. The color of snow also figures largely in the production of agriculturally important meltwater from a snowpack through albedo-mediated solar energy absorption.
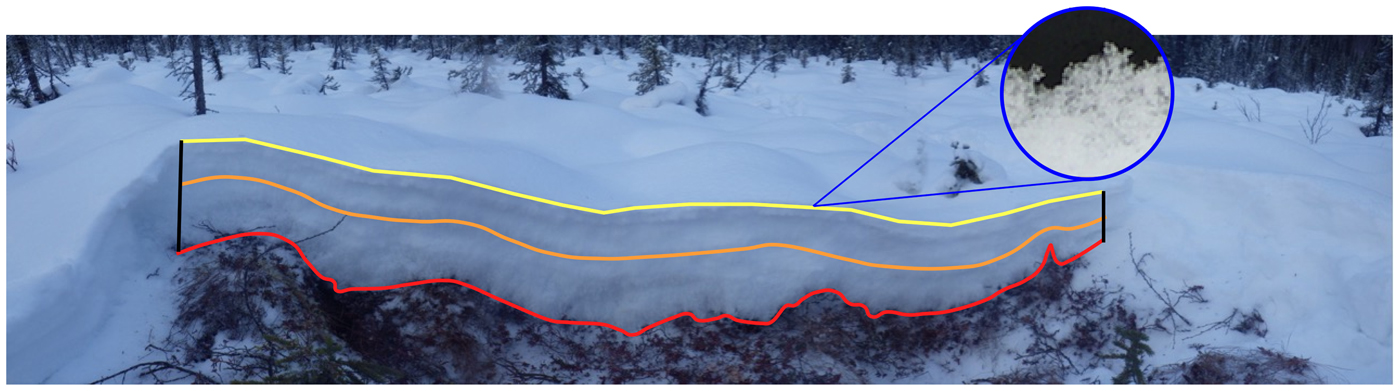
But in addition to mediating a color change, snow can also produce fundamental changes in the nature and geometry of the surface on which it accumulates. Falling on a smooth surface (Fig. 1), it may produce a roughening; falling on a rough surface, it may produce a smoothing; it can roughen at one scale while smoothing at another. Like the ability to change the color of the world, the smoothing power of snow has also caught the attention of artists. Jack London, in his famous short story To Build a Fire (Reference London1908) wrote “[…] on top of (jumbled blocks of) ice were as many feet of snow. It was all pure white, rolling in gentle undulations where the ice-jams of the freeze-up had formed.” In this passage, he was marveling at the ability of snow to smooth out what otherwise would be an impassable jumble of ice blocks. This smoothing power, along with the unique ability of snow to alter our sound environment making the world quieter, explain in large measure why snow is so often used as a metaphor for peace, serenity or even eroticism in paintings and poems (e.g. Gautier, Reference Gautier1890; Burnside, Reference Burnside2013).
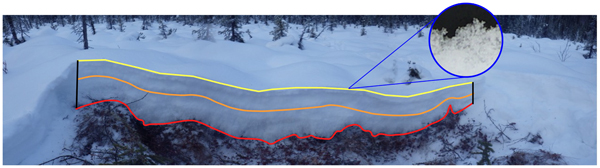
A cross-section through a typical taiga snow cover showing a rough, hummocky bottom (vegetation). As snow progressively accumulates, the snow surface becomes smoother. The circular inset shows the surface magnified over about a 10 mm length scale, at which there is some micro-roughening (inset from Löwe and others (Reference Löwe, Egli, Bartlett, Guala and Manes2007)).The snowpit is about 0.5 m deep and 4 m long.
While the scientific literature on snow changing the color of surfaces is extensive, the literature on snow altering the roughness of surfaces is meager. Moreover, it is somewhat confusing. To many scientists, the topic of snow roughness means aerodynamic roughness in the context of boundary-layer studies, rather than specific geometric alterations in the physical characteristics of the surfaces. It is this latter aspect of the snow that we focus on here. On that topic, we count a total of only four studies over the past 54 years, with an additional three studies on snow interception by tree canopies from which useful information about snow smoothing can also be gleaned.
This relative lack of attention might be because there is little perceived practical application for the results. From a strictly phenomenological standpoint, the topic certainly warrants attention since snow smoothing processes take place wherever there is snow, a vast area of the Earth, and occur whether there is wind or not. Consequently, all snow-covered landscapes have some characteristics resulting from the mechanisms described here. Additionally, there is widespread interest in understanding the spatial and temporal variability of snow depth, often for water run-off and ecological studies.
In this paper, our scale of interest ranges from about 1 mm (the size of an individual snowflake or particle) to about 10 m, the maximum length over which smoothing mechanisms appear to act in the absence of wind. We explore the mechanisms that produce lateral movement of snow particles during natural snowfall in the absence of wind, and the resulting changes in surface geometry produced by these mechanisms as snow builds up. To produce a more complete description of what takes place when snow falls on a surface, we draw on prior work as well as our results. We attempt no modeling here as we believe the basic understanding and data needed to support quantitative modeling of snow smoothing (or roughening) in the absence of wind is not yet available. We do, however, suggest a structure around which such modeling might be organized.
2. BACKGROUND
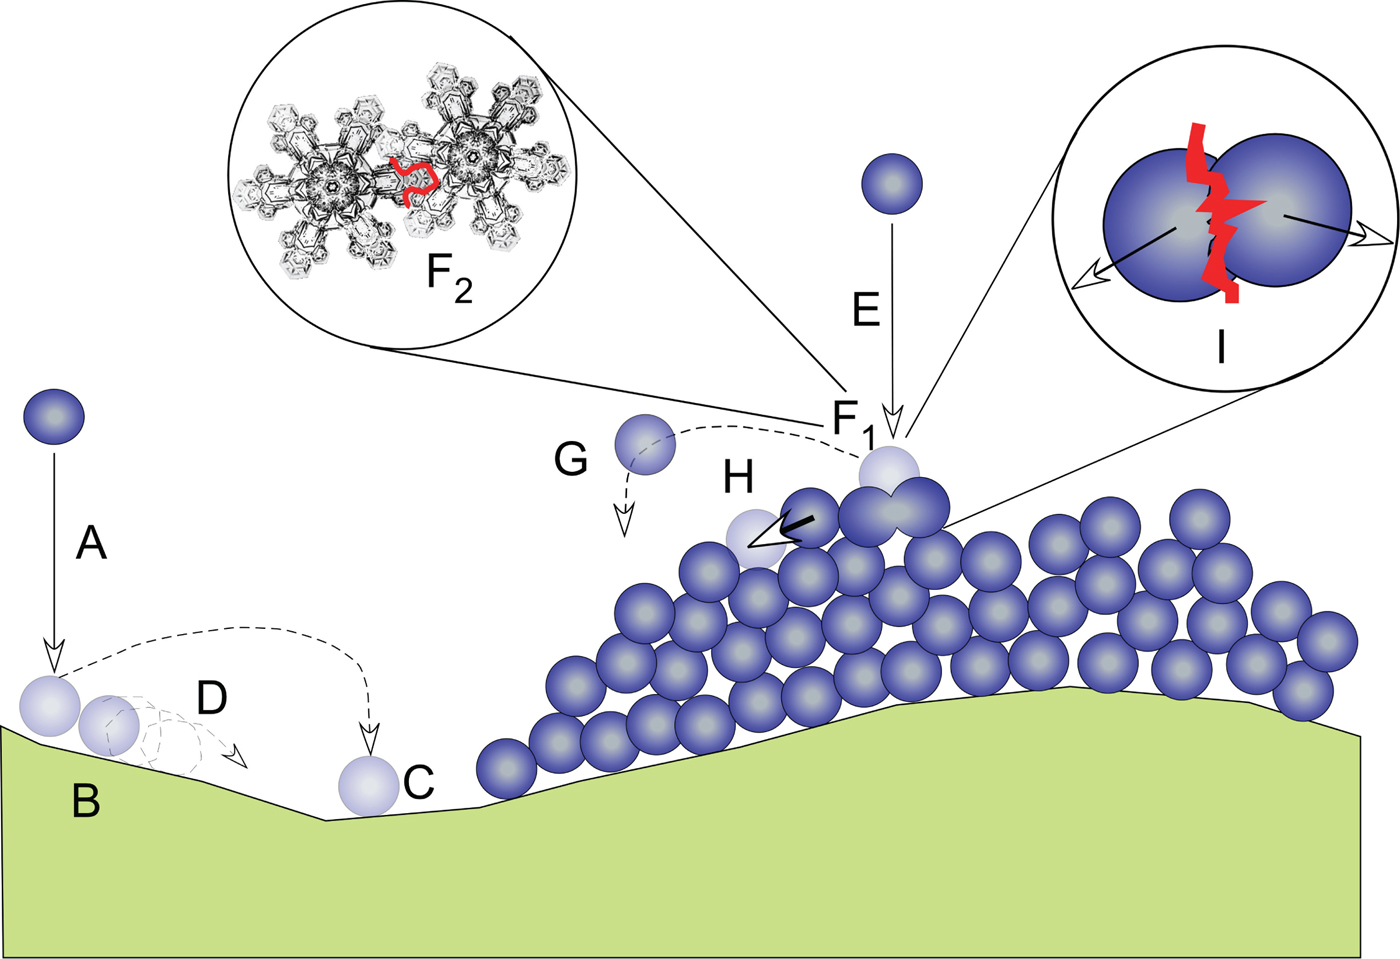
Kuroiwa and others (Reference Kuroiwa, Mizuno and Takeuchi1967), reporting on their studies of the micromeritical properties of snow, examined the angle of repose of snow that had fallen vertically from a hopper. Finding that this angle increased with increasing snow temperature, they attributed the difference to increasing cohesive forces between particles produced as the liquid-like layer on the snow particles increased in thickness (Faraday, Reference Faraday1850; Sazaki and others, Reference Sazaki, Zepeda, Nakatsubo, Yokomine and Furukawa2012). They also found that the angle increased when more irregular particles (dendrites) were dropped from the hopper. The angle was reduced when the drop distance (and fall speed) was increased. Without explicitly stating so, they had come close to an understanding that the immediate fate of a snow particle falling onto a surface is determined by a force balance between the kinetic energy of the incoming particle (A or E in Fig. 2), which is a function of its mass and velocity, its coefficient of restitution (a material property of ice), which determines if and how far it will bounce, and the cohesive and interlock forces that tend to immobilize a particle when it lands. These cohesive forces are produced either by the viscous suction of the liquid-like layer (F1), the mechanical interlocking of snow particles (F2), a combination of both, or perhaps static attraction (Schmidt and others, Reference Schmidt, Schmidt and Dent1999).
A schematic that illustrates the particle-scale physics taking place when snow falls on a bare or snow-covered surface in the absence of wind. Occurring at a time scale of seconds, a particle (A) falling on bare surface might land and adhere immediately (B), or bounce (C) or roll (D) laterally then come to rest. A particle falling on a snow-covered surface (E) might cohere to the underlying snow particles (F1), physically interlock with these particles (F2), or alternatively, it might bounce laterally (G) and then come to rest. During collisions, the particle may displace other particles it hits (H) or break apart one or several particles (I), losing energy in the process. In all of these fast processes, downhill motion is more probable than uphill motion. At much longer (hours to days) time scales, sintering, grain metamorphism and creep (slow plastic deformation) also result in (or retard) lateral redistribution. Broadly, cohesion, adhesion, interlocking and sintering are the main mechanisms retarding lateral redistribution and therefore retarding snow smoothing, with static charges also playing a role.
Kobayashi (Reference Kobayashi1972), investigating wind-driven transport of snow, observed and photographed snow particles bouncing as much as 140 mm laterally during saltation, a behavior that had been well-documented for blowing sand (Bagnold, Reference Bagnold1941). Wakahama and others (Reference Wakahama, Kuroiwa and Gotō1977), photographing the accumulation of snow on power lines, also observed particles bouncing and breaking, and noted that the bouncing continued even at above-freezing temperatures (+ 4°C). In this study, the results were somewhat confounded by wind, but in 1987, Kobayashi measured ice beads of a size similar to natural snowflakes bouncing off an ice surface in the absence of wind. He found bounce distances exceeding 60 mm. Lateral bounce distances (C and G in Fig. 2) increased when particles fell on boards or other hard surfaces, but decreased with rising temperature, indicating that the coefficient of restitution of the particles increased as their temperature dropped, a finding consistent with more recent studies on the elasticity of ice (Gold, Reference Gold1988; Higa and others, Reference Higa, Arakawa and Maeno1996). These studies, in concert with the angle of repose studies of Kuroiwa and others (Reference Kuroiwa, Mizuno and Takeuchi1967), lay out the basic understandings of snow particle behavior with other surfaces in a variety of conditions of temperature, drop height and surface mechanical properties. Low temperatures and hard surfaces (elastic) increase the magnitude of particle bounces as the coefficient of restitution is maximized, thus promoting lateral displacement of particles during accumulation. But this process of lateral displacement of particles is reduced when temperatures are high (increasing cohesion and adhesion), bouncing surfaces are soft (plastic), particles are more dendritic and/or are prone to breakage at impact. As a result, an accumulated snow surface can become rougher, at least at scales of a hundred particles or less (Löwe and others, Reference Löwe, Egli, Bartlett, Guala and Manes2007).
Studies focused on snow interception by tree canopies (Miller, Reference Miller1964; Bunnell and others, Reference Bunnell, McNay and Shank1985; Schmidt and Gluns, Reference Schmidt and Gluns1991; Pfister and Schneebeli, Reference Pfister and Schneebeli1999) found similar particle-scale mechanisms at work during snow buildup on tree branches. The motivation for these studies has generally been that canopy interception reduces the amount of snowmelt water that eventually runs off from a forest as interception increases evaporative losses (Horton, Reference Horton1919). Satterlund and Haupt (Reference Satterlund and Haupt1967); Bunnell and others (Reference Bunnell, McNay and Shank1985) and Schmidt and Gluns (Reference Schmidt and Gluns1991) have all provided succinct descriptions of the set of mechanism at work during canopy interception, and these include snow particle bouncing, as well as adhesion/cohesion effects. In addition, the interception studies are consistent in suggesting that bridging is important because it reduces the number of particles that pass through the canopy. Snow bridging can also occur when snow accumulates on an undulating or shrub-covered ground surface. In a tree or shrub canopy, as snow builds up on two adjacent branches, the lateral build-out of particle structures can close off the gap, increasing interception efficiency. However, under this load of snow, branches flex downward resulting in steeper snow surfaces and even unloading events. Thus, falling particles are more likely to bounce off the branch, decreasing the overall canopy interception. This latter mechanism does not occur when snow falls on the ground. The complex nature of the interaction of all these mechanisms, and their interaction with the intricate geometry of the branches and needles, can produce a confusing myriad of outcomes. Bunnell and others (Reference Bunnell, McNay and Shank1985) have attempted to summarize the ‘rules’ governing this buildup, a set of phenomenon that Schmidt and Gluns (Reference Schmidt and Gluns1991) claimed had ‘staggering complexity’. While a somewhat simpler system, we would suggest their comments are also relevant for snow falling on the ground.
3. METHODS
We ran three types of experiments to observe mechanisms that produce lateral displacement of particles during snow deposition without wind, and therefore could alter (roughen or smooth) a snow surface: (1) we allowed snow to fall through a narrow (40 mm) gap in a closed box with flat bottom and then examined the shape and the angle of repose of the resulting deposits above and under the gap. (2) We watched the buildup of snow on tables equipped with artificial relief in the form of bumps of various sizes, shapes and spacings, and (3) we used a high-frequency strobe light and video camera to photograph individual falling and bouncing snowflakes. All experiments were run under natural snowfall in nearly calm conditions in a small clearing surrounded by trees (> 5 m) in Fairbanks, Alaska. We chose this natural setting because of the difficulty in replicating natural snowfall in a laboratory. The experiment with artificial profiles on tables was first run during the winter of 2012–2013 and a modified version during the winter of 2014–2015 along with the two other experiments.
3.1. Snow deposition through a gap
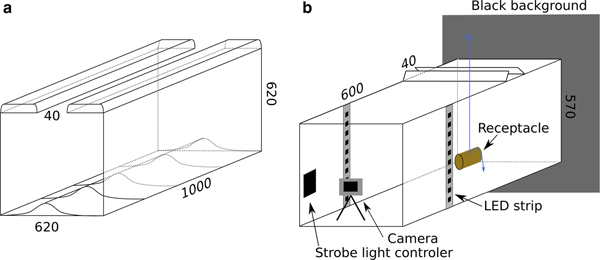
This experiment consists of a wooden box 620 mm high, 620 mm wide and 1000 mm deep with an open slot 40 mm wide at the top running back through the full 1000 mm depth (Fig. 3a). During snowfall, particles are deposited on the flat wooden surface below the gap as well as on the top of the box adjacent to the slot. After deposition, we sectioned these deposits and photographed the resulting snow profiles against a dark gridded card, then digitized the shape of these snow profiles. Given that the geometry of the experiment is constant, any change in shape of the snow accumulation is then dependent on parameters such as cohesion, snowflake shape or snowfall characteristic (fall speed, fluttering). Multiple sections (an average of 6 per snowfall) were obtained by cutting back along the deposit in a series of thin slices. Between snowfalls, the box was emptied and the top cleared. During each event, we also recorded the total snow accumulated on a nearby flat surface. Data were collected during three different snowfalls: the first occurred at −0.7°C with a total accumulation of 36 mm of snow; the second at −4.1°C with 93 mm, and the third at −4.3°C with 15 mm. For snowfall I and II, we made three set of measurements of the lower profile shape, but only one was made for snowfall III.
Experimental setup for (a) snow deposition through a gap, and for (b) bouncing particles captured with a strobe light and a camera in a dark setup. Both consist of a hollow box made of plywood with narrow roof openings (40 mm wide) to control snowfall input. Dimensions in millimeter.

3.2. Snow deposition over artificial relief
We installed artificial bumps of various shapes, sizes and spacings on outdoor tables and allowed them to be buried by snow. These bumps, actually long ridges, were essentially two-dimensional with respect to snow accumulation, extending back from the table edges about 600 mm. At the end of each season, we sectioned the snow across the bumps and photographed the sections with a near-infrared (NIR) camera (Fujifilm S9100 digital camera) using the method of Tape and others (Reference Tape, Rutter, Marshall, Essery and Sturm2010). This allowed us to see the snow stratigraphy in detail. The tables were 900 mm above ground to prevent strong temperature gradients across the snowpack, thereby inhibiting the formation of the extensive depth hoar metamorphism common around Fairbanks (Trabant and Benson, Reference Trabant and Benson1972; Sturm and Benson, Reference Sturm and Benson1997). Nevertheless, some slight metamorphism did occur, reducing the mean particle size over time (Bader, Reference Bader1954; Flin and others, Reference Flin, Brzoska, Lesaffre, Coléou and Pieritz2004; Domine and others, Reference Domine, Morin, Brun, Lafaysse and Carmagnola2013): this had a minimal effect on snow smoothing.
In the winter of 2012–2013, the bumps were made by placing lumber battens (38 by 89 mm in cross-section) on the tables (Fig. 4a). In the winter of 2014–2015, we installed triangular surfaces made of galvanized steel of two different heights (76 and 155 mm) and several widths in order to produce triangles with different apex angles (54, 86, 110°) (Fig. 4b and c). The triangles were set sufficiently far apart so that there was no interference between adjacent profiles during snow buildup, except in the case of the three E-triangles, which were separated by 156 mm (E1 profile) and 249 mm (E2 profile) crest to crest (Fig. 4c). Profiles A and B were separated by at least 1.2 m from each other.
Cross profiles of artificial bumps on which snow accumulated. (a) First version of the experiment in 2012–2013 with wooden battens with two periodic spacings. (b) Second version run in 2014–2015 with metal triangular profiles of various sizes on plywood tables. (c) Two series of E-type profiles were used to assess interference effects based on bump separation distances. All dimensions are in millimeters.

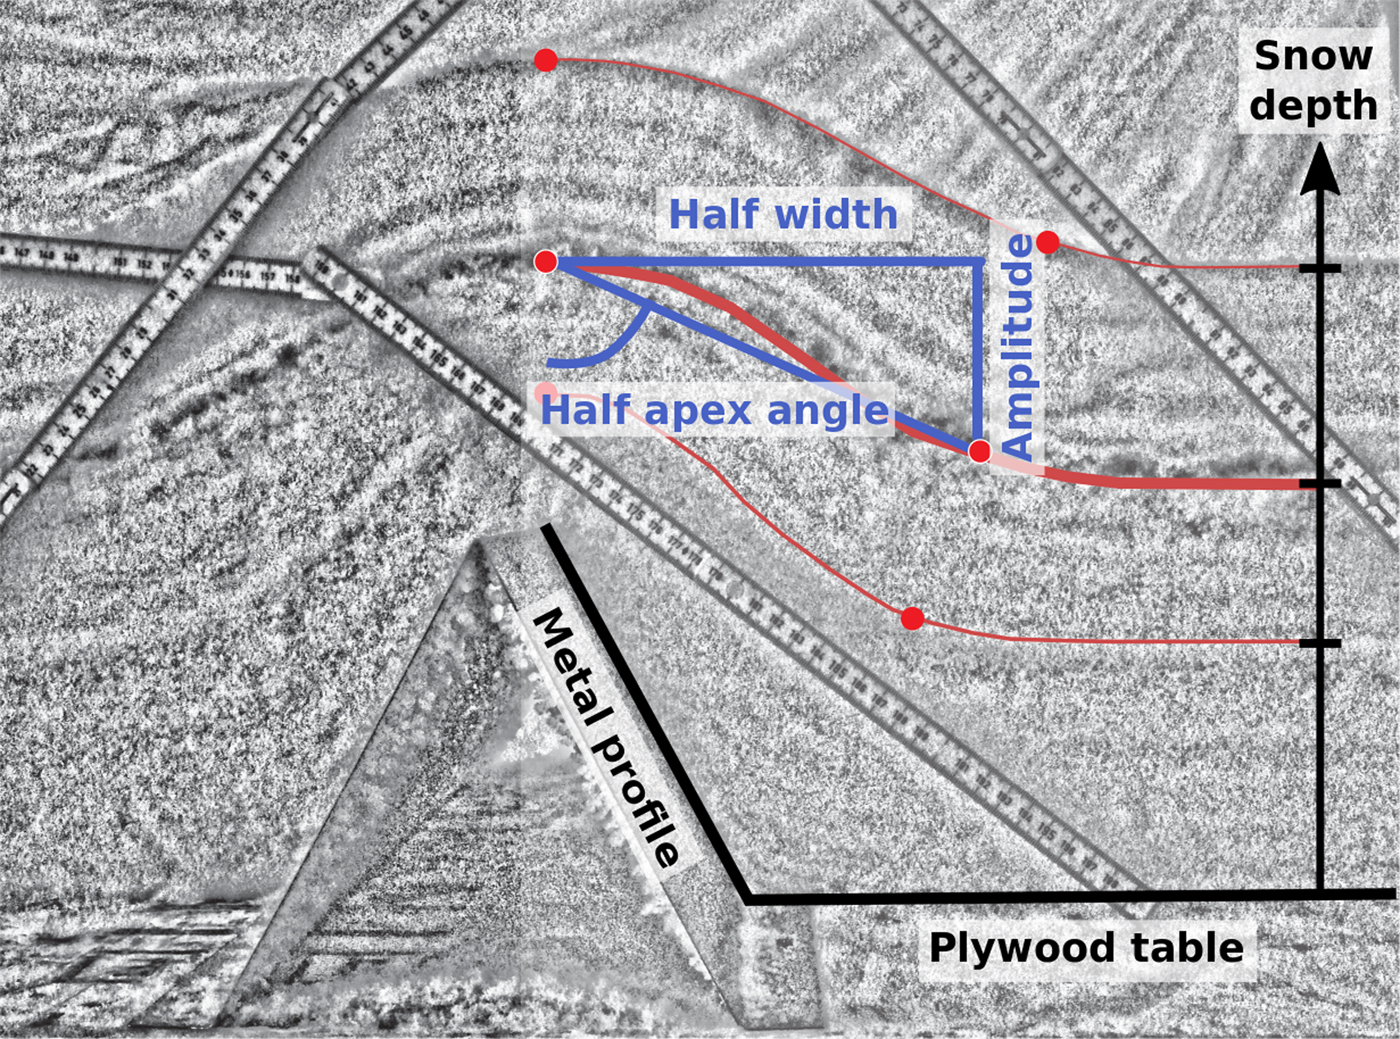
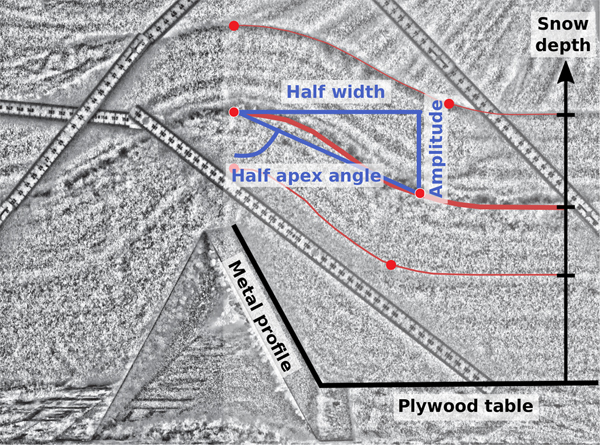
The NIR sections over the bumps revealed the progressive layering in the snow as the depth increased (Fig. 5). The processing pipeline of the NIR images was to first geometrically correct the images with the library Lensfun (http://lensfun.sourceforge.net/), then convert the images to black and white, apply a median filter and a local adjustment of the exposure to enhance contrast locally between layers. We then stitched individual images together using an Adobe Photoshop automatic algorithm as well as manual stitching when the automatic algorithm could not resolve the mosaic tie points. The final stage consisted of scaling the images using a ruler within the frame. From these processed images, we manually extracted relevant metrics including the width and height of progressive undulations in the snow surface in order to track their evolution as snow accumulated. The sharpness (or peakedness) of undulations was quantified by computing apex angle, amplitude and width (Fig. 5). All the processing algorithms were developed using the programing language Python and Scikit-image (Van der Walt and others, Reference Van der Walt2014).
Example of the metrics recorded for one snow surface with the half-width, the amplitude and the half-apex angle (blue lines) from a processed near-IR photo of the snowpack covering a triangular metal profile (A-type) (153 mm high and 156 mm wide). Red curves highlight three of the snow surfaces. Rulers are marked in cm.
3.3. Particle impact and bouncing tracked with a strobe-light
A dark box illuminated by a strobe light (Fig. 3b) was used to photograph falling snowflakes. The box was fully covered except for a vertical slot 40 mm wide parallel to the camera sensor plane. The strobe light had an adjustable frequency. In most cases, 200 Hz was found to be a good compromise allowing visualization of both falling and bouncing particles. The light came from two white LED strips on either side of the box, connected to an open-source micro-controller Arduino® (http://www.arduino.cc). The frequency accuracy of the strobe was checked using an oscilloscope and found to be accurate to ± 3 Hz. We used a digital single-lens reflex Canon 60D camera in video mode at 30 frames·s−1 to capture images of falling particles. The photo resolution was 1920*1080 pixels. The exposure time was fixed at 1/30 s, while the aperture and the sensor sensitivity (i.e. ISO) were optimized for a balanced exposure of the image. We photographed impacts and bouncing from various shapes and surface types (metal, wood, branch, snow).
Videos were split into individual images that were processed using the library OpenCV (https://opencv.org/) by converting them to grayscale images, and then thresholded to differentiate the falling snowflake tracks from the black background. The pixels were scaled using objects of a known size in the picture frame. To estimate fall speed, fall direction and size of falling flakes, we cropped the images to the upper 400 pixels, and extracted the location of the snowflake tracks from the images with a blob detection algorithm (Shapiro, Reference Shapiro1992) as provided in the OpenCV library. We recorded snowflake trajectories during 5 snowfalls for a cumulative total of 1948 individual measurements of particle trajectories using this method.
4. RESULTS
4.1. Snow deposits above and beneath a gap
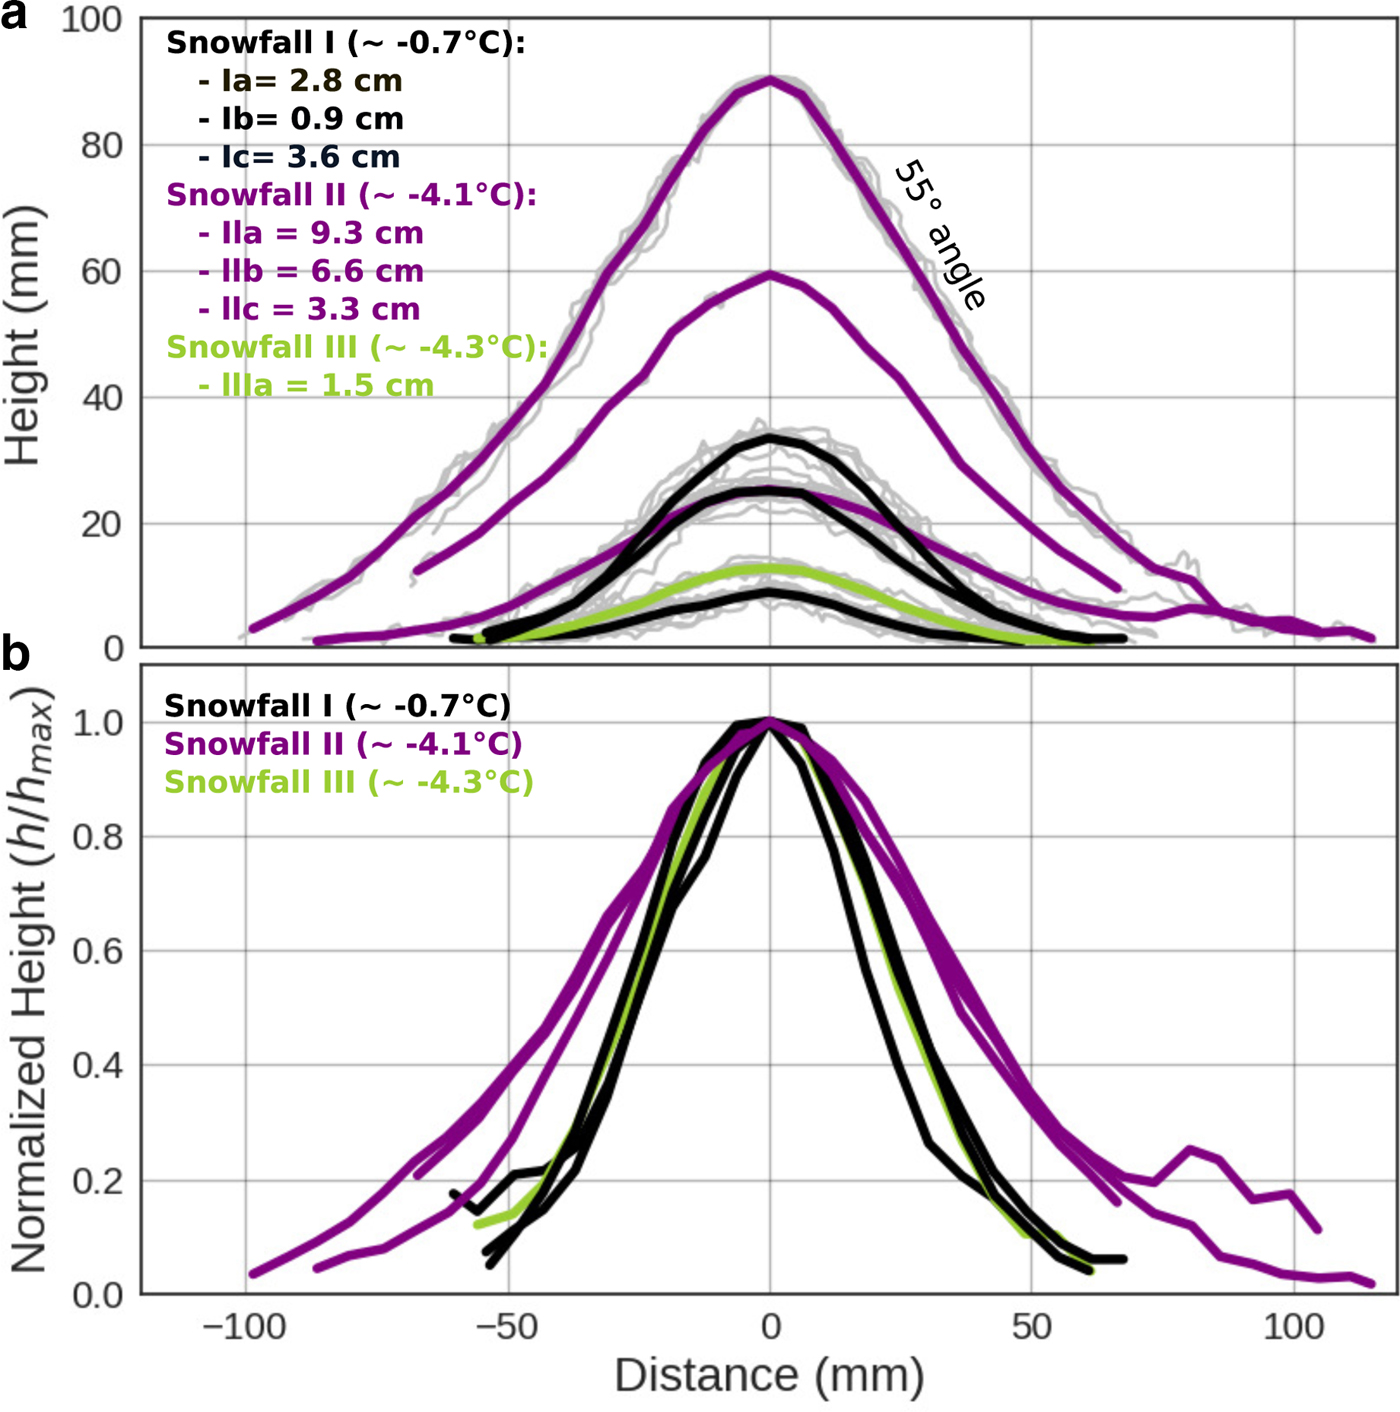
The gap experiment exhibited some of the processes at play leading to lateral displacement of snow particles from their initial fall location. With three sets of environmental conditions from three snowfalls, this experiment also highlighted some of the parameters controlling the rate of smoothing. Snow accumulated in two places, on the flat top of the box, and inside the box after falling through the 40 mm wide gap (Fig. 3a). The lower profiles (Fig. 6a) had a characteristic bell or Gaussian-like shape, and depending on the stage of buildup, were 2–5 times wider than the gap itself, clearly indicating that there had been lateral displacement of particles during deposition. This provides some clues as to the distance over which mechanisms leading to lateral movement of snow could occur (~80 mm). While these profiles were relatively smooth, they had a higher-frequency roughness on the order of a few millimeters that was resolved by our measuring technique. This superimposed ‘white noise’ is similar in scale and form to the roughness described by Löwe and others (Reference Löwe, Egli, Bartlett, Guala and Manes2007) and Manes and others (Reference Manes2008).
Geometry of the lower profiles of snow accumulated under the 40 mm wide gap. The distance is relative to the center of the gap. (a) Measured (gray) and averaged (colored) cross-sections of snow deposits. The roughness at snow particle size is consistent with the findings of Löwe and others (Reference Löwe, Egli, Bartlett, Guala and Manes2007) and Manes and others (Reference Manes2008). The deposits were measured three times during snowfall I and II, then cleared off. (b) Normalized (h/h max) cross-sections based on the data in (a). Black curves correspond to snowfall I (at −0.7°C), purple curves to snowfall II (at −4.1°C) and the green curve to snowfall III (at −4.3°C but with intricate snowflakes).
In sharp contrast to the lower deposits, the deposits on the top of the box adjacent to the gap had slope angles of approximately 90°, yet these deposits consisted of particles of the same shape, size and temperature as below. These steep angles developed rapidly, appearing only after a few centimeters of buildup, suggesting that cohesive and interlock forces played a greater role above the gap than they did below the gap. The contrast in steepness highlights the difficulty in applying the concept of a friction angle, or angle of repose, to snow (Mellor, Reference Mellor1974), and confirms that the angle of repose for snow is dependent on a variety of factors (i.e. friction coefficients, coefficient of restitution, shape and size of particles) as suggested by Al-Hashemi and Al-Amoudi (Reference Al-Hashemi and Al-Amoudi2018), a phenomenon we discuss in more detail below.
We were careful to explore whether some mechanisms other than particle bouncing could have led to the spreading of the deposit below the gap. Because snowflakes have complex geometries, they flutter as they fall (Varshney and others, Reference Varshney, Chang and Wang2013), and can be susceptible to slight air movements. Falling particles were observed in the strobe light experiment to deviate from the vertical by ± 3.2°. These deviations would deposit most particles 35 mm outside the vertical projection of the gap (Fig. 6 and Table 1). Another important mechanism for spreading would have then been bouncing (and related mechanisms like rolling and ejection of already resting particles).
Snowfall events captured using the strobe apparatus

Note: μ is the mean value; σ is the standard deviation. Width corresponds to the width of snowflakes on the images, and fall speed is estimated from two positions left by a snowflake on the strobe images.
The lower deposit profiles, if normalized using h norm(x) = h(x)/h max where h is the surface elevation at the horizontal location x, exhibit distinctive signatures for each snowfall (Fig. 6b). These signatures did not change within the time of a snowfall or with increasing snow height. Snowfall II (air temperature −4.1°C) produced a wider pattern than snowfall I (−0.7°C), suggesting that there was more lateral spreading of snow at the lower temperature, a finding consistent with Kobayashi's (Reference Kobayashi1987) work, where ice particles of lower temperature had higher coefficients of restitution, hence bounced farther. It seems contradictory, then, that snowfall III (at −4.3°C) would have had the same narrow pattern as snowfall I. But micro-photographs of the snowflakes indicate that those falling during snowfall III had the most irregular shapes. As a result, we hypothesize that interlocking of these flakes may have inhibited lateral displacements despite the lower temperature (Appendix A). As a consequence, we would have expected the deposits on the top of the box to be steeper for snowfall III than for the other snowfalls, but if they were, the difference fell below our measurement threshold.
4.2. Snowpack smoothing over artificial bumps
As examplified in figure 1, the accumulation of snow with increasing depth smooths rough topography. While the mechanisms responsible for this smoothing occur at the particle scale, as illustrated by the strobe light experiment, the aggregate behavior of all these mechanisms is best understood by tracking changes in surface characteristics as snow accumulates. We did this by examining changes in surface ‘sharpness’ (apex angle or amplitude (A) to width (W) ratio) as artificial bumps were buried in snow (Figs 4 and 5). Here we define width as the distance between the two points of maximum curvature of the snow surface, and amplitude as the maximum elevation change across the bump. Therefore, the reduction of the apex angle happens as the width of bump increases and the amplitude decreases. As seen in Fig. 7a, the apex angle increases when snow height increases too. We found that snow would smooth a bump in three stages: Stage I (0 to about 70 mm of snow accumulation) when the surface properties are spatially heterogeneous because of a discontinuous snow surface; Stage II (70 to about 150 mm of snow) when the snow surface becomes continuous, but distinct undulations remain, and Stage III (> 150 mm of snow), when the reduction of amplitude reaches a limit, but surface undulations continue to widening (Fig. 7c). For the sharper triangle bumps (A and E), the initial reduction rate in sharpness was significantly higher than for more blunt bumps. But by the time snow depth exceeded triangle height (130–150 mm), the rates tended toward the same value for all bumps (width increasing three times faster than amplitude is declining), indicating that by that point, the rate of smoothing was controlled by snow properties rather than bump geometry. By the end of the experiment, snow bump widths were still continuing to increase, albeit slowly, but bump amplitude and sharpness had reached a steady-state (within the measurement precision).
(a) Reduction in the ‘sharpness’ of the snow surface over the five types of artificial bump as snow depth increased. A ‘fully smoothed’ bump would have a half-apex angle of 90°. (b) Normalized amplitude and width vs normalized increase snow height with respect to the initial bump sizes: the profile amplitude A 0 and width W 0, and the mean snow height  ${\bar h}$ of a given snow surface. (c) Stages of snow buildup around initial bumps. (d) Decrease in amplitude of the snow surface relief as snow accumulates above (blue) a single E triangle, a series of three E triangles separated by 249 mm peak-to-peak (orange) (E2 series), and a series of three E triangles separated by 156 mm peak-to-peak (green) (E1 series).
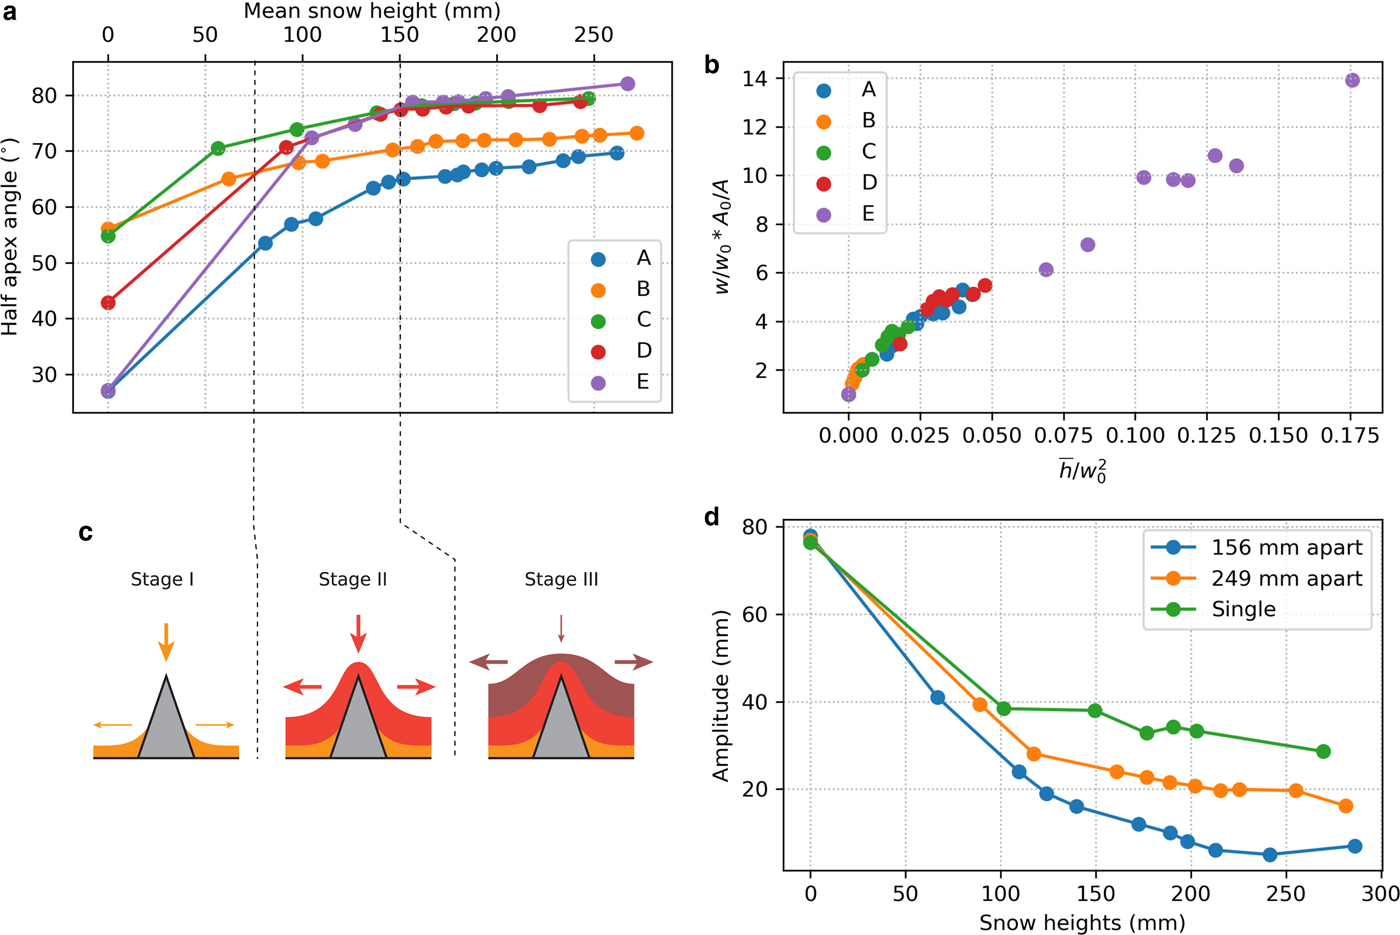
If the same observations are rescaled with respect to the initial bump geometries, amplitude A 0 and width W 0 (Fig. 7b), we then observe that the rate of smoothing for all profiles falls on a continuous curve in the space  ${\bar h}/W_{0}^{2}$ vs W/W 0 * A 0/A , where ${\bar h}$ is the average height of the snow surface, and the subscript 0 indicates the initial value of width or amplitude. To corroborate Fig. 7b, we see that the rate of smoothing is dependent on the ratio between the average snow height and the initial geometry of a bump. When this ratio is low (little snow), the rate of smoothing is high, and then it decreases to reach a constant value of 67.9 over the sharpest bumps (A and E). This suggests that all mechanisms driving smoothing are spatially homogeneous and are independent of the underlying geometry.
To explore this further (Fig. 8), if we assume during a snowfall an average change in snow depth of  ${\bar h}_{i}$, we can look at the relative snow thickness change over a bump as the ratio of the local change in depth Δh(x)i to the mean change in snow depth $\Delta {\bar h}_i$ for this layer. Where this value is greater than one, the snow is effectively filling in holes, and where it is less than one it is reducing thick spots. Figure 8c shows the curvature of layer † and ‡ surfaces, and Fig. 8d shows the relative thickness change of both layers across the profile. We find that the locations that originally had the highest concave curvature are filled while the locations of highest convex curvatures are depleted of snow as indicated by the blue and green lines. While this alignment is not exact, it is because the points of inflexion, by definition the location of highest curvature, move outward from the bump over time. Therefore, if in Fig. 8 we were to examine an infinitely thin layer, we would see both parameters, curvature and change in relative thickness of snow, aligned.
(a) Three snow surfaces derived from a NIR photo-mosaic defining layers † and ‡ over a triangular profile type A. (b) Slopes of the bottom surfaces of layers † and ‡. (c) Curvature of the bottom surfaces of layers † and ‡. (d) Relative thickness changes of the snow layers † and ‡ in comparison to their mean snow thickness on a flat surface. The red dots are visual indicators to highlight the correspondence between surface curvature and the relative thickness of a layer.
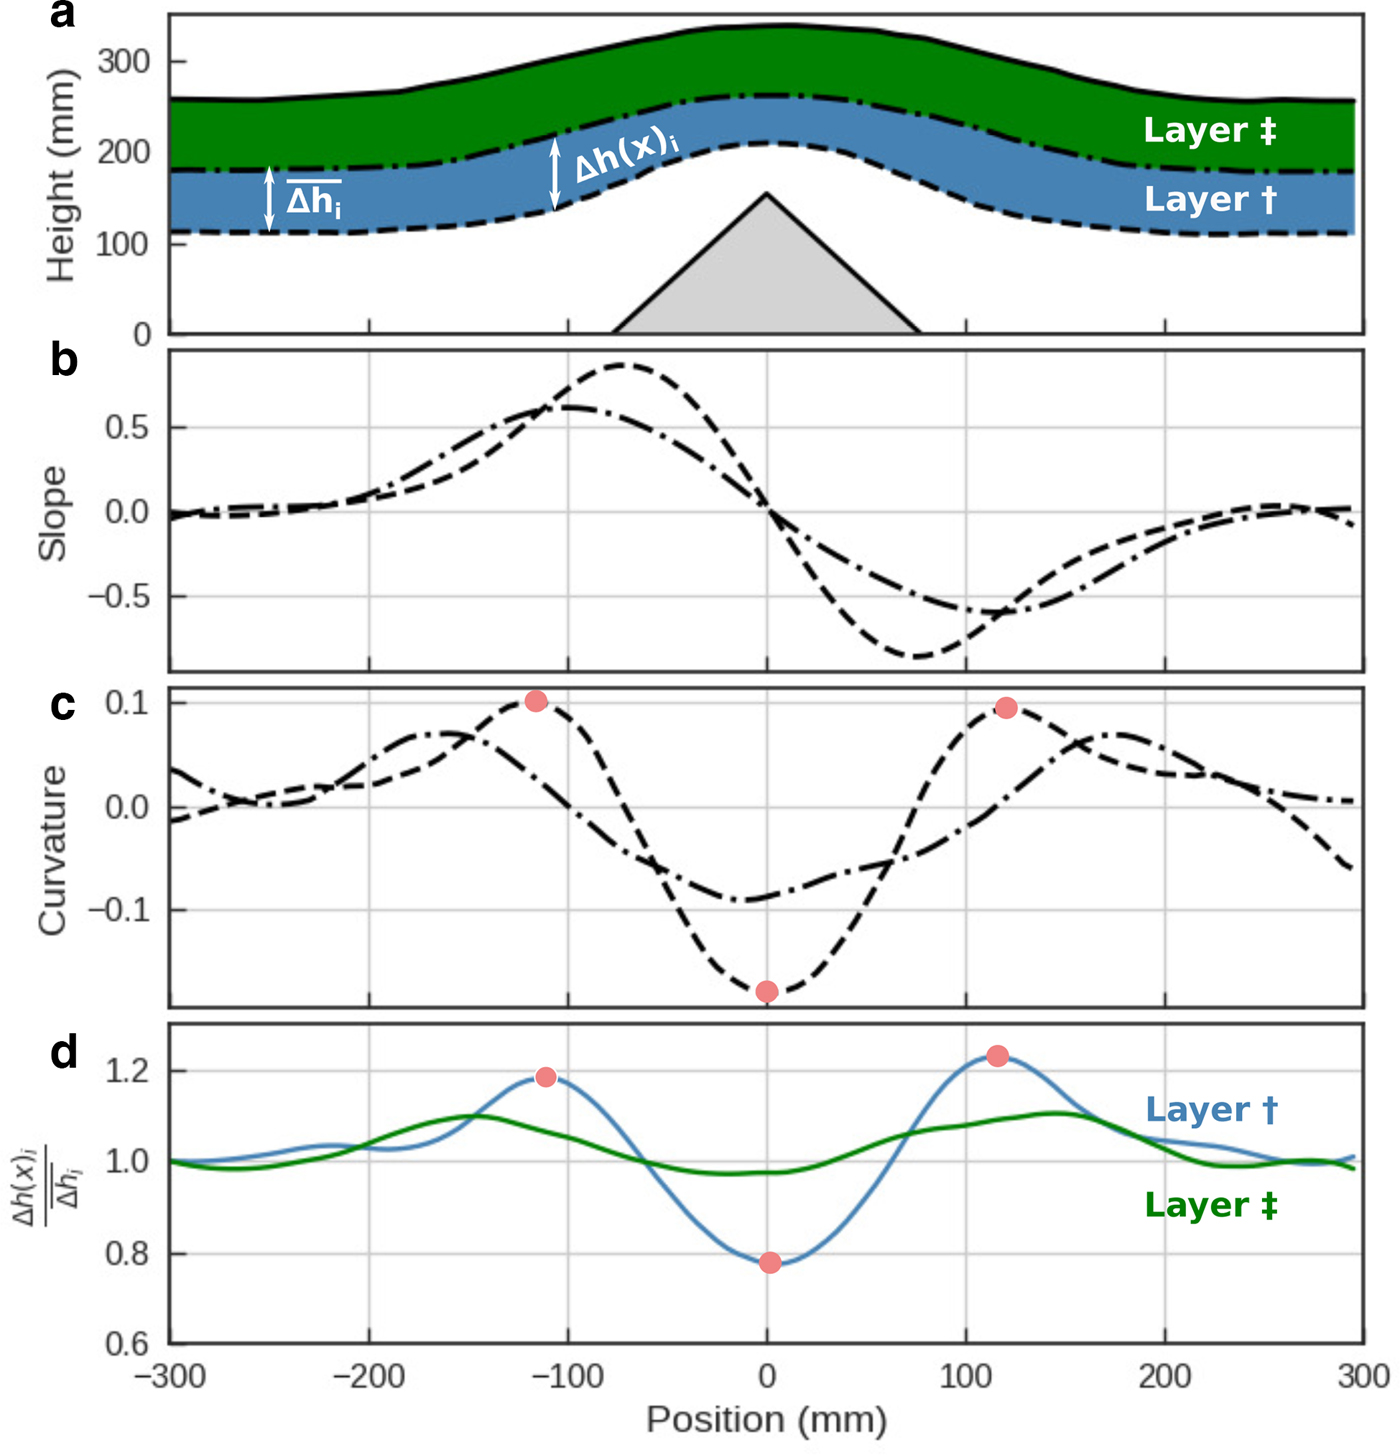
Curvature is a measure of where the surface slope changes, therefore where the gravitational potential changes. This finding links the mechanisms that produce lateral transport of particles (bounce/roll/ejection) to gravity, but in a statistical way: a pre-existing surface slope creates a lateral bias, where more particles bounce down the slope than up. A concave curvature being a point of stability will collect bouncing particles at a higher rate than locations of convex curvature which function in the opposite way. The surface diffusion model (Edwards and others, Reference Edwards and Wilkinson1982) that was implemented by computer vision scientists Festenberg and Gumhold (Reference Festenberg and Gumhold2011) to simulate snow in a virtual reality world describes in a similar manner this smoothing phenomenon with places of highest curvature driving smoothing.
Finally, we used the experiments to examine the impact of bump spacing on smoothing. Bringing bumps closer together accelerates smoothing over any of the profiles tested for (profile P1, P2, E1 and E2). We found that not only did the rate of bump amplitude reduction increases as artificial bumps were brought closer together, but also the total amount of bump reduction went up by as much as 25% (Fig. 7d). The acceleration in the reduction rate was noted even when the added snow depth was less than the distance separating the bumps: e.g., when 70 mm was added to the E1 triangles (which had a peak-to-peak separation of 156 mm but a base separation of 78 mm), and when 120 mm was added to the E2 triangles, which had a base-to-base separation of 171 mm. This behavior suggests that (from the standpoint of smoothing) some constructive interference occurs even before snow reaches the tops of bumps.
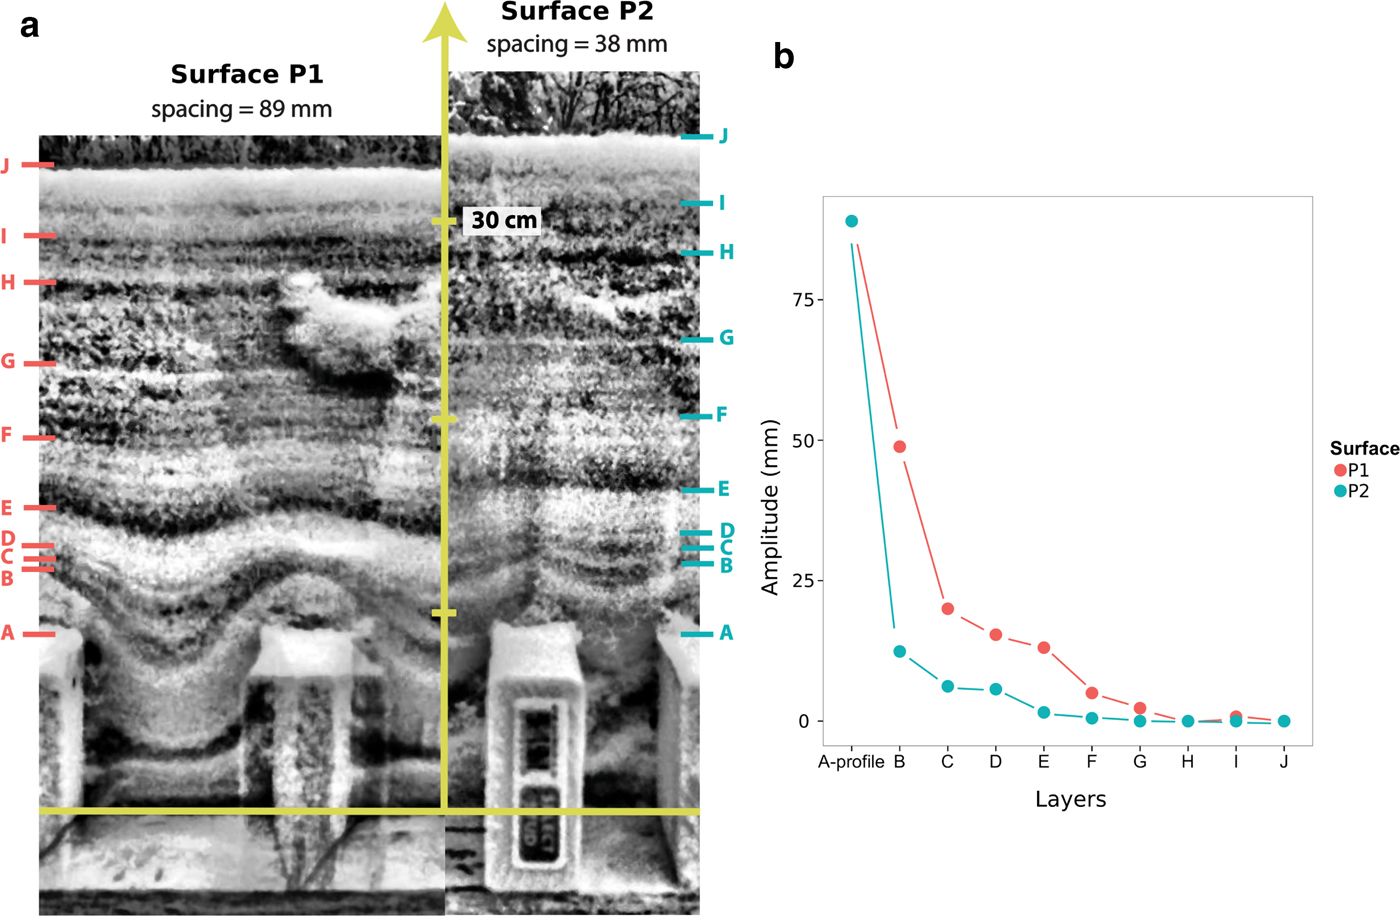
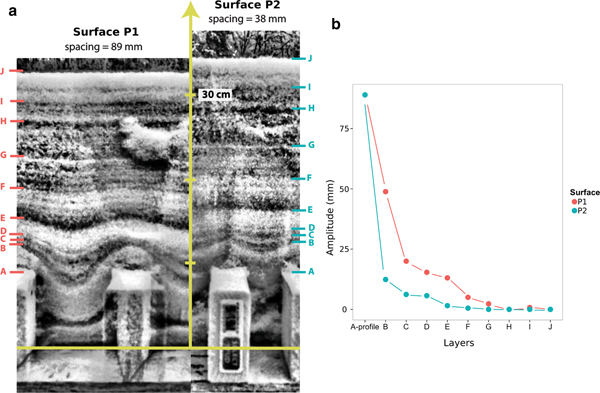
In the case of surface P2, where bumps were the closest to each other, we observed bridging across the two bumps. The space in between the wooden profiles was either filled with less dense snow, or was an air pocket. By definition, bridging requires the buildup of snow with slope angles exceeding 90°. In Fig. 9, over a wide gap (89 mm), no bridging has occurred, but over a narrow gap (38 mm) it has taken place, leaving a void at depth. The effect of the bridging on the smoothing rate can be seen in Fig. 9b, where the reduction in amplitude of the snow surface for the bridging example is much more rapid than for no bridging. The surface shape of the underlying bumps (same height) is gone by the time 140 mm of snow accumulated with bridging, but does not disappear until the snow is 250 mm deep in case of no bridging. The bridging mechanism appears to be particularly important in determining how much snow lodges in the canopy of trees (Bunnell and others, Reference Bunnell, McNay and Shank1985; Schmidt and Gluns, Reference Schmidt and Gluns1991; Pfister and Schneebeli, Reference Pfister and Schneebeli1999), and could play a critical role in the formation of subnivean spaces (Formozov, Reference Formozov1946). In computer vision studies by Fearing (Reference Fearing2000); Festenberg and Gumhold (Reference Festenberg and Gumhold2009, Reference Festenberg and Gumhold2011), they pointed out the importance of bridging in achieving realistic snow scenery, suggesting bridging is a fundamental element in snow cover smoothing. Essentially, due to adhesion, cohesion, interlock and liquid-like layer stickiness, snow is able to bridge gaps even in the absence of wind. The bridging is controlled by the spacing of the underlying micro-topographic features on which the snow falls, as well as the ‘stickiness’ of the falling snow.
(a) NIR images of snow strata above surface P1 (left) and surface P2 (right). Note how the lowest strata dip down into the cavity between blocks for surface P1, but bridge over the gap for surface P2, leaving a void space. The blocks are standard American lumber (89 mm high by 38 mm wide). (b) The amplitude reduction for two of the layers marked in Fig. 13a.
4.3. Falling snowflakes at impact
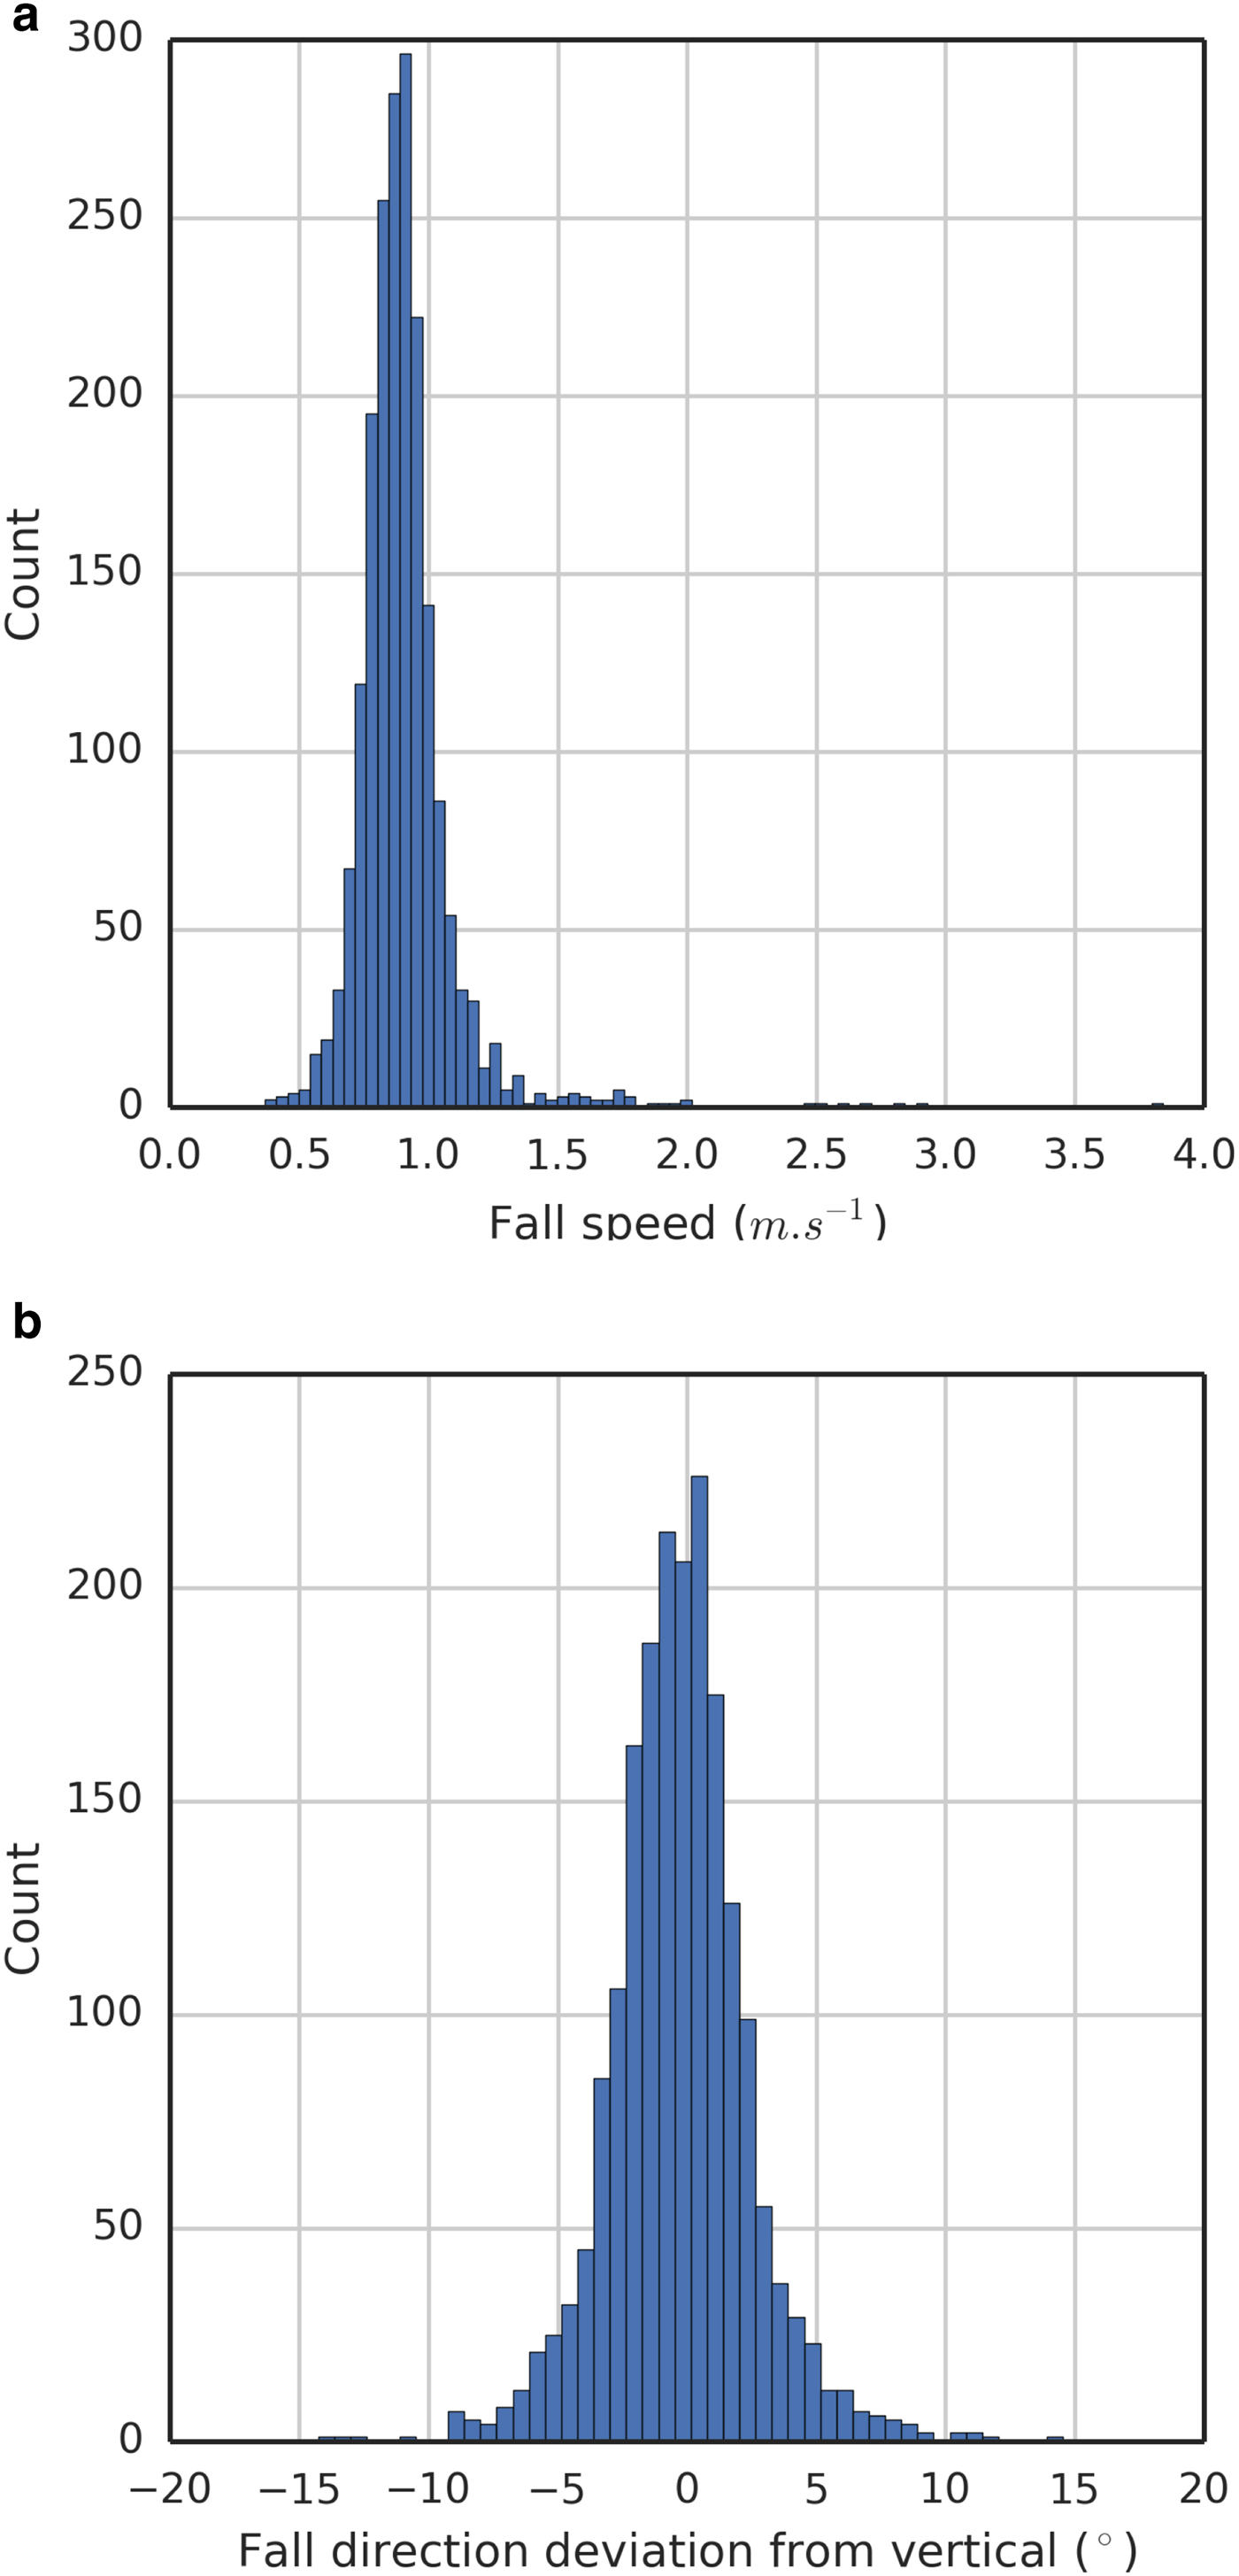
The elasticity of snow particles, as well as their fall speeds, affect how they bounce on impact. So too does the nature of the surface they hit (snow vs non-snow). The mean particle fall speed for all of our observations was 0.9 ± 0.2 m · s−1. A comparison of these data to speeds reported by Langleben (Reference Langleben1954) and Locatelli and Hobbs (Reference Locatelli and Hobbs1974) suggests that our values are typical for unrimed stellar dendrites and sector plates. Since our experimental technique could not resolve the three-dimensional path of the snowflakes (that would have required a minimum of two synchronized cameras), the distributions shown in Appendix B and Table 1 represent the projection of the three-dimensional paths in a two-dimensional plane (the camera focal plane), but the correction for the third dimension is likely to be minor. The falling particles had complex shapes, but based on their fall speeds, they can be approximated as thin hexagonal prisms with long axes that averaged 1.74 mm (Table 1) and fall speeds of 0.9 m · s−1. If we assume the thickness of these prisms to be 1/10 their width, then on average, particles would have impacted with a kinetic energy of about 1.5 × 10⁻⁷ joules.
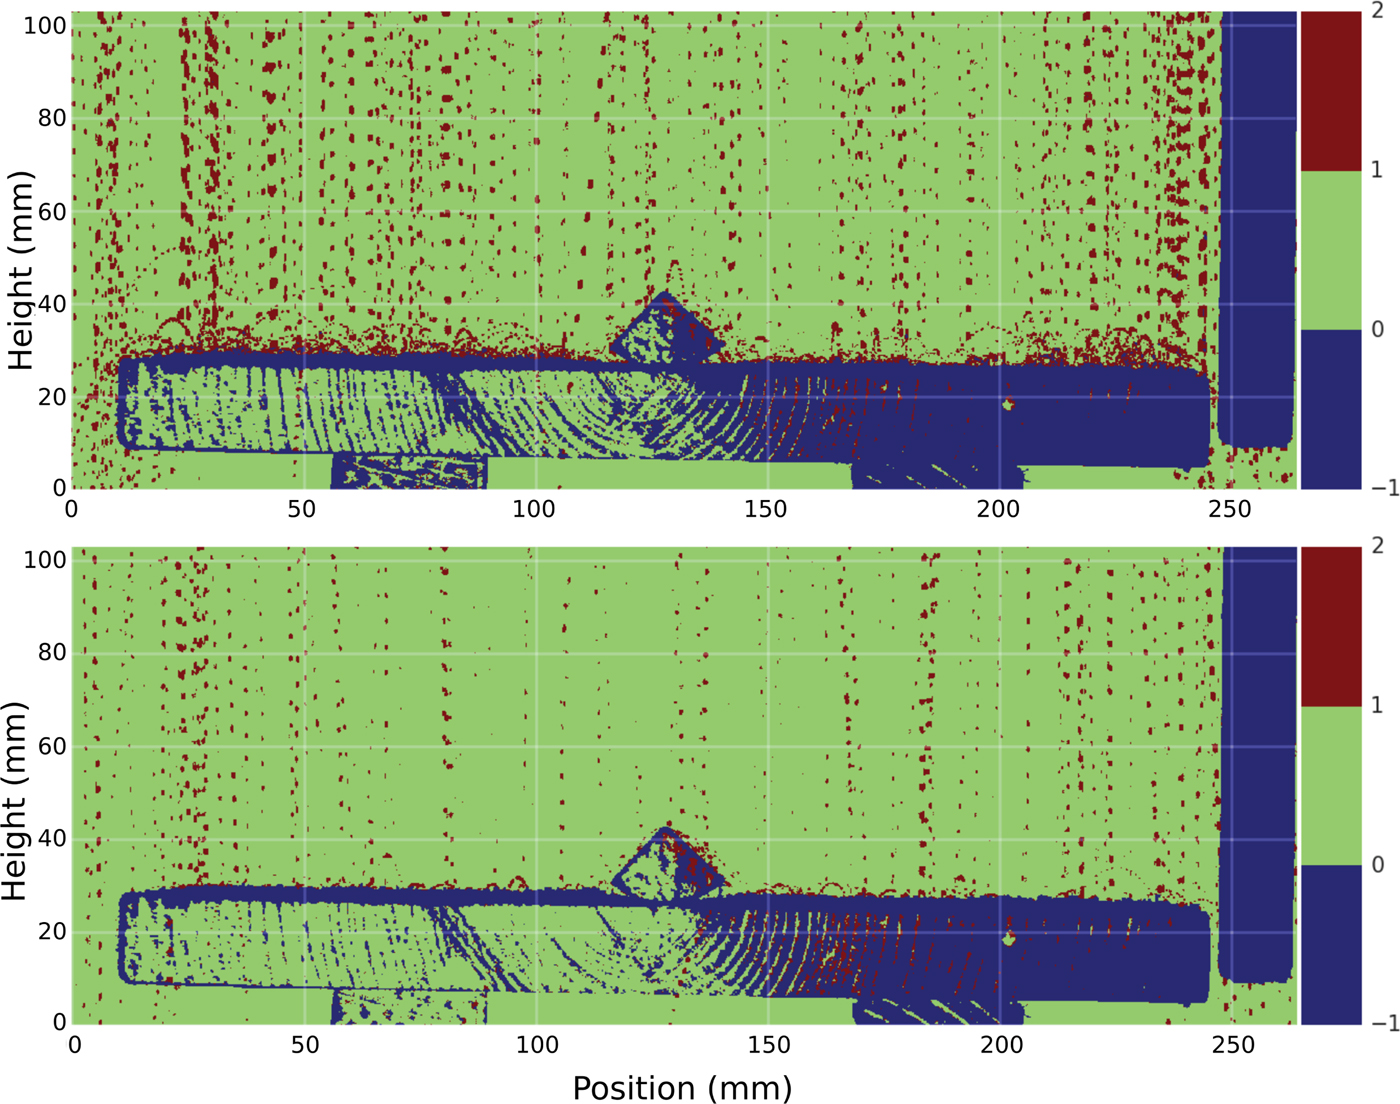
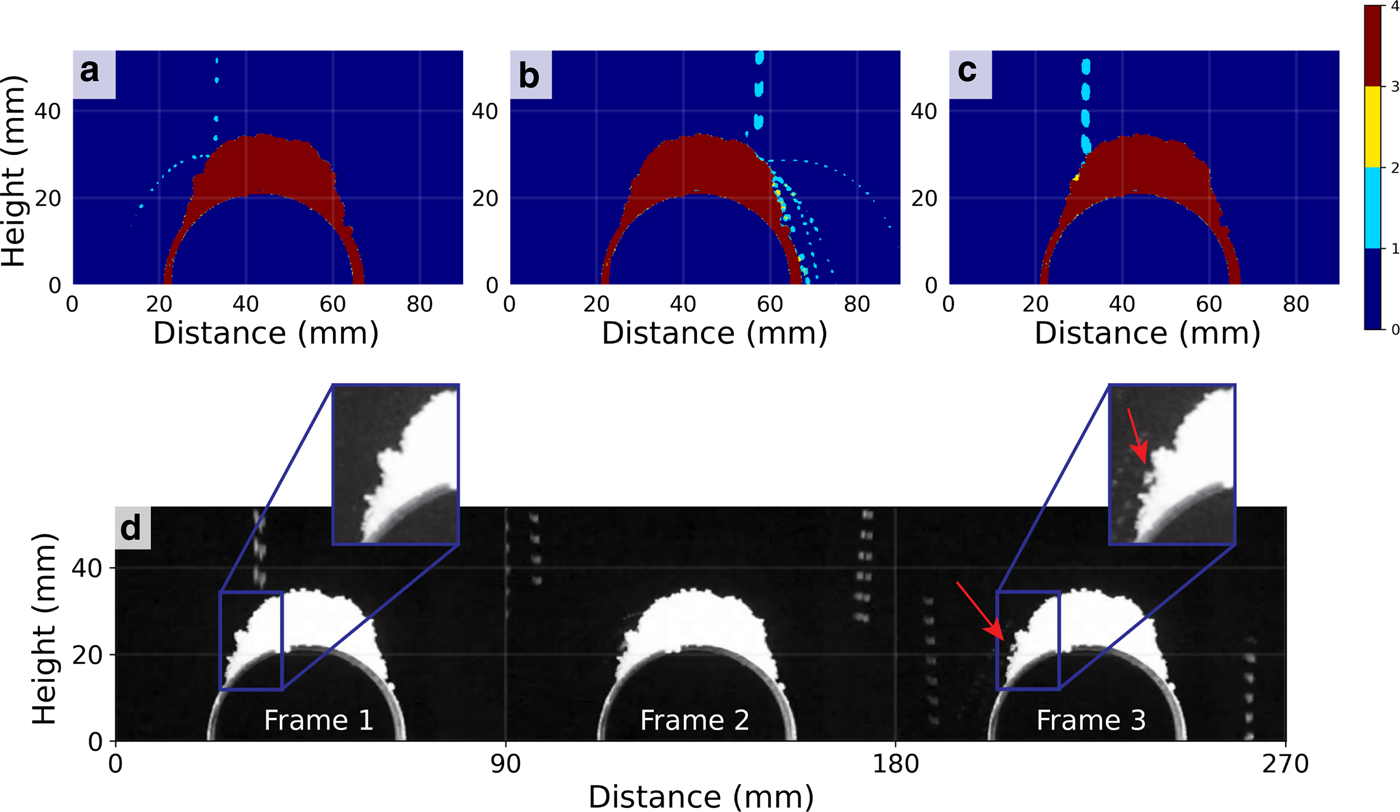
A wide range of bounce behaviors and distances was observed (Fig. 10), with distinct differences depending on the nature of the surface from which the particles were bouncing. For example, at the start of snowfall VI snow particles were falling on bare wood and were bouncing as much as 44 mm sideways and 23 mm high (Fig. 10a), whereas later as in Fig. 10b, they fell on wood covered by a thin (~1 mm) layer of snow reducing the bounce distance to less than 5.3 mm (with reduction in bounce height to 3.4 mm). Substantial lateral bounce-driven displacement was observed even when fall trajectories were vertical, suggesting that micro-scale roughness of both the board and the snow produced non-vertical bouncing. The reduction factor in bounce distance due to a compliant (snow-covered) surface was surprisingly high, nearly eight times.
Snowflake strobe trajectories during snowfall VI; (a) landing and bouncing on a clean wooden surface (1000 frames combined), (b) landing and bouncing on a wooden surface covered with a thin (~1 mm) layer of snow (2000 frames combined). Notice the significant decrease in bounce height on the snow-covered surface. The gaps in the trajectories are due to the refresh time of the CMOS sensor of the video camera recording at 30 Hz. In these composite images, blue indicates that a pixel reflected the strobe light more than two times (and was a fixed surface). Green means that a pixel never reflected light during the period over which the frames were compiled (no target), and red indicates the pixels reflected light only once, the case for falling and bouncing snowflakes. For both composite images, the air temperature was −4.3°C.
To focus on the behavior of a single snow particle during impact, we placed a 45 mm diameter copper pipe in the frame, then observed impacts when the pipe was snow-covered. We observed four different classes of interactions, all of which produced some lateral displacement:
(1) elastic bounce of the falling particle (Fig. 11a),
(2) ejection of multiple smaller particles that were at rest when hit by a falling particle,
(3) breakage of particles at the surface, then ejection (Fig. 11b),
(4) retention of the falling particle at the snow surface due to strong cohesion and/or interlock (Fig. 11c and 11d) with surface displacement and compaction.
Impact interactions of snow particles with snow on top of a copper pipe 45 mm in diameter: (a) bouncing, (b) breakage, ejection and bouncing, (c) displacement of surface particles, and possibly downslope rolling, and (d) a sequence showing a particle impacting and locking into a overhanging position. In (a), (b) and (c), the color scale corresponds to the number of times a pixel recorded the presence of a particle, with light blue being a single registration, yellow being several registrations and red being registered in all frames. All spatial coordinates are in millimeters.
For example, when the particle in Fig. 11c impacted the surface, instead of bouncing, it either rolled to its final position, or impacted and deformed the lattice of resting particles, pushing them outward. In Fig. 11d, the particle falling vertically moved down slope upon impact, ejecting or breaking other snow particles, though one particle remained interlocked with other particles and only moved a short distance.
5. DISCUSSION
Most of the set of particle-scale mechanisms that produce smoothing as snow accumulates over a surface were known (or inferred) (Fig. 2) prior to our work, but our experiments have clarified and added to our understanding how these mechanisms function, combine and interact. Snow smoothing is the result of the entire ensemble of mechanisms, operating on many particles, with the relative importance of each mechanism changing over time as the weather, the particle characteristics, the fall speed and the surface itself undergo change. While individual particle–particle or particle–surface interactions undoubtedly follow Newtonian physics, because so many mechanisms are underway at the same time, and so many particles are in play, a statistical approach is needed to describe the full system. In the case of the experiments described above, typically 100–1000 particles or more were likely interacting at any site. We suggest that the snow smoothing system is analogous to that of gas diffusion experiment, where the specific interactions of molecules may be deterministic, but where there are enough molecules involved, stochastic behavior contributes in producing the overall concentration state.
From prior work (Kobayashi, Reference Kobayashi1972, Reference Kobayashi1987; Schmidt and Gluns, Reference Schmidt and Gluns1991) and the results of our third experiment (visualizing bounce trajectories with a strobe light; see Figs 10 and 11) we can summarize the mechanisms that contribute to snow smoothing (Fig. 2). Snow particles can bounce and roll on impact; they can break and eject other particles, filling holes in the snow surface. These mechanisms tend to enhance lateral transport. A second set of mechanisms (adhesion, cohesion, electrostatic charges and physical interlocking) are antagonistic to lateral transport in most cases, and can be thought of as immobilizing particles. This set appears to be critical in developing both small-scale roughness in snow and in bridging gaps (Figs 11 and 9). A careful exploration of these immobilization mechanisms would be well worth undertaking because it appears they are one reason why tree canopies are so readily loaded by snow. We should note that all of the smoothing mechanisms described above operate nearly instantaneously, but three longer time-scale mechanisms also affect smoothing: sintering, metamorphism and deformation of the snow lattice (creep) (Fig. 2).
Our first and second experiments (snow deposits through a gap and snow covering bumps) were aimed at understanding the cumulative effects of the mechanisms in Fig. 2 on snow surface smoothing. The latter experiment (snow covering bumps) produced results we might have anticipated but are still useful: (a) that there are distinct stages in the smoothing process related to the ratio of the bump relief to the depth of snow (Fig. 7), and (b) that gravity drives smoothing where surface slope and curvature create lateral transport biases when falling particles interact with surfaces. Even particles falling on flat surfaces (Fig. 10) can move laterally through bouncing, albeit without a left or right bias in the two-dimensional plane. But when the snow is deposited on a surface with a pre-existing slope (Fig. 8), gravity induces in a statistical way a lateral bias in the bounce/ejection/roll mechanisms. The bump experiment also highlighted that spacing matters (Fig. 9), because when bumps are spaced closely enough, immobilization mechanisms aid in bridging gaps, again accelerating the smoothing.
Our gap experiment (Fig. 6) while qualitatively useful, was flawed in that we were not able to separate quantitatively the several mechanisms in operation. In principle, comparing the snow deposits above the gap to those beneath should have revealed something about the relative strength of immobilizing mechanisms (lock-up) vs mechanisms that promote lateral transport (bounce, etc.), and while it did to an extent, the comparison is at best relative. The slopes of the upper deposits were far steeper than the slopes of the lower deposits, suggesting that lock-up mechanisms dominated above, while bounce/roll/ejection dominated below. But as designed, the experiment could not eliminate mechanisms in one location or another so the end results are mixed. There is still value in this type of experiment: a simple modification such as increasing the width of the gap to obtain a flat region (equivalent to maximum accumulation) in the middle of the bottom accumulation could help differentiate between environmental effects, geometry and other mechanisms at play. Nevertheless, the experiment is an excellent example of the effect of factors such as coefficient of restitution, friction coefficients on the resulting angle of repose (Al-Hashemi and Al-Amoudi, Reference Al-Hashemi and Al-Amoudi2018), as the only differences between the top and the bottom locations in the experiment was the geometry of the apparatus and the mean kinematic energy of incoming particles. For a material to develop a friction angle from an angle of repose, it needs to be a truly granular material without cohesive or adhesive forces acting on it, but as Fig. 2 clearly demonstrates, snow does not fit this definition: the differences in slope angle are due to differences in the relative strength of the mechanisms at work.
We counted 15 mechanisms occurring simultaneously either promoting smoothing or roughening, or inhibiting smoothing. On a short timescale (within seconds) mechanisms such as non-vertical fall of particles, bouncing, rolling, ejection and breakage are promoting lateral displacement of particles and therefore enhancing smoothing. Cohesion, adhesion, interlocking and possibly electrostatic can either promote roughening of the surface or inhibit smoothing. Packing and clustering of particles have uncertain effects on the accumulation of snow and its results on surface geometry. Also, on a much longer time scale (hours to days), mechanisms like snow metamorphism and creep can aid in smoothing, though not considered in our experiments. Sintering, by hardening the bulk snowpack can inhibit deformation of the snow surface. Lastly, the spatial variability of snow influx can either create new roughness, or smooth out underlying geometries (cf. the gap experiment).
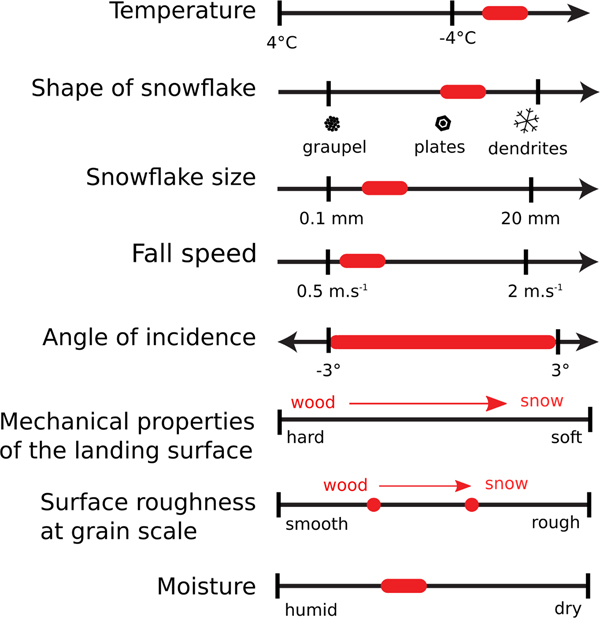
But even if we understood all the mechanisms at work during smoothing (we do not), and knew how best to approach the problem of multiple particle interactions (also problematic), we still lack the necessary knowledge needed in modeling smoothing by snow. We have only the most rudimentary information on how the various mechanisms change with temperature, humidity, particle size and shape, fall speed, and so on. In short, we lack the experimental basis for constitutive equations that could drive either Newtonian or statistical modeling. Yet these constitutive relationships are needed if we want to predict how a particle will interact when it impacts a surface. Further, since the interaction depends on the surface properties and geometry as well, there is a wide range of geometries and materials over which these would need to be explored. In Fig. 12, we can at least provide a preliminary set of schematics that suggests the environmental controls and particle variables that would need to be included in this exploration. Discrete element methods, used with these parameterizations, could be ideal for this type of exploration. As an example, the Disney Studio built a point Lagrangian model to simulate realistic-looking snow for the animated movie ‘Frozen’ (Stomakhin and others, Reference Stomakhin, Schroeder, Chai, Teran and Selle2013).
Controls on the processes producing lateral displacement of snow particles. The black lines indicate the possible range of variability for each control, and the red arrows and regions indicate the range over which these variables evolved during the snowfalls during our experiments.

Smoothing as a function of scale. At particle scales (0.1–50 mm), cohesion of particles creates particle clusters that can produce increasing roughness. At local landscapes scales (1 cm to 50 m), the processes discussed in this paper can produce smoothing due to lateral displacements biased toward surface concavities (holes). The wind can increase bounce distances (saltation) by a factor of 10X and introduces a strong directional bias that can result in smoothing at scales of 100 m to more than 1000 m. Between about 50 mm and 1 m, the outcome of snowfall (smoothing vs roughening) can vary, and much remains to be learned concerning the interaction of processes and substrate at this scale. Notably, this is exactly the scale at which snow loading of a forest canopy takes place, and suggests why the set of processes at this scale have been called staggeringly complex (Schmidt and Gluns, Reference Schmidt and Gluns1991). The black and white insets suggest the nature of the snow roughness at that scale.

There are important scaling issues associated with snow smoothing. Both immobilizing and displacement mechanisms have inherent, but different, scale lengths based on particle size and the nature of particle interactions. For example, bouncing appears to able to move particles a distance of up to 80 mm; immobilization mechanisms seem to limit particle movements to short distances of about 4 mm. Similarly, ballistic effects (Barabási and Stanley, Reference Barabási and Stanley1995; Löwe and others, Reference Löwe, Egli, Bartlett, Guala and Manes2007) are known to produce snow roughening as cohesion and interlock causes particles to cluster. Irregular particles like stellar dendrites lock-up more readily than rounded particles like graupel, meaning the initial nature of the falling particles matter at this scale, but overall, the size of these structures appears limited to a few tens of particles, with an extreme upper limit of 100 mm. Clustering therefore can add a white noise to the snow (Fig. 1), but not increase the overall topographic roughness. At scales humans tend to perceive as ‘landscape’, our sense is that smoothing generally dominates. Between these two scales, some transition must occur, as we suggest in Fig. 13. Interestingly, wind, which we have not considered here, might be thought of as a lateral bias enhancer, or bounce amplifier, which helps to explain why windblown snow surfaces (excluding surface bedforms) can smooth landscapes at scales 10–100 times greater than snow smoothing without wind.
Lastly, as mentioned previously, snow deposition on conifer branches takes place in similar ways to those observed in our experiments (Schmidt and Gluns, Reference Schmidt and Gluns1991). Given the roughening length scale depicted in Fig. 13 (1 to about 100 mm), it is interesting to note that the size of conifer branch elements (needles to twigs) also fall within the same range. Conifer trees are also among the most widespread and better fitted to cold climates and abundant snow winters (Okitsu and Ito, Reference Okitsu and Ito1984; Hammarlund and others, Reference Hammarlund2015). Could this suggest a possible ecological adaptation to snow interception?
6. CONCLUSION
Here we have investigated the mechanisms by which snow can smooth out (or potentially roughen) a landscape, examining the mechanisms over a series of artificial surfaces ranging from 0.001 m to several meters in length, all done in the absence of wind. Smoothing was achieved through the lateral displacement of particles during and immediately following deposition with particle bounce, roll and ejection the chief mechanisms of displacement. From hard surfaces, lateral bounces up to 80 mm were possible; from snow surfaces, bounce distances were reduced dramatically. Allowing natural snowfall to buildup over artificial bumps, we found very rapid reduction in surface amplitude and sharpness, with the rate of amplitude and sharpness reduction dropping rapidly once bumps were completely covered by snow. As the amplitude of the snow surface over the bumps was reduced, the width of the undulations above the bumps increased at a rate three times greater than the amplitude reduction. For bumps close together, this widening of disturbances resulted in constructive interactions, accelerating the rate of smoothing. Three stages in the smoothing process were identified: Stage I where surface properties were heterogeneous because the snow surface was not yet spatially continuous; Stage II when the snow surface was continuous, but distinct undulations remained; and Stage III, where amplitude reduction had reached a limit, but undulation widening continued.
Based on data from this study and others, we have identified 15 particle-scale mechanisms at work in smoothing (Fig. 2), 11 of which happen within seconds of deposition. Of these 11 fast mechanisms, five mechanisms (non-vertical fall, bounce, roll, ejection and breakage) are effective at producing lateral transport and therefore generally promote smoothing, four other mechanisms (cohesion, adhesion, mechanical interlock, and potentially electrostatic) tend to immobilize particles, and two mechanisms have an uncertain effect (packing and clustering). In some cases, clustering, which up to scales of a few centimeters results in an increase in roughness, can at larger scales produce either roughening or smoothing. Combined with the other mechanisms, it can lead to snow bridging, which is highly effective in creating a smoother landscape. On a longer timescale, from hours to days, the spatial variability in snowfall will produce a change in surface shape producing new features while smoothing others (see the gap experiment). The metamorphism of snow particles and their potential to creep when in bulk can accentuate smoothing. And last, sintering of snow particles hardening the bulk properties of a snowpack can reduce smoothing.
Ballistic models of snow deposition have been developed, and suggest that particle clustering through random processes produces increased roughness, but these studies have only examined scales of about 50 mm or less. It is clear that the outcome of snowfall is scale dependent, with both roughening and smoothing possible. We suggest here that the main scale breaks occur at around 10, 100 mm and 100 m. Particle scale mechanisms dominate below 10 mm and may be modeled using ballistic models; above 100 mm lateral displacement favors smoothing. To date, no models are available to describe this process, though descriptively, results can be obtained using a diffusive-type model, or through low-pass filtering. Above 100 m, smoothing generally requires the wind, which acts as a bias enhancer, and bounce amplifier. We note with some interest that what happens at scales between 10 to 100 mm is not well known and that this is exactly the scale at which branches and snow in conifers can be found.
To us, snow smoothing of a landscape seems somewhat remarkable, with few if any other analogs on Earth that include similar processes. The phenomenon requires three unique things: (1) particles that can fall uniformly from the sky, (2) that can bounce, but (3) can also readily adhere or cohere to branches, plants, soil or other snow particles. Neither sand, dust, nor ash seems to be able to do this, though they do precipitate out over wide areas. The process of snow smoothing is so common, the phenomenon has taken on psychological and aesthetic dimensions for humans, appearing in art and used as metaphor. It is surprising then that we still have only the most rudimentary understanding of what is actually happening, and what is controlling the outcome. That understanding surely has some practical value, but even if it did not, understanding such integral part of our world would still be worthwhile. We hope the new results, and our organization of these and older results, will stimulate more work on this fascinating and aesthetic process.
ACKNOWLEDGMENTS
We would like to thank the people providing help to the project: Jason Jack for providing us a space to run the experiment, Christopher Hiemstra for lending the NIR photographic equipment, as well as Martin Truffer, Jerry Johnson, Doug Brinkerhoff, Marc Oggier and Javier Fochesatto for fruitful discussions. We are deeply grateful to Christopher Larsen and Hajo Eicken for their comments on the manuscript. This project was funded by the National Science Foundation (AON-SnowNet-II) OPP grant 1023052. The Alaska Climate Science Center also supported this research through Cooperative Agreement G10AC00588 from the United States Geological Survey. The contents are solely the responsibility of the authors and do not necessarily represent the official views of USGS. This work was also partly supported by the Norwegian Research Council's - Enhancing Snow Competency of Models and Operators (ESCYMO) project (NFR no. 244024). Data used in this publication are available online from the International Arctic Research Center data archive at the following URL: https://climate.iarc.uaf.edu/geonetwork/srv/en/metadata.show?id=693
APPENDIX A.
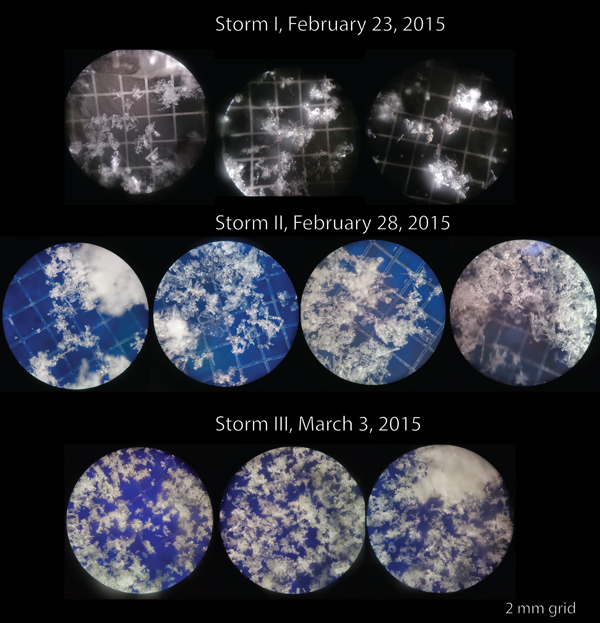
The set of handheld microscopic photographs for the three snowfalls provide an idea of the types and sizes of snowflakes falling and constituting the accumulation mound observed in the closed-box experiment. Snowfall I and II had snowflakes of similar sizes (~1 mm), whereas snowfall III had snowflakes of smaller sizes (< 1 mm) with more intricate shapes; bright and white snowflake is indicative of strong light scattering, occurring due to complex geometry. Backgrounds are 2 mm grids

APPENDIX B.
Histograms for 1948 snowflake trajectories showing the distribution of fall speed (a), and deviation with respect to vertical (b).


 Open access