


I. INTRODUCTION
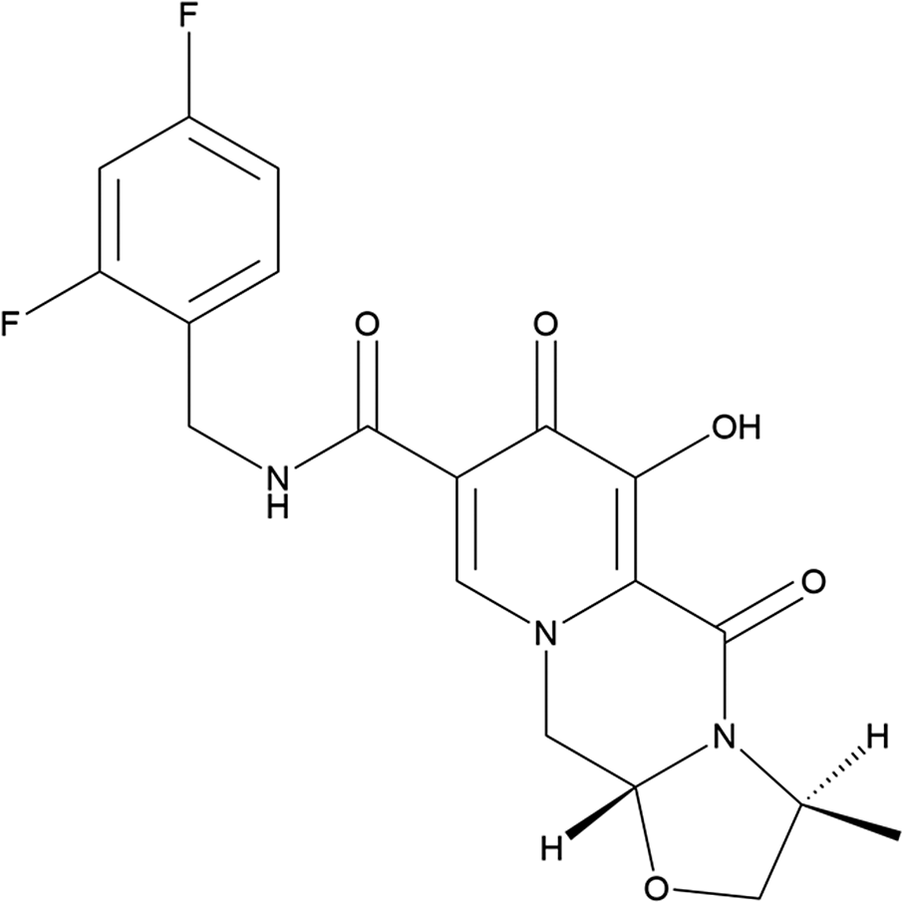
Cabotegravir (sold under the brand name Vocabria, among others) is used for the treatment of HIV/AIDS. Cabotegravir is an HIV-1 integrase strand inhibitor and can be administered alone or in combination with rilpivirine. The systematic name (CAS Registry No. 1051375-10-0) is (3R,6S)-N-[(2,4-difluorophenyl)methyl]-10-hydroxy-6-methyl-8,11-dioxo-4-oxa-1,7-diazatricyclo[7.4.0.03,7]trideca-9,12-diene-12-carboxamide. A two-dimensional molecular diagram of cabotegravir is shown in Figure 1.
The two-dimensional structure of cabotegravir.

Preparation of cabotegravir is claimed in International Patent Application WO 2011/119566 A1 (Wang et al., Reference Wang, Goodman, Mans and Kowalski2011; GlaxoSmithKline). A new crystalline Form B of the sodium salt of cabotegravir is claimed in European Patent 3363802 B1 (Adamer and Thaler, Reference Adamer and Thaler2017; Sandoz), and powder data for Form B and the prior art Form A are provided. Powder data for crystalline cabotegravir prepared according to Example D of WO 2011/119566 are also provided. A powder pattern for crystalline cabotegravir is also reported by Zhou et al. (Reference Zhou, Su, Dash, Lin, Shetty, Kocher and Szlachetka2018). An orthorhombic unit cell, determined by 3D electron diffraction, with a = 7.26, b = 7.29, and c = 32.3 Å, was reported by Johnstone et al. (Reference Johnstone, Copley, Graves, Brum and Midgley2019). A synchrotron powder pattern from this study of a commercial sample of cabotegravir bears only a slight resemblance to those of Wang et al. (Reference Wang, Goodman, Mans and Kowalski2011) and Zhou et al. (Reference Zhou, Su, Dash, Lin, Shetty, Kocher and Szlachetka2018) (Figure 2), and we are hard-pressed to conclude that it is the same as the prior art. The cell reported by Johnstone et al. (Reference Johnstone, Copley, Graves, Brum and Midgley2019) does not index this pattern.
Comparison of the synchrotron pattern of cabotegravir (black) to those reported by Adamer and Thaler (Reference Adamer and Thaler2017) (red) and Zhou et al. (Reference Zhou, Su, Dash, Lin, Shetty, Kocher and Szlachetka2018) (green). The literature patterns (measured using Cu Kα radiation) were digitized using UN-SCAN-IT (Silk Scientific, 2013) and converted to the synchrotron wavelength of 0.819563(2) Å using JADE Pro (MDI, 2024). Image generated using JADE Pro (MDI, 2024).

This work was carried out as part of a project (Kaduk et al., Reference Kaduk, Crowder, Zhong, Fawcett and Suchomel2014) to determine the crystal structures of large-volume commercial pharmaceuticals and include high-quality powder diffraction data for them in the Powder Diffraction File™ (Kabekkodu et al., Reference Kabekkodu, Dosen and Blanton2024).
II. EXPERIMENTAL
Cabotegravir was a commercial reagent, purchased from TargetMol (Batch #T6098), and was used as received. The white powder was packed into a 0.5-mm-diameter Kapton capillary and rotated during the measurement at ~2 Hz. The powder pattern was measured at 298(1) K at the Wiggler Low Energy Beamline (Leontowich et al., Reference Leontowich, Gomez, Diaz Moreno, Muir, Spasyuk, King, Reid, Kim and Kycia2021) of the Brockhouse X-Ray Diffraction and Scattering Sector of the Canadian Light Source using a wavelength of 0.819563(2) Å (15.1 keV) from 1.6 to 75.0° 2θ with a step size of 0.0025° and a collection time of 3 minutes. The high-resolution powder diffraction data were collected using eight Dectris Mythen2 X series 1K linear strip detectors. NIST SRM 660b LaB6 was used to calibrate the instrument and refine the monochromatic wavelength used in the experiment.
In contrast to most pharmaceuticals we have studied at this beamline, cabotegravir sample exhibits a prominent background peak at 6.3° 2θ, indicating that the sample is not completely crystalline. Both N-TREOR (Altomare et al., Reference Altomare, Cuocci, Giacovazzo, Moliterni, Rizzi, Corriero and Falcicchio2013) and DICVOL06 (Louër and Boultif, Reference Louër and Boultif2007), as incorporated into FOX (Favre-Nicolin and Černý, Reference Favre-Nicolin and Černý2002), suggested a primitive orthorhombic unit cell with a = 8.4414, b = 13.4993, c = 31.4811 Å, V = 3,587.4 Å3, and Z = 8. Other programs suggested larger unit cells. EXPO2014 (Altomare et al., Reference Altomare, Cuocci, Giacovazzo, Moliterni, Rizzi, Corriero and Falcicchio2013) suggested space group P212121. A reduced cell search of the Cambridge Structural Database (Groom et al., Reference Groom, Bruno, Lightfoot and Ward2016), combined with the chemistry H, C, N, O, and F only, yielded 1 hit, but no structures of cabotegravir or its derivatives.
The cabotegravir molecular structure was downloaded from PubChem (Kim et al., Reference Kim, Chen, Cheng, Gindulyte, He, He and Li2023) as Conformer3D_COMPOUND_CID_54713659.sdf. It was converted to a *.mol2 file using Mercury (Macrae et al., Reference Macrae, Sovago, Cottrell, Galek, McCabe, Pidcock and Platings2020). The structure was solved by Monte Carlo-simulated annealing techniques as implemented in EXPO2014 (Altomare et al., Reference Altomare, Cuocci, Giacovazzo, Moliterni, Rizzi, Corriero and Falcicchio2013), using two molecules as fragments. A chemically plausible structure was obtained, refined, and optimized, but the agreement of the Rietveld-refined and density functional theory (DFT)-optimized structures was outside the normal range for correct structures (van de Streek and Neumann, Reference van de Streek and Neumann2014); the root-mean-square (rms) Cartesian displacement was 1.08 Å.
A Le Bail fit using this cell and space group P222 fit all the peaks, so we suspected that the space group was incorrect. Le Bail fits in six additional proper orthorhombic space groups (P22121, P21221, P21212, P2122, P2212, and P2221), as well as monoclinic space groups P2111, P1211, and P1121, and the triclinic space group P1 were carried out. Space group P22121 yielded a fit as good as P1, so it was adopted for structure solution, after converting the cell to the standard setting P21212. The structure was resolved in this new space group using EXPO2014.
Rietveld refinement was carried out with GSAS-II (Toby and Von Dreele, Reference Toby and Von Dreele2013). Only the 2.5–45.0° portion of the pattern was included in the refinements (d min = 1.071 Å). All non-H-bond distances and angles were subjected to restraints, based on a Mercury/Mogul Geometry Check (Bruno et al., Reference Bruno, Cole, Kessler, Luo, Motherwell, Purkis, Smith, Taylor, Cooper, Harris and Orpen2004; Sykes et al., Reference Sykes, McCabe, Allen, Battle, Bruno and Wood2011). The Mogul average and standard deviation for each quantity were used as the restraint parameters. The two aromatic ring systems and the amide group in each molecule were restrained to be planar. The restraints contributed 16.1% to the overall χ 2. The hydrogen atoms were included in calculated positions, which were recalculated during the refinement using Materials Studio (Dassault Systèmes, 2023). The U iso of the heavy atoms were grouped by chemical similarity. The U iso of the H atoms were fixed at 1.3× the U iso of the heavy atoms to which they are attached. The structure apparently contains a small void on a twofold axis at 0, 1/2, 0.211. Placing an O atom (water molecule) at this position and refining yielded low occupancy and movement too close to other atoms, so it was deleted from the model. The peak profiles were described using the generalized (Stephens, Reference Stephens1999) microstrain model. The background was modeled using a three-term shifted Chebyshev polynomial, with peaks at 6.29 and 10.57° to model the scattering from the amorphous portion of the sample and the Kapton capillary.
The final refinement of 193 variables using 17,001 observations and 166 restraints yielded the residual R wp = 0.09730. The largest peak (1.81 Å from C71) and hole (1.17 Å from F47) in the difference Fourier map were 0.97(21) and −0.77(21) eÅ−3, respectively. The final Rietveld plot is shown in Figure 3. The largest features in the normalized error plot are in the shapes and intensities of some of the strong low-angle peaks.
The Rietveld plot for cabotegravir. The blue crosses represent the observed data points, and the green line represents the calculated pattern. The cyan curve indicates the normalized error plot, and the red line indicates the background curve. The blue tick marks indicate the cabotegravir peak positions. The vertical scale has been multiplied by a factor of 10× for 2θ > 17.5̊.

The crystal structure of cabotegravir was optimized (fixed experimental unit cell) with density functional theory techniques using VASP (Kresse and Furthmüller, Reference Kresse and Furthmüller1996) through the MedeA graphical interface (Materials Design, 2024). The calculation was carried out on 32 cores of a 144-core (768-GB memory) HPE Superdome Flex 280 Linux server at North Central College. The calculation used the GGA-PBE functional, a plane wave cutoff energy of 400.0 eV, and a k-point spacing of 0.5 Å−1, leading to a 1 × 1 × 2 mesh, and took ~182.7 hours. Single-point density functional calculations (fixed experimental cell) and population analysis were carried out using CRYSTAL23 (Erba et al., Reference Erba, Desmarais, Casassa, Civalleri, Donà, Bush and Searle2023). The basis sets used for the H, C, N, and O atoms in the calculation were those of Gatti et al. (Reference Gatti, Saunders and Roetti1994), while the basis set for F was that of Peintinger et al. (Reference Peintinger, Vilela Oliveira and Bredow2013). The calculations were run on a 3.5-GHz PC using eight k-points and the B3LYP functional and took ∼7.2 hours.
III. RESULTS AND DISCUSSION
The sample of cabotegravir studied here is only partially crystalline. The crystalline component exhibits only slight similarities to the crystalline cabotegravir of the prior art, so it is uncertain how relevant our material is to that used in the pharmaceutical industry. It is apparently a new polymorph.
The rms difference of the non-H atoms in the Rietveld-refined and VASP-optimized structures, calculated using the Mercury CSD-Materials/Search/Crystal Packing Similarity tool, is 0.644 Å. The rms Cartesian displacements of the non-H atoms in the Rietveld-refined and VASP-optimized structures of molecules 1 and 2, calculated using the Mercury Calculate/Molecule Overlay tool, are 0.529 and 0.449 Å (Figures 4 and 5). The largest differences are in the orientation of the difluorophenyl ring of molecule 1 and the orientation of the fused ring system of molecule 2. The agreements are outside the normal range for correct structures (van de Streek and Neumann, Reference van de Streek and Neumann2014). The asymmetric unit is illustrated in Figure 6. The remaining discussion will emphasize the VASP-optimized structure.
Comparison of the Rietveld-refined (red) and VASP-optimized (blue) structures of molecule 1 of cabotegravir. The root-mean-square Cartesian displacement is 0.529 Å. Image generated using Mercury (Macrae et al., Reference Macrae, Sovago, Cottrell, Galek, McCabe, Pidcock and Platings2020).

Comparison of the Rietveld-refined (red) and VASP-optimized (blue) structures of molecule 2 of cabotegravir. The root-mean-square Cartesian displacement is 0.449 Å. Image generated using Mercury (Macrae et al., Reference Macrae, Sovago, Cottrell, Galek, McCabe, Pidcock and Platings2020).

The asymmetric unit of cabotegravir, with the atom numbering. Image generated using Mercury (Macrae et al., Reference Macrae, Sovago, Cottrell, Galek, McCabe, Pidcock and Platings2020).

Almost all of the bond distances and bond angles, and most of the torsion angles, fall within the normal ranges indicated by a Mercury Mogul Geometry check (Macrae et al., Reference Macrae, Sovago, Cottrell, Galek, McCabe, Pidcock and Platings2020). The C17–C12–N8 angle of 115.4° (average = 112.0(10)°; Z-score = 3.3) and the C69–C70–C71 angle of 120.8° (average = 121.2(16)°; Z-score = 4.3) are flagged as unusual. Torsion angles involving rotations about the C23–C24 and C69–C70 bonds lie in valleys of broad bimodal distributions. Torsion angles involving rotations about the C20–C22 bond are very unusual. The confirmation of the amide group in molecule 1 is unusual.
The two independent molecules have very different conformations (Figure 7); the rms Cartesian displacement of the non-H atoms is 2.255 Å. Molecule 2 is roughly planar, while molecule 1 is kinked at the amide group (Figure 8). Quantum chemical geometry optimization of isolated cabotegravir molecules (DFT/B3LYP/6-31G*/water) using Spartan‘24 (Wavefunction, 2023) indicated that the observed conformation of molecule 1 is 6.4 kcal/mol lower in energy than that of molecule 2, but that the local energy minimum of molecule 2 is 8.1 kcal/mol lower in energy. Both local minima and the global minimum-energy conformation are kinked, resembling molecule 1 more than molecule 2.
Comparison of the VASP-optimized structures of molecule 1 (green) and molecule 2 (orange) of cabotegravir. The root-mean-square Cartesian displacement of the non-H atoms is 2.255 Å. Image generated using Mercury (Macrae et al., Reference Macrae, Sovago, Cottrell, Galek, McCabe, Pidcock and Platings2020).

Comparison of the two independent VASP-optimized cabotegravir molecules. Molecule 1 (kinked) is above, and molecule 2 is below.

The crystal structure (Figure 9) consists of stacks of roughly parallel molecules along the c-axis. The kinked phenyl ring of molecule 1 fits into the plane of the adjacent molecules. The molecules form layers parallel to the bc-plane. The mean planes of the fused ring systems in molecules 1 and 2 are approximately (12, −4, 7) and (16, −3, −6); the average plane is approximately (4, −1, −2). The distance between adjacent ring planes is approximately 3.6 Å. Hydrogen bonds link molecule 2 into chains along the b-axis (Figure 10). The Mercury Aromatics Analyser indicates two moderate interactions between the phenyl rings of molecules 1 and 2, with the distances of 5.67 and 6.74 Å.
The crystal structure of cabotegravir, viewed down the b-axis. Image generated using Diamond (Crystal Impact, 2023).

The hydrogen-bonded chains of molecule 2 in the crystal structure of cabotegravir. The b-axis is horizontal.

Analysis of the contributions to the total crystal energy of the structure using the Forcite module of Materials Studio (Dassault Systèmes, 2023) indicates that angle and torsion distortion terms dominate the intramolecular energy, but that bond distortion terms are also important. The intermolecular energy is dominated by van der Waals repulsions and electrostatic attractions, which in this force field-based analysis also include hydrogen bonds. The hydrogen bonds are better discussed using the results of the DFT calculation.
Molecule 2 participates in more intra- and inter-molecular hydrogen bonds than molecule 1 (Table I). There are four classical hydrogen bonds. In molecule 1, the hydroxyl group O5–H40 forms a strong intramolecular O–H···O hydrogen bond to the adjacent carbonyl group O6. In molecule 2, the equivalent hydroxyl group O51–H86 forms a strong O–H···O hydrogen bond to another molecule 2, resulting in chains along the b-axis (Figure 10). The chains have the graph set C1,1(7) (Etter, Reference Etter1990; Bernstein et al., Reference Bernstein, Davis, Shimoni and Chang1995; Motherwell et al., Reference Motherwell, Shields and Allen2000). The energies of the O–H···O hydrogen bonds were calculated using the correlation of Rammohan and Kaduk (Reference Rammohan and Kaduk2018). In molecule 1, the amino group N10–H41 forms a weak intermolecular N–H···C hydrogen bond to C72, while in molecule 2, the equivalent N56–H87 forms a strong intramolecular N–H···O hydrogen bond to the carbonyl O52. The energy of the N–H···O hydrogen bond was calculated using the correlation of Wheatley and Kaduk (Reference Wheatley and Kaduk2019). Several C–H···O and C–H···N hydrogen bonds contribute to the lattice energy, and the pattern of hydrogen bonding is different for molecules 1 and 2.
Hydrogen bonds (CRYSTAL23) in cabotegravir.

* Intramolecular.
The volume enclosed by the Hirshfeld surface of cabotegravir (Figure 11; Hirshfeld, Reference Hirshfeld1977; Spackman et al., Reference Spackman, Turner, McKinnon, Wolff, Grimwood, Jayatilaka and Spackman2021) is 885.79 Å3, 98.86% of one-fourth of the unit cell volume. The packing density is thus typical. The only significant close contacts (red in Figure 11) involve the hydrogen bonds. The volume/non-hydrogen atom is smaller than usual at 15.4 Å3.
The Hirshfeld surface of cabotegravir. Intermolecular contacts longer than the sum of the van der Waals radii are colored blue, and contacts shorter than the sum of the radii are colored red. Contacts equal to the sum of the radii are white. Image generated using CrystalExplorer (Spackman et al., Reference Spackman, Turner, McKinnon, Wolff, Grimwood, Jayatilaka and Spackman2021).

The Bravais–Friedel–Donnay–Harker (Bravais, Reference Bravais1866; Friedel, Reference Friedel1907; Donnay and Harker, Reference Donnay and Harker1937) algorithm suggests that we might expect platy morphology for cabotegravir, with {100} as the major faces, as expected from both the anisotropy of the lattice parameters and the layered structure. A fourth-order spherical harmonic model was included in the refinement. The texture index was 1.076(4), indicating that the preferred orientation was small in this rotated capillary specimen.
DEPOSITED DATA
The powder pattern of cabotegravir from this synchrotron dataset has been submitted to the International Centre for Diffraction Data (ICDD) for inclusion in the Powder Diffraction File™. The Crystallographic Information Framework (CIF) files containing the results of the Rietveld refinement (including the raw data) and the DFT geometry optimization were deposited with the ICDD. The data can be requested at pdj@icdd.com.
ACKNOWLEDGEMENTS
We thank Adam Leontowich for his assistance in the data collection. We also thank the ICDD team – Megan Rost, Steve Trimble, and Dave Bohnenberger – for their contribution to research, sample preparation, and in-house XRD data collection and verification.
FUNDING STATEMENT
Part or all of the research described in this paper was performed at the Canadian Light Source, a national research facility of the University of Saskatchewan, which is supported by the Canada Foundation for Innovation (CFI), the Natural Sciences and Engineering Research Council (NSERC), the Canadian Institute of Health Research (CIHR), the Government of Saskatchewan, and the University of Saskatchewan. This work was partially supported by the International Centre for Diffraction Data.
CONFLICTS OF INTEREST
The authors have no conflicts of interest to declare.


 Open access