





1. Introduction
Modelling the influence of subglacial water on ice dynamics (e.g. Schoof, Reference Schoof2010; Flowers, Reference Flowers2015; Tsai and others, Reference Tsai, Smith, Gardner and Seroussi2022) and measurements of the change in ice speed associated with change in surface and subsurface water (e.g. Bartholomaus and others, Reference Bartholomaus, Anderson and Anderson2008; Moon and others, Reference Moon2014; Yang and others, Reference Yang2022) both indicate that subglacial water can facilitate or impede ice movement depending on the circumstances. However, the fact remains that there is a dearth of information on the presence, amount, and movement of subglacial water. As glacial ice melt increases in the cryosphere, this represents one of the main difficulties in estimating future contributions to sea level rise.
The work of (Nanni and others, Reference Nanni, Gimbert, Roux and Lecointre2021) has shown that by using a dense seismic array it was possible to map the subglacial hydrology network of Glacier d’Argentière in the French Alps. While the temporal and spatial results from this work are impressive, the logistical difficulties of this approach for most of the world’s glacial ice suggest that satellite remote sensing should be exploited if possible. In this regard satellite radar interferometry was used for temporal surface height change in West Antarctica ice streams where the pattern of height change first suggested episodic movement of subglacial water (Gray and others, Reference Gray, Joughin, Tulaczyk, Spikes, Bindschadler and Jezek2005). Satellite altimetry, particularly using the two ICESat satellites, then showed that the temporal height change could track the filling and emptying of subglacial lakes (e.g. Fricker and others, Reference Fricker, Scambos, Bindschadler and Padman2007; Smith and others, Reference Smith, Fricker, Joughin and Tulaczyk2009). Recent work has revealed that active subglacial lakes exist in Greenland as well as in Antarctica (Livingstone and others, Reference Livingstone2022; Fan and others, Reference Fan, Ke, Shen, Xiao, Livingstone and Sole2023). The time-referenced ArcticDEM strips generated by the Polar Geophysical Center of the University of Minnesota (Porter and others, Reference Porter2024) have also been important in documenting the filling and outflow from active subglacial lakes, indeed Zheng and others (Zheng and others, Reference Zheng, Van Wychen, Li and Yamanokuchi2025) have recently used ArcticDEM strips to document the existence of 37 active subglacial lakes in the Canadian Arctic, most of which had not been previously identified. Other recent work has demonstrated the utility of combining digital elevation models (DEMs), ice movement and altimetry data in the study of subglacial lakes, e.g. in Greenland (Sandberg Sørensen and others, Reference Sandberg Sørensen2024) and in East Antarctica (Neckel and others, Reference Neckel, Franke, Helm, Drews and Jansen2021; Arthur and others, Reference Arthur, Shackleton, Moholdt, Matsuoka and van Oostveen2024).
When glacial ice above a subglacial lake is moving horizontally very slowly such that one does not expect the shape of the ice surface to change quickly with time, say over months to a few years, then it is possible to track vertical movement with respect to a time-specific reference ArcticDEM strip using different ICESat-2 passes. In this way it is possible to document surface height change above a subglacial lake at a temporal resolution less than the 91-day ICESat-2 repeat cycle. This approach was used in the study of the recently discovered subglacial lakes in northwest Greenland (Gray and others, Reference Gray2024a) and in the south of Ellesmere Island, Canada (Gray and others, Reference Gray2024b). Combining ArcticDEM strips with ICESat-2 data is also used here and leads to an improved temporal and spatial resolution in surface height change.
Here we show that the combination of ICESat-2 height data coupled with the available ArcticDEM strips provide new insight on the presence and movement of subglacial water. Considering the high latitude (>82.3 N), low ice speed (<20 m/year) and ice thickness (∼400 m), it is perhaps surprising that the results show the presence of significant subglacial water in part of the study area.
2. Study area
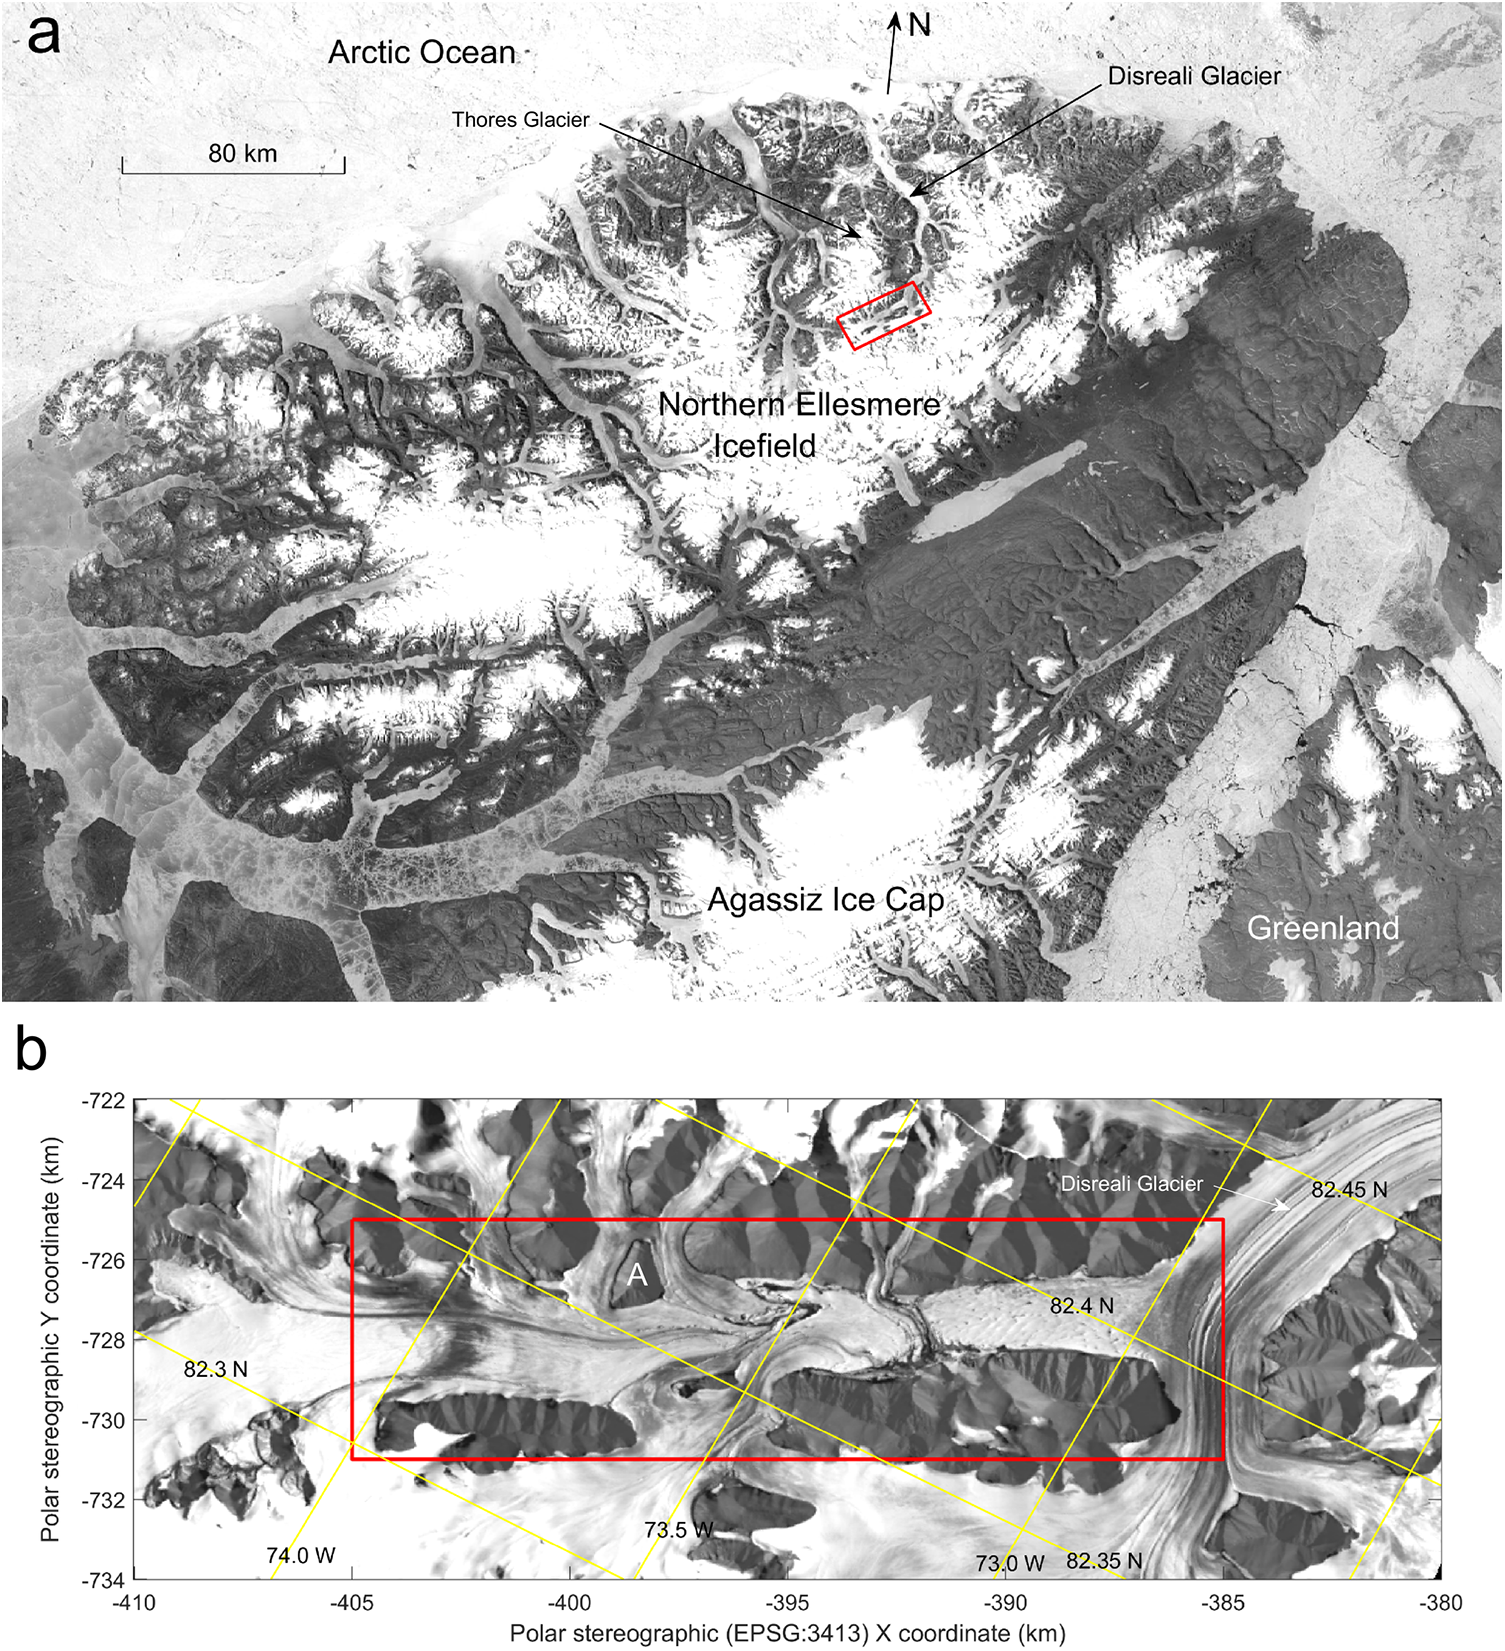
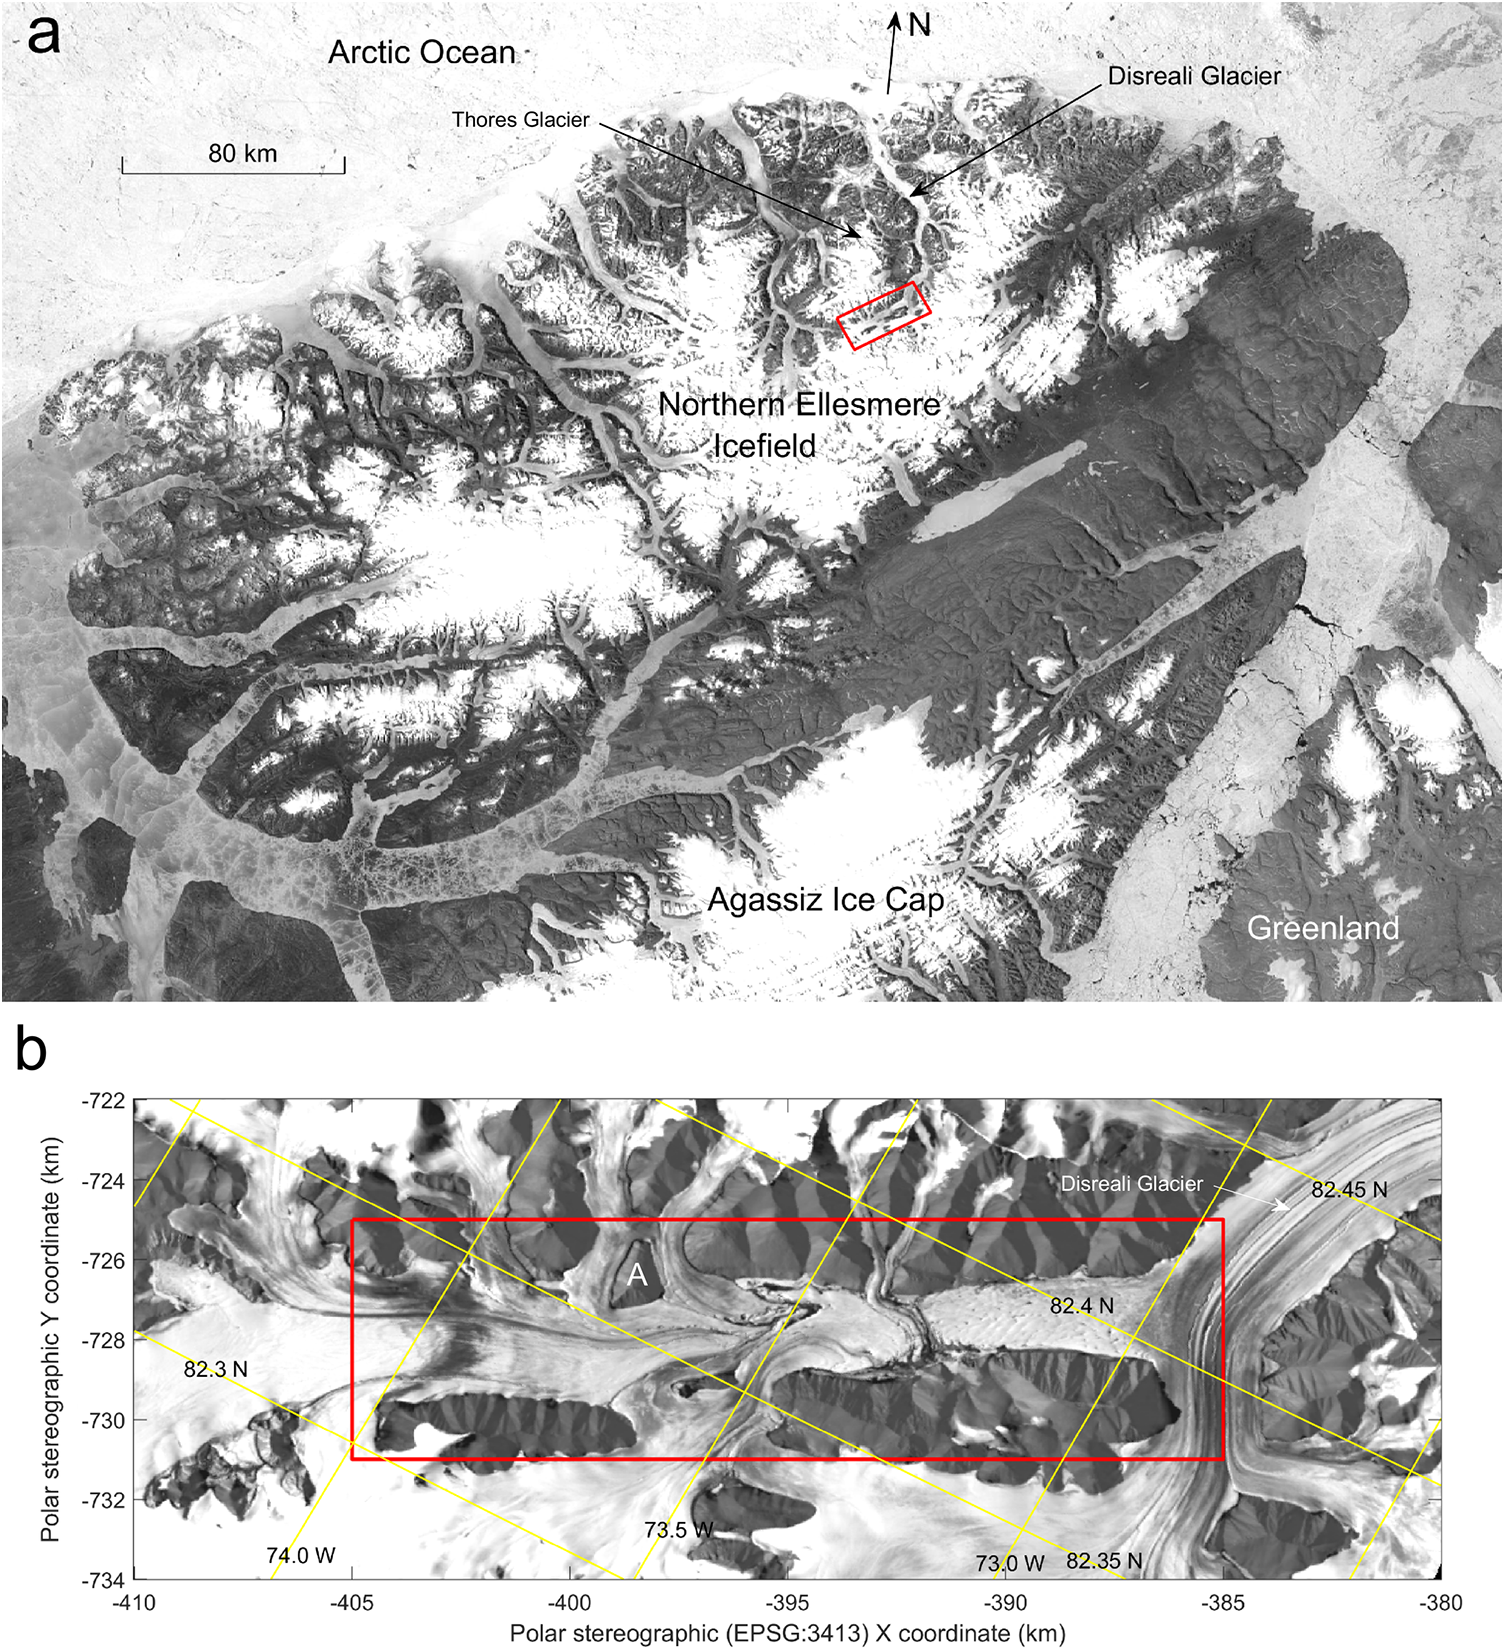
Figure 1 illustrates the position of the study area in the Northern Ellesmere Icefield on Ellesmere Island. White and Copland (Reference White and Copland2018) have shown that the extent of glacial ice in this icefield has decreased by around 5.9% over the 16-year period from 1999 to 2015. Also, (Medrzycka and others, Reference Medrzycka, Copland and Noël2023) document the significant shrinkage of a small mountain glacier (Bowman Glacier at 81.35 N, 76.45 W, area <1 km2) just south of the Northern Ellesmere Icefield. These studies are consistent with the well-documented warming Arctic air temperatures (Ballinger and others, Reference Ballinger2024) and estimates of regional glacial ice mass loss from the GRACE satellites (Ciracì and others, Reference Ciracì, Velicogna and Swenson2020). However, (Kochtitzky and others, Reference Kochtitzky2023) showed little area change since the Little Ice Age in Thores Glacier, a land terminating glacier 35 km NNW of our site. Like much of the Queen Elizabeth Islands, northern Ellesmere is presently a polar desert with an annual precipitation of around 15–20 cm (Serreze and Barry, Reference Serreze and Barry2014).
(a) The red box shows the position of the study area in the Northern Ellesmere Icefield of Ellesmere Island and the extent of the image in (b). The background image in (b) is from a Landsat image acquired on 17 July 2020 resampled to the polar stereographic coordinate system (EPSG:3413) used in the ArcticDEM strips and referenced to the WGS84 ellipsoid. The red outline box in (b) shows the position of Figure 2. The yellow lines show lines of latitude and longitude, and the label A indicates the nunatak used to help register some ArcticDEM strips.
There is evidence that some of the tributaries of Disreali Glacier, and perhaps the glacier itself, have surged in the past (Copland and others, Reference Copland, Sharp and Dowdeswell2003). There are looped moraine features on the main trunk of Disreali which are indicative of past tributary surges. However, these do not track back to the basin under study and there is no evidence of past surges at this position. Indeed, the surface slope of the stagnant ice in the basin adjacent to Disreali Glacier implies a driving stress away from this glacier.
The elevation of the glacial ice in the study area shown in Fig. 1b varies from a low of ∼630 m in the middle of the basin to a high of around 900 m at the southwest end of the area defined by the red box in Fig. 1b. Examination of summer Landsat imagery confirms that the winter seasonal snow accumulation in the centre of the basin melts each summer.
3. Data and methodology
Time specific ArcticDEMs were obtained from the Polar Geospatial Centre (PGC) in the form of strips sampled at 2 m (Porter and others, Reference Porter2024). These were generated using the Surface Extraction with TIN-based SETSM algorithm (Noh and Howat, Reference Noh and Howat2014).
Because we are comparing and linking the ArcticDEM strips to ATL06 ICESat-2 data (Smith and others, Reference Smith2023), the height data from the ArcticDEM strips have been slightly smoothed to approximately match the ICESat-2 footprint size. The height accuracy of the ICESat-2 data (Brunt and others, Reference Brunt, Neumann and Smith2019; Magruder and others, Reference Magruder, Brunt and Alonzo2020) is better than that from the ArcticDEM strips, where both the heights and geocoding could be in error by approximately 4 meters in horizontal and vertical planes (Błaszczyk and others, Reference Błaszczyk2019 and https://www.pgc.umn.edu/guides/stereo-derived-elevation-models/pgc-dem-products-arcticdem-rema-and-earthdem/). Consequently, we used the ICESat-2 data to minimize height bias and geocoding errors in the ArcticDEM strips. The method uses ICESat-2 data collected as close in time to the time of the ArcticDEM strip as possible, then a search is carried out to register the ArcticDEM to the ICESat-2 data. The ArcticDEM strip from 13 Aril 2020 has been corrected in this way and then used as a reference DEM. Further details are given in the Supplementary Material. When differencing ArcticDEM strips to see height change between two specific time periods it is necessary to register the two ArcticDEMs. This process uses stable reference areas and a minimization procedure to estimate the best registration and resulting height bias error, again the method is also outlined in the Supplementary Material.
Imagery shows that some open water can exist at the edge of the basin at the height of the melt season. ICESat-2 data have been used to follow heights in this area to see if there was any hydraulic connection between the various regions. The lowest heights from all the ICESat-2 passes over the basin were mapped and sorted by date and increasing height. The average of the lowest height values could then be used to check whether there was hydraulic connection between the various regions, for example between the north and south edges of the basin, and to study height change of the low elevations at the periphery of the basin. ICESat-2 data were also compared to a reference ArcticDEM to estimate height change with a temporal resolution less than the 91 day repeat cycle of the satellite. This approach has been used successfully with stagnant ice covering an active subglacial lake (Gray and others, Reference Gray2024b). However, in the present situation the accuracy of the result depends on the rate at which the surface is changing, either through ice movement, snow accumulation or surface melt.
The basin was over-flown by two NASA IceBridge flights in 2014 and 2017 (MacGregor and others, Reference MacGregor2021). Both the 2014 and 2017 airborne radar depth sounder data were collected by the NASA P3 aircraft with the MCoRDS 3 sensor using a transmit power of 1050 W in a frequency range of 180–210 MHz. Data from the MCoRDS ice sounder (Gogineni and others, Reference Gogineni, Chuah, Allen, Jezek and Moore1998; Rodríguez-Morales, Reference Rodríguez-Morales2013) were used to provide an estimate of the ice thickness at the two transects across the basin. The bed returns have also been used to speculate on the presence or absence of water. ITS_LIVE regional data (Gardner and others, Reference Gardner, Fahnestock and Scambos2024) was used to illustrate yearly ice movement.
4. Results
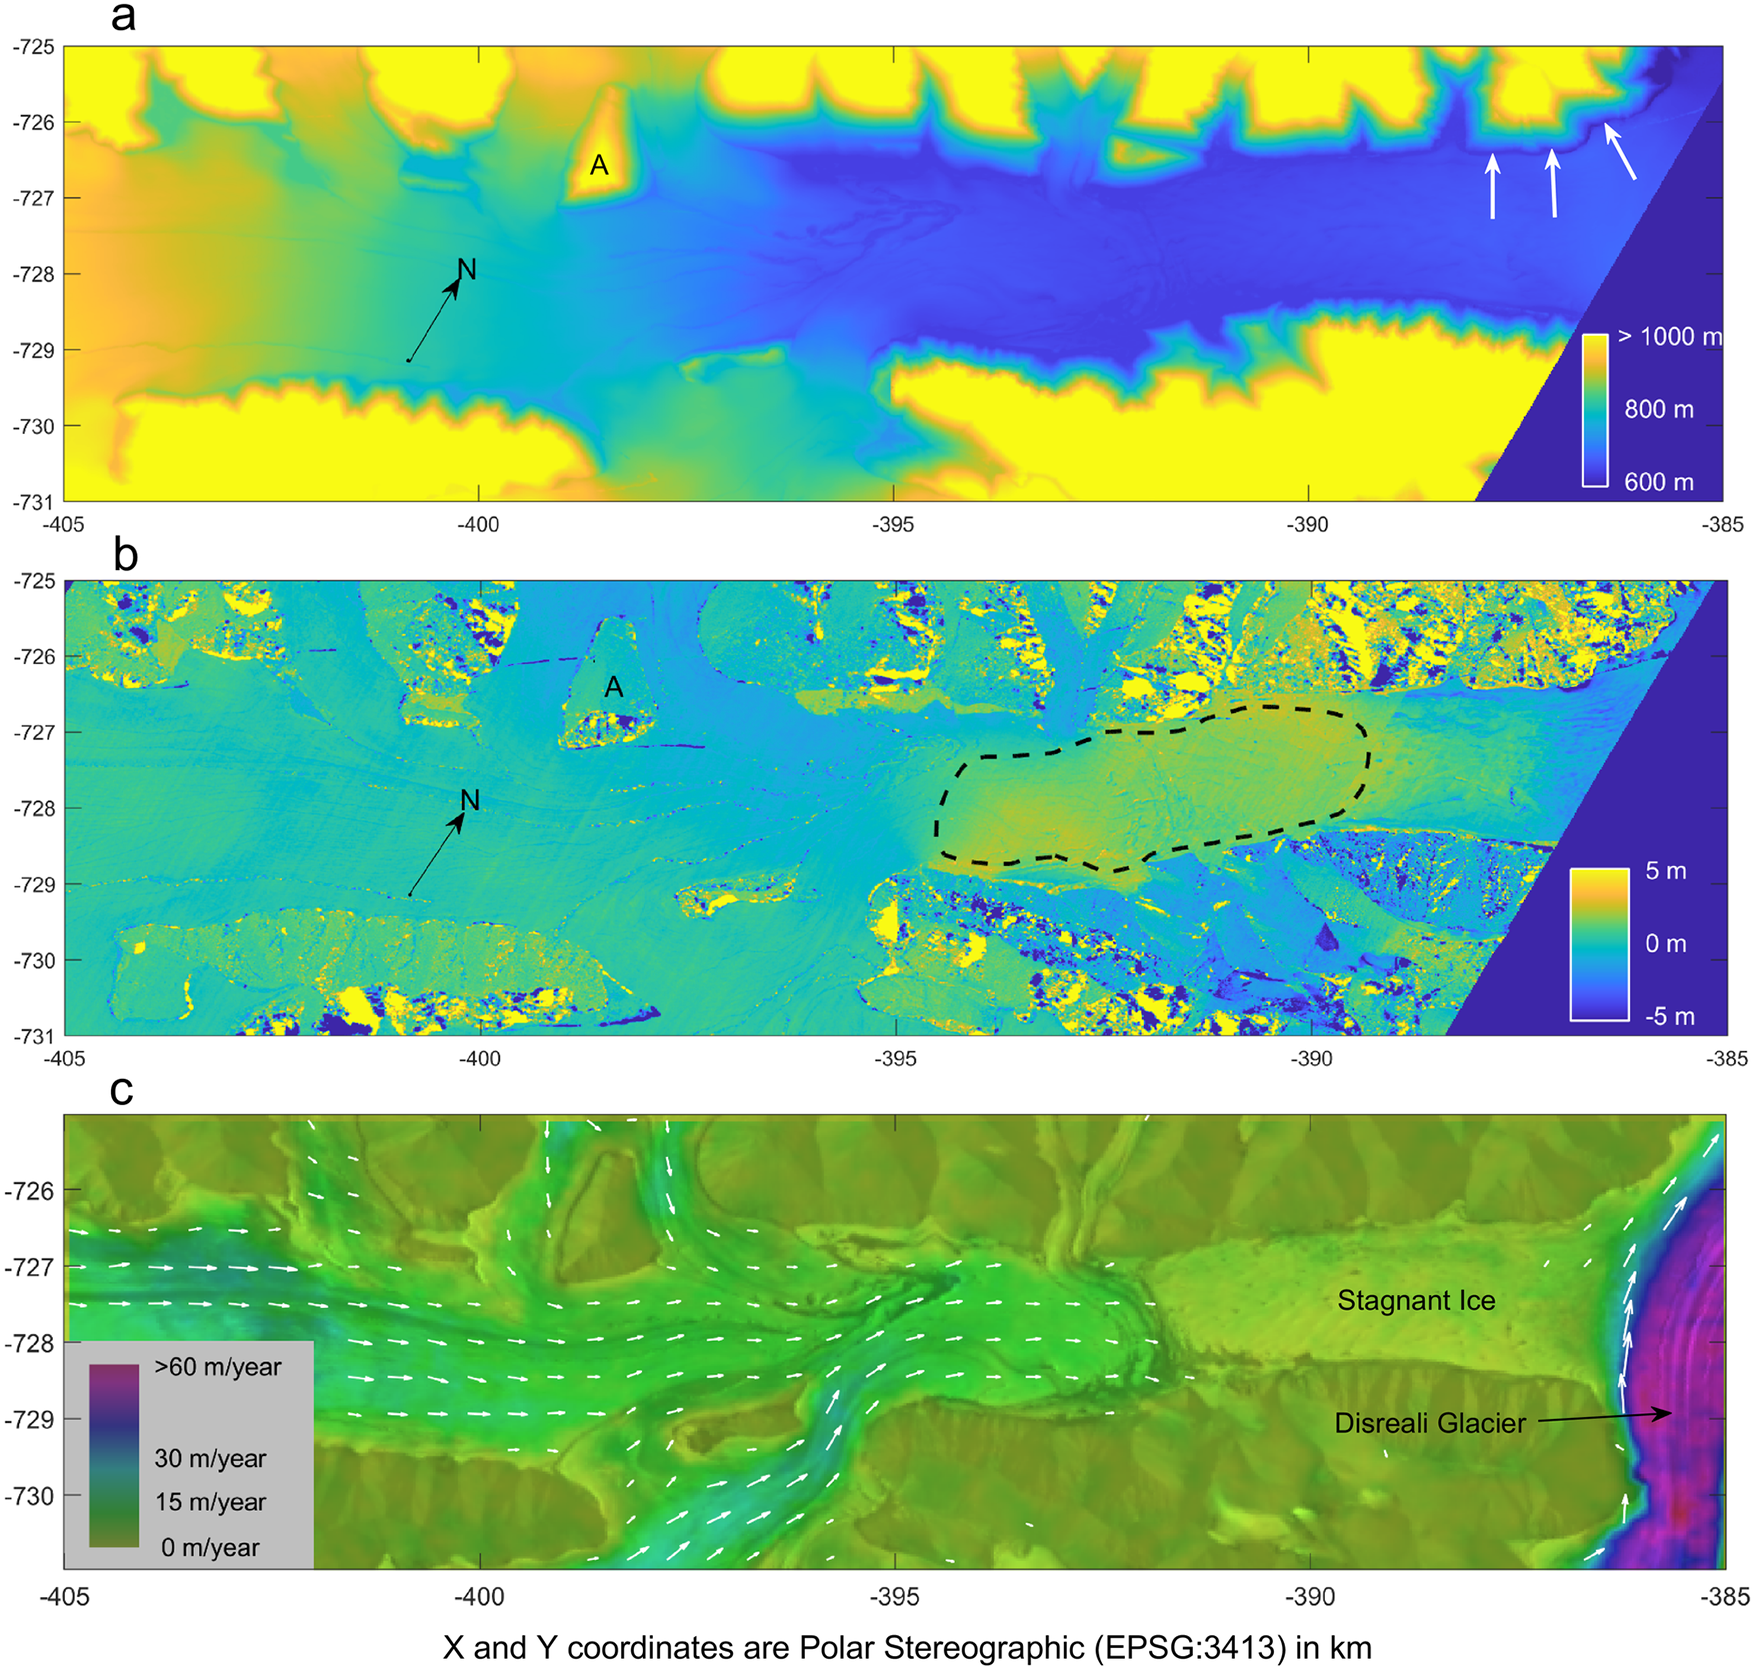
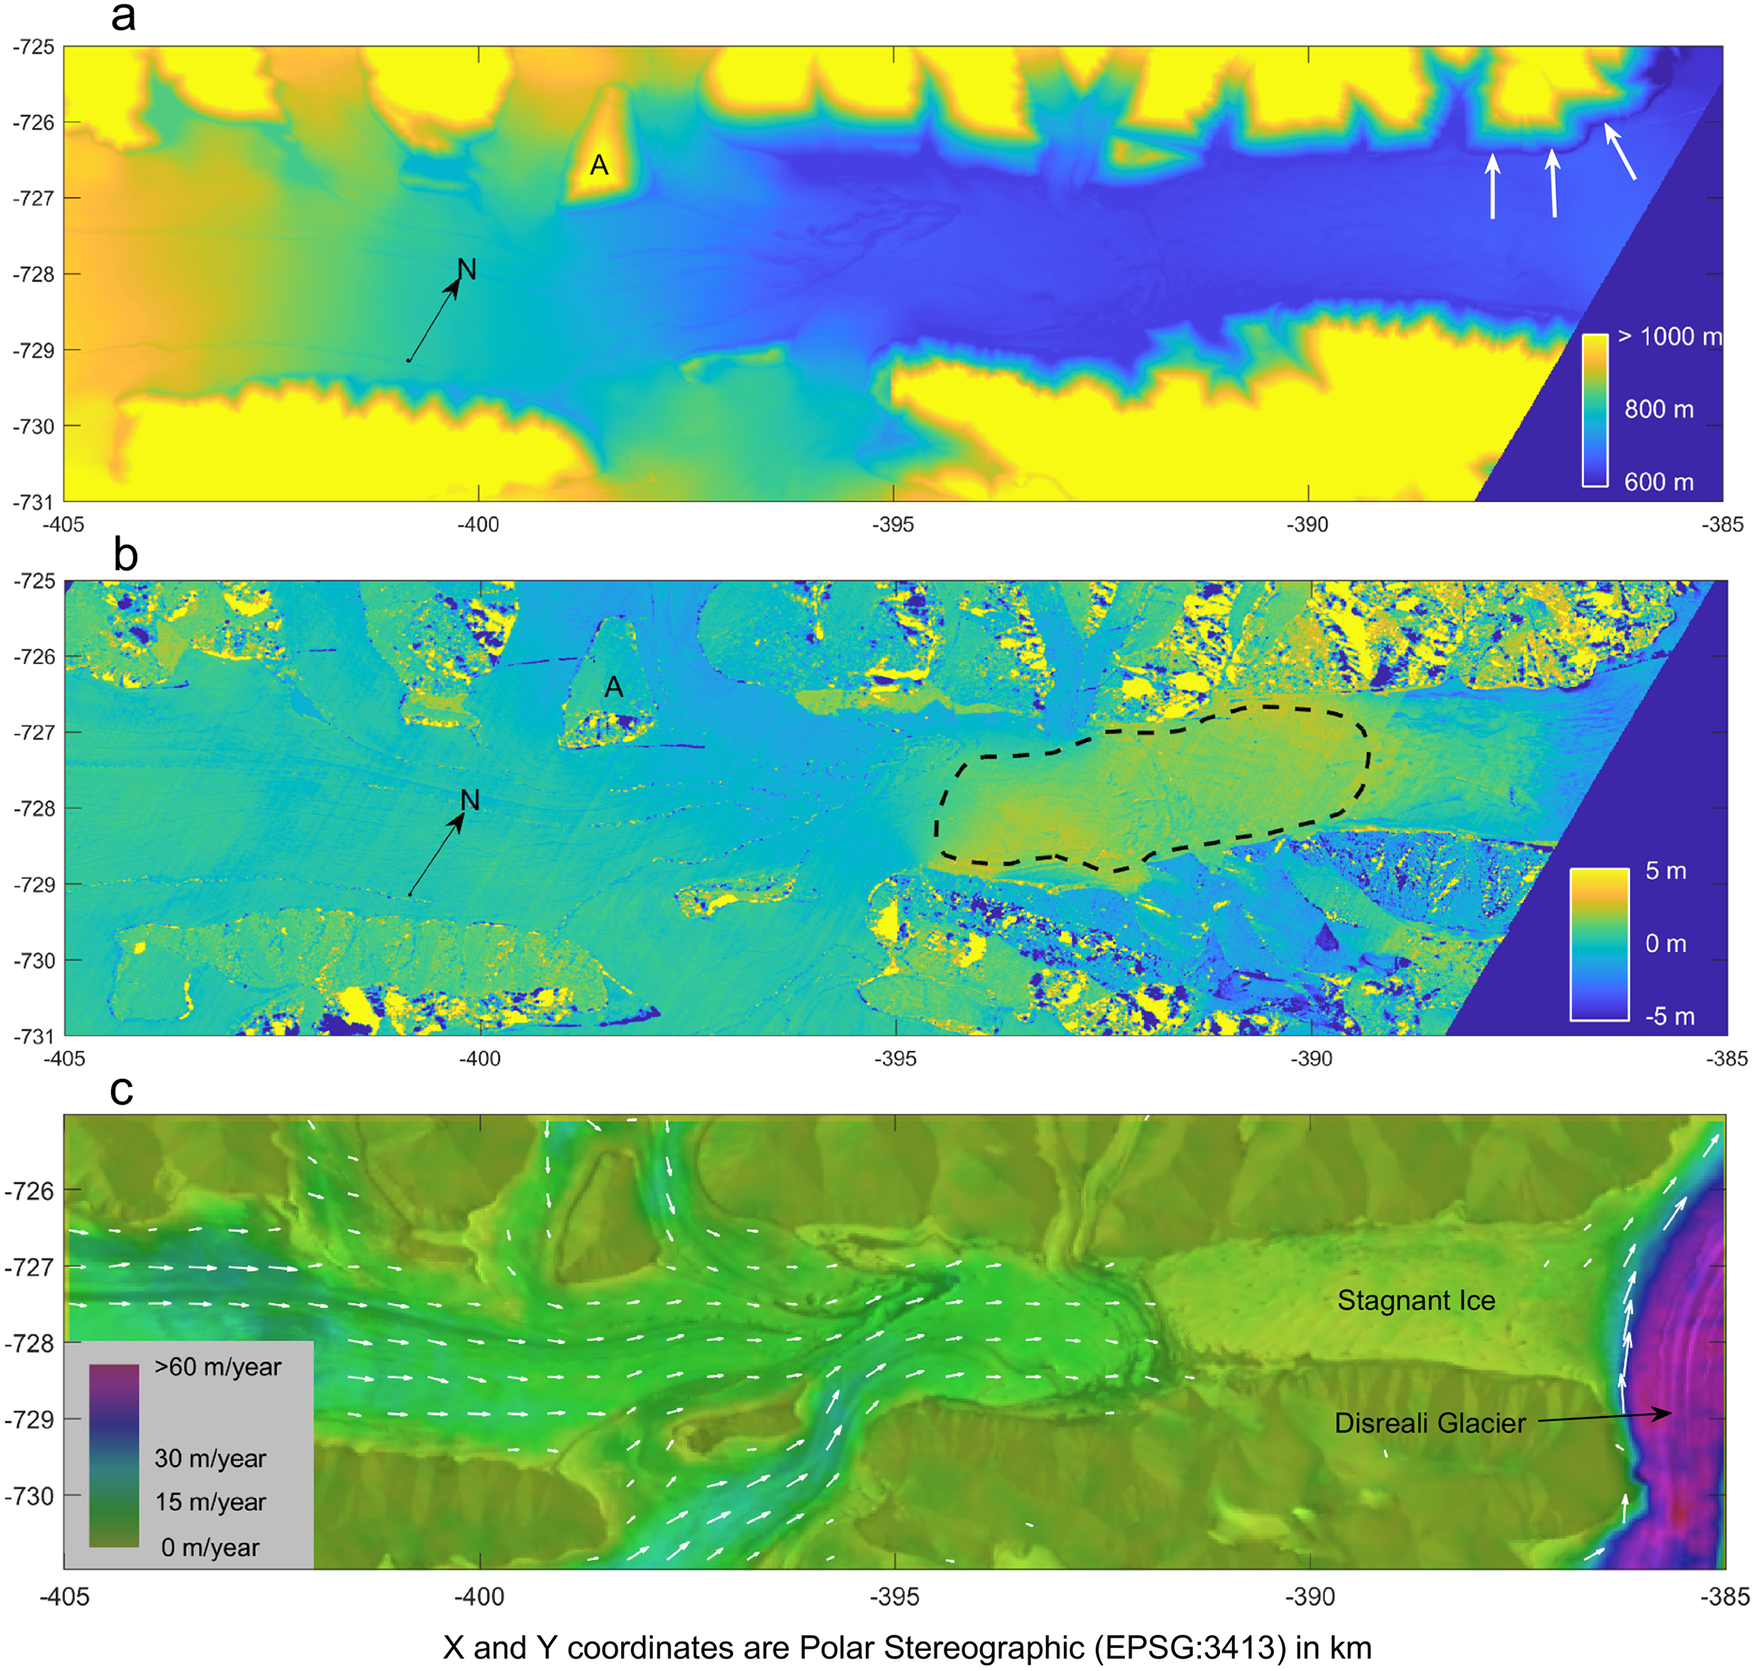
Figure 2a illustrates the topography of the glacial basin and shows that the lowest elevations at the basin edge are in the range of 630–640 m, although the channel marked by the white arrows shows decreasing surface elevations down to around 580 m. Satellite imagery, for example the 17 July 2020 Landsat image in Fig. 1b, show that the winter snow accumulation will normally melt in the summer. Figure 2b illustrates the height difference between a corrected ArcticDEM from 13 April 2020, and another corrected one 3 months later from 13 July 2020. This shows that part of the low elevation area actually increases in elevation in the summer by a few meters, but there is a slight decrease in the elevation for some of the upstream ice surface. Figure 2c shows that the ice in the basin is moving very slowly, especially at the eastern end of the basin where the ice is essentially stagnant.
(a) The basin topography is illustrated using the corrected ArcticDEM strip from 13 April 2020 and a colour bar from 600 to 1000 m. The white arrows indicate a possible outflow path discussed in the text. The X and Y coordinates for panels (a), (b) and (c) are Polar Stereographic (EPSG:3413) in km. (b) The difference in surface height obtained by subtracting the 13 April 2020 ArcticDEM from the 13 July 2020 ArcticDEM is illustrated in colour using a colour bar from −5 to 5 m. The dashed line indicates part of the area showing the increased summer elevation. (c) The colour overlay and white vectors illustrate the yearly surface displacement superimposed on a 17 July 2020 Landsat 8 band 4 image. The 2021 annual ITS_LIVE file was used as the source of the yearly displacement data and the white arrows are only plotted for speeds between 5 and 35 m/year.
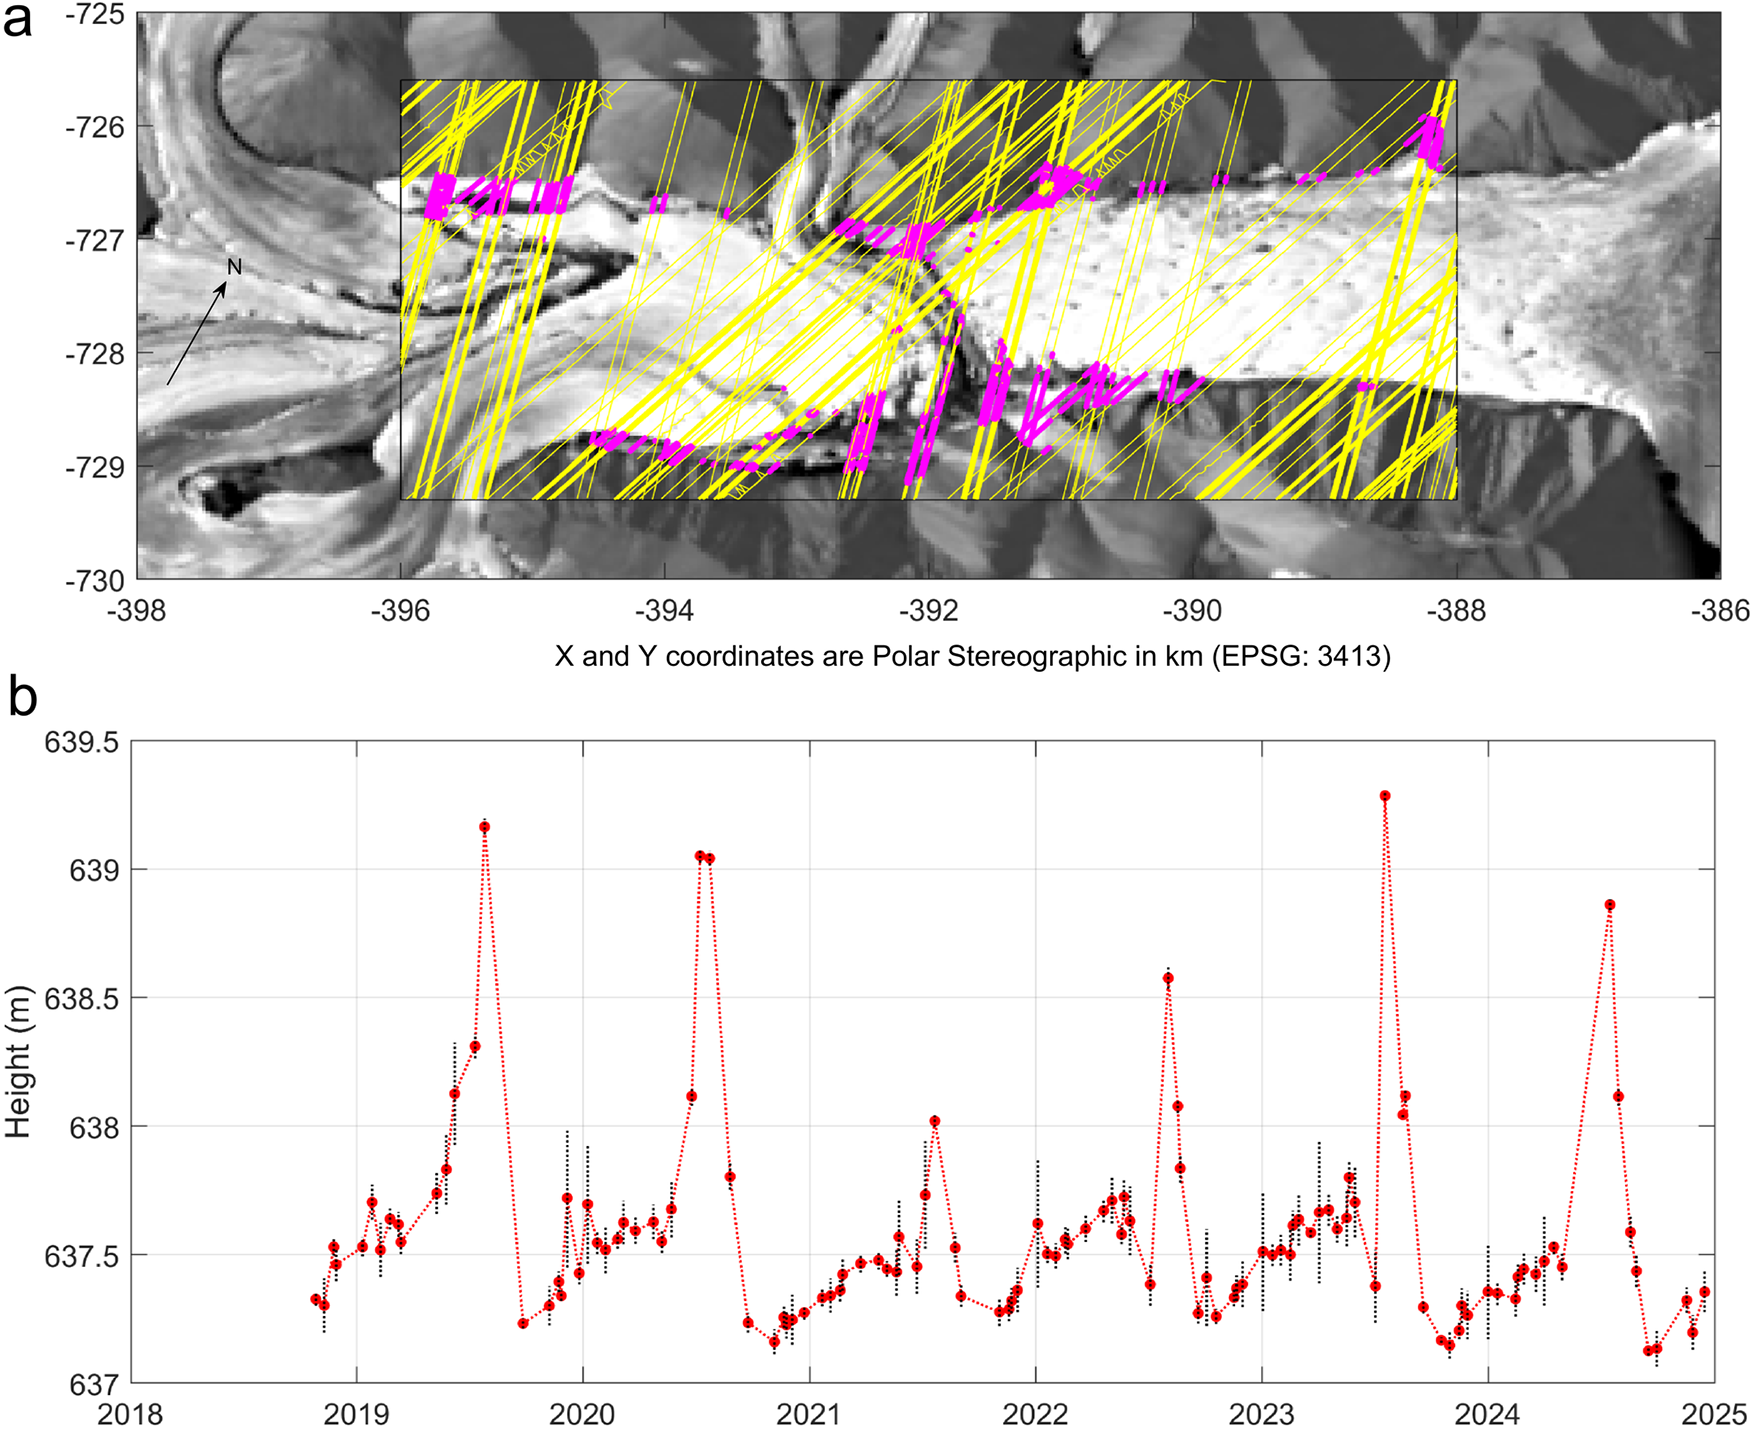
ICESat-2 data has been used to follow the temporal height change of different areas in the basin. Firstly, we studied the periphery of the basin where from examination of Landsat imagery there was evidence of melt water ponding at the height of the summer season. There are 339 ICESat-2 tracks crossing the black box outlined in black in Fig. 3a. To check whether there was any hydraulic connection between different regions at the periphery, all the passes were examined and 120 of these passes had more than ten height samples with heights lower than 640 m. To minimize noise and better indicate any height change trend, the average and standard deviation of the lowest ten height samples from these passes are plotted in Fig. 3b against the date of the ICESat-2 pass. These data show a relatively sudden increase in height of 1–3 m at the periphery at positions where it appears that water is ponding during the summer melt. However, the sudden summer height increase is relatively short lived and by fall there is also a relatively sudden decrease in height. Remarkably, the minimum average surface height for these positions is almost constant with the minimum occurring from late in September to early November. During the winter there is a steady increase in height of up to around 50 cm.
(a) The yellow lines show the positions of the ICESat-2 ground tracks that pass over the box outlined in black. The magenta dots indicate the positions of ICESat-2 height estimates when there were at least 10 samples for that particular beam with heights less than 640 m. Each point in (b) represents the average of the 10 lowest height estimates from these ICESat-2 tracks plotted against the date of the ICESat-2 pass. The black dotted vertical line at each point represents plus and minus one standard deviation of the 10 values.

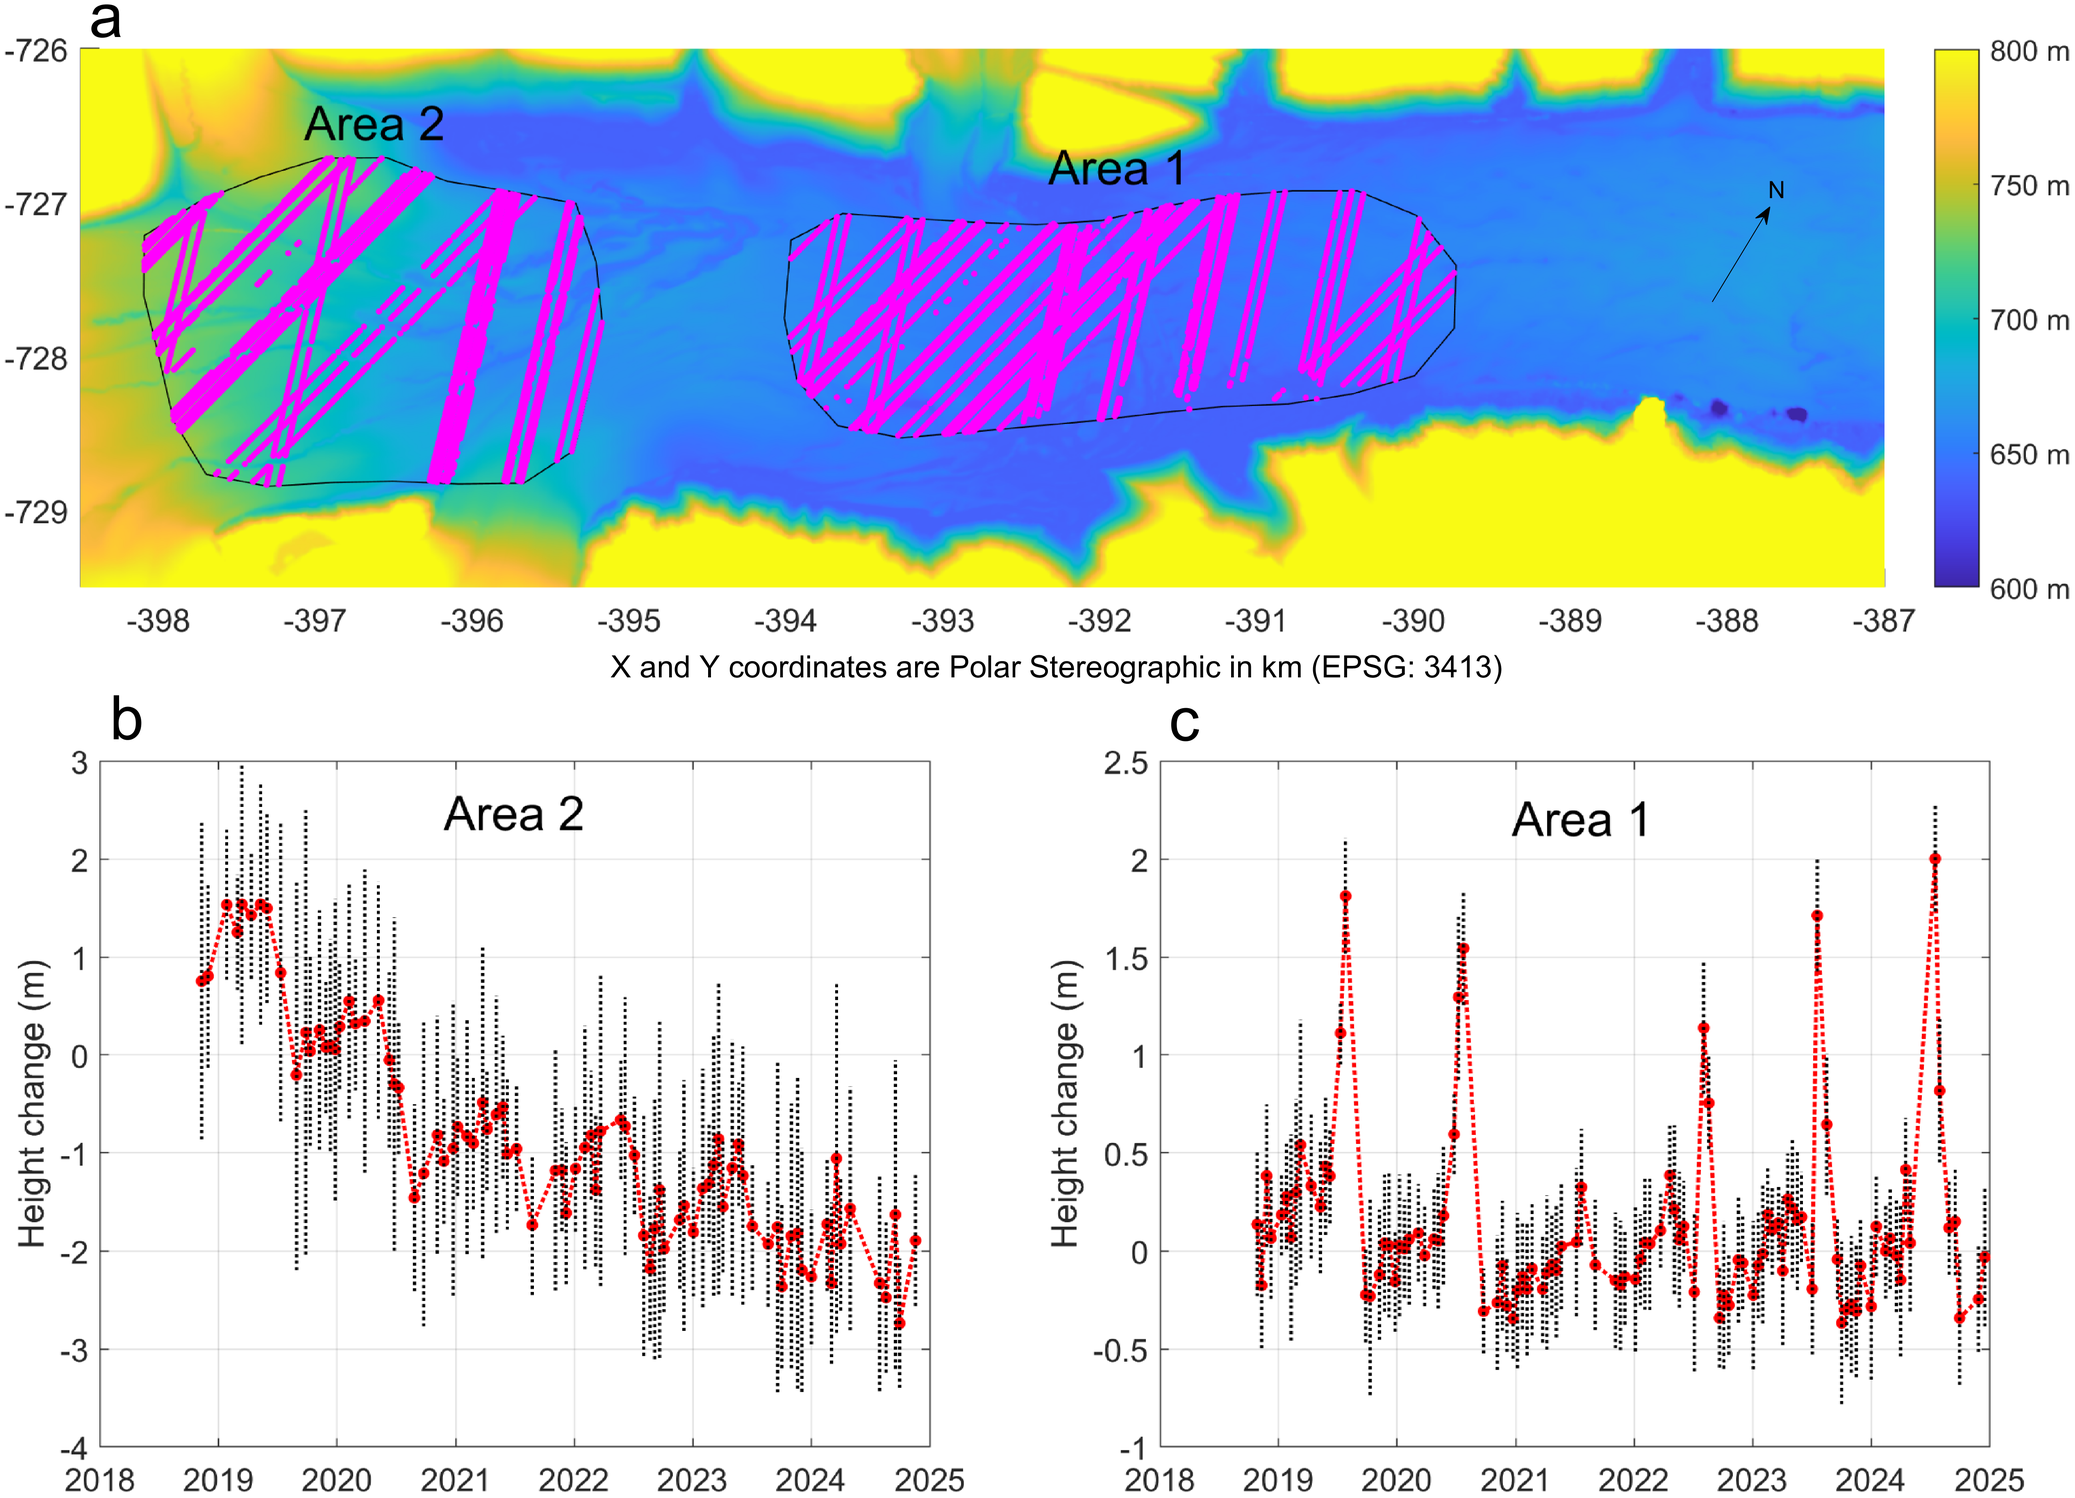
ICESat-2 heights are also compared with the interpolated heights from a corrected ArcticDEM to check for height change over two ice covered areas in the centre of the basin. The magenta points in Fig. 4a reflect the positions of the ICESat-2 height samples which have been compared with the reference ArcticDEM from 13 April 2020. Figure 4c illustrates the average height difference between ICESat-2 data and the interpolated ArcticDEM data crossing Area 1. Each red data point in Fig. 4c represents the average height difference for one particular ICESat-2 pass plotted against the date of the pass. The dotted lines at each data point represent plus and minus one standard error: the standard deviation divided by the square root of the number of estimates being averaged. These data are now much noisier than the periphery heights in Fig. 3b because of the additional potential uncertainty due to the necessary use of the time specific reference ArcticDEM. Despite the higher noise levels, these data confirm that in the summers of 2019, 2020, 2022, 2023 and 2024 there is a relatively sudden height increase in the ice surface in the valley middle, as implied by the difference of DEMs illustrated in Fig. 2b, followed by height decrease in the fall. The timing and magnitude of the height change in Fig. 4c is comparable to the height change shown in Fig. 3b. None of the ICESat-2 data used for Fig. 3b has been reused in Fig. 4c.
(a) The magenta dots reflect the positions of ICESat-2 data samples in the two areas outlined in black. The background colour illustrates surface height using a colour bar from 600 to 800 m. (b) All the ICESat-2 data crossing Area 2 are compared with the reference ArcticDEM and the average height difference for each pass is plotted against the date of the pass. The vertical lines at each point reflect plus and minus one standard error: the standard deviation divided by the square root of the number of estimates averaged. (c) Average height change for Area 1 again showing the average height difference with a line at each point indicating plus and minus one standard error.

A similar approach has been used for the ICESat-2 data crossing Area 2 in Fig. 4a. The average height differences between the ICESat-2 data points and the interpolated heights from the same reference ArcticDEM are plotted in Fig. 4b. The temporal change in height is now quite different from that obtained for Area 1 in Fig. 4c. The surface height for Area 2 trends downward over the 6 years and there is a height decrease at approximately the time in the summer when the ice surface in Area 1 increases. The height noise is now even larger than for Area 2 but the trend in the data is still clear.
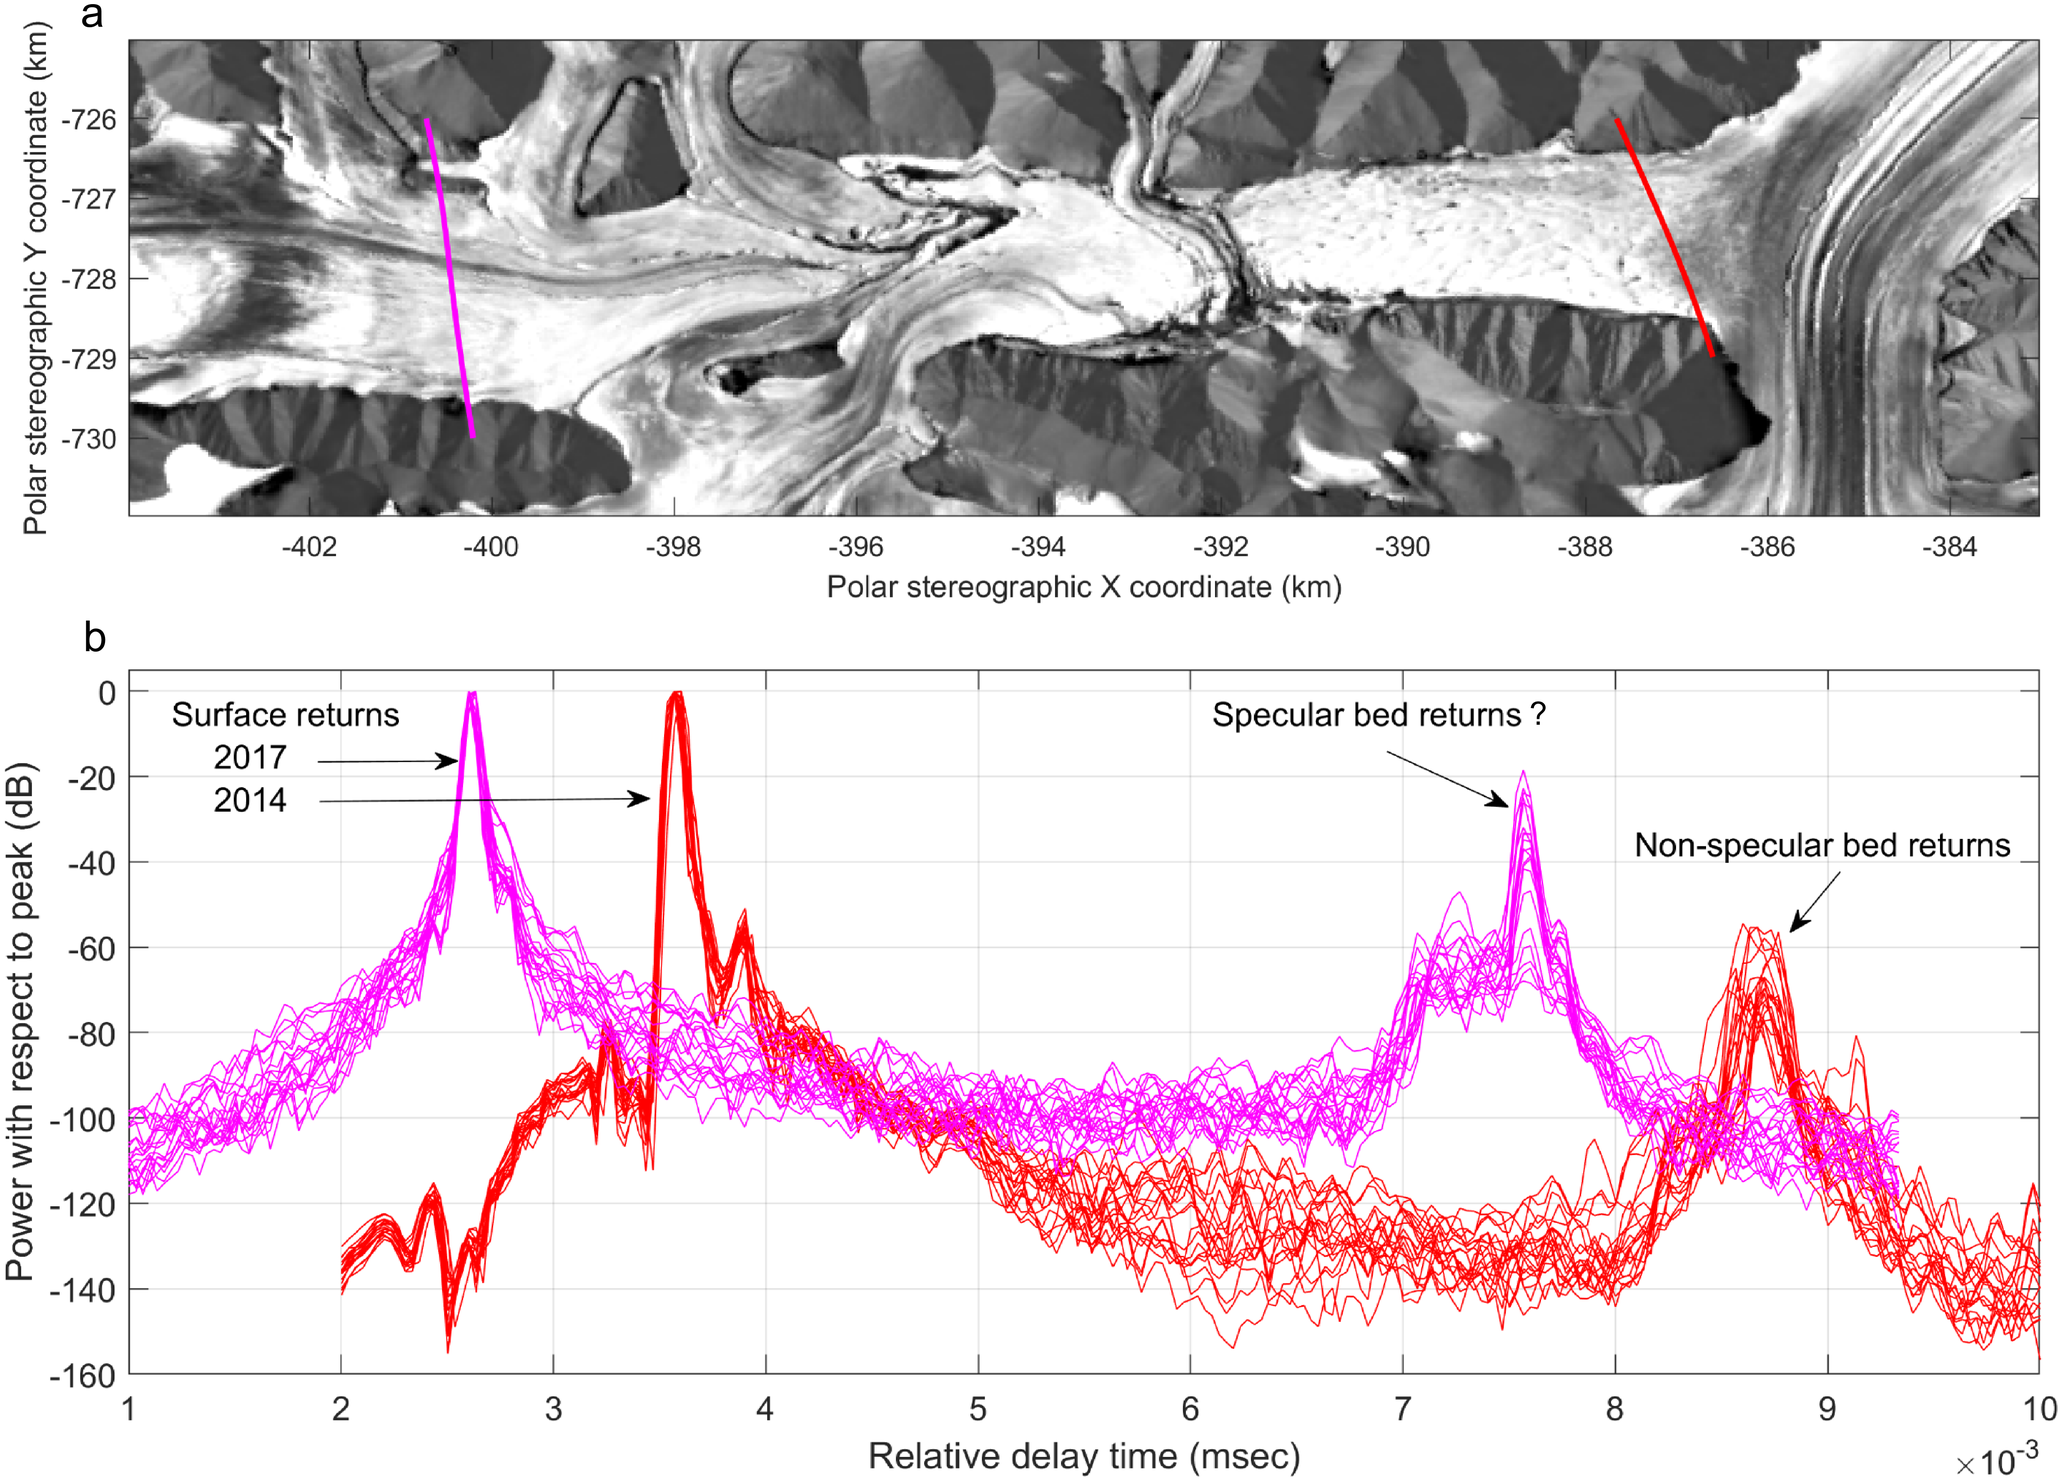
There are data from two NASA IceBridge passes over this area, one on 1 April 2014 and the second on 29 March 2017, with both recording data from the MCoRDS low frequency ice sounder (MacGregor and others, Reference MacGregor2021 and https://gitlab.com/openpolarradar/opr/-/wikis/Radar-Guide-rds). The data includes a sequence of waveform returns separated by around 15 m in the along-track direction. In Fig. 5 the power for each of a sequence of 20 waveforms has been plotted and normalized to the peak surface power. The sequence of 20 waveforms span a distance of around 300 m in the centre of the basin for both dates.
(a) The positions of the MCoRDS radar transects flown in 2014 (red) and 2017 (magenta). (b) The radar returns in dB from 20 waveforms at the middle of the basin showing both surface and bed returns from 2017 flight line are shown in magenta. The twenty 2014 waveforms from the middle of the basin for the 2014 flight line are shown in red. In both cases the waveforms have been normalized such that the dB power levels are with respect to the peak surface return.

The spring 2014 and 2017 airborne transects (Fig. 5) show that maximum ice thickness in the middle of the basin is around 400 m. In Fig. 5b the red waveforms for the 2014 transect over the stagnant ice adjacent to the Disreali Glacier show that the bed returns are much weaker (−60 dB) than the surface returns. In linear terms this means that the bed returns are around one millionth the power of the surface returns. However, for the 2017 data there is a region where there are relatively strong returns at the bed. These are marked in Fig. 5b and have been interpreted as ‘specular’ (see, e.g. Schroeder and others, Reference Schroeder, Blankenship and Young2013) and are around 40 dB stronger in power (equivalent to factor of 10 000) than the 2014 bed returns.
5. Discussion and conclusions
The coherent picture of temporal height change at the edge of the basin over the 6-year ICESat-2 lifetime (Fig. 3b) implies that there must be hydraulic connectivity between the different regions marked with magenta dots in Fig. 3a. In particular, the summer melt water pooling at the northwest and southeast edges, shown by the magenta dots at the upper and lower basin edges in Fig. 3a, are clearly connected although examination of Landsat imagery does not show any obvious surface water pathway. This implies englacial or subglacial water movement between these regions. Water movement through the glacial debris field at the lowest heights in the basin is possible, however, the summer ice surface height increase (Fig. 4c), in concert with the height increase at the basin edge (Fig. 3b), implies that in this area subglacial water existed at the bed with sufficient pressure to lift the overlying ice. The match in timing and relative magnitude of the height increase shows good hydraulic connectivity for subglacial water over an extended area of many km2. Surface water at the basin periphery clearly will freeze and snow will collect in these regions during the fall, winter and spring. This can explain the increase in the heights in Fig. 3b for the magenta dots in Fig. 3a during the six fall, winter and spring periods.
The slow increase in surface elevation for Area 2 in Fig. 4b over the winter months is followed by a significant drop in surface elevation in the summer months. There are clear signs of extensive supraglacial melt water channels in the imagery and ArcticDEM strips (e.g. Fig. 4a) in the area upstream of Area 1 extending into and beyond Area 2. It is not unreasonable to suggest that at least some of this water will collect under the ice and ultimately flow into the lower region of the basin (Area 1) when the upstream water level or pressure reaches a critical point. This flow then increases leading to the upward spike in surface height in Figs. 3b and 4c. Further, the upstream summer height loss visible in Fig. 4b happens at the same time as the downstream height increases suggesting that the relatively sudden yearly release of the upstream subglacial water into the lower elevation region of the basin (Area 1) creates, or adds to, what appears to be a subglacial lake.
The summer surface height increase visible in Figs. 3b and 4c is followed by a relatively sudden drop in surface height later in the fall. This implies a jökulhlaup type outflow possibly when the melt at the northern basin edge allows water to begin flow along the low elevation pathway visible on the northeastern edge of the basin into the western edge of Disreali Glacier (white arrows in Fig. 2a). The minimum heights at the basin edge after the outflow (Fig. 3b) are 637.23 ± 0.14 m (26 September 2019), 637.16 ± 0.03 m (4 November 2020), 637.28 ± 0.03 m (3 November 2021), 637.26 ± 0.04 m (18 October 2022), 637.15 ± 0.27 m (30 October 2023) and 637.13 ± 0.2 (15 September 2024). Although there is a potential of small bias errors in these estimates, the results show that the outflow stops when the water level drops to a particular level around 637.2 m. It is clear that 2021 was a relatively low melt year with a smaller increase in melt water surface water elevation at the basin edge. Whether the subglacial lake under the ice at Area 1 in Fig. 4a exists only in the summertime or if there is a persistent subglacial lake there is not known.
There are some parallels between the current study site and the site of the active subglacial lake identified on the Manson Icefield (Gray and others, Reference Gray2024b). In the glaciological past both would have been tributaries flowing into larger glaciers; the western arm of Mittie Glacier on Manson and the Disreali Glacier in the present study. But now both exhibit a minimum surface elevation in the middle of the basin and no ice flows from the basin into the larger glacier, although melt water clearly does. This geometry is inducive to the creation of subglacial lakes (Livingstone and others, Reference Livingstone, Clark, Woodward and Kingslake2013). The possible build-up of subglacial water could trigger a surge event but in both cases the evidence points to periodic subglacial water movement, in the current study on a yearly basis.
The difference in relative returns for the radar depth sounder data between the 2014 and 2017 data may be a consequence of the presence of water creating a more reflective bed at the upstream 2017 transect in relation to the 2014 transect over the stagnant ice close to the Disreali Glacier. If the sequence of events postulated above for the movement of melt water was duplicated in 2017 and 2014 then the MCoRDS data are consistent with the picture of subglacial water movement suggested above.
ITS_LIVE data (Fig. 2c) shows that the ice in the basin is moving very slowly and is essentially stagnant at the northeastern end of the basin. Consequently, we suggest that the observed height changes are much more likely to be caused by the movement of subglacial water, as outlined above, than by any effect of ice dynamics.
Supplementary material
The supplementary material for this article can be found at https://doi.org/10.1017/jog.2025.10090.
Acknowledgements
NSIDC facilitated the provision of ICESat-2 data (https://nsidc.org/data/data-access-tool/ATL06/versions/6). DEMs were provided by the Polar Geospatial Center under NSF-OPP awards 1043681, 1559691 and 1542736 (https://www.pgc.umn.edu/data/arcticdem/). Velocity data were provided by the NASA MEaSUREs ITS_LIVE project (https://nsidc.org/apps/itslive/, Gardner and others, Reference Gardner, Fahnestock and Scambos2024). We acknowledge the use of MCoRDS data from CReSIS generated with support from the University of Kansas and NASA Operation IceBridge (https://nsidc.org/data/irmcr2/versions/1 and https://data.cresis.ku.edu/data/rds/).
Competing interests
The author declares that he has no competing interests for this paper.


 Open access

