


1. Introduction
The Supplemental Nutrition Assistance Program (SNAP) is the federal government’s most extensive policy (concerning funding and participation) designed to help lower-income households pay for food items. In 2015, SNAP cost approximately $74 billion in federal spending and included 46 million participants (U.S. Department of Agriculture, Food and Nutrition Service [USDA-FNS], 2015b). This article empirically analyses whether SNAP participants pay different food prices compared with nonparticipants and, more importantly, whether SNAP participation influences the prices households pay for food items.
Although most studies analyzing consumer behavior assume households are price takers, prices paid are not completely exogenous. Prices also stem from households’ optimizing behavior (Stigler, Reference Stigler1961). This is important from a policy analysis perspective. A large literature assesses SNAP’s impact by evaluating its overall effect on participants’ food expenditures exclusively, ignoring the separate potential impact of the program on the price and quantity components of expenditures. Further, a better understanding of price differences between SNAP recipients and other populations can help to assess the adequacy of SNAP allotments (Institute of Medicine and National Research Council, 2013).
Our analysis uses the National Household Food Acquisition and Purchase Survey (FoodAPS) data set. FoodAPS is the first nationally representative survey of U.S. households’ detailed food purchases, including data on food quantities and prices. FoodAPS also includes detailed information about household composition, sociodemographic characteristics, households’ local food market structure, and whether the household participates in SNAP.
There are various reasons why SNAP participants might pay higher or lower prices than non-SNAP recipients. These reasons can be categorized in demand- and supply-based explanations. Demand-related explanations for potential differences in food prices paid by SNAP participants and nonparticipants include the same theories used to explain differences between the marginal propensities to spend on food out of SNAP benefits (MPS) and cash income (MPC). For example, Senauer and Young (Reference Senauer and Young1986) argue that program participation might induce a sense of “responsibility” among recipients motivating them to expand their food spending, generating a higher marginal impact of SNAP benefits relative to cash on food spending.
The same sense of responsibility can motivate program participants to search for lower prices. These authors also suggest that receiving a monthly SNAP allotment might allow households to make larger purchases allowing them to take advantage of bulk price discounts (although they also suggest a monthly distribution might motivate households to make comparatively more expensive purchases). More recently, Beatty and Tuttle (Reference Beatty and Tuttle2015) suggest differences in marginal propensities to spend out of SNAP benefits and cash income might be explained by Thaler’s (Reference Thaler1999) insight, which postulates that households categorize income based on its source. Thus, income from different sources might be allocated to different expenditure categories and motivate different price shopping behaviors.
Another demand-related explanation of potential differences in prices paid by SNAP participants and nonparticipants is households’ participation in SNAP’s educational program (SNAP-Ed). SNAP-Ed includes four components: dietary quality and nutrition; physical activity; food access, food security, and shopping behavior; and food resources management. Information obtained from the latter two components might assist SNAP-eligible households in paying lower food prices (USDA-FNS, 2015a).
With respect to supply-related explanations of differences in prices paid by SNAP participants and nonparticipants, previous policy literature suggests that some retailers might be able to anticipate SNAP-generated demand shifts during benefit distribution periods and take advantage by raising their prices. Hence, SNAP participants might pay higher prices compared with non-SNAP recipients shopping elsewhere or with consumers who shop at the same store but purchase food throughout the SNAP cycle (Hastings and Washington, Reference Hastings and Washington2010). However, it is important to emphasize that supply-related explanations are related to consumer behavior because retailers respond to demand shifts.
This study contributes to the literature examining the relationship between SNAP and food prices, the literature examining the effect of SNAP participation on food purchasing behavior, and the larger literature analyzing determinants of food prices. A large literature examines the impact of SNAP participation on food spending. However, to the best of our knowledge, none of these studies have examined the direct effect of SNAP participation on prices households pay for food.
In contrast to the previous literature that examines the relationship between SNAP participation and food prices by focusing on retailers’ prices, the SNAP benefit distribution period, and food expenditure patterns on the part of SNAP-eligible households (Goldin, Homonoff, and Meckel, Reference Goldin, Homonoff and Meckel2016; Hastings and Washington, Reference Hastings and Washington2010), we provide a direct comparison of prices paid by SNAP participants and nonparticipants and use instrumental variable (IV) procedures to estimate a causal effect of SNAP participation on prices paid. The FoodAPS data set also includes a larger geographic sample, a wider variety of food products, and a larger set of explanatory variables, allowing us to contribute to the literature examining determinants of food prices.
We find SNAP participating households pay, on average, comparatively lower prices than non-SNAP households. However, after controlling for household, food consumer competency-related, and food market structure variables using a linear model and ordinary least squares (OLS) estimation procedures, we do not find evidence of an association between SNAP participation and food prices. We also test and estimate the causal effect of SNAP participation on prices paid using IV estimation procedures. Our results suggest SNAP participation does not affect the prices paid for food items. These results are consistent across a variety of model specifications and procedures.
2. Literature review
In this section, we review the literature examining the impact of SNAP on food expenditures, the literature analyzing the relationship between SNAP participation and food prices, and the literature examining other factors that affect the prices consumers pay for food.
2.1. SNAP’s effects on food expenditures
Cuffey, Beatty, and Harnack (Reference Cuffey, Beatty and Harnack2016) identify 51 studies conducted between 1974 and 2014 examining the effect of SNAP benefits (using MPS) on food-at-home spending or the difference in effects between SNAP benefits and other income (MPS − MPC). Average MPS and MPC values from previous studies were 0.327 and 0.105, respectively. The reported average difference between MPS and MPC was 0.245. A limitation of most of the studies identified in the authors’ review is that they do not correct for systematic biases that might be present because of unobservable factors. Most of the literature that the authors’ review also did not consider potential separate effects of SNAP participation on quantity purchased and prices paid for food items.
A more recent study by Hastings and Shapiro (Reference Hastings and Shapiro2017) uses retail panel and administrative data to motivate three methods for causal inference on the effect of SNAP participation on food expenditures. Estimated MPS ranges from 0.5 to 0.6. These authors also explore the effect of SNAP participation on shopping effort (which is related to prices paid) by analyzing store brand share changes and coupon redemption behavior after households start receiving SNAP benefits. Both store brand share and coupon redemption drop after households enter the program.
2.2. Food prices and SNAP
Hastings and Washington (Reference Hastings and Washington2010) use 26 months of scanner data (2006–2008) from three Nevada stores to explore these retailer price changes in response to consumer demand shifts generated by regular SNAP benefits distribution. First, they construct a price index for a SNAP recipient’s typical food basket. They subsequently estimate a linear regression model with the price index as the dependent variable and as explanatory variables dummies for the week of the month. They find that the price of the basket was comparatively more expensive during the weeks after SNAP benefit distribution. They also find that SNAP participants did comparatively more food shopping when they received their benefits. Both findings suggest that SNAP recipients might pay higher aggregate food prices than do nonrecipients, although they do not directly compare prices paid by participants and nonparticipants. Using a similar empirical approach and weekly scanner price data (2006–2012) from the 48 contiguous states and Washington, D.C., Goldin, Homonoff, and Meckel (Reference Goldin, Homonoff and Meckel2016) find similar monthly cycles in the food expenditures of SNAP-eligible households. However, the authors find no evidence that retailers’ food prices are associated with the SNAP issuance timing.
With respect to the relation between SNAP-Ed efforts and prices participants pay, Kaiser et al. (Reference Kaiser, Chaidez, Algert, Horowitz, Martin, Mendoza, Neelon and Ginsburg2015) find SNAP-Ed participation is associated with the use of behaviors related to cost minimization including using coupons and comparing prices of goods. However, SNAP-Ed currently constitutes approximately 1% of SNAP’s total budget and number of participants, making its impact relatively minimal.Footnote 1 These factors suggest that SNAP-Ed is unlikely to have a major influence on SNAP participants’ food costs.
Although a separate food assistance program, previous literature examining the impact of the Women, Infants, and Children (WIC) program’s impact on prices charged by manufacturers and retailers for WIC-eligible products provides similarly mixed results. Examining California retailers, Saitone, Sexton, and Volpe (Reference Saitone, Sexton and Volpe2015) find that WIC food prices vary widely by retailer size but that only smaller vendors excessively mark up these products. Using data on manufacturers of infant formula WIC rebate bids (1986–2007) from several states, Davis (Reference Davis2012) finds WIC has no impact on wholesale price.
2.3. Other determinants of food prices
Previous literature finds a consistent positive relationship between higher household income and prices paid for food items. One explanation for this relationship is that better-quality food is more affordable at higher income levels (Aguiar and Hurst, Reference Aguiar and Hurst2007; Kyureghian, Nayga, and Bhattacharya, Reference Kyureghian, Nayga and Bhattacharya2013). Consistent with this hypothesis, some health literature finds that lower-income households purchase comparatively more food items with greater energy density and higher fat content, but these are typically less expensive (Drewnowski and Specter, Reference Drewnowski and Specter2004; Morland, Wing, and Roux, Reference Morland, Wing and Roux2002). Even when food items are of the same quality, higher-income households may be willing to pay higher prices because they face comparatively higher trade-offs to search for lower prices (Becker, Reference Becker1965). Cronovich, Daneshvary, and Schwer (Reference Cronovich, Daneshvary and Schwer1997) find that households earning more than $75,000 annually were less likely to use coupons compared with those that thought their income was “inadequate” (p. 1639).Footnote 2
A household’s level of education, similar to household income, may also affect purchasing decisions. In theory, individuals with more education are more likely to understand and implement cost-saving strategies, such as using coupons, to pay lower prices for food (Narashman, Reference Narashman1984). However, Cronovich, Daneshvary, and Schwer (Reference Cronovich, Daneshvary and Schwer1997) find no statistically significant relationship between coupon use and college education. Conversely, the authors found a statistically significant relation between coupon use and households with at least one full-time college student.
Household composition and age of household members also affect food decisions and food prices. Households with comparatively more children are less likely to form specific buying habits (Békési, Loy, and Weiss, Reference Békési, Loy and Wiess2013) or use coupons (Cronovich, Daneshvary, and Schwer, Reference Cronovich, Daneshvary and Schwer1997). Households with comparatively older shoppers are more likely to develop buying patterns based on past purchases (Békési, Loy, and Weiss, Reference Békési, Loy and Wiess2013), purchase food products believed to have higher nutritional quality (Blanciforti, Green, and Lane, Reference Blanciforti, Green and Lane1981), and be more willing to search for lower food prices (Aguiar and Hurst, Reference Aguiar and Hurst2007).
Racial composition also may help explain disparities in prices paid for food. African American and Hispanic households are significantly less likely to use coupons than are other racial groups (Cronovich, Daneshvary, and Schwer, Reference Cronovich, Daneshvary and Schwer1997). Geographic proximity to food providers (in many cases related to neighborhoods’ racial composition) also affects a household’s local food environment. Cummings and Mcintyre (Reference Cummings and Macintyre2006), as well as Zenk et al. (Reference Zenk, Shultz, Israel, James, Bao and Wilson2005), find that predominantly African American neighborhoods are more likely to be located farther from food retailers than are neighborhoods with other racial compositions. When combined with limited transportation options, this affects where a household can shop, which influences food prices (Chung and Myers, Reference Chung and Myers1999; Morland, Wing, and Roux, Reference Morland, Wing and Roux2002). According to Kunreuther (Reference Kunreuther1973), households in similar situations are “more likely to patronize the neighborhood store than to travel some distance to [a] chain store” (pp. 373–74). Hoch et al. (Reference Hoch, Kim, Montgomery and Rossi1995) find that “isolated stores display less price sensitivity than stores close to their competitors” (p. 28). Rose et al. (Reference Rose, Bordor, Swalm, Rice, Farley and Hutchinson2009) find that citizens of New Orleans who did not own a means of transportation paid approximately $11 per month more in travel costs than did those with their own vehicles.Footnote 3
Although many of these factors are beyond the household’s control, behaviors that reduce or improve their ability to pay comparatively lower food prices are not. For example, with budgeting and financial education, food purchasers may be able to use cost-saving strategies better, such as using coupons (Cronovich, Daneshvary, and Schwer, Reference Cronovich, Daneshvary and Schwer1997; Narashman, Reference Narashman1984). Similarly, lower-income households may fail to recognize that certain food items exhibit “size effects,” in which lower unit prices are available if larger quantities are purchased (Beatty, Reference Beatty2010; Kunreuther, Reference Kunreuther1973; Mendoza, Reference Mendoza2011; Rao, Reference Rao2000). Educational programs could improve consumer knowledge and result in increased use of these and other money-saving buying strategies.
Our analyses extend the literature by examining the effect of SNAP participation on prices paid. The FoodAPS data set provides a more direct means to examine prices SNAP participants paid and includes more explanatory variables than were available in the previous literature.
3. Data
The FoodAPS data set contains information from a nationally representative survey of U.S. households’ food purchases collected from April 2012 to January 2013. FoodAPS includes six data subsets: individual, household, events, items, places, and geodata. These subsets contain data on individual and household characteristics, food items purchased, the location where they were purchased, local food market information, and geographic distance from the household to food retailers. FoodAPS includes 55,307 observations of 4,826 families who chose from 208 different food group items. Table 1 provides a complete list of food items.
Food items surveyed a

a Where RFG refers to refrigerated items; FRZ, to frozen items; and UWF, to uniform weight fresh items.
FoodAPS data were collected using a multistage sampling design. In the first stage, a stratified sample of 50 primary sampling units (PSUs) was selected, in which PSUs were counties or groups of counties. Each unit reflects overall sample targets and estimated populations for each PSU. In the second stage, eight secondary sampling units (SSUs) or block groups within each of the 50 PSUs were selected. Stage three selected addresses within each SSU (Krenzke and Kali, Reference Krenzke and Kali2016).
The survey collected information on all food purchases made by members of each household over 7 days. Data about acquisitions of food at home were collected using three methods: (1) using survey booklets in which households recorded information about each purchase event/placed visited, (2) using handheld scanners, and (3) using saved receipts for items (postsurvey). During each survey day, respondents had to record in the survey booklet all places from which food for consumption at home was acquired, record the amounts spent, and attach the corresponding receipts. Households had to subsequently scan every item purchased to obtain quantitative information. If items could not be scanned, households had to manually enter information about the items in the survey booklet (product description and amount).
Data about each purchase event documented in the survey booklet were first collected over the phone and later cross-checked using receipt information. Prices were assigned using the receipt information (USDA, Economic Research Service [USDA-ERS], 2016). FoodAPS identified the primary food shopper as the primary respondent for each household.Footnote 4
The data collection process included interviews before and after food purchases were recorded. A screening interview was conducted first to determine a household’s eligibility to participate in FoodAPS and to collect information on households’ income and income sources.Footnote 5 The initial interview built the household roster and collected demographic information about each household member, including age, sex, race, marital status, and education level.Footnote 6 Information about participation in government programs, including SNAP, and about shopping behaviors or habits was also collected during the initial interview. The second and final interview collected information on household income, nonfood expenditures, dietary knowledge, and whether there were any complicating factors that affected food purchase decisions.Footnote 7
Households also were asked whether they participated in SNAP, when they last received SNAP benefits, and the amount they received. To verify that households’ answered truthfully, all households that provided consent were matched with administrative records from the caseload and Anti-Fraud Locator Retailer Transactions (ALERT) data.Footnote 8 This verification process reduces the recurring problem of underreporting in the SNAP literature (Almada, McCarthy, and Tchernis, Reference Almada, McCarthy and Tchernis2015).
The FoodAPS Retail Environment Study Data provide food access and food market information. The food access data include county-level information on the total number of food retailers. Information about food retailers is assigned to four categories: supermarkets, nonsupermarkets, farmers’ markets, and farmers’ markets that accept SNAP. Supermarkets are categorized as food retailers with annual sales greater than $2 million.
The nonsupermarket category includes grocery stores with annual sales less than $2 million and includes convenience stores, pharmacies, gas stations, dollar stores, and specialty stores such as bakeries. Data on the distance to the nearest SNAP-authorized retailers were compiled in the geography component of the FoodAPS database, which uses the PSU to collect information on the availability of food vendors, types of food vendors available, and their geographic distance from the surveyed household’s place of residence.
4. Theoretical model
We assume the following utility maximization household model:
 $$Ma{x_{q,z,{t_q}}}{\rm{}}U\left( {q,z;{K_U}} \right){\rm{}}s.t.{\rm{}}\left( {P + \mu {t_q}} \right)q + z = I + \mu T,\,\,{\rm{and}}\,\,P = {\rm{ }}P({t_q},{K_p}),$$
where q stands for food consumed and z stands for all other commodities in the utility function U(.). KU represents household characteristics affecting consumer preferences. The variable μ is the endogenously determined opportunity cost of time. P is the price of food. I represents income. T represents total time available, and tq is total time spent on food price search. In addition to a “full income budget” constraint (Becker, Reference Becker1965), our utility maximization model includes the price function P(tq, Kp ), which depends on the time spent on price search (tq ) and households’ characteristics affecting this technology (Kp ) (Aguiar and Hurst, Reference Aguiar and Hurst2007). The price function is meant to represent households’ shopping ability to obtain lower prices. We also assume the utility maximization process is conditional on other choices households make at a higher decision level (e.g., labor supply).
Reduced functions for optimal values of q, z, and tq are thus given by q = q(I, T; KU , Kp ), z = q(I, T; KU , Kp ), and tq = tq (I, T; KU , Kp ) Substituting tq (I, T; KU , Kp ) in P(tq , Kp ), we obtain the reduced form model P = P(I, T; KU , Kp ). This function form gives us our price function and serves as the basis of our empirical analysis. To evaluate the effect of SNAP participation on prices, we include it as an argument in the price function such thatFootnote 9
 $$P{\rm{ }} = P\left( {I,T,{\rm{}}SNAP;{K_U},{K_p}} \right).$$
4.1. The expensiveness index
Following Aguiar and Hurst’s (Reference Aguiar and Hurst2007) method, we construct a food price index that we refer to as an expensiveness index to address the variety of food products each household purchased. This expensiveness index reflects the cost of a household’s food basket at the average prices all households in the sample paid relative to the actual cost of the basket at the prices which the household paid (Aguiar and Hurst, Reference Aguiar and Hurst2007; Beatty, Reference Beatty2010).Footnote
10
We calculated total expenditures for household j in period m ( $\bi{X}_{\bi{m}}^{\bi{j}})$
as follows:
$\bi{X}_{\bi{m}}^{\bi{j}})$
as follows:
 $${\bi{X}}_{\bi{m}}^{\bi{j}} = \sum\nolimits_{i \in I,{\rm{}}t \in m} {p_{i,t}^jq_{i,t}^j} = \sum\nolimits_{i \in I,{\rm{}}t \in m} {X_{i,t}^j} ,$$
where $p_{i,t}^j$
denotes the price paid per ounce,
$p_{i,t}^j$
denotes the price paid per ounce, $q_{i,t}^j$
denotes the number of ounces purchased, and
$q_{i,t}^j$
denotes the number of ounces purchased, and $X_{i,t}^j$
denotes expenditures for good i and shopping trip t. We calculated the average price paid for product i across all households in period m (
$X_{i,t}^j$
denotes expenditures for good i and shopping trip t. We calculated the average price paid for product i across all households in period m ( ${\bar p_{{\rm{i}},m}}$
) as
${\bar p_{{\rm{i}},m}}$
) as
 $${\bar p_{{\rm{i}},m}} = \sum\nolimits_{j \in J,t \in m} {({{X_{i,t}^j{W_j}} \over {{{\bar q}_{i,m}}}})} ,$$
where
 $${\bar q_{i,m}} = \sum\nolimits_{j \in J,t \in m}\hskip -3pt.\hskip 1pt {q_{i,t}^j} $$
is the total quantity of food item i all households purchased during period m, and Wj
is the survey households’ weights.Footnote
11
The cost of household j’s food basket at average prices is
$${\bar q_{i,m}} = \sum\nolimits_{j \in J,t \in m}\hskip -3pt.\hskip 1pt {q_{i,t}^j} $$
is the total quantity of food item i all households purchased during period m, and Wj
is the survey households’ weights.Footnote
11
The cost of household j’s food basket at average prices is
 $${\tilde X_j} = \sum\nolimits_{i \in I} {{{\bar p}_{i,m}}\,q_{i,t}^j} .$$
Finally, the expensiveness index for the set of all goods I for household j is (Pj ):
 $${P^{\boldsymbol{j}}} = {{{X_j}} \over {{{\tilde X}_j}}}.$$
We normalized the price index around 1 by dividing the index for each household by the mean expensiveness index overall. An expensiveness index greater than 1 indicated that a household spent more than average on its food basket, and a value less than 1indicated that the household spent less than average. In our final analysis, equations (1) and (2) considered the entire period of observation for all households (10 months) as a single period (m = 1).
4.2. Regression model
We used the following linear model:
 $${P^j} = \alpha {\rm{}} + {\rm{}}{\beta _{SNAP}}SNAP + \beta _{{X^H}}^{\rm{’}}{\bi{Z}}_{\bi{j}}^{\bi{H}} + {\rm{}}\beta _{{X^C}}^{\rm{’}}{\bi{Z}}_{\bi{j}}^{\bi{C}}{\rm{}} + {\rm{}}\beta _{{X^M}}^{\rm{’}}{\bi{Z}}_{\bi{j}}^{\bi{M}}{\rm{}} + {\rm{}}{e_j}.$$
As previously noted, Pj
represents our expensiveness index and was regressed against our
Z
H
,
Z
C
, and
Z
M
vectors that consisted of our household, food consumer competency-related, and food market environment variables, respectively. Term ej
is random error, and the $\beta^\prime _{\rm{s}}$
are coefficients. SNAP, our primary variable of interest is a binary variable that indicates the household participated in the SNAP program. Households were identified as SNAP recipients if they indicated they received benefits and their participation was confirmed by administrative match (to avoid misreporting participation that could bias our results).Footnote
12
Non-SNAP households included both low-income SNAP-eligible households and noneligible households. High-income noneligible households were also included in the comparison group to better capture price differences stemming from supply related explanations including strategic retailer behavior targeting stores with low-income consumers (including SNAP participants and nonparticipants).
$\beta^\prime _{\rm{s}}$
are coefficients. SNAP, our primary variable of interest is a binary variable that indicates the household participated in the SNAP program. Households were identified as SNAP recipients if they indicated they received benefits and their participation was confirmed by administrative match (to avoid misreporting participation that could bias our results).Footnote
12
Non-SNAP households included both low-income SNAP-eligible households and noneligible households. High-income noneligible households were also included in the comparison group to better capture price differences stemming from supply related explanations including strategic retailer behavior targeting stores with low-income consumers (including SNAP participants and nonparticipants).
Our household control vector included the logarithm of the annual household income, its squared value, and the logarithm of the household size.Footnote 13 We used the same age distinctions as those of Beatty (Reference Beatty2010) to determine the effects of household composition on prices paid for food items, in which we included the percentage of household members over 60 years old, between 5 and 17 years old, and less than 5 years old. Table 2 provides a complete list of all variables used and how they were measured. Table 3 provides variable summary statistics.
Variable categories and explanations

Note: SNAP, Supplemental Nutrition Assistance Program.
Summary statistics

a These are the 5th and 95th percentiles, except for StateIncomePerCapita and StateUnemployment, which correspond to the 20th and 80th percentiles. We do not report minimum and maximums because of data disclosure concerns. The 20th and 80th percentiles for StateIncomePerCapita and StateUnemployment are percentiles of the empirical distribution containing only state-level data, not household-level data.
Note: SNAP, Supplemental Nutrition Assistance Program.
4.3. OLS regression estimation methods
We first used the OLS approach with different groups of control variables in our analysis. OLS allowed us to explore the association between the expensiveness index and all explanatory variables. In model 1, we included only our SNAP variable. Model 2 included the SNAP variable and our household control vector. Model 3 included the SNAP variable along with our household and food consumer competency-related control vectors. Model 4 included the SNAP variable and all of our control vectors. Adding explanatory variables to the model allowed us to explore how the relationship between our expensiveness index and the SNAP variable changed as different control categories were introduced.
4.4. Instrumental variable methods
The SNAP variable might still be correlated with some unobservable food price determinants even after including a large set of control variables. For example, previous SNAP recipients may be impatient, which is an unobserved trait (Hastings and Washington, Reference Hastings and Washington2010). Similarly, the ability to search and process information to compare prices effectively might also be correlated with the ability to find assistance programs and correctly apply for them (e.g., filling out relevant paperwork).
We used an IV approach to account for the endogeneity of selection into the SNAP program (Ratcliff, McKernan, and Zhang, Reference Ratcliff, McKernan and Zhang2011). We used three state policy variables as outside instruments to identify the causal SNAP participation variable: a dummy variable representing whether the state allows households to use a streamlined application process for recipients of Supplemental Security Income, a binary variable representing whether the state allows households to apply for SNAP benefits online, and the proportion of SNAP units with earnings that have recertification periods longer than a year.Footnote 14 All of these instruments reduce the cost to participate in SNAP.
We obtained these variables for 2012 and 2013 from the USDA’s SNAP Policy Database (https://www.ers.usda.gov/data-products/snap-policy-data-sets/). Following the method used by Ng and Bai (Reference Ng and Bai2009), we only included instruments with a t-statistic greater than 2.50 using a first stage regression approach. We also only included instruments that had the expected sign in the first stage regression to ensure their theoretical validity.Footnote 15
It is important to note that these variables are determined at the state level and are not controlled by sample members. However, it is possible that changes in state-level SNAP policies are correlated with state-level macroeconomic conditions that could affect aggregate food demand and prices. We controlled for this by including state-level unemployment and income per capita controls in the IV models.Footnote 16 We also tested the instruments’ validity using a Hansen test for overidentification (Wooldridge, Reference Wooldridge2010).
We also used the IV method developed by Lewbel (Reference Lewbel2012) both as a robustness check and to obtain potential efficiency gains (Almada, McCarthy, and Tchernis, Reference Almada, McCarthy and Tchernis2015; Baum, Reference Baum2011; Lewbel, Reference Lewbel2007, Reference Lewbel2012). Lewbel’s (Reference Lewbel2012) procedure works as follows. For simplicity, the main model for price P in equation (7) can be rewritten as
 $$P = {\rm{}}{\bi{Z{\rm{’}}{\gamma _1}}} + {\beta _{SNAP}}SNAP + e,$$
where index j has been omitted, Z is the vector of all explanatory variables excluding the SNAP variable, γ 1 is the corresponding vector of parameters, and e represents the error term. A reduced form model for participation in the SNAP program can be written as
 $$SNAP = {\bi{{Z_S}{\gamma _2}}} + \varepsilon ,$$
where Zs is the vector of variables affecting participation including both Z and a vector of outside instruments H (i.e., Zs = [ Z H ]). γ 2 is the vector of coefficients in the participation equation, and ε is the error term. Identification and estimation of equations (8) and (9) are based on the following moment conditions and heteroscedasticity of the errors (Lewbel, Reference Lewbel2012):
 $${\bi E}\left( {{\bi Z}e} \right) = 0,{\rm{}}{\bi E}\left( {{\bi Z_S}\varepsilon } \right) = 0,\,\,\,Cov\left( {{\bi Z_L},e\varepsilon } \right) = 0,$$
where ZL can be equal to ZS or a subset of it. The first two sets of moment conditions correspond to the standard moment conditions used when instruments and explanatory variables are exogenous. The third set of moment conditions requires ZL to be uncorrelated with the product of errors. Although the last moment conditions are not very intuitive, the validity can be assessed using a Hansen’s overidentification test. More importantly, the third moment conditions make it possible to identify and estimate parameters in equations (8) and (9) without outside instruments or to use this additional information to improve efficiency. In our application, ZS = ZL ; thus, the additional moment conditions were used to gain efficiency and to test the sensitivity of our results to additional model assumptions. Implementation of the procedure was carried out using STATA (Baum, Reference Baum2011).
5. Empirical results
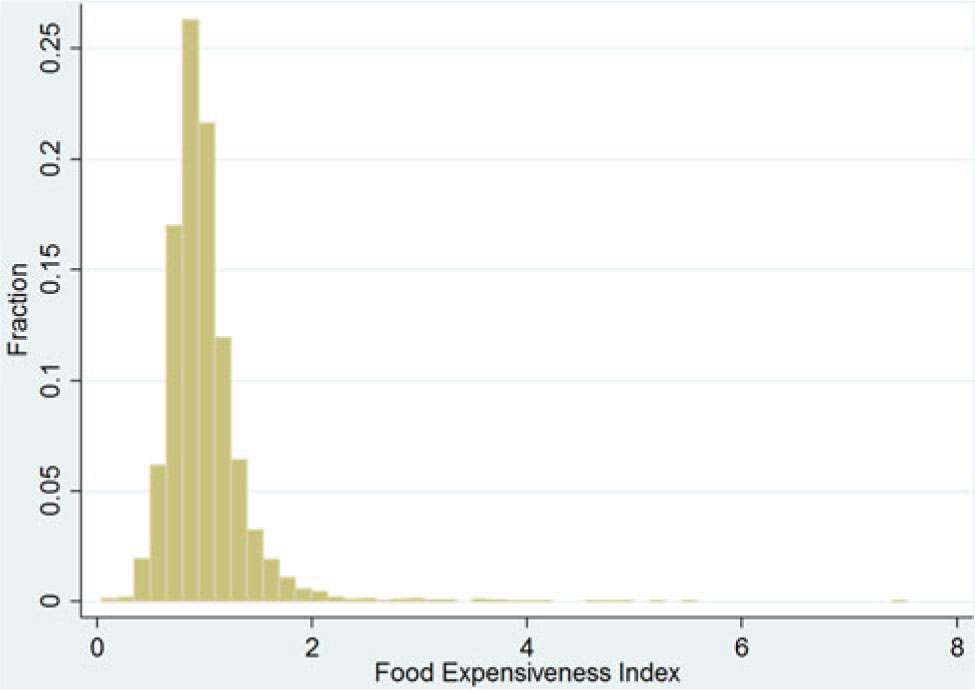
Figure 1 displays a histogram of the expensiveness index. Although the data included some unexpectedly large and low index values, 98% of the data lies between 0.43 and 2.21 times the average cost of a households’ food basket. As shown in Table 3, the mean household size in our sample was 3 people (mean logarithm = 0.94). Our SNAP variable had a mean value of 0.28, indicating that approximately 28% of our households sampled were confirmed participants. FinancialCapacity had a mean of 0.36, indicating that approximately 36% of our households sampled had at least $2,000 in liquid assets. Supermarket and Nonsupermarket county densities ranged from 0 per 1,000 people to more than 0.19 and 0.47 per 1,000, respectively.
Expensiveness index distribution.
All the SNAP variable coefficients in Tables 4 and 5 represent estimates of the difference in the average value of the expensiveness index between SNAP participants and nonparticipants, without controlling (model 1) or controlling (models 2–4) for other factors affecting the index. The baseline specification using OLS (Table 4) indicated that SNAP participants’ mean expensiveness index was approximately 0.10 points lower (i.e., 10%) than that of SNAP nonparticipants, which is a large significant and economic difference.Footnote 17 To put things in perspective, a 10% difference in price corresponds to approximately $9 per week for SNAP recipients, as their average weekly expenditures on food at home are approximately $93.35 (Smith et al., Reference Smith, Berning, Yang, Colson and Dorfman2016).
Determinants of the expensiveness index: ordinary least squares results

Notes: Model 1 regresses our expensiveness index on our Supplemental Nutrition Assistance Program (SNAP) variable. Model 2 includes SNAP and household variables. Model 3 includes SNAP, household, and food consumer competency-related variables. Model 4 includes our SNAP, household, food consumer competency-related, and market variables. *P ≤ 0.1, **P ≤ 0.05, and ***P ≤ 0.01. Regressions are reported with robust standard errors. SE, standard error.
Determinants of the expensiveness index

Notes: Model 1 regresses our expensiveness index on our Supplemental Nutrition Assistance Program (SNAP) variable. Model 2 includes SNAP and household variables. Model 3 includes SNAP, household, and food consumer competency-related variables. Model 4 includes our SNAP, household, food consumer competency-related, and market variables. *P ≤ 0.1, **P ≤ 0.05, and ***P ≤ 0.01. Regressions are reported with robust standard errors. IV-2SLS, instrumental variable two-stage least squares; SE, standard error.
When we controlled for household variables, the difference in the index value between SNAP participants and nonparticipants estimated was still negative and statistically and economically significant. However, the magnitude (in absolute value) decreased to approximately 4%. When we controlled for food competency-related and market environment variables, the estimated difference in the expensiveness index value decreased to less than 3% and became insignificant.
The R 2 of models 1–4 increased substantially from model 1 to model 2 (from 0.013 to 0.066) and from model 3 to model 4 (from 0.070 to 0.080) but very little from model 2 to 3 (from 0.066 to 0.070).Footnote 18 This provides evidence that sociodemographic factors and market environment characteristics are more important in explaining the expensiveness index than food competency-related factors.
Using OLS, we also found a consistent, negative statistically significant relationship between household size and our expensiveness index. Our estimates indicate each additional household member is associated with a decrease in the expensiveness index of approximately 0.07 to 0.09 points, similar to the 0.10 value reported in the United Kingdom by Beatty (Reference Beatty2010). In contrast to Beatty (Reference Beatty2010), we do not find evidence that household composition affects the expensiveness index.
The primary food purchaser’s age also had a consistent, negative statistically significant relation to the expensiveness index where a 1-year increase in the primary food purchaser’s age was associated with a decrease in the expensiveness index of approximately 0.002 to 0.003 points. Household income was also found to have a positive relationship with the expensiveness index.Footnote 19 At the mean income (approximately $40,000), a 1% increase in income was associated with an approximately 0.02% increase in the index. This elasticity value is smaller to the 0.08 value reported by Beatty (Reference Beatty2010).
Higher levels of education had a positive and statistically significant relationship with higher food prices. Our findings indicated that primary food purchasers who earned at least a college degree were associated with a 0.07- to 0.19-point increase (i.e., 7%–19%) in the expensiveness index (relative to primary food purchasers with less than a GED). Primary food purchasers who earned a bachelor’s degree were associated with an approximately 0.10-point increase (i.e., 10%) in the expensiveness index. Primary food purchasers who earned a master’s degree or higher were associated with an approximately 0.17- to 0.20-point (i.e., 17%–20%) increase in the expensiveness index. These effects are estimated after controlling for income and may reflect differences in food quality across education groups. As noted previously, some studies argue that comparatively more educated households may be able to implement cost-saving strategies to pay lower prices. However, these studies hold food quality levels constant (Narashman, Reference Narashman1984).
We also found predominantly Hispanic and Asian households also pay lower prices than other ethnic and racial groups. FinancialCapacity had a consistent and positive statistically significant relationship with the expensiveness index where a household with $2,000 or more in liquid assets was associated with a 0.06- to 0.07-point (i.e., 6%–7%) higher expensiveness index than were households with less than $2,000 in liquid assets.
We found no statistically significant relationship between the expensiveness index and our food competency-related variables. However, we found negative statistically significant relationships between the expensiveness index and if the household lives in a rural location, if there are higher densities of nonsupermarket stores per 1,000 people, and for longer distances to the nearest SNAP-authorized retailer. This last result indicates proximity to authorized SNAP retailers is not necessarily associated with paying lower food prices. We also found that households’ in the South, West, and Midwest regions of the United States paid lower food prices relative to the East region. Detailed results of our findings using the OLS approach are reported in Table 4.
In the next set of regressions, we used a classical IV approach to account for endogeneity of our SNAP variable. We first evaluated the weakness of the instruments using the first stage F-statistic. In all cases, the estimated first stage F-statistic values were larger than 14, suggesting that the instruments are not weak. The effects of the instruments in the first stage regression on the probability of SNAP participation were also found statistically significant and economically important (see Table 6). For example, model 4 indicates that if a state allows households to use a streamlined application process for recipients of the Supplemental Security Income, and to submit a SNAP application online, the probability of households participating in SNAP increases by 9.2% and 18.9%, respectively. Similarly, a 1% increase in the share of SNAP units at the state level with earning and recertification periods longer than a year increases the probability of participation by 2.0% (Table 6).
First sage regression results (IV-2SLS): coefficients of outside relevant instruments

Notes: The first stage regression also included as explanatory variables all the other variables included in IV models 2, 3, and 4 (Table 5). *P ≤ 0.1, **P ≤ 0.05, and ***P ≤ 0.01. Regressions are reported with robust standard errors.
Finally, our overidentification restriction tests failed to reject the null hypothesis that the instruments are uncorrelated with the error term in each regression, providing evidence our instruments are valid. Moreover, because the overidentification test is the same as comparing IV estimates of the SNAP effect using the different instruments, it also provides some evidence of homogeneity of effects (Wooldridge, Reference Wooldridge2010).Footnote 20
Using our IV approach, we found no significant effects of SNAP participation on the expensiveness index across all model specifications. It should be mentioned that the test of whether a causal treatment effect is null only requires the validity of the instrument (Swanson, Labrecque, and Hernán, Reference Swanson, Labrecque and Hernán2018; VanderWeele et al., Reference VanderWeele, Tchetgen, Cornelis and Kraft2014). Thus, the validity of the test for the null effect of SNAP participation on prices is robust to additional assumptions such as homogeneity of treatment effects. Other statistically significant relationships remained largely the same when we compared the results of the OLS and IV approaches.Footnote 21 Detailed findings using the IV approach are reported in Table 5.
Our last set of regressions (also reported in Table 5) used Lewbel’s (Reference Lewbel2012) IV approach. We implemented the procedure with a generalized method of moments estimator. Overidentification restrictions tests (Hansen J-statistic) failed to reject the null hypothesis that the moment conditions implied by the approach were valid, which provides evidence to the validity of the approach (including the key assumption that the product of the errors is uncorrelated with the exogenous explanatory variables). The value of the F-statistics using this approach was greater than 10 for each regression.
We again found no statistically significant effect of SNAP participation on our expensiveness index, although the additional moment conditions appear to provide important gains in efficiency by reducing the standard errors of the SNAP coefficient compared with our previous IV approach. The similarity of our results indicates robustness of our estimated effects of SNAP participation on the expensiveness index. We also find little difference in the statistically significant relationships and quantitative effects of other variables on our expensiveness index compared with our previous approaches.
5.1. Sensitivity analysis
We also conducted a series of sensitivity analyses to evaluate the robustness of our results to various model assumptions with a special emphasis on the robustness of the SNAP coefficient (Table 7). The first groups of robustness checks consider alternative subsample groups. Although our regression models controlled for income level, the sample includes both high- and low-income participants. Thus, observed differences in the expensiveness index might be because of differences in the income level. To test the sensitivity of our analysis to difference effects stemming from varying income levels, we also estimated our models using a subsample of households that receive SNAP benefits and SNAP-eligible nonparticipants (Table 7, S2). A household is SNAP eligible if its annual income is less than 130% of the poverty threshold. These thresholds are determined by the U.S. Department of Health and Human Services (HHS) annual poverty guidelines. We followed the 2012 and 2013 guidelines for the 48 contiguous states and Washington, D.C., to determine SNAP eligibilityFootnote 22 and found no statistically significant effect of SNAP participation on our expensiveness index for SNAP-eligible, but nonparticipating households.
Summary of Sensitivity Analysis: SNAP Coefficient

Notes: Model 1 regresses our expensiveness index on our Supplemental Nutrition Assistance Program (SNAP) variable. Model 2 includes SNAP and household variables. Model 3 includes SNAP, household, and food consumer competency-related variables. Model 4 includes our SNAP, household, food consumer competency-related, and market variables. *P ≤ 0.1, **P ≤ 0.05, and ***P ≤ 0.01. Regressions are reported with robust standard errors. IV-2SLS, instrumental variable two-stage least squares.
The other results were very similar to our previous findings. For example, the OLS regressions indicated that SNAP participants’ mean expensiveness index was approximately 0.08 points lower (i.e., 8%) than that of SNAP-eligible nonparticipants (relative to the previous 10% difference). The SNAP coefficient that estimates this difference remained statistically significant but decreased to 5% when we added household control variables. When we controlled for food competency variables and market environments, the difference was approximately 3.5% and became statistically insignificant (Table 7, S2).
We also tested the robustness of our findings by removing outlying observations (Table 7, S3). We defined outliers as values exceeding 150% of the difference between the interquartile below and above the first and third quartile values, respectively. We removed outlier values above and below these thresholds in the expensiveness index, the logarithm of annual household income, the density of supermarkets in a county, the logarithm of household size, the distance to the nearest SNAP-authorized retailer, the density of nonsupermarkets in a county, and the county population variables. Removing these observations increased our R 2 values from 0.08 to 0.12 for our OLS and IV regressions for our models with all control vectors. However, there was little change in the statistically significant relationships.
To test whether changes in statistical significance or coefficient values of the SNAP variable are caused by a decrease in the number of observations from models 1 to 4, we estimated each model using all the available observations (2,920) to estimate model 4 (Table 7, S2). The results were again largely similar to those in the baseline specification.Footnote 23
We also considered additional and alternative sets of controls for our model. To see whether seasonal food price fluctuations affected the expensiveness index, we included summer, autumn, and winter binary variables (with spring as our base variable; Table 7, S5). Although these variables were statistically significant, our other results remained largely the same. To account for the previous literature showing that SNAP households spend much of their food dollars at the beginning of the month, we included a dummy variable indicating whether the survey took place in the first week of the month (Table 7, S6) literature. This variable was not statistically significant and did not affect our regression results. We then included state dummy variables instead of regional dummies and implemented the three econometric procedures for model 4 (Table 7, S7). The results using OLS were very similar to those in the baseline specification. However, the SNAP coefficient, and corresponding standard error, changed considerably when using the IV-2SLS (instrumental variable two-stage least squares) method and Lewbel IV procedure. However, all other results remained largely similar, and the SNAP variable was still not statistically significant. However, because our instruments are state-level policy variables, adding state dummies when using the standard IV procedure generated a weak instrument problem.
We also used sample weights to estimate our empirical model, as well as the log of the expensiveness index rather than the expensiveness index (Table 7, S8 and S9). Both procedures added little explanatory power.Footnote 24 Finally, we used clustered standard errors (S10, Table 7). Following Abadie et al. (Reference Abadie, Athey, Imbens and Wooldridge2017), we used the survey sample clusters (50 in total) for standard error calculations. The clusters corresponded to the PSUs described in Section 3. Our results were robust to the use of these types of standard errors.
6. Discussion and conclusion
We used the FoodAPS data set to empirically examine whether SNAP participants pay different food prices compared with nonparticipating households and whether SNAP participation influences the prices households pay for food items. Because FoodAPS includes more household characteristics, measures of shopping behavior, and food market variables, our analysis also contributes to the literature by examining a broader set of factors associated with food prices.
Although SNAP participants’ mean expensiveness index was found to be 9% lower than that of nonparticipants, we found SNAP participation had no statistically significant relationship with food prices when we controlled for household, food consumer competency-related, and food market structure variables using OLS. We obtained similar results when we used an IV approach and Lewbel’s (Reference Lewbel2012) method.
A larger body of literature evaluating the effectiveness of the SNAP program focuses on its effect on participants’ food expenditures. Our results suggest that the price component of food expenditures is not affected by SNAP participation. In other words, participants’ price shopping behavior does not seem to be affected by their participation. However, our results also suggest more efforts to promote cost-cutting shopping behavior could be fruitful to improve program effectiveness. Educational efforts, such as SNAP-Ed, may provide some assistance helping program patrons take advantage of bargaining opportunities. Unfortunately, FoodAPS does not provide information on which households participated in SNAP-Ed. Efforts to collect data regarding which SNAP-participating households also participate in SNAP-Ed would be most helpful in determining SNAP-Ed’s effects on several outcomes in addition to food prices.
Our findings also have some implications regarding food market environments and food prices. The concentration of nonsupermarket retailers was associated with comparatively lower prices paid for food items. Although smaller stores (nonsupermarkets) typically charge comparatively higher prices than do larger stores (supermarkets), higher concentrations of nonsupermarkets may result in price competition for consumer patronage.
Finally, it is important to note several limitations in our analyses. First, we used a wide variety of food items, but the approach used does not account completely for product quality, as we had no specific food product brand information. Second, although the expensiveness index is constructed to control for differences in quantities (quantities in the index numerator and denominator are the same), it is still possible that some of the observed differences in the index may be because of differences in quantities. Third, the household expensiveness index is interpreted as an overall measure of food prices, but it includes two components: a food basket and food item prices. Future work using the index could explore the effect of SNAP on the individual components of the index. Fourth, we did not include food items purchased for consumption outside the home, such as meals from fast-food vendors or other restaurants, which are not part of the SNAP program. These four limitations provide important opportunities for future research.
Another limitation is the use of cross-sectional data. Although we use IVs to try to infer the causal effect of SNAP participation on prices, future use of panel data might allow researchers to handle the effects of important unobservables better. Panel data could also help ameliorate some limitations of IV procedures such as the loss of efficiency and small sample biases.
Although our analysis provides important policy implications and contributes to multiple lines of research, much work remains to be done. Additional analysis assessing the impact of other food consumer competency and local food market factors on food prices paid, as well as differences in prices paid using SNAP benefits and other sources of income, could also provide fruitful information to guide SNAP efficiency improvement efforts. More research is also needed to explore the effect of SNAP participation on nonfood expenditures.


 Open access

