


Introduction
Adolescence is a crucial developmental period marked by significant biological and social challenges. It is often the period during which mental health difficulties first onset, making early detection and intervention essential (Solmi et al., Reference Solmi, Radua, Olivola, Croce, Soardo, Salazar de Pablo and Fusar-Poli2022). Cognitive, social, and environmental risk factors can heighten the likelihood of mental health challenges during this stage. Among these, psychotic-like experiences (PLEs) have gained increasing attention as a potential prognostic factor for the development of adult psychopathology.
PLEs include subclinical experiences, such as hearing voices, feeling paranoid, or holding thoughts perceived as odd by others. Research has shown that these experiences do not just occur in those with a formal psychosis diagnosis, but instead they exist on a continuum, ranging from infrequent, mild experiences to severe, distressing symptoms characteristic of clinical psychotic disorders (Linscott & van Os, Reference Linscott and van Os2013). A recent meta-analysis estimated the prevalence of PLEs in children and adolescents at approximately 9.8% (Healy et al., Reference Healy, Brannigan, Dooley, Coughlan, Clarke, Kelleher and Cannon2019). While many PLEs are transient, their presence has been linked to an increased risk of substance abuse, self-harm (Giocondo et al., Reference Giocondo, Salum, Gadelha, Argolo, Simioni, Mari and Pan2021), and a greater likelihood of requiring mental health care (Rimvall et al., Reference Rimvall, Wolf, Olsen, Skovgaard, Clemmensen, Oxholm and Jeppesen2021). Moreover, persistent PLEs have been associated with poorer mental health outcomes, highlighting the importance of exploring the underlying processes that contribute to their maintenance over time (Gregersen et al., Reference Gregersen, Møllegaard Jepsen, Rohd, Søndergaard, Brandt and Elgaard Thorup2022).
The current understanding of psychosocial factors associated with PLEs in adolescents is largely based on the cognitive model of psychosis (Garety et al., Reference Garety, Bebbington, Fowler, Freeman and Kuipers2007). Studies in young populations have demonstrated that childhood trauma and adversity (Kelleher et al., Reference Kelleher, Keeley, Corcoran, Ramsay, Wasserman, Carli and Cannon2013; van Os & Reininghaus, Reference van Os and Reininghaus2016), cognitive biases such as jumping to conclusions (Gin et al., Reference Gin, Stewart, Abbott, Banerjea, Bracegirdle, Browning and Jolley2021; Hassanali et al., Reference Hassanali, Ruffell, Browning, Bracegirdle, Ames, Corrigall and Jolley2015), and emotional dysregulation (Ames et al., Reference Ames, Jolley, Laurens, Maddox, Corrigall, Browning and Kuipers2014) contribute to the presence and persistence of distressing PLEs. However, most of these studies have employed cross-sectional or observational designs, which do not fully capture the complexity of interactions between risk factors over time. Building on this framework, the present study examines how cognitive, emotional, and environmental factors interact within a network analytic approach.
Network analysis has emerged as a promising approach to examining the dynamic nature of psychopathology by conceptualizing mental health symptoms as interconnected systems, rather than isolated constructs (Borsboom & Cramer, Reference Borsboom and Cramer2013). Within this framework, symptoms and risk factors are understood to directly influence one another, rather than being solely the expression of an underlying latent disorder, thereby supporting a more holistic and transdiagnostic perspective. Recent theoretical work has further advanced this view by framing psychopathology as a complex, dynamic system that cannot be fully explained by reductionist models focused on single underlying causes (Borsboom, Cramer, & Kalis, Reference Borsboom, Cramer and Kalis2019). In line with this, contemporary approaches emphasize personalized and time-varying processes, highlighting how symptom interactions unfold over time (Roefs et al., Reference Roefs, Fried, Kindt, Martijn, Elzinga, Evers and Jansen2022). Network modeling offers several advantages over more traditional statistical approaches for advancing our understanding of psychopathological phenomena. First, it provides an efficient framework for visualizing complex dependencies in multivariate data, allowing symptoms and psychosocial factors to be examined as part of an interconnected system (Borsboom et al., Reference Borsboom, Deserno, Rhemtulla, Epskamp, Fried, McNally and Waldorp2021). Second, it enables the quantification of the structural importance of individual nodes (e.g. via centrality indices), thereby identifying variables that may play a more influential role within the network (Opsahl, Agneessens, & Skvoretz, Reference Opsahl, Agneessens and Skvoretz2010). Importantly, these metrics do not imply causality (Dablander & Hinne, Reference Dablander and Hinne2019). Overall, network models offer substantial exploratory power by capturing direct associations between variables, complementing traditional confirmatory approaches that focus on latent constructs and predefined relationships (Borsboom, Reference Borsboom2017).
In the context of psychosis risk, network analysis is still in its early stages, with only a few studies applying it to explore PLEs. Wüsten and colleagues conducted a large-scale, cross-national study and found that certain PLEs (primarily hallucinations and persecutory thoughts) were highly central in the symptom network, suggesting that these core symptoms may drive the persistence and severity of PLEs in adults (Wüsten et al., Reference Wüsten, Schlier, Jaya, Fonseca-Pedrero, Peters, Verdoux and Woodward2018). Consistent with the cognitive model, Gawęda and colleagues used network analysis to demonstrate that trauma, cognitive biases, depression, and PLEs form a highly interconnected network, with cognitive biases and depressive symptoms acting as central nodes in a community sample of young adults (Gaweda et al., Reference Gaweda, Pionke, Hartmann, Nelson, Cechnicki and Frydecka2021). Similarly, Fonseca-Pedrero and colleagues examined adolescent PLE networks and identified auditory and visual hallucinations as central symptoms. Their study also found that depressive symptoms and bullying victimization increased overall network connectivity, while self-esteem served as a protective factor (Fonseca-Pedrero, Muniz, Gacia-Portilla, & Bobes, Reference Fonseca-Pedrero, Muniz, Gacia-Portilla and Bobes2021). Despite these advances, only two studies, to our knowledge, have applied longitudinal network analysis to psychosis research. Griffiths and colleagues examined the network structure of positive, negative, and depressive symptoms in individuals experiencing their first episode of psychosis over a 12-month period (Griffiths et al., Reference Griffiths, Leighton, Mallikarjun, Blake, Everard, Jones and Upthegrove2021). Their findings highlighted that depressive symptoms remained central in the network, with symptoms such as conceptual disorganization and hallucinations acting as bridges between symptom clusters. Another study focusing on college students found that while PLEs often co-occurred with depressive and anxiety symptoms, they remained transient for many individuals. However, depressive symptoms and adverse life events were key factors influencing the persistence of PLEs over time (Sun et al., Reference Sun, Sun, Ma, Zhong, Yang, Li, Zhou and Zhou2024). Surprisingly, no study to date has employed a longitudinal network analysis approach to investigate PLEs in adolescents. Given the clinical significance of PLE persistence and the crucial window for early intervention during adolescence (McGorry et al., Reference McGorry, Mei, Dalal, Alvarez-Jimenez, Blakemore, Browne and Killackey2024), this gap in research is notable. Compared to cross-sectional approaches, longitudinal network analyses enable the assessment of the stability of symptom relationships across time points. This is crucial for identifying which associations among PLEs persist, which fluctuate, and which may represent meaningful targets for early intervention.
The present study aims to contribute to this area by examining the structure and stability of PLEs in adolescents using network analysis. We utilize a large national cohort assessed at baseline, 12 months, and 24 months to explore the associations between cognitive, emotional, and social adversity factors and both positive and negative PLEs (Research Question 1). Additionally, we investigate how the network structure evolves over a 2-year period (Research Question 2). By adopting a longitudinal network approach, this study seeks to enhance our understanding of PLEs in adolescence in the context of risk of psychosis.
Method
Study design
The present study follows a prospective cohort design, consisting of a baseline data collection at the end of 2021 (t0) and two follow-ups (t1 = at 12 months, t2 = at 24 months). The study was approved by the local Ethics Committee of the Faculty of Psychology at the Ruhr-Universität Bochum (632/R1).
Participants
The YVORI_Pro study is a longitudinal cohort study recruiting adolescents aged between 13 and 19 years in the Ruhrgebiet area (North Rhine-Westphalia). Eligible participants were students at the cooperating schools, with sufficient proficiency in German to comprehend the research procedures and the assessment booklet. For participants under 16, parents were informed about the study and had the opportunity to opt their children out if they desired. All participants had the right to withdraw from the study at any time and for any reason. Self-reported assessments were conducted at the educational centers at baseline and at 12- and 24-month time points. There were 1,184 complete cases at baseline and 1,063 and 994 at the 12- and 24-month time points, respectively. Across all three time points, 605 participants provided complete data. This corresponds to an average attrition rate of approximately 46.2% across time points.
Measures
The Psychotic Experiences Inventory (PEI) is a novel 11-item self-report questionnaire developed by Kelleher (Reference Kelleher2024) to assess psychotic experiences, including perceptual and ideational disturbances, diminished emotional expression, and avolition. With permission from the original authors, the questionnaire was translated into German and back-translated by an independent editor. Final approval for the translated version was obtained from the original developers, who also agreed on categorizing the items into two network nodes: Positive PLEs (Items 1–9) and negative PLEs (Items 10–11). The PEI demonstrated excellent internal consistency across time points (Cronbach’s αs = .78–.91) and moderate to good test–retest reliability (rs = .52–.58). As this was the main outcome of the study and had not previously been used in a German population, its convergent validity was examined through its association with the Community Assessment of Psychic Experiences 15 (calculated at baseline only r = .69, p < .001). To assess cognitive biases, we used the 18-item version of the Davos Assessment of Cognitive Biases Scale (DACOBS; (van der Gaag et al., Reference van der Gaag, Schütz, Ten Napel, Landa, Delespaul, Bak and de Hert2013) (Gawęda et al., Reference Gawęda, Prochwicz, Krężołek, Kłosowska, Staszkiewicz and Moritz2018). Network analysis was based on three nodes in the cognitive domain: attributional biases, subjective cognitive problems, and social cognitive problems. In the present sample, the subscales of the DACOBS showed good internal consistency (Cronbach’s αs = .77–.82) and moderate to good test–retest reliability (rs = .52–.64). Construct validity of the DACOBS has been supported by its factor structure and its ability to differentiate between clinical and non-clinical groups (van der Gaag et al., Reference van der Gaag, Schütz, Ten Napel, Landa, Delespaul, Bak and de Hert2013. Depressive and anxiety symptoms were assessed using the Revised Children’s Anxiety and Depression Scale – Short Version (RCADS-25; (Chorpita, Moffitt, & Gray, Reference Chorpita, Moffitt and Gray2005). This measure contributed two nodes to the network model: depressive symptoms and anxiety symptoms, based on its subscale structure. In the present study, the RCADS demonstrated good internal consistency for both depression and anxiety subscale across time points (Cronbach’s αs = .85–.89) and moderate to good test–retest reliability (rs = .57–0.7). Construct, convergent, and discriminant validity of the RCADS have been previously supported (Chorpita et al., Reference Chorpita, Moffitt and Gray2005). The Trauma and Life Events Checklist (TALE; Carr, Hardy, & Fornells-Ambrojo, Reference Carr, Hardy and Fornells-Ambrojo2018) was employed as a brief trauma screening tool. Given that the TALE assesses the occurrence of discrete life events over specified time frames (lifetime at baseline and past year at follow-ups), test–retest reliability across study time points is not informative, as changes in scores reflect the occurrence of new events and variability in recall rather than measurement inconsistency. The TALE has demonstrated content and construct validity as well as acceptable short-term test–retest reliability in its original validation study (Carr et al., Reference Carr, Hardy and Fornells-Ambrojo2018). Interpersonal sensitivity was measured using the Interpersonal Sensitivity Subscale of the Symptom Checklist-90 (SCL-90; Derogatis & Cleary, Reference Derogatis and Cleary1977). In the present sample, the SCL-90 showed acceptable internal consistency (Cronbach’s αs = .84–.87) and acceptable test–retest reliability (TALE r = .61–.68). These last two questionnaires were treated as a single node in the network model. The score on each scale was determined by summing up all responses across items. Missing values were ignored for the summation so that a value could be assigned to each person, and no information would be lost for the subsequent network analysis. Average missingness varied from 1.76% (SD = 1.07) at baseline to 0.66% (SD = 0.43) at 24 months. More information on missingness can be found in the Supplementary Material: https://osf.io/wcg9q.
Procedure
A total of 205 secondary education centers of North Rhine-Westphalia (Germany) were initially contacted by post or email to participate in the study. Seven centers (Gymnasium and Gesamtschule ) agreed to complete a formal agreement of collaboration and allowed data collection in their centers. Most of the centers who refused to participate argued that they did not have capacity due to the COVID-19 pandemic. Students and parents were informed 2 weeks prior to each data collection period about the study by the research team with the assistance of the centers’ coordinators. On data collection dates, students were first asked to sign a consent form and were then given an assessment booklet to complete. To enable anonymity and match the data between the different time points, a single individual number code was used on the assessment booklet throughout the whole study. Each participating class had a research study member supervising and instructing the students on how to complete the assessment booklet. In most cases, the center’s educator or teacher was also present during the assessment to help with the coordination and to facilitate privacy. Students completed the assessment booklet in around 45–60 minutes.
Statistical analysis
Network analysis conceptualizes experiences and related psychosocial factors as interconnected nodes within a broader system, enabling the examination of unique associations between variables while accounting for all others. This approach identifies which nodes are most central, and therefore potentially most influential within the network, and allows assessment of whether these patterns remain stable over time. Descriptive and network analyses were calculated using R (version 4.3.2). Our analysis was largely guided by the procedure described in Griffiths et al. (Reference Griffiths, Leighton, Mallikarjun, Blake, Everard, Jones and Upthegrove2021). Cross-sectional networks were estimated via the ‘bootnet’ package using graphical LASSO with the extended Bayesian information criterion for model selection (Epskamp, Borsboom, & Fried, Reference Epskamp, Borsboom and Fried2018). Due to the non-normal nature of our data, a nonparanormal transformation via the ‘huge’ R package was used, before estimating the partial correlation networks (Zhao et al., Reference Zhao, Liu, Roeder, Lafferty and Wasserman2012). Each node represents a factor reflecting the cognitive model of psychosis, with edges showing the cross-sectional partial correlation between them. They indicate the relationship between two nodes while accounting for the influence of the other variables. Networks were visualized using the qgraph R package (Epskamp et al., Reference Epskamp, Cramer, Waldorp, Schmittmann and Borsboom2012).
The three networks were compared using the ‘NetworkComparisonTest’ R package (van Borkulo et al., Reference van Borkulo, van Bork, Boschloo, Kossakowski, Tio, Schoevers and Waldorp2023). This package contains permutation-based tests to compare the networks with regard to global structure, connectivity level, and strength of edges. Furthermore, the centrality of nodes (symptoms) was compared across the three networks.
Additionally, we estimated bootstrapped confidence intervals around the edge weights and used the correlation stability coefficient (CS-coefficient) (Epskamp et al., Reference Epskamp, Borsboom and Fried2018) to assess the stability of centrality indices.
Transparency
This study was preregistered in OSF (Rus-Calafell, Schneider, Berg, & Schaefer, Reference Rus-Calafell, Schneider, Berg and Schaefer2021). The Supplementary Material (https://osf.io/wcg9q) contains all R scripts (see also Supplementary Materials 1–3), plots from the manuscript, as well as additional information on edges, edge stability, stability of centrality indices, missing data, additional fit statistics, and the network comparison test (see also Supplementary Materials 4–11).
Results
Descriptive statistics
Full demographic characteristics of the baseline sample are depicted in Table 1. Descriptive patterns in Table 2 suggest a general reduction in distress associated with several PLE over the 2-year period, with the exception of suspicion and lack of motivation. Formal tests of change were beyond the scope of the present study.
Demographic characteristics during baseline

Table 1. Long description
The table presents demographic and baseline psychological data for 605 participants. For gender, 316 are female (52.23 percent), 277 male (45.79 percent), and 9 diverse (1.49 percent). Grade distribution is 229 in grade 8 (37.85 percent), 207 in grade 9 (34.21 percent), and 167 in grade 10 (27.60 percent). First language is German for 453 (74.63 percent), French for 4 (0.66 percent), Polish for 4 (0.66 percent), Russian for 6 (0.99 percent), Turkish for 24 (3.97 percent), and other for 48 (7.93 percent). Nationality is German for 553 (91.10 percent), other for 25 (4.13 percent), and both for 25 (4.13 percent). SES is low for 9 (1.49 percent), medium for 92 (15.21 percent), and high for 508 (83.97 percent). Mean age is 14.30 years with a standard deviation of 1.10. PLE positive mean is 4.24 (SD 5.48), PLE negative mean is 1.70 (SD 2.01), DACOBS total score mean is 47.77 (SD 18.35), RCADS depression mean is 8.27 (SD 5.71), RCADS anxiety mean is 11.10 (SD 6.81), and interpersonal sensitivity mean is 6.42 (SD 5.57). Abbreviations: SES is social economic status, PLE is psychotic-like experiences, DACOBS is Davos assessment of cognitive biases scale, RCADS is revised children’s anxiety and depression scale.
Note: SES, social economic status; PLE, psychotic-like experiences; DACOBS, Davos assessment of cognitive biases scale; RCADS, revised children’s anxiety and depression scale.
PLE endorsement (yes, with certain degree of distress) (N = 605)

Table 2. Long description
The table contains 11 rows for PEI items and four columns labeled PEI item, T0, T1, and T2. For each item, the number and percentage of participants endorsing the item at each timepoint are listed. Item 1, ‘I often feel like my imagination is playing tricks on me,’ shows 156 (25.80 percent) at T0, 112 (18.50 percent) at T1, and 121 (20.00 percent) at T2. Item 2, ‘I feel like something odd is going on, that I cannot explain,’ shows 143 (23.60 percent) at T0, 100 (16.50 percent) at T1, and 91 (15.00 percent) at T2. Item 3, ‘I often feel suspicious of other people, like they cannot be trusted,’ shows 305 (50.40 percent) at T0, 311 (51.40 percent) at T1, and 324 (53.60 percent) at T2. Item 4, ‘I sometimes feel like I’m not in control of my own thoughts,’ shows 242 (40.00 percent) at T0, 225 (37.20 percent) at T1, and 206 (34.00 percent) at T2. Item 5, ‘I sometimes feel like I have special powers,’ shows 76 (12.60 percent) at T0, 59 (9.75 percent) at T1, and 42 (6.94 percent) at T2. Item 6, ‘I sometimes feel like I’m not in control of my own body,’ shows 139 (23.00 percent) at T0, 95 (15.70 percent) at T1, and 99 (16.40 percent) at T2. Item 7, ‘I hear voices and sounds that other people cannot hear,’ shows 73 (12.10 percent) at T0, 53 (8.76 percent) at T1, and 46 (7.60 percent) at T2. Item 8, ‘Sometimes my thoughts get so loud in my head that I can hear them out loud,’ shows 202 (33.40 percent) at T0, 164 (27.10 percent) at T1, and 174 (28.80 percent) at T2. Item 9, ‘I sometimes see people or faces, even though no one’s really there,’ shows 118 (19.50 percent) at T0, 123 (20.30 percent) at T1, and 86 (14.20 percent) at T2. Item 10, ‘I feel like my emotions aren’t as strong as they used to be,’ shows 226 (37.40 percent) at T0, 277 (45.80 percent) at T1, and 271 (44.80 percent) at T2. Item 11, ‘I do not feel very motivated,’ shows 327 (54.00 percent) at T0, 359 (59.30 percent) at T1, and 362 (59.80 percent) at T2. The highest endorsement rates are for low motivation and suspiciousness, both increasing over time, while most other items show decreasing or stable rates.
Note: PEI, psychotic experiences inventory.
Table 2 summarizes PLE endorsement prevalence during the three different time points. The prevalence remained stable across the 2 years. Suspiciousness/paranoia (item 3), thought interference (item 4), emotional blunting/affective flattening (item 10), and avolition (item 11) are the most common PLE (Figure 1).
Networks of three time points. Note: AB, attributional bias; ANX, anxiety; DEP, depression; IntS, interpersonal sensitivity; POS, positive PLE; NEG, negative PLE; SCP, subjective cognitive problems; SoCP, social cognitive problems; TRA, trauma. Red edges represent negative associations and blue edges represent positive associations. Denser lines represent stronger connections. Node placement was done using the Fruchtermann–Reingold algorithm implemented in the qgraph package (Epskamp et al., Reference Epskamp, Cramer, Waldorp, Schmittmann and Borsboom2012).

Figure 1. Long description
From left to right, each panel displays a network of nine nodes labeled: In S at the top, So C P at upper left, S C P at left, A B at lower left, T R A at bottom, P O S at lower right, N E G at right, D E P at middle right, and A N X at upper right. Nodes are colored blue except P O S and N E G, which are red. Edges between nodes vary in thickness and color: blue edges represent positive associations, red edges represent negative associations, and thicker lines indicate stronger connections. In all panels, the strongest connections are between S C P and So C P, A N X and D E P, and D E P and N E G. The arrangement and density of connections change across panels, reflecting temporal variation in relationships among attributional bias, anxiety, depression, interpersonal sensitivity, positive and negative P L E, subjective cognitive problems, social cognitive problems, and trauma.
Comparison of network structures across measurement occasions
The network comparison test indicated that the baseline network did not differ from the 12-month network regarding overall structure (M = .11; p = .67) and strength (S = .09; p = .49). No differences were found regarding structure (M = .11; p = .68) and strength (S = .05; p = .75) when comparing the baseline network with the 24-month networks. Therefore, our observed network structures were stable across time.
Network accuracy and stability
The accuracy of edge weight was tested with N = 1,000 nonparametric case-drop bootstraps. Results indicated that edges in the baseline network that were roughly above .10 in edge strength displayed 95% confidence intervals comfortably above 0 (see Supplementary Material in OSF). Weaker edges should be interpreted with heightened caution (Table 3).
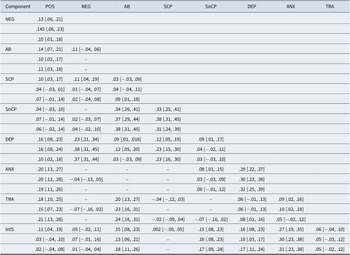
Edge values and confidence interval of the three network models

Table 3. Long description
The table contains 9 columns labeled Component, POS, NEG, AB, SCP, SoCP, DEP, ANX, and TRA. Each component (NEG, AB, SCP, SoCP, DEP, ANX, TRA, IntS) is listed as a row. For each component, edge values and bootstrapped confidence intervals are provided for each network variable at three time points: baseline (first row), 12 months (second row), and 24 months (third row). For example, for NEG as component and POS as variable, the values are 0.13 [0.06, 0.21] at baseline, 0.145 [0.06, 0.23] at 12 months, and 0.10 [0.01, 0.18] at 24 months. For AB as component and POS as variable, the values are 0.14 [0.07, 0.21] at baseline, 0.10 [0.02, 0.17] at 12 months, and 0.11 [0.03, 0.18] at 24 months. For SCP as component and POS as variable, the values are 0.10 [0.03, 0.17] at baseline, 0.04 [-0.03, 0.01] at 12 months, and 0.07 [-0.01, 0.14] at 24 months. For SoCP as component and POS as variable, the values are 0.04 [-0.03, 0.10] at baseline, 0.07 [-0.01, 0.14] at 12 months, and 0.06 [-0.02, 0.14] at 24 months. For DEP as component and POS as variable, the values are 0.16 [0.08, 0.23] at baseline, 0.16 [0.08, 0.24] at 12 months, and 0.10 [0.02, 0.18] at 24 months. For ANX as component and POS as variable, the values are 0.20 [0.13, 0.27] at baseline, 0.20 [0.12, 0.28] at 12 months, and 0.19 [0.11, 0.26] at 24 months. For TRA as component and POS as variable, the values are 0.18 [0.10, 0.25] at baseline, 0.15 [0.07, 0.23] at 12 months, and 0.21 [0.13, 0.28] at 24 months. For IntS as component and POS as variable, the values are 0.11 [0.04, 0.19] at baseline, 0.03 [-0.04, 0.10] at 12 months, and 0.02 [-0.04, 0.08] at 24 months. Similar patterns are followed for each component across all variables. Dashes indicate missing or non-significant values. The highest edge values are observed for SoCP with AB and SCP variables, and for DEP with NEG and SoCP variables, especially at 12 and 24 months. Confidence intervals are shown in brackets for each value.
Note: This table summarizes the edge values over the three time points. In every column, the first row describes the baseline value, the second row describes the 12 months follow-up, and the third row describes the 24 months follow up. Bootstrapped confidence intervals are illustrated in the brackets. Note: POS, positive PLE; NEG, negative PLE; AB, attributional bias; SCP, subjective cognitive problems; SoCP, social cognitive problems; DEP, depression; ANX, anxiety; TRA, trauma; IntS, interpersonal sensitivity.
Associations of positive and negative PLE symptoms
In the baseline network, positive PLE and negative PLE were positively associated (r partial = .13). These associations were similar in the 12-month network (r partial = .15) and the 24-month network (r partial = .10). Positive PLE generally exhibited the strongest associations with anxiety (r partial = .20/.20/.19), depression (r partial = .16/.16/.10), and trauma (r partial = .18/.15/.21). Less stable associations were found for negative PLE across networks, with some weaker nodes not reaching significance at every time point. Negative PLE was most strongly associated with depression (r partial = .28/.38/.37), which was the only other consistently connected node assigned from positive PLE and strongly fluctuating associations with subjective cognitive problems (r partial = .11/.01/.02), although these differences were not significant according to the results of the network comparison test.
Centrality
The correlation stability coefficient supported the notion of stable estimation of network strength, with a value of 0.75 for strength centrality for all networks, surpassing the recommended threshold of 0.5 for good interpretability (Epskamp et al., Reference Epskamp, Borsboom and Fried2018).
Bootstrapped difference test indicated that positive PLE occupied a significantly more central position in at baseline and at 24 months compared to negative PLE. Depression consistently exhibited the highest strength centrality across all nodes, followed by anxiety, attributional bias, social cognitive problems, interpersonal sensitivity, and positive PLE (see Figure 2). Trauma did not occupy a very central connection to the complete network despite strong connections to attributional biases and positive PLE.
Estimation of node strength centrality for the three-network model. Note that significant differences across nodes may differ depending on wave. The exact results for all bootstrapped difference tests can be accessed through Supplementary Materials 5 and 6.

Figure 2. Long description
The line graph displays strength on the x-axis from 0.50 to 1.25 and node categories on the y-axis from top to bottom: A B, A N X, D E P, I n t S, N E G, P O S, S C P, S o C P, T R A. Three colored lines represent Baseline (red), Year 1 (green), and Year 2 (blue). For A B, all lines cluster near 1.1. For A N X, values are similar across years, slightly above 1.0. D E P shows a decrease from Baseline to Year 2. I n t S and N E G show more variation, with Year 1 peaking for I n t S and Year 2 lowest for N E G. P O S, S C P, S o C P, and T R A show moderate differences, with Year 2 generally higher for S o C P and T R A. The legend at right identifies line colors by type.
Discussion
This study is the first to apply longitudinal network analysis to PLE in a large, community-based adolescent cohort. Across a 2-year follow-up, both network structure and centrality patterns were remarkably stable, despite participants being in a life phase characterized by rapid developmental and social change. Depression, anxiety, and attributional bias consistently emerged as the most central nodes. Positive PLE were most strongly and consistently associated to anxiety, while negative PLE were most strongly linked to depression. Attributional bias was closely connected to trauma and indirectly to positive PLE, suggesting a cognitive–affective pathway to paranoid ideation and perceptual experiences.
The strong and stable positive PLE and anxiety association mirrors prior findings in both adolescent and adult samples (Gaweda et al., Reference Gaweda, Pionke, Hartmann, Nelson, Cechnicki and Frydecka2021; Morales-Munoz et al., Reference Morales-Munoz, Palmer, Marwaha, Mallikarjun and Upthegrove2022) and supports the view that social anxiety and paranoid thinking may exist on a shared continuum (Freeman, Reference Freeman2016). The strong correlation between depressive and anxiety symptoms depicts the high comorbidity between these two internalizing disorders (Konac, Young, Lau, & Barker, Reference Konac, Young, Lau and Barker2021). The network also shows a strong association between negative PLE and depression, mirroring the well-established relationship between depression and negative symptoms in schizophrenia spectrum disorders, a relationship that grows stronger over time in the present study (Krynicki, Upthegrove, Deakin, & Barnes, Reference Krynicki, Upthegrove, Deakin and Barnes2018).
Something that is particularly noteworthy is the role of cognitive biases, especially attributional bias, which showed stable centrality across time. Attributional bias was strongly associated with trauma, in line with the cognitive model of psychosis (Garety et al., Reference Garety, Bebbington, Fowler, Freeman and Kuipers2007), where adverse experiences may shape maladaptive interpretations of social cues, fostering paranoia, and suspiciousness. Evidence from adolescent community samples shows that childhood adversity predicts both the onset and persistence of PLE (Kelleher et al., Reference Kelleher, Keeley, Corcoran, Ramsay, Wasserman, Carli and Cannon2013; Rimvall et al., Reference Rimvall, Wolf, Olsen, Skovgaard, Clemmensen, Oxholm and Jeppesen2021), and that trauma exposure is particularly associated with paranoia, hallucinations, and suspiciousness: the very PLE most central in our network (Morales-Munoz et al., Reference Morales-Munoz, Palmer, Marwaha, Mallikarjun and Upthegrove2022). Attributional biases appear to be one cognitive mechanism through which trauma exerts these effects: young people with a history of victimization are more likely to interpret ambiguous situations as threatening or intentional, which in turn predicts persecutory ideation and auditory hallucinations (Bentall et al., Reference Bentall, de Sousa, Varese, Wickham, Sitko, Haarmans and Read2014; Bird et al., Reference Bird, Evans, Waite, Loe and Freeman2019).
Recent network analyses in young adult cohorts have also shown that trauma, attributional bias, and positive PLE form tightly interconnected clusters, suggesting that biased social appraisals may be a critical bridge between early adversity and the emergence or maintenance of psychotic-like phenomena (Gaweda et al., Reference Gaweda, Pionke, Hartmann, Nelson, Cechnicki and Frydecka2021). Specifically, Frydecka and colleagues found that attributional bias significantly mediated the link between childhood trauma and PLE in a nonclinical sample (Frydecka et al., Reference Frydecka, Misiak, Kotowicz, Pionke, Krezolek, Cechnicki and Gaweda2020), while Gibson et al. (Reference Gibson, Reeves, Cooper, Olino and Ellman2019) demonstrated that individuals with a history of trauma were more likely to display paranoid attributional styles, which in turn predicted psychotic experiences (Gibson et al. Reference Gibson, Reeves, Cooper, Olino and Ellman2019). These findings further support the notion that attributional processes may represent a key transdiagnostic mechanism linking trauma to psychotic vulnerability. Accordingly, our findings suggest that even in a non-clinical adolescent sample, trauma-related cognitive biases are already embedded within the broader PLE-affective symptom network. The associations observed in the present network should be interpreted as exploratory, as this approach does not permit formal testing of directional or interaction effects; these may be examined in future studies using confirmatory methods (e.g. path analysis).
These findings also align with evidence from high-risk and clinical groups showing that trauma can amplify PLE via altered cognitive appraisals (Hardy, Reference Hardy2017) and support cognitive bias modification as a potential early intervention approach. In our current model, trauma was treated as a single, continuous node due to the already high number of nodes in the network. However, future research could benefit from disentangling different types or dimensions of trauma, as emerging evidence suggests that specific traumatic experiences may be differentially linked to particular psychotic symptoms, for example, childhood sexual abuse has been more consistently associated with hallucinations, while childhood emotional abuse and neglect have been linked to paranoid ideation and delusional beliefs (Hardy, Reference Hardy2017; Varese, Barkus, & Bentall, Reference Varese, Barkus and Bentall2012). In line with this, Bird et al. (Reference Bird, Evans, Waite, Loe and Freeman2019) demonstrated that adolescent paranoia is not only prevalent but also shaped by distinct cognitive and environmental mechanisms, further supporting the value of modeling trauma as a multifaceted construct within symptom networks. This more trauma-specific framework may help to clarify the unique pathways through which trauma contributes to the development and maintenance of psychotic-like phenomena (Bird et al., Reference Bird, Evans, Waite, Loe and Freeman2019).
The high centrality of depressive symptoms replicates longitudinal network studies in psychosis-risk populations (Griffiths et al., Reference Griffiths, Leighton, Mallikarjun, Blake, Everard, Jones and Upthegrove2021; Sun et al., Reference Sun, Sun, Ma, Zhong, Yang, Li, Zhou and Zhou2024), suggesting that depression may not simply co-occur with PLE but actively contribute to their persistence and exacerbation. Together with anxiety and attributional bias, these nodes appear to form a stable ‘core’ of the adolescent PLE network, indicating potential trait-like mechanisms rather than transient, developmentally bound phenomena. From a developmental perspective, these affective and cognitive factors may not only influence immediate symptom expression but forecast longer-term functional outcomes. This interpretation is consistent with recent network studies on schizotypal traits in youth. For example, Ren and colleagues (2025) showed that schizotypal traits are closely linked to both emotional processes (e.g. negative affect and emotion regulation strategies) and cognitive factors such as stress, supporting the notion of a shared underlying vulnerability structure. Longitudinal research from high-risk populations (Gregersen et al., Reference Gregersen, Møllegaard Jepsen, Rohd, Søndergaard, Brandt and Elgaard Thorup2022) and general cohorts (Rimvall et al., Reference Rimvall, Wolf, Olsen, Skovgaard, Clemmensen, Oxholm and Jeppesen2021) has shown that early PLEs are associated with later impairments in functioning, mental health, and academic performance. These findings align with the emphasis of the recent Lancet Psychiatry Commission on youth mental health (McGorry et al., Reference McGorry, Mei, Dalal, Alvarez-Jimenez, Blakemore, Browne and Killackey2024), which highlights the importance of early identification and intervention in affective disturbances as a strategy to prevent the progression of severe psychopathology. Taken together, our results support the view that depression, alongside anxiety and cognitive biases, should be regarded not merely as correlates but as key targets for intervention in both clinical and preventive youth mental health care.
Regarding the second research question, the three cross-sectional networks reveal a consistent pattern of node centrality and associations between them. This implicates the stability of the psychosocial factors’ influence over a time period of 2 years even though participants were progressing through a developmental phase characterized by a lot of changes and challenges. The stability of these network patterns suggests that interventions targeting depression, anxiety, and attributional biases could potentially yield lasting benefits in preventing PLE persistence. School-based mental health programs could integrate modules on emotional regulation, cognitive bias awareness, and psychoeducation about PLE, which may reduce stigma and normalize these experiences. Such efforts could encourage earlier help-seeking and engagement with low-intensity, non-stigmatizing supports.
Descriptive patterns suggest a reduction in distress associated with most PLE over the 2-year period. Although this change was not formally tested, it may reflect spontaneous remission or the typically transient nature of PLE in the general population (Staines et al., Reference Staines, Healy, Murphy, Byrne, Murphy, Kelleher and Cannon2023; Yamasaki et al., Reference Yamasaki, Usami, Sasaki, Koike, Ando, Kitagawa and Sasaki2018). In contrast, the relative persistence of suspicion and lack of motivation may point to more stable features associated with longer-term risk. Additionally, baseline assessments were conducted during the COVID-19 lockdown, which may have contributed to elevated initial levels of distress (Wang, Zhou, Chen, & Sun, Reference Wang, Zhou, Chen and Sun2023).
As this study is the first to apply a longitudinal network approach in a sample of non-clinical adolescents in Germany, further research and replication studies are needed to better understand PLE in this developmental period. Although network models have shown a degree of replicability, particularly in terms of overall structure, previous work suggests that specific parameters (such as centrality indices) may be more variable across samples and contexts (Borsboom et al., Reference Borsboom, Cramer and Kalis2019). The findings of this study should be interpreted in light of several limitations. First, data collection was conducted in classroom settings, often with students seated in close proximity due to spatial constraints. Although study personnel were present to oversee the assessment process, the influence of social desirability and potential underreporting of PLE cannot be entirely excluded. Secondly, with the exception of one institution, all participating schools were Gymnasien (academic-track secondary schools), which contributed to a relatively homogeneous sample with respect to socioeconomic background and low school social deprivation indices (Schraepler & Jeworutzki, Reference Schraepler and Jeworutzki2021). This may restrict the generalizability of the findings to more diverse or socioeconomically disadvantaged populations. Thirdly, the TALE checklist was employed because it is one of the few available measures specifically developed to assess trauma in the context of psychosis (Airey, Taylor, Vikram, & Berry, Reference Airey, Taylor, Vikram and Berry2023; Carr et al., Reference Carr, Hardy and Fornells-Ambrojo2018). Although the instrument has not yet been formally validated for use in German-speaking populations, the translation and cultural adaptation were conducted in close collaboration with the original scale developers, with careful consideration given to its appropriateness for use with adolescents. Fourth, it is important to note that data collection occurred during the COVID-19 pandemic, a period marked by frequent disruptions to school routines and heightened psychosocial stress. These circumstances may have affected participant retention, as well as the quality and consistency of responses. Finally, social performance difficulties were not included as part of the present model, despite their known relevance to PLE and adolescent functioning. However, our research team has explored this domain in a subsample of students from the same cohort who had already reported positive PLE, providing complementary evidence on the impact of social performance impairments in this group (Kiernan et al., Reference Kiernan, Kohl, Tas, Berg, Wolf, Nguyen and Rus-Calafell2025). It should also be noted that network analyses capture conditional associations between variables but do not permit direct causal inference. Future research could complement this approach using causal modeling frameworks such as directed acyclic graphs (DAGs), which may help clarify potential causal pathways between psychosocial risk factors and PLE. This approach would build on emerging work applying DAG-based methods to psychosis-related phenomena (Fonseca-Pedrero et al., Reference Fonseca-Pedrero, Pérez-Albéniz, Lucas-Molina, Al-Halabí and Debbané2025; Moffa et al., Reference Moffa, Catone, Kuipers, Kuipers, Freeman, Marwaha and Bebbington2017).
Despite these limitations, the methodological approach and results of this study support the conceptualization of psychosis as the outcome of a complex, dynamic interplay of factors, such as emotional dysregulation, cognitive biases, and social influences, which vary over time and between individuals. While the comparison of networks in this study allows for preliminary temporal interpretations, these remain limited. By using a longitudinal network modeling further insights can be drawn about the mechanisms underlying PLE development.
Conclusions
This study was designed to address the lack of longitudinal research on PLE in adolescents and to contribute to the understanding and prevention of distressing PLE and emerging psychotic symptoms in youth. Based on the core findings, depressive and anxiety symptoms, as well as cognitive biases (particularly attributional bias), emerge as potential key targets for prevention and intervention efforts. Recognizing these factors may help reduce barriers and stigma associated with offering early, subclinical support to adolescents experiencing PLE, especially in light of the increased awareness of youth depression and anxiety in recent years, notably during the COVID-19 pandemic. Finally, systematically educating young people about PLE and incorporating related questions into clinical practice may contribute to the normalization of these experiences and promote greater awareness.
Supplementary material
The supplementary material for this article can be found at http://doi.org/10.1017/S0033291726104486.
Acknowledgments
We would like to express our sincere gratitude to all participating schools and teachers for their generous support during the data collection process. We are especially grateful to the students who took part in the study and provided valuable feedback that enriched our work. Our thanks also go to the research assistants Fine Kullmann, Sandra Abrantes-Díaz, Max Braun Rodrigues, Pauline Kohl, Lisa Kahl, Dilara Alatas, and Maren Marzinzik for their dedication and assistance throughout the project. We would also like to extend our warm thanks to Dr. Amy Hardy (King’s College London) for her invaluable guidance and support in adapting the TALE for the purposes of this study.
Funding statement
This study was partially supported by the Sofja Kovaleskaja Award, from the Alexander von Humboldt Foundation and the Ministry of Education and Research (Germany), awarded to MRC (3.2–1210962-GBR-SKP). IK was supported by the Academy of Medical Sciences (APR8\1005) and the UK Department for Business, Energy and Industrial Strategy.
Competing interests
The authors declare none.
Ethical standard
The authors assert that all procedures contributing to this work comply with the ethical standards of the relevant national and institutional committees on human experimentation and with the Helsinki Declaration of 1975, as revised in 2008. The present study was approved by the Ethics Committee of the Faculty of Psychology, Ruhr-Universität Bochum (632R1). Furthermore, this study was preregistered on the platform Open Science Framework (Rus-Calafell et al., Reference Rus-Calafell, Schneider, Berg and Schaefer2021).


 Open access